Article

A Machine-Learning-Based Framework for Detection and Recommendation in Response to Cyberattacks in Critical Energy Infrastructures

Advanced Network Architectures Lab (CRAAX), UPC BarcelonaTech, 08800 Vilanova, Spain
*
Authors to whom correspondence should be addressed.
Electronics 2025, 14(15), 2946; https://doi.org/10.3390/electronics14152946
Submission received: 9 June 2025 / Revised: 21 July 2025 / Accepted: 22 July 2025 / Published: 24 July 2025
(This article belongs to the Special Issue Multimodal Learning and Transfer Learning)

Abstract

This paper presents an attack detection, response, and recommendation framework designed to protect the integrity and operational continuity of IoT-based critical infrastructure, specifically focusing on an energy use case. With the growing deployment of IoT-enabled smart meters in energy systems, ensuring data integrity is essential. The proposed framework monitors smart meter data in real time, identifying deviations that may indicate data tampering or device malfunctions. The system comprises two main components: an attack detection and prediction module based on machine learning (ML) models and a response and adaptation module that recommends countermeasures. The detection module employs a forecasting model using a long short-term memory (LSTM) architecture, followed by a dense layer to predict future readings. It also integrates a statistical thresholding technique based on Tukey’s fences to detect abnormal deviations. The system was evaluated on real smart meter data in a testbed environment. It achieved accurate forecasting (MAPE < 2% in most cases) and successfully flagged injected anomalies with a low false positive rate, an effective result given the lightweight, unsupervised, and real-time nature of the approach. These findings confirm the framework’s applicability in resource-constrained energy systems requiring real-time cyberattack detection and mitigation.

1. Introduction

IoT-based systems are increasingly integrated into critical infrastructures, such as energy distribution networks, to ensure continuous monitoring and enhance operational efficiency and service. In particular, smart meters play a fundamental role in enabling fine-grained control and billing processes within advanced metering infrastructure (AMI) [1]. Given the massive deployment of smart meters and their limited embedded security features, they are vulnerable to a range of attacks, such as data tampering and denial of service (DoS) attacks. Such threats not only hinder the normal functioning of the infrastructure but may also lead to erroneous decision making if false data propagates to the control layers. In this context, ensuring the integrity and authenticity of smart meter data is crucial for reliable system operation and preventing failures within the system.
Recent frameworks utilize machine learning (ML) to detect and predict attacks in critical infrastructure, enabling effective responses [2,3]. Efficiently leveraging vast amounts of data generated in critical infrastructures is crucial to enable rapid detection and response mechanisms against security threats. Deep learning (DL) models are candidates for this task because they excel at handling large datasets, extracting meaningful information from diverse data formats, and detecting both temporal relationships and complex attack patterns. This paper presents an ML-based framework for predicting, detecting, and responding to attacks in AMI systems. The framework comprises three main components: (i) a feature storage module responsible for generating the datasets for training the ML models, (ii) an attack detection and prediction module based on ML models, and (iii) a response and adaptation module that outlines potential countermeasures. In this paper, we focus on the validation of the forecasting-based detection approach, which is evaluated in an energy scenario targeting data tampering attacks. The proposed method detects anomalies by comparing actual smart meter readings with predicted values, enabling early identification of malicious manipulations at the physical layer. In conclusion, the main contributions of this article are the following:
  • The definition of a novel framework specifically designed to predict or detect cyberattacks in energy systems.
  • The design of a response and adaptation module aligned with the MITRE framework, which provides appropriate countermeasures for detected or predicted attacks.
  • The validation of the proposed solution through a forecasting-based detection approach applied to a real energy scenario.
The rest of the paper is organized as follows. Section 2 presents the related work. Section 3 introduces the proposed framework. Section 4 details its application in an energy use case scenario. Section 5 discusses the results obtained, and Section 6 concludes the paper and outlines future research directions.

2. Related Work

The advancement in technological innovation has made the energy sector more vulnerable to cyberattacks, and advanced protection strategies are needed to protect the smart grid against emerging threats. Several studies have proposed the use of AI-based approaches to enhance the security of critical infrastructures against various cyberattacks. In particular, several research efforts have focused on applying deep learning techniques for anomaly detection in smart metering systems. Khattak et al. [4] proposed a hybrid approach using gated recurrent units (GRU) and a convolutional neural network (CNN) for detecting anomalies in data collected by smart meters. The system achieved an overall accuracy of 98.5%. In [5], the author developed an intrusion detection system using recurrent neural networks (RNN) to handle cyberattacks in real-time power systems using the IEC 61850 protocol. The system was able to detect false data injection in real time. In [6], the authors developed a DL-based detection and mitigation approach for handling cyberattacks on AMI. They considered many real-time attack measurements collected from smart meters and used LSTM-based stacked autoencoders to capture the time-based dependencies in the smart meter data. The system achieved an overall detection accuracy of 98%.
Attackers can use different approaches to launch sophisticated attacks on the smart grid. In [7], the authors proposed an approach to detect attacks that can be identified at later stages of the cyber kill chain. The proposed methodology used the graph convolutional long short-term memory (GC-LSTM) and a deep convolutional network for anomaly detection. The effectiveness of the approach was validated in a software-defined networking environment. The system achieved an overall accuracy of 96% in identifying active attack locations and demonstrated improved accuracy in detecting attacks at later stages. Anomaly detection techniques have also been applied beyond smart meters, such as in phasor measurement units (PMUs). In [8], the author proposed a system that utilizes several approaches, including LSTM and CNN, and other relevant anomaly detection methods, to detect attacks targeting PMUs. They used a publicly available dataset [9] provided by the University of Texas for validation purposes. Different types of false data injection attacks were introduced in the real-time data to validate the impact and mitigation methods. In [10], the authors focused on false data injection attacks and their impact on energy systems. The simulation results show that the proposed methodologies are quite effective in handling and correcting erroneous data. The proposed approach achieved an overall accuracy of 98.90% for early detection. The system was validated for the Institute of Electrical and Electronics Engineers (IEEE) 39-bus and IEEE 118-bus systems. In [11], the authors focused on the false data injection attacks occurring on a smart grid. They utilized decision trees and multilayer perceptron (MLP) neural networks to achieve a detection accuracy of 99.97% against false data injection attacks in smart meter readings. The system achieves a minimal delay. Naveeda et al. [12] propose an IoT-enabled cyberattack detection system (IoT-E-CADS) that addresses cybersecurity in smart grids, integrating IoT and multifunctional energy meters. The system employs a bi-level machine learning approach: isolation forest is used at the first level for real-time anomaly and cyberattack detection, while a decision tree algorithm at the second level specifically identifies false data injection attacks. The system achieved a detection accuracy of 95%, demonstrating its effectiveness in securing energy data in commercial environments. Early work also helped establish the basis for both anomaly detection in time series and FDI attack modeling. Malhotra et al. [13] introduced the use of long short-term memory (LSTM) networks for detecting anomalies in time series data, laying the groundwork for subsequent deep learning approaches in this area. Likewise, Liu et al. [14] presented a study that defined the concept of false data injection (FDI) attacks in the context of power system state estimation, a model that has since been widely adopted and expanded in smart grid security research.
In the state of the art, researchers have employed various approaches to handle different attacks in the energy sector. A recent survey [15] provides a comprehensive overview of anomaly detection techniques in smart grids, with a particular focus on approaches that combine machine learning and physics-based modeling. Complementary reviews, such as [16,17], further explore cybersecurity challenges and countermeasures in smart distribution networks and broader cyber-physical systems, respectively. These surveys underscore the growing importance of ML-based anomaly detection and response frameworks in critical infrastructures. Despite these research efforts, there remains a need for systems that can be trained and validated using real-time data. The proposed methodology is designed to operate in a real-time environment, quickly detect false data injection attacks, and provide early warnings to support appropriate mitigation actions. A detailed description is provided in the next section.
Table 1 provides a summary of related works, emphasizing the specific application scenarios, types of attacks addressed, ML/DL models employed, and their reported performance metrics. A comparison is made between these existing approaches and the work proposed in this paper, which distinguishes itself through the design of an intrusion detection system tailored for low-capacity resource environments and the adoption of an ML model optimized for efficient prediction on real smart meters data.

3. Ml-Based Attack Prediction, Response, Recommendation and Adaptation Framework

This section presents the attack prediction, response recommendation, and adaptation framework, which, leveraging data analytics, minimizes the likelihood of attacks on energy infrastructure by proposing specific preventive actions and mitigation strategies. It consists of three sub-modules, as depicted in Figure 1, and provides the following functionalities.
  • Features storage: This sub-module generates the datasets used to train the machine learning models used by the attack detection sub-module.
  • Attack detection: This sub-module detects abnormal behaviors in the system, based on ML algorithms, which may trigger a red flag warning about a potential attack.
  • Attack response and adaptation: This sub-module defines the list of actions to be enforced by the framework when an attack is detected or predicted. The actions are defined in two different ways: first, a set of proactive actions is determined based on the type of predicted attack and the expected impact; second, the mitigation strategies that will be enforced when an attack is detected.

3.1. Features Storage

The features storage module is responsible for generating the datasets necessary for training the ML models used for attack detection. This module processes both network traffic and measurement data exchanged between the different components of the critical infrastructure, ensuring that the collected data are properly processed, cleaned, and structured. A key function of this module is to identify and extract the most relevant features from the raw data, which are essential for effectively training the ML models. By analyzing the system’s behavior under both normal and malicious conditions, this module selects the best features and builds the dataset. The generated dataset forms the foundation for the learning process and directly supports the subsequent anomaly detection module in identifying potential anomalies within the system.

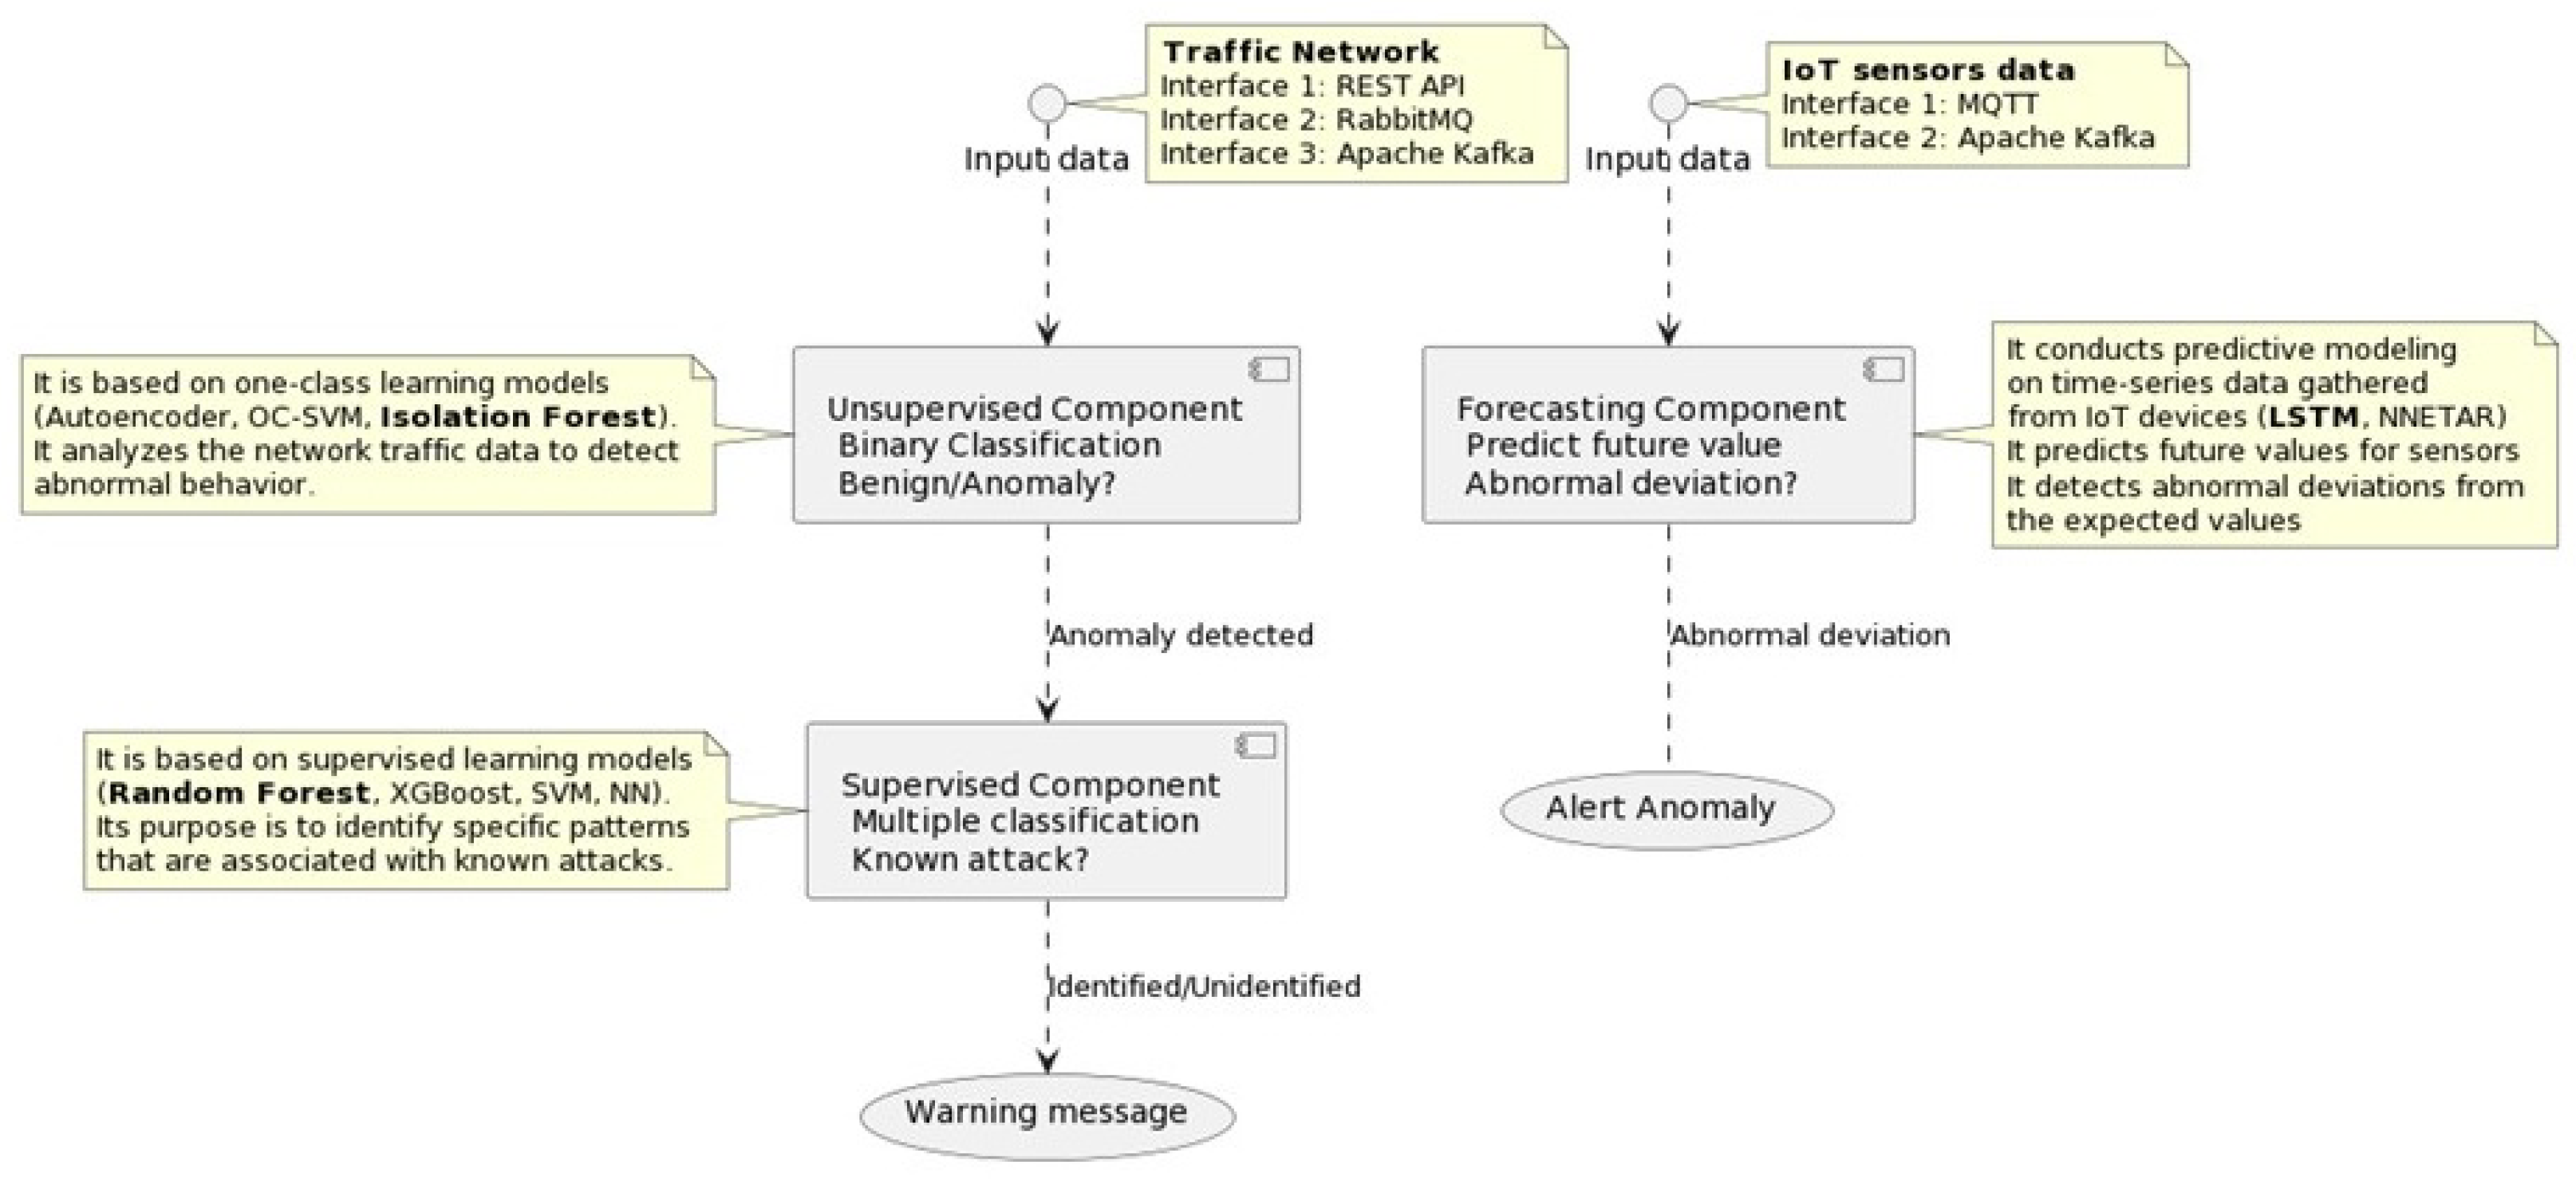
3.2. Attack Detection Component

The attack detection component is designed to identify anomalies within a system, leveraging ML models. It consists of two modules. The first module focuses on detecting attacks in network traffic, while the second module forecasts measurements from IoT devices and identifies abnormal deviations from expected values. Each time an anomaly or deviation is detected, the attack detection component generates an alert to notify of potential malicious activity. Its outputs are stored in a local database accessible through either a dashboard or an API. Figure 2 illustrates the architecture of the attack detection component. The left side represents the attack detection module, while on the right side, the forecasting module predicts IoT device measures by detecting abnormal deviations from expected values. It can receive two types of data as input:
  • Network traffic data (unsupervised component input interface): Network traffic flows that are extracted from the monitored infrastructure. This traffic can be captured typically using tcpdump or Wireshark. Afterwards, it is transmitted to the attack detection module via Apache Kafka or MQTT.
  • IoT measurements data (forecasting component input interface): Time series data that include the measurement value captured by an IoT device and the corresponding timestamp. The attack detection module can receive this time series data via Apache Kafka or MQTT.
The output of the attack detection component, for both components, is stored in a database. It stores both the input data and the corresponding output (the prediction made). These results can be accessed via an API or visualized through a dashboard.

3.3. Attack Response and Recommendation Component

The attack response and recommendation module leverages the detection and prediction achieved from the attack analysis to reason about potential violations and anomalies in the monitored assets. Based on the detected or predicted attacks, the module provides a list of recommended mitigation actions aligned with the MITRE ATT&CK framework. The module maps detected anomalies to potential attack types and provides protective measures and actionable recommendations to be implemented in the infrastructure. The goal of this module is to offer a recommended list of actions based on observed violations in the monitored infrastructure. In this paper, we focus on the false data injection (FDI) attack. The MITRE ATT&CK framework provides detailed insights into how an attack can be simulated and what recommended actions can be taken to mitigate its effects, which are summarized in Table 2. The recommendation module proposes generalized mitigation actions, but their actual implementation depends on the enforcement mechanisms available in the infrastructure. The module receives real-time detection results from the detection module, and based on the type of threat being detected, generates possible recommendations that the network administrator monitors. The actual implementation of the mitigation actions depends on the security mechanism available in the infrastructure being monitored. In the case of the energy use case, where the scenario was being tested, the actual mitigation was enforced through the pfSense firewall. These lists of actions help the network administrator mitigate the ongoing effects of the attacks and enable timely actions to prevent the cause of the malfunction. These recommendations, aligned with the MITRE ATT&CK framework [18], are used to guide the enforcement of mitigation actions.

4. Application Scenario: Energy Use Case

To evaluate the proposed detection framework in a realistic environment, we applied it to a critical energy infrastructure scenario, specifically an AMI system. This system comprised smart meters deployed in different locations, including residential households, near distribution transformers, and commercial and industrial facilities. The smart meters transmitted electricity usage data to a centralized platform known as the AMI Headend [19] a server-based software responsible for data collection, pre-processing, storage, and validation. The AMI Headend also supported on-demand meter requests. Communication occurred over 4G/5G cellular networks using the Device Language Message Specification/Companion Specification for Energy Metering (DLMS/COSEM) protocol [20], an international standard widely used in smart metering systems.
The energy use case monitored network traffic and data from smart meters within the critical energy infrastructure. The following technologies were used to capture and process data, forecast trends, and detect potential anomalies:
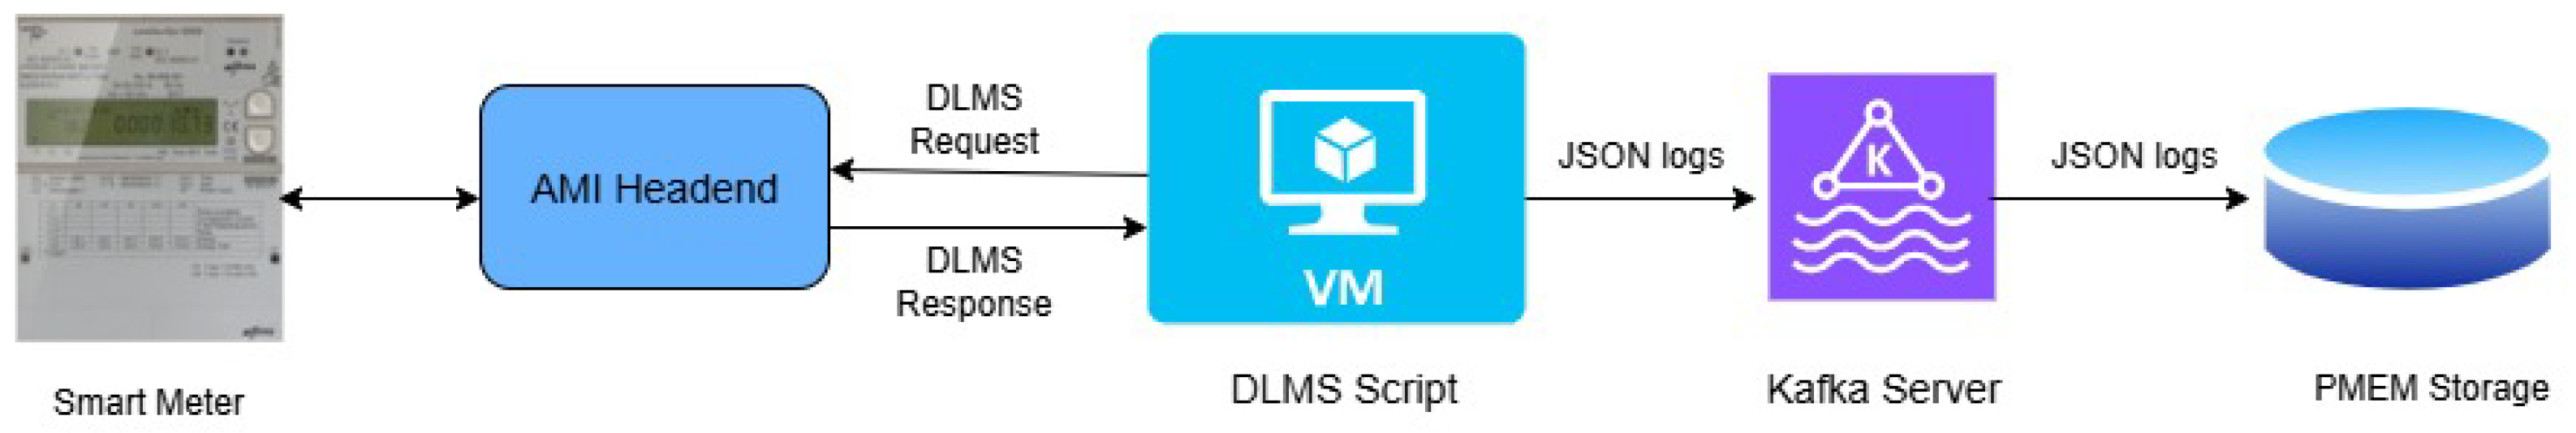
  • Python v3.10.13 scripts using the Gurux.DLMS.Python library [21] to interact with smart meters via the DLMS protocol.
  • An Apache Kafka server v3.7.2 to transmit information between relevant nodes.
  • PostgreSQL and the local file system to store information.
  • A combination of different Python libraries (TensorFlow, pandas, and others) to process them.
  • Grafana to show a local dashboard of the system state.
This setup enabled the application and assessment of the attack detection and response framework described in Section 3.

4.1. Data Collection

This communication was performed between a Python script executed in a virtual machine (VM) and the AMI Headend, which in turn accessed the specific data from the smart meters. The received DLMS messages were logged to a file and broadcast to the respective topic in the Kafka server. On the forecasting and processing end of the communication, there was a script subscribed to the topic, which received the messages and analyzed them once it received a complete measurement reading. Figure 3 illustrates the complete data collection process.

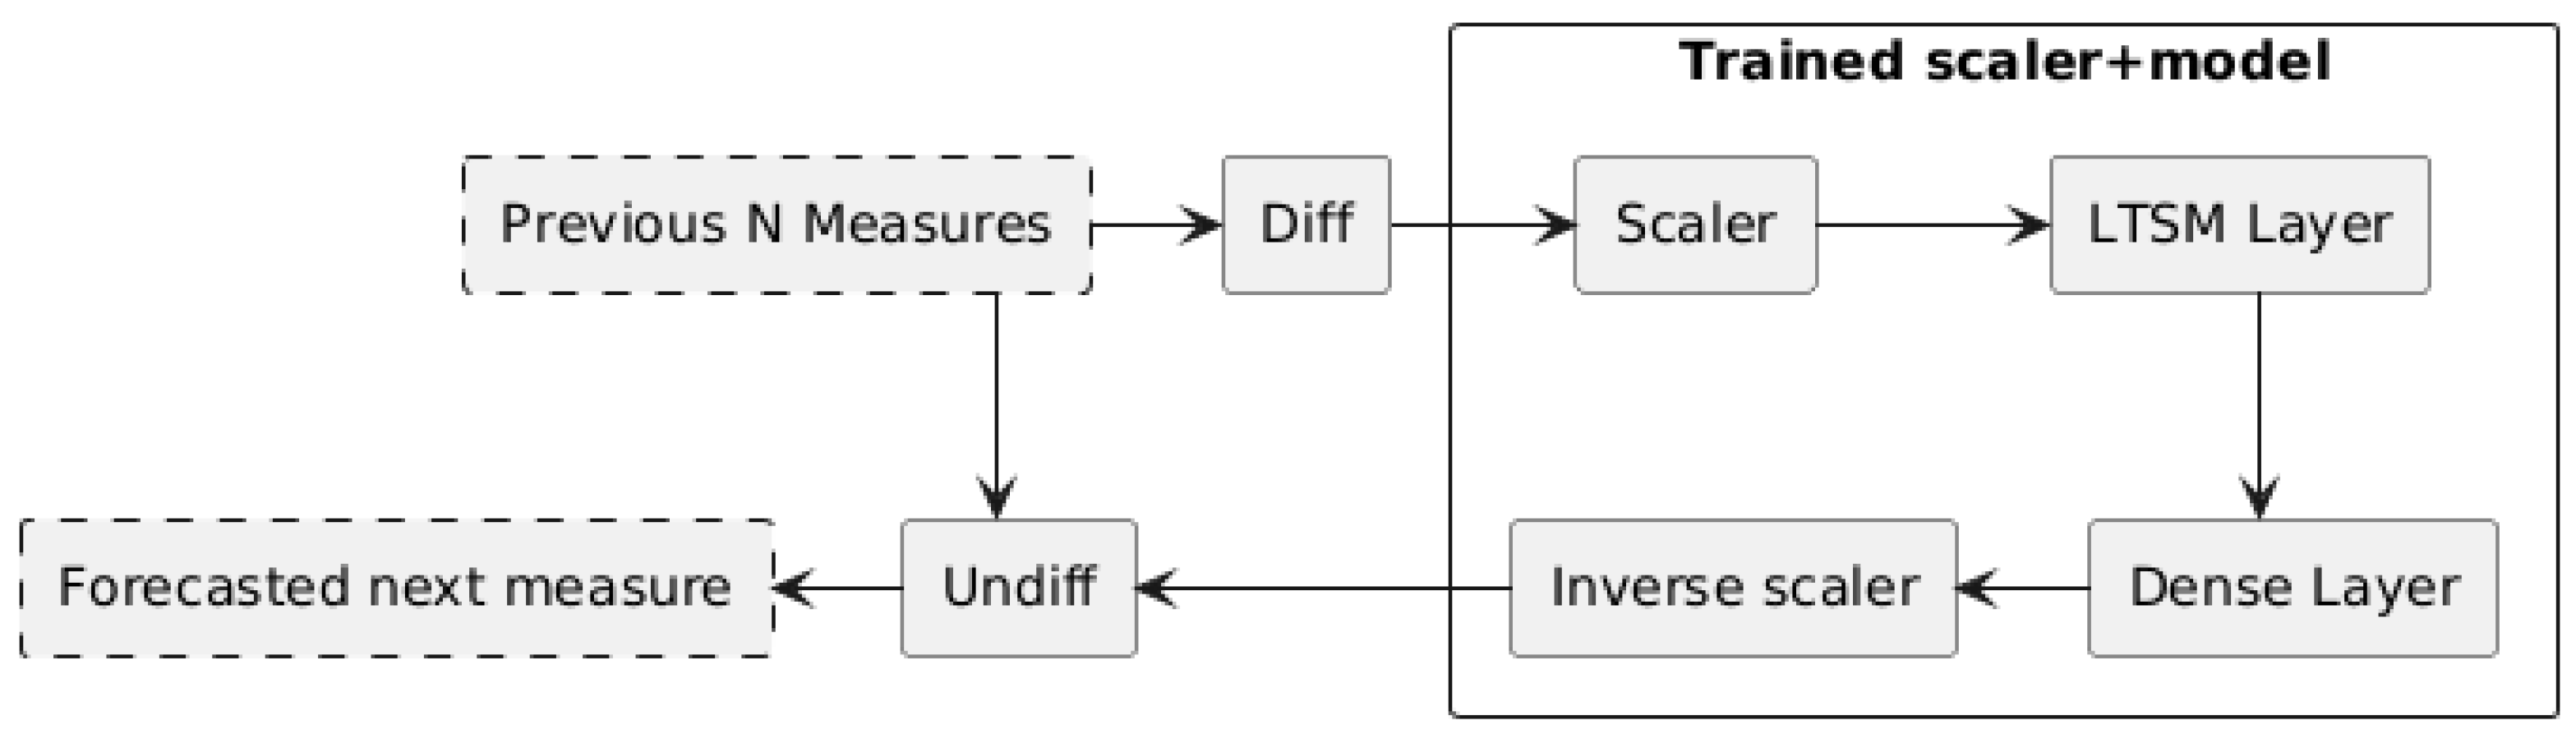
4.2. Predictive Modeling

The architecture of the prediction model used in the energy use case includes the input preprocessing stage, an LSTM layer, a dense layer, and the final prediction output, as shown in Figure 4. The process starts by collecting the previous N measurements (set to 10 in the energy scenario), which are then converted into differences from the previous value and scaled. Although the dataset consisted of a single time series, scaling was applied to improve numerical stability and model performance, particularly because LSTM layers are sensitive to the magnitude of input values. The reason for using differences was to make it easier for the models to learn basic patterns (flat, increasing) and not have issues with a fixed scaling transformation. Subsequently, these values were processed through an LSTM and a dense neuron layer without an activation layer to predict the next measurement. For the experiments, we used one unit for both the LSTM and the dense layer. This minimal configuration was chosen to minimize memory and processing requirements, given that the system is designed to run on resource-constrained devices in an energy infrastructure context. The objective was to validate whether a lightweight model could still effectively support the overall anomaly detection framework. Finally, the prediction was transformed back to the original scale to match the range of real sensor values.
Once deployed, the models for each measurement identifier were trained (or retrained) every two days, following the steps outlined in Figure 5. The process began by collecting all valid measurements for a given smart meter. Then, these samples were preprocessed, which included computing the scaler and preparing the corresponding training dataset. Next, the system attempted to retrieve an existing model; if none was available, a new untrained model was generated. Finally, the model was trained or retrained, and then stored in the file system.

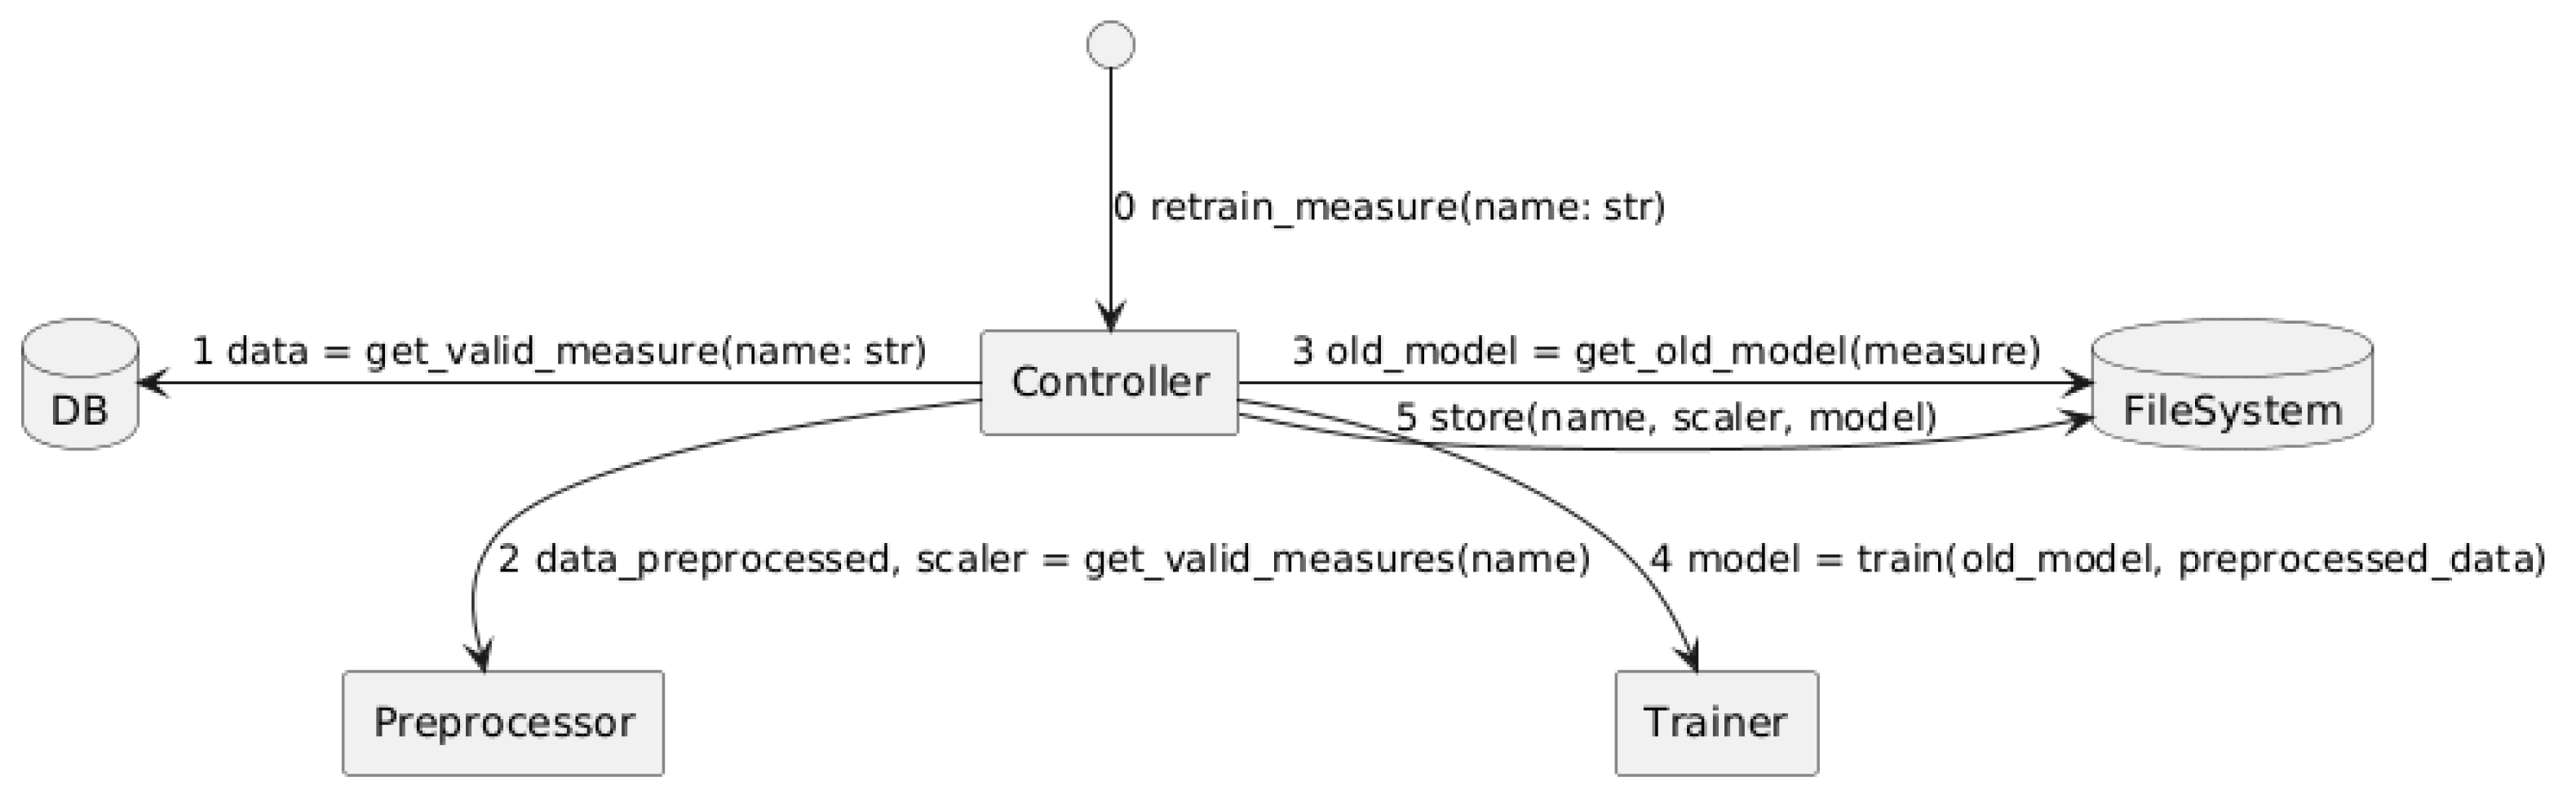
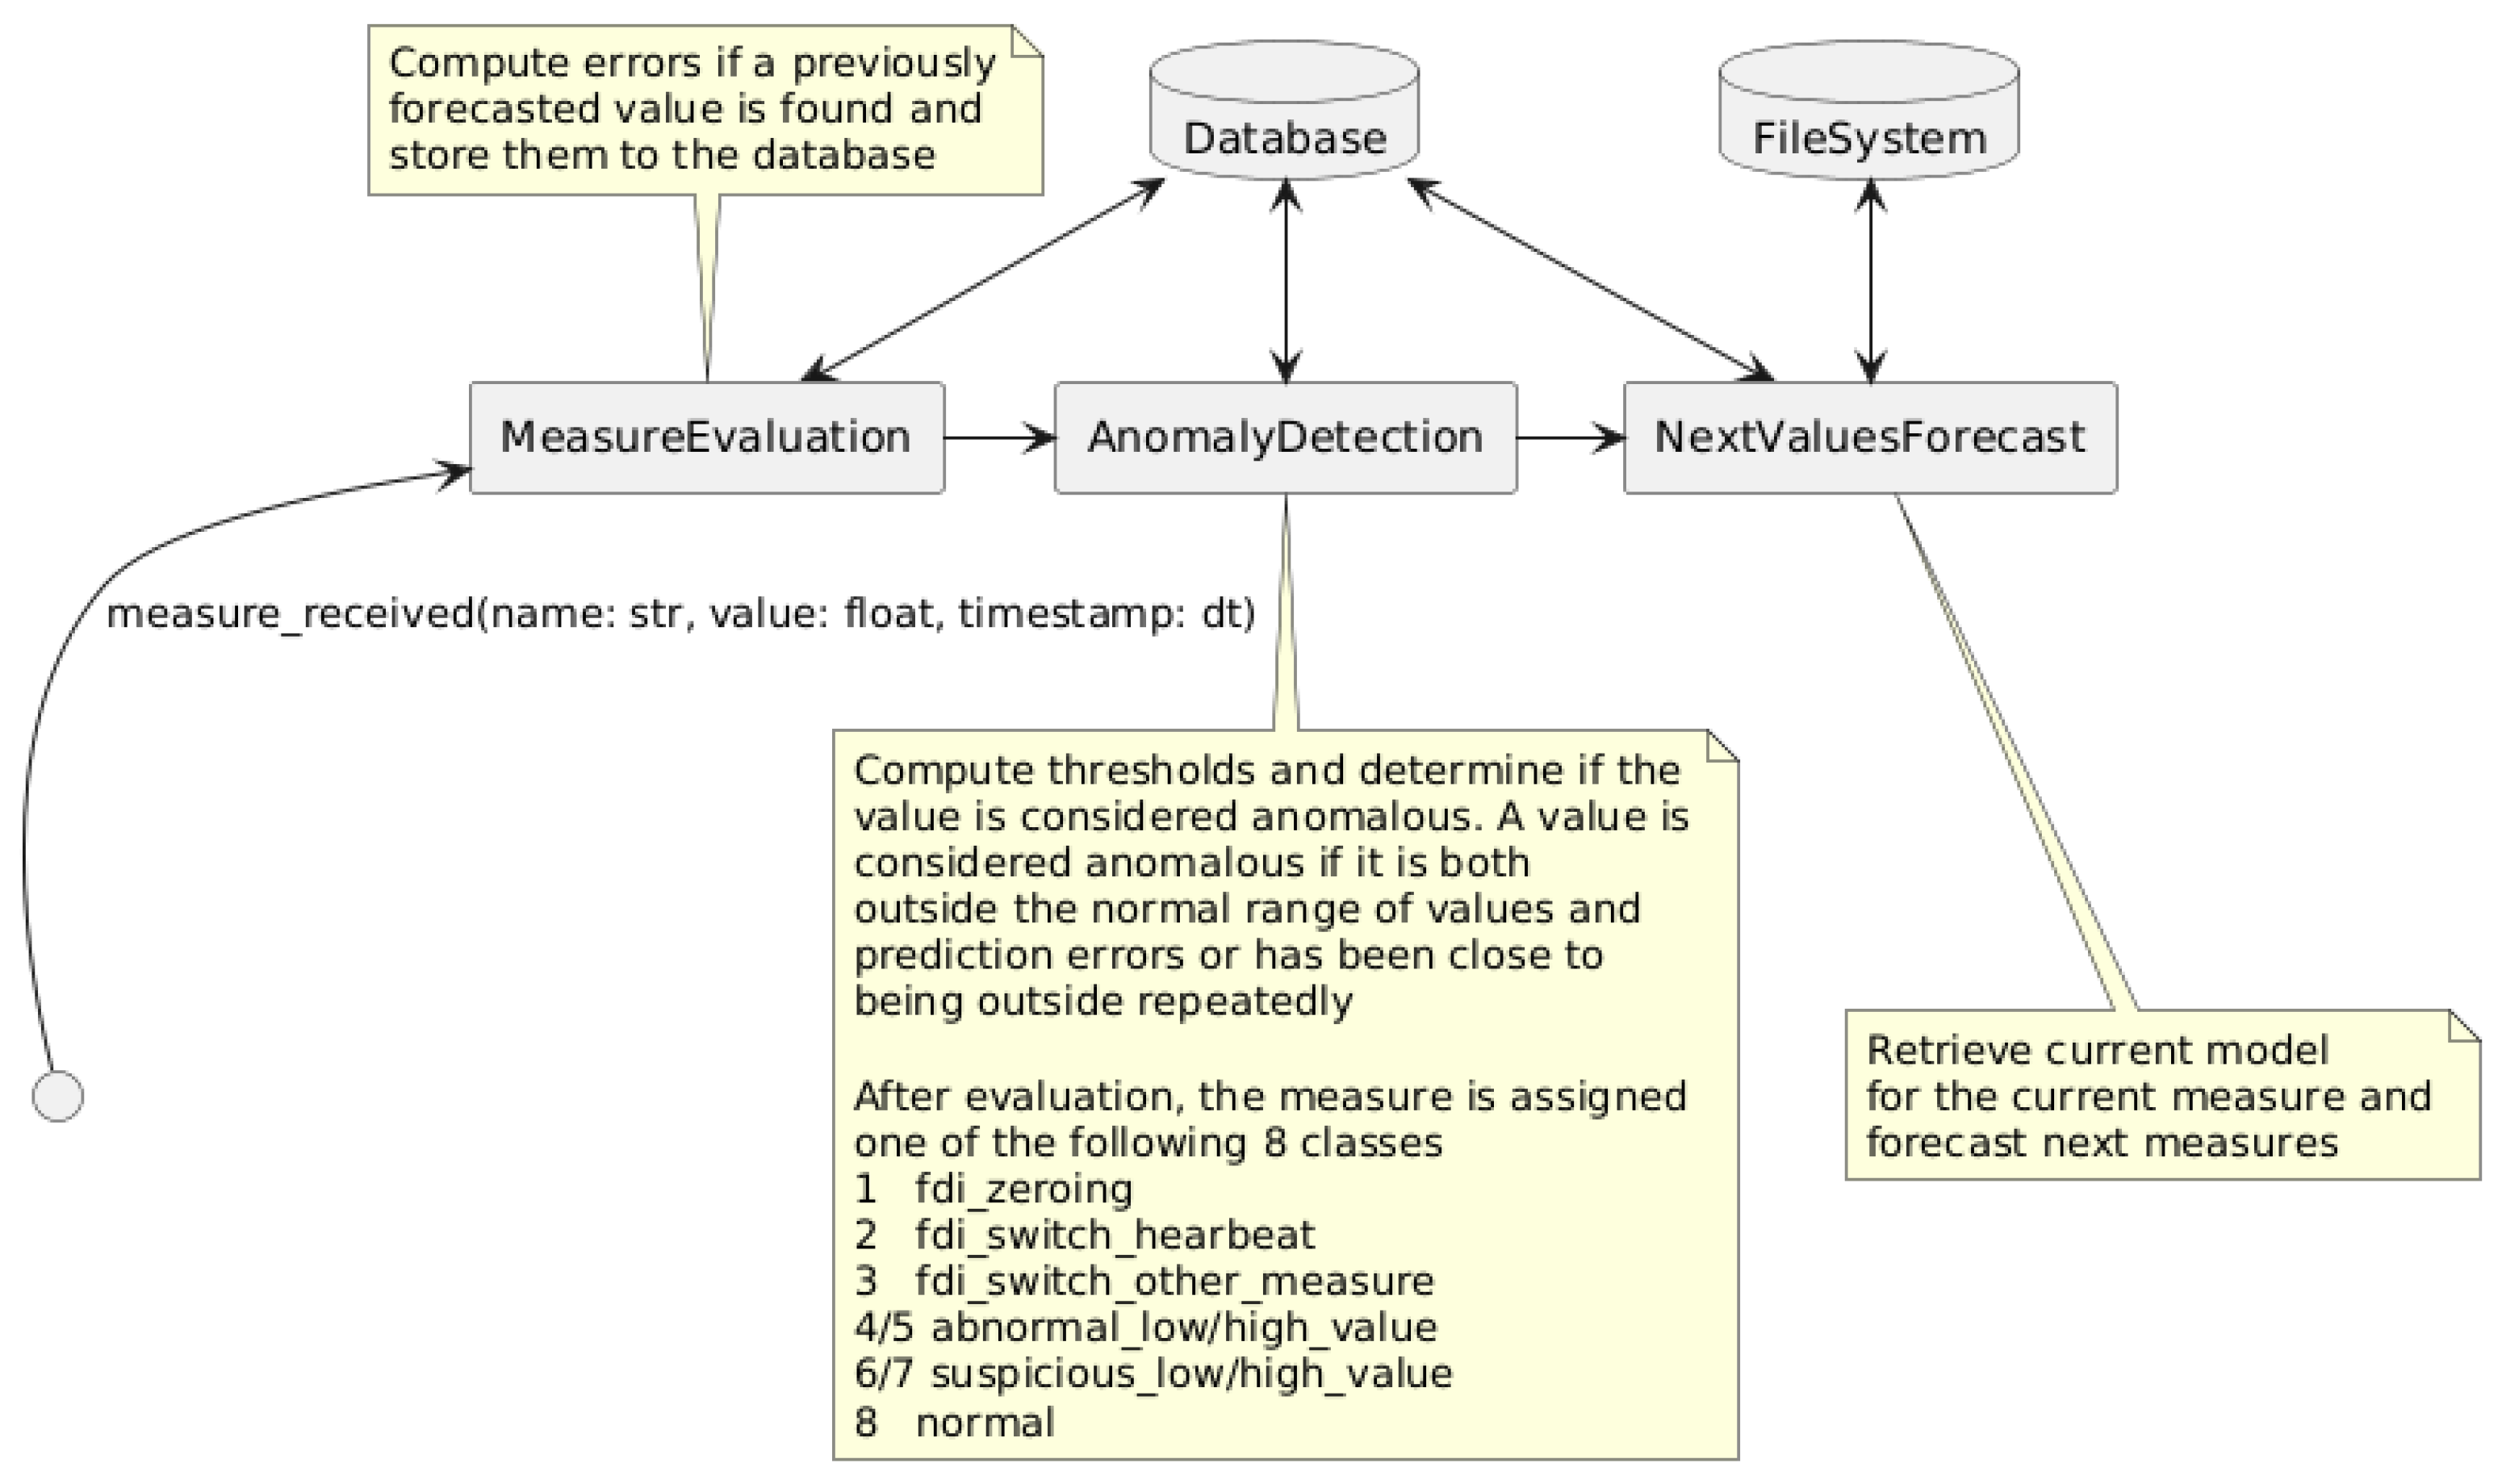
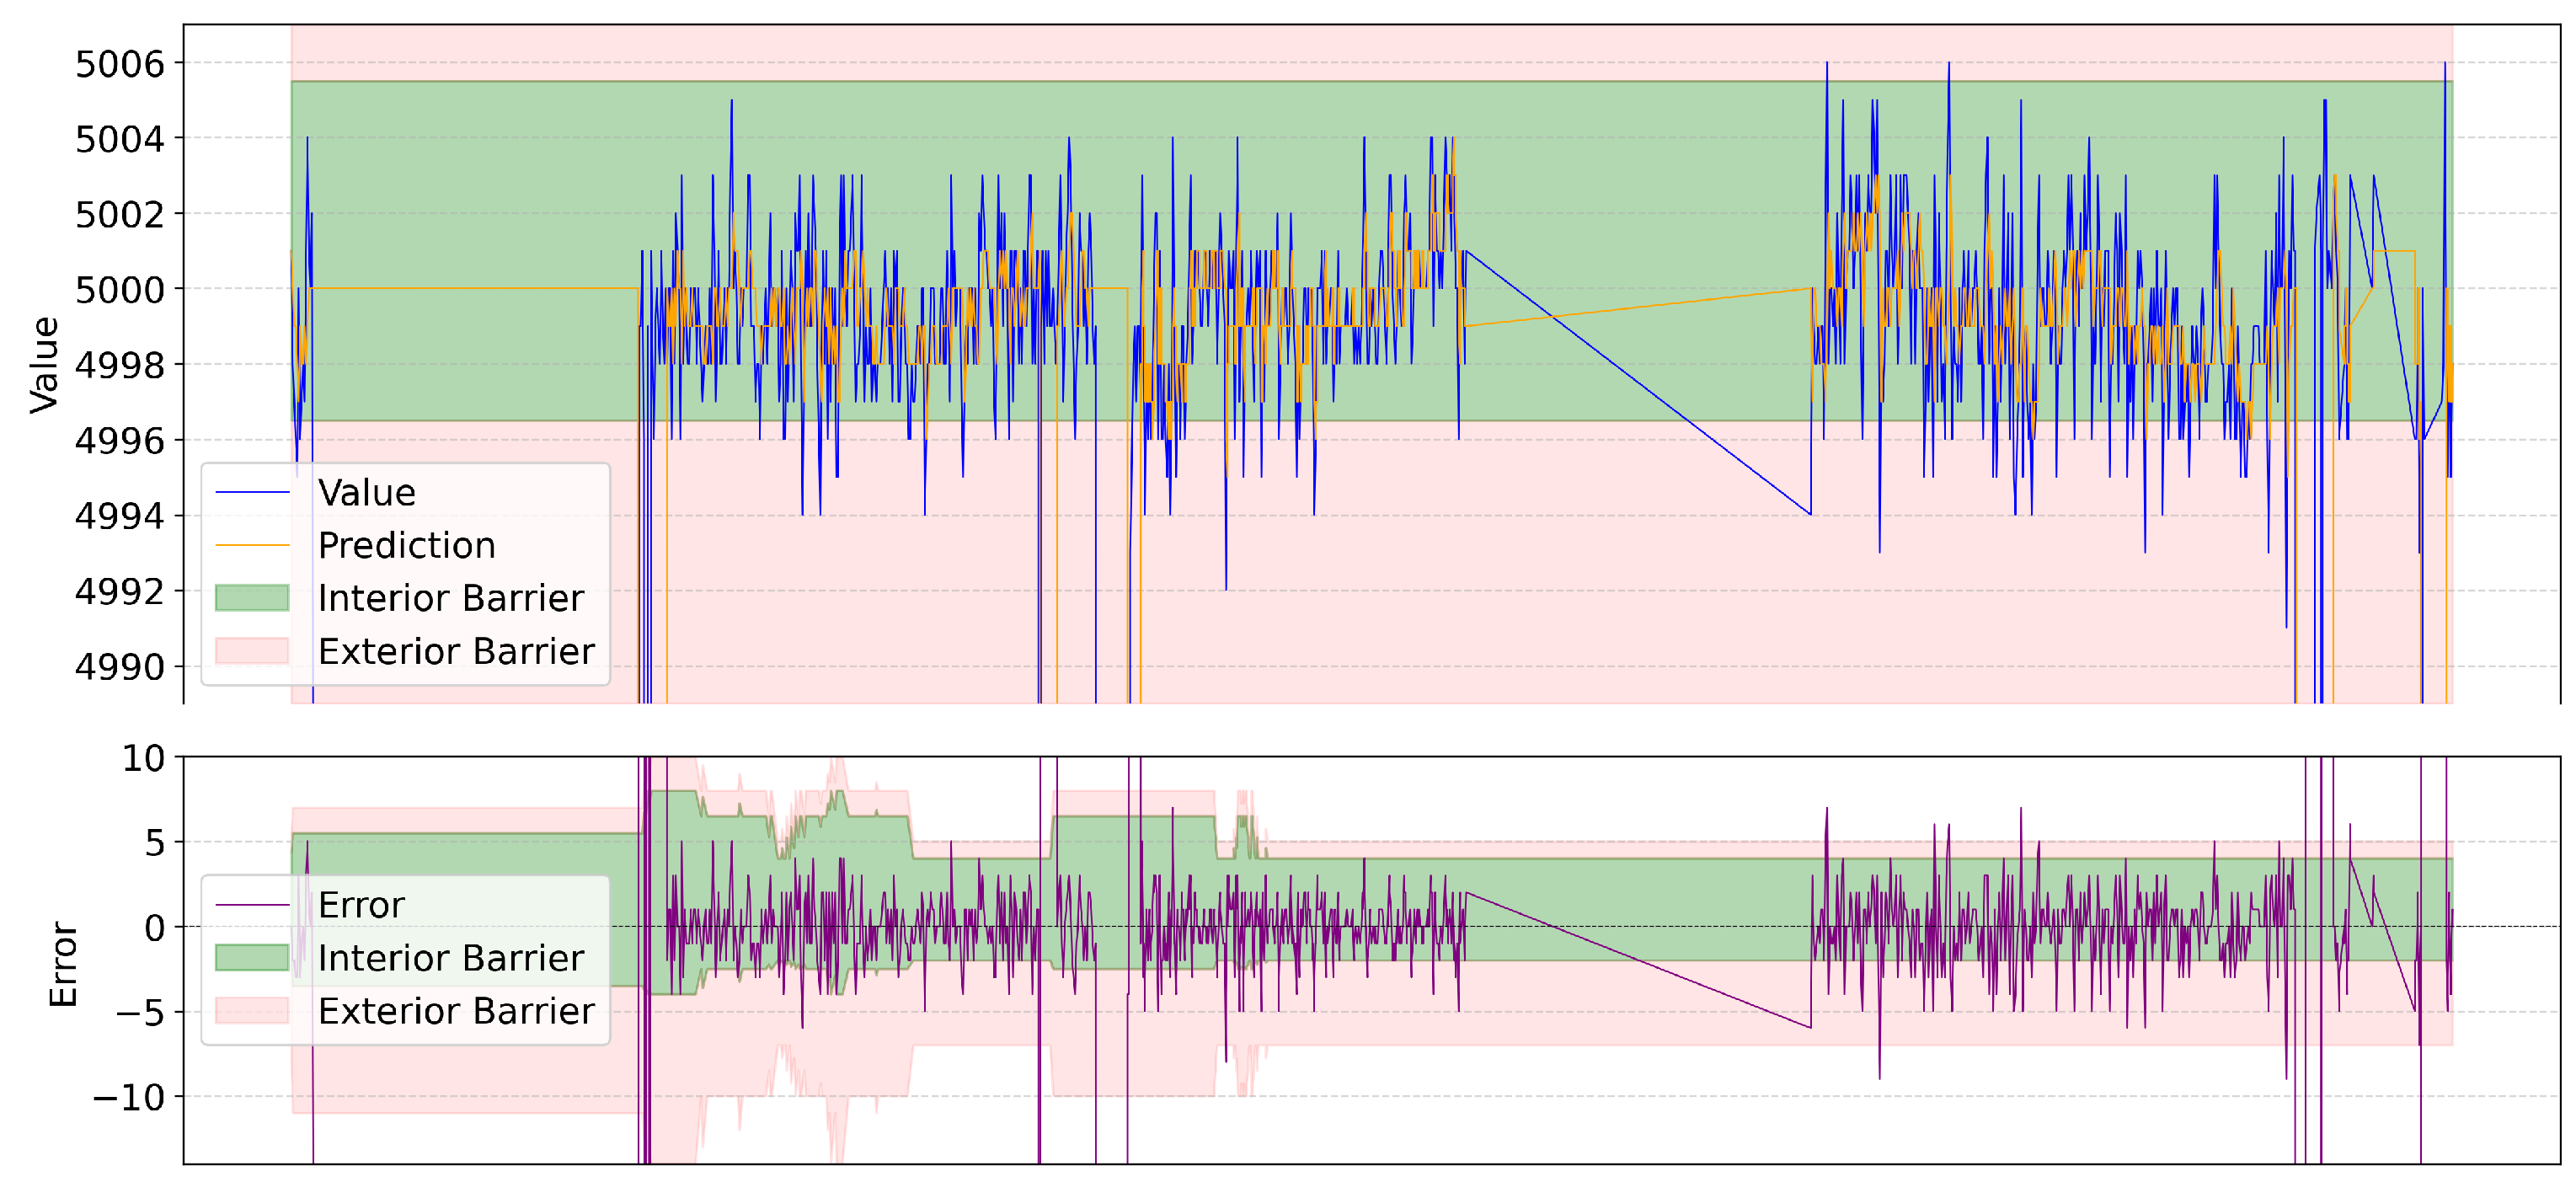
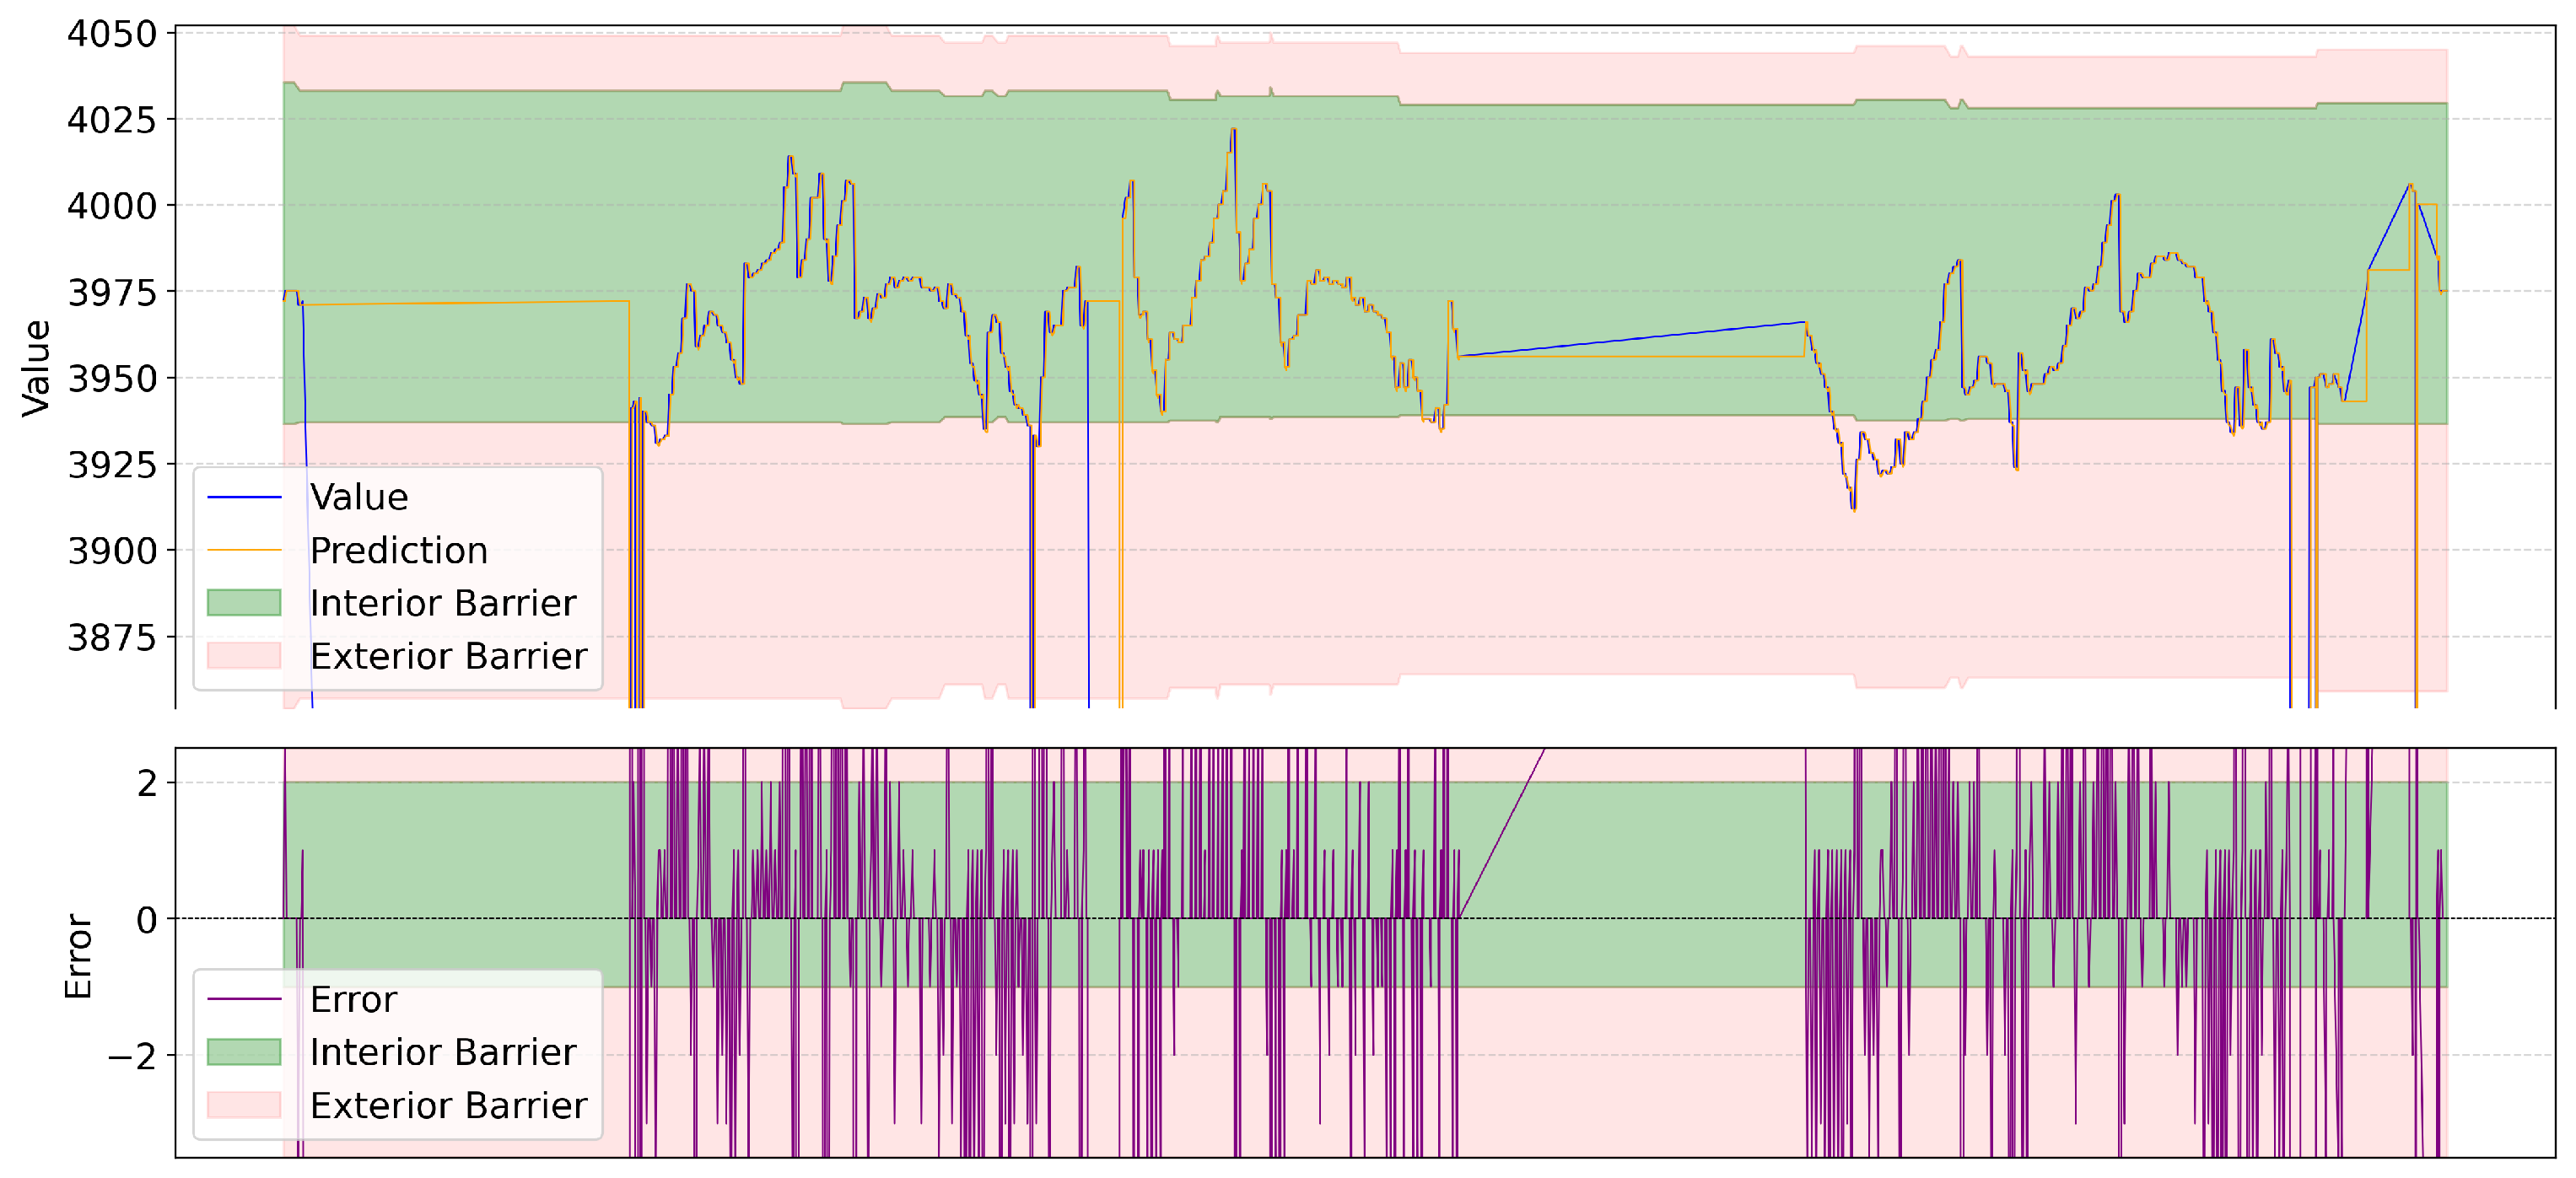
4.3. Processing and Anomaly Detection

The overall processing pipeline is illustrated in Figure 6. Each time a valid complete measurement was received, the steps in the figure were followed. If a forecasted value existed for the incoming real measurement, the prediction error was calculated, and the database was updated accordingly. Once at least 300 forecasted values with their corresponding errors were computed, anomaly detection was performed. Finally, the next N values were forecasted based on the current data.
The anomaly detection process was based on a statistical approach derived from Tukey’s fences method [22]. This involved computing threshold barriers and evaluating whether incoming values fell outside these limits. In this approach, the threshold barriers were derived from the inner and outer fences of a boxplot. A measurement was considered anomalous if both its value and its error lay beyond the outer fence (either lower or upper). Additionally, if the value remained outside the interior barriers on the same side for more than three samples, it was flagged as highly anomalous.
The rationale behind identifying if a sample was anomalous is as follows. If a sample lay beyond the typical value range but the ML model predicted it with low error, it indicated a known behavior. On the contrary, if the model failed, but the value was typical within the distribution, then the model was not adequately tuned to the usual behavior of the smart meter. However, if a value fell outside the normal range and the model failed to predict the movement, then it was an anomalous value and should be analyzed. The reason to also trigger an analysis when a value remained within the same inner or outer fences was justified by the low probability of such an occurrence in a truly random variable.
While both LSTM-based forecasting and statistical thresholding techniques, such as Tukey’s fences, have been individually explored in prior research, their combination in this work offered a lightweight and interpretable solution for real-time anomaly detection in IoT-based energy infrastructures. The LSTM model was capable of learning patterns over time with minimal computational power. At the same time, Tukey’s fences provided a simple and understandable method for detecting unusual values, and they did not require labeled data to function. This combination was especially useful in environments with limited resources, such as smart meter gateways or edge devices, where using more complex or less transparent models would not have been practical.
When further analysis of the measurement was triggered, it was first compared to known special values that certain attacks might have generated, such as 0 (indicative of a zeroing attack) and “0x0000280000FF” represented as an integer (associated with a heartbeat switch attack). If it was not a known value, the obtained measurement was compared to the statistical thresholds of the remaining available measurements to check if it would fit another known smart meter time series. If a match was found, it suggested a high likelihood of a switch attack involving another measurement. In case the specific reason for the anomaly had not been determined, it remained flagged as anomalous for manual inspection.
The features extracted from the raw smart meter data and used by the forecasting module are summarized in Table 3. These include real and forecasted values, prediction errors, and the statistical thresholds derived from Tukey’s fences. All messages retrieved from the Kafka server on the processing side were stored in local files, while the processed features were persistently stored in a PostgreSQL database indexed by timestamp and meter identifier for efficient retrieval.

4.4. Attack Response and Recommendation

The early warnings and predictions generated by the anomaly detection module were used to trigger notifications to the network administrator, enabling timely response actions. If the most recent reading was classified as normal, no action was required. If the prediction indicated an anomaly, it suggested a potential malicious event, and the corresponding alert was sent to the network administrator. If the same type of alert was repeatedly triggered within a specific interval of time, it indicated an attack. In such cases, the system recommended blocking the suspected malicious Internet Protocol (IP) address attempting to inject false data. Then, the respective alert notification was generated and transmitted to the Kafka server, where the network administrator could ingest these logs and take the respective action as presented in Table 2. The network administrator could enforce these mitigation actions in the actual infrastructure using a firewall, and other investigations could be made to figure out the root cause of the problem. The pfSense firewall rules were managed and updated using its REST API, which helped in creating and automating new firewall rules and updating existing rules. In the case of energy use, this automation was achieved through the REST API of the firewall. The proposed system sent alert messages to the Kafka topics. A Kafka consumer constantly read these messages from the Kafka topics, and based on the recommended actions, it triggered the pfSense API to block the offending IP addresses or perform the traffic filtering. The authenticity of communication was enforced by defining policies based on MAC/IP-based communications. Network allow listing was done through a list of whitelisted IP addresses. When the system detected a malicious IP address attempting to inject false data, an alert was sent to Kafka. From there, the consumer will trigger the firewall API to block that IP address, thereby minimizing the damage caused by the adversary. These early warnings and recommendations played a critical role in preventing malicious entities from causing further damage to the energy infrastructure.

5. Results and Evaluation

To evaluate the proposed framework, data from smart meters deployed in a simulated energy infrastructure were used. The primary objective was to assess the accuracy of the forecast model and its ability to identify unusual patterns that may indicate potential data integrity violations.
The forecasting component employed a long short-term memory (LSTM) architecture followed by a dense layer, trained to predict the next smart meter measurement based on the previous 10 values, with both the LSTM and the dense layer using one unit in the experiment. For each smart meter (identified by its measurement ID), the 5000 latest readings were gathered. In the data, simulated zeroing attacks and gaps were observed, wich were caused by interruptions to the test bench we had access to. We decided to keep them in the data so we could see if the data gaps and previous anomalies would affect the process. Then, they were split into a train/test dataset using a 70/30 ratio. In the training split, we discarded the values that were three standard deviations away from the mean before training.
To ensure the reliability of the forecasting models trained for each sensor, we conducted a validation-based evaluation mostly using the mean absolute percentage error (MAPE). Mean absolute error (MAE) and mean squared error (MSE) were considered, but as some of the sensors averaged around very high values and in general the order of magnitude in most cases was varied, we chose to work with a metric that made comparisons easier. In Table 4, we present all the metrics of the prediction results in the test split. It is essential to note that the split included zeroing attacks injected from the test bench, which we removed prior to computing the metrics. Additionally, we omitted from the table the results of the 20 sensors that were flat, as the model was able to perfectly predict them due to their triviality, and starred the sensors that exhibited more irregular behavior.
The anomaly detection process relied on a statistical thresholding technique based on Tukey’s fences. The lower and upper thresholds were computed using historical data from the sensor. A sample was marked as anomalous if both the value and prediction error exceeded the external thresholds. Persistent deviations beyond interior thresholds were also considered indicative of anomalous behavior. The system was able to correctly flag 162 of the 247 (65.58%) artificially injected zeroing values contained in the dataset. The 85 that were not flagged as anomalous were because they were immediately after correctly detected attacks, and the model predicted a small movement from the injected zero value. As the prediction was relatively close to the next (true anomalous) value, it was inside the error thresholds. Additionally, we had 20 false positives caused by continuous values between the internal and external thresholds. However, all of them happened close to an actual injected value or shortly after a large gap of data caused by testbench interruptions. This is, however, relatively easy to solve, as a buffer mechanism could be added to wait for a certain time after regaining connection or after an attack is identified.
Figure 7 and Figure 8 show the behavior of two of the more irregular time series. The other ones had a similar pattern or were mostly flat. We can see that the interior barriers hold most of the values; some are contained in the exterior ones, and the ones regarding the injected anomalies are outside the plot. Regarding the errors, they occur outside the exterior barrier more frequently in the second case, as the time series contains more sudden changes in value. In most cases, they are considered correctly not anomalous, as they fall within the expected range of values despite not having been predicted correctly by the model. The only case where this did not apply was the period where there was an interruption on the testbed, which generated the previously mentioned gaps in data.
Furthermore, it could classify anomalies into specific categories such as:
  • fdi_zeroing: indicative of a forced zero value injection;
  • fdi_switch_heartbeat: for the anomalous values identified as switch with heartbeat;
  • fdi_switch_other_measurement: for the anomalous values identified as switch with other measurement.
The first two classifications were validated to be always correctly identified when the anomaly was detected. This classification is relatively trivial, as the effect of the two attacks, if they reached the recorded time series, would be to have a zero or to interpret the hexadecimal string as an integer. To evaluate the system’s reaction to the latter attack type, we selected one measurement from each of the 2352 sensor time series at approximately the same time point and checked what the evaluation would be if we injected it in place of the original value of the rest of the sensors. As shown in Table 5, 94.98% of the measures that were switched were deemed abnormal. As the system checks other time series to identify if we are under the fdi_switch_other_measurement, it would get correctly identified. However, it is possible that the system cannot identify with which it has been swapped.
In addition to the error metrics already presented, it is worth noting that our system operates without predefined labels, as anomalies are detected automatically. Because of this, typical classification metrics such as precision, recall, or F1-score cannot be applied, since we do not have complete ground-truth labels for all types of attacks. We rely on a combination of numerical prediction errors and simple statistical methods to identify unusual behavior. This combination provides a practical and interpretable approach for assessing whether the system is functioning effectively. It also helps detect both sudden and gradual changes in sensor data, which is especially useful in real-world energy infrastructures, where devices can exhibit significant variations in their behavior.
In summary, the results validate the design choices made in our proposed framework. Despite the simplicity of the LSTM-based prediction model, the system achieves robust anomaly detection across a wide variety of sensors, even in the presence of noise, irregular behavior, and data gaps. Compared to state-of-the-art systems that often require more complex architectures or supervised training on attack labels, our approach offers an attractive trade-off: minimal training overhead, real-time operation, and low computational demands, making it ideal for deployment in edge environments such as smart meter gateways. The results thus validate the system’s design choices and confirm its potential for real-world applicability in energy infrastructure cybersecurity.

6. Conclusions and Future Work

This paper presents an ML-based framework for detecting attacks in an energy scenario, specifically designed to protect the integrity and operational continuity of IoT-based critical infrastructures. The focus of this work is on detecting data tampering attacks in AMI systems. To this end, the proposed framework consists of three main modules: the features storage module, which is responsible for generating the dataset with relevant data required to train the ML models; the anomaly detection module, which detects data tampering attacks by combining a forecasting component, using an LSTM architecture followed by a dense layer, to predict future smart meter measurements, and a statistical thresholding technique based on Tukey’s fences to identify measurements that significantly deviate from normal behavior; and the attack response and recommendation module, which defines appropriate mitigation strategies to be implemented in the energy infrastructure based on the detected attack. The system was evaluated using real-world smart meter data in a testbed environment. It achieved high forecasting accuracy (MAPE < 2% in most cases) and successfully identified injected anomalies, maintaining a low false-positive rate. This study demonstrates the feasibility of detecting anomalies in real time on resource-constrained IoT devices using an efficient unsupervised framework. Unlike other advanced techniques, the proposed solution does not require labeled data and operates reliably with limited computing resources. However, a current limitation is that the system is designed exclusively to detect false data injection (FDI) attacks, excluding other attack vectors such as denial-of-service (DoS) attacks, spoofing, and replay attacks. As future work, we plan to extend the proposed framework to incorporate detection and mitigation mechanisms for these other types of threats, while maintaining the philosophy of computational efficiency and scalability. We also aim to explore the automated enforcement of response actions to enhance system resilience.

Author Contributions

Conceptualization, R.R., E.S., X.M.-B. and E.R.; methodology, R.R., A.H., E.S., E.R. and X.M.-B.; software, R.R. and A.H.; validation, R.R., E.S. and A.H.; investigation, R.R., A.H., E.S., E.R. and X.M.-B.; writing—review and editing, R.R., A.H., E.S., E.R. and X.M.-B.; project administration, E.R. and X.M.-B.; funding acquisition, X.M.-B. All authors have read and agreed to the published version of the manuscript.

Funding

This work has been partially supported by the HE PHOENI2X project, funded by European Commission with Grant Number 101070586, and by the Spanish Ministry of Science and Innovation under grant PID2021-124463OB-I00, funded by MCIN/AEI/10.13039/501100011033 and by ERDF A way of making Europe, as well as by the Catalan Government under contract 2021 641 SGR 00326.

Data Availability Statement

The original contributions presented in this study are included in the article. Further inquiries can be directed to the corresponding authors.

Conflicts of Interest

The authors declare no conflicts of interest.

Abbreviations

The following abbreviations are used in this manuscript:
AMIAdvanced Metering Infrastructure
CNNConvolutional Neural Network
DLMS/COSEMDevice Language Message Specification/ Companion Specification for
Energy Metering
DLDeep learning
DoSdenial-of-service
GC-LSTMGraph Convolutional Long Short-Term Memory
GRUGated Recurrent Units
IEEEInstitute of Electrical and Electronics Engineers
FDIFalse Data Injection
IoTInternet of Things
IoT-E-CADSIoT-enabled cyberattack detection system
IPInternet Protocol
LSTMLong Short-Term Memory
MAEMean Absolute Error
MAPEMean Absolute Percentage Error
MSEMean Squared Error
MLMachine Learning
MLPMultilayer Perceptron
PMUsPhasor Measurement Units
RNNRecurrent Neural Networks
VMVirtual Machine

References

  1. Gnoni, M.G.; Bragatto, P.A.; Milazzo, M.F.; Setola, R. Integrating IoT technologies for an intelligent safety management in the process industry. Procedia Manuf. 2020, 42, 511–515. [Google Scholar] [CrossRef]
  2. Gasparin, A.; Lukovic, S.; Alippi, C. Deep learning for time series forecasting: The electric load case. CAAI Trans. Intell. Technol. 2022, 7, 1–25. [Google Scholar] [CrossRef]
  3. Chriki, F.Z.; Simó, E.; Aguiló, F.; Garcia-Milà, I.; Masip, X. A deep learning framework for safety monitoring of a railway section. In Proceedings of the IEEE International Conference on Cyber Security and Resilience (CSR), London, UK, 24 September 2024; pp. 1–6. [Google Scholar]
  4. Khattak, A.; Bukhsh, R.; Aslam, S.; Yafoz, A.; Alghushairy, O.; Alsini, R. A hybrid deep learning-based model for detection of electricity losses using big data in power systems. Sustainability 2022, 14, 13627. [Google Scholar] [CrossRef]
  5. Ağin, A.; Demirören, A.; Usta, Ö.; Örencik, B. Using Deep Learning Algorithms for Cyberattack Detection in IEC 61850-Based Power Systems. In Proceedings of the 15th National Conference on Electrical and Electronics Engineering (ELECO), Bursa, Turkiye, 30 November 2024; pp. 1–6. [Google Scholar]
  6. Acharya, A.; Bhalja, B.R. Deep Learning-Based Detection and Mitigation Strategy for Cyber-Attacks on Advanced Metering Infrastructure. In Proceedings of the IEEE International Systems Conference (SysCon), Montreal, QC, Canada, 15 April 2024; pp. 1–7. [Google Scholar]
  7. Presekal, A.; Ştefanov, A.; Rajkumar, V.S.; Palensky, P. Attack graph model for cyber-physical power systems using hybrid deep learning. IEEE Trans. Smart Grid 2023, 14, 4007–4020. [Google Scholar] [CrossRef]
  8. Regev, Y.A.; Vassdal, H.; Halden, U.; Catak, F.O.; Cali, U. Hybrid AI-Based Anomaly Detection Model Using Phasor Measurement Unit Data. In Proceedings of the IEEE 1st Global Emerging Technology Blockchain Forum: Blockchain & Beyond (iGETblockchain), Irvine, CA, USA, 3 April 2023; pp. 1–6. [Google Scholar]
  9. Allen, A.; Singh, M.; Muljadi, E.; Santoso, S. PMU Data Event Detection: A User Guide for Power Engineers; No. NREL/TP-5D00-61664; National Renewable Energy Lab. (NREL): Golden, CO, USA, 2014. [Google Scholar]
  10. Zhao, J.; An, K.; Wang, X. Research on Fast Early Warning of False Data Injection Attack in CPS of Electric Power Communication Network. J. Cyber Secur. Mobil. 2024, 1, 1331–1356. [Google Scholar] [CrossRef]
  11. Zhu, Y.; Zhang, Y.; Zhang, C.; Zhang, B.; Wang, H.; Feng, S. Detection of false data injection in electric energy metering platforms using gradient lifting decision trees and MLP neural networks. Discov. Appl. Sci. 2025, 7, 42. [Google Scholar] [CrossRef]
  12. Naveeda, K.; Fathima, S.S. Real-time implementation of IoT-enabled cyberattack detection system in advanced metering infrastructure using machine learning technique. Electr. Eng. 2025, 107, 909–928. [Google Scholar] [CrossRef]
  13. Malhotra, P.; Vig, L.; Shroff, G.; Agarwal, P. Long Short Term Memory Networks for Anomaly Detection in Time Series. In Proceedings of the 23rd European Symposium on Artificial Neural Networks (ESANN), Bruges, Belgium, 23–25 April 2015; pp. 89–94. [Google Scholar]
  14. Liu, Y.; Ning, P.; Reiter, M.K. False Data Injection Attacks Against State Estimation in Electric Power Grids. ACM Trans. Inf. Syst. Secur. 2011, 14, 1–33. [Google Scholar] [CrossRef]
  15. Gaggero, G.B.; Girdinio, P.; Marchese, M. Artificial Intelligence and Physics-Based Anomaly Detection in the Smart Grid: A Survey. IEEE Access 2025, 13, 23597–23606. [Google Scholar] [CrossRef]
  16. Achaal, B.; Adda, M.; Berger, M.; Ibrahim, H.; Awde, A. Study of smart grid cyber-security, examining architectures, communication networks, cyber-attacks, countermeasure techniques, and challenges. Cybersecurity 2024, 7, 10. [Google Scholar] [CrossRef] [PubMed]
  17. Hasan, M.K.; Abdulkadir, R.A.; Islam, S.; Gadekallu, T.R.; Safie, N. A review on machine learning techniques for secured cyber-physical systems in smart grid networks. Energy Rep. 2024, 11, 1268–1290. [Google Scholar] [CrossRef]
  18. Al-Sada, B.; Sadighian, A.; Oligeri, G. MITRE ATT&CK: State of the art and way forward. ACM Comput. Surv. 2024, 57, 1–37. [Google Scholar] [CrossRef]
  19. PHOENI2X EU Project. Available online: https://phoeni2x.eu/ (accessed on 3 June 2025).
  20. Sari, A.; Lekidis, A.; Butun, I. Industrial networks and IIoT: Now and future trends. Ind. IoT Challenges, Des. Princ. Appl. Secur. 2020, 1, 3–55. [Google Scholar]
  21. Gurux DLMS Python Library. Available online: https://github.com/Gurux/Gurux.DLMS.Python (accessed on 3 June 2025).
  22. Tukey, J.W. Exploratory Data Analysis; Addison-Wesley: Reading, MA, USA, 1977; Volume 2, pp. 131–160. [Google Scholar]
Figure 1. Attack prediction, response, recommendation, and adaptation framework.
Electronics 14 02946 g001
Figure 2. Attack detection component architectural design.
Electronics 14 02946 g002
Figure 3. Data collection on the energy testbed premises.
Electronics 14 02946 g003
Figure 4. Forecasting model architecture with preprocessing, layers, and postprocessing steps.
Electronics 14 02946 g004
Figure 5. Training process of the predictive model.
Electronics 14 02946 g005
Figure 6. Workflow for measurement evaluation, anomaly detection, and forecasting.
Electronics 14 02946 g006
Figure 7. Time series with predictions, errors, and fences of 40672.
Electronics 14 02946 g007
Figure 8. Time series with predictions, errors, and fences of 26160.
Electronics 14 02946 g008
Table 1. Summary of related works, including scenario, attack, ML/DL model, and performance.
ReferenceScenarioAttackML/DL ModelPerformance
Khattak et al. [4]
2022
Energy
Smart meters
AnomaliesGRU CNNACC = 98.5%
Abdulvehhab et al. [5]
2024
Energy
Real time
Power systems
False data
injection
RNNACC = 97.67%
Acharya et al. [6]
2024
Energy
AMI
Smart meters
DoS
Threft
Composite
LSTMACC = 98%
Presekal et al. [7]
2023
Energy
Smart meters
PMUs
DDoSGC-LSTMACC = 96%
Regev et al. [8]
2023
Energy
Smart meters
PMUs
False data
injection
Bi-LSTM
CNN
p = 98.75%
Zhao et al. [10]
2024
Energy
Smart grid
False data
injection
LSTMACC = 98.9%
Zhu et al. [11]
2025
Energy
Smart grid
False data
injection
MLPACC = 99.97%
Naaveda et al. [12]
2025
Energy
Smart grid
False data
injection
Isolation Forest
Decision Tree
ACC = 95%
This paper
2025
Energy
AMI
Smart meters
False data
injection
LSTM
Tukey’s fences
MAPE < 2%
Table 2. Attack and recommended actions mapping with MITRE framework.
Attack TypeTacticTechnique IDDescriptionRecommended Actions
False Data
Injection Attack (FDI)
ImpactT0832: Manipulation
of View
The adversary tried to
manipulate the information
reported to the operator
Enable command validation
Enforce data consistency checks
Cross-check sensor values
Evasion,
Impair Process
Control
T0859: Spoof
Reporting Message
The adversary may spoof
the messages in the control
environment for evasion and
impair the process
Filter network traffic
Communication authenticity
Network allowlist
Table 3. Features storage database for the energy use case.
FeatureDescription
Non-null measure nameIdentifies the specific smart meter that generated the sample.
Non-null timestampIdentifies the moment when the sample was obtained.
Nullable valueStores the value of the received sample or NULL if the row only contains a forecast.
Nullable predictionStores the value of the forecasted sample or NULL if the row only contains a received sample value because the ML model was not available when the prediction was attempted or there were not enough real data.
Nullable errorStores the difference between the real and forecasted value or NULL if we do not have real and predicted values.
Nullable interior lower/upper
barrier for the error
Stores the interior lower/upper barrier of the last
300 prediction errors or NULL if they are not available.
Nullable exterior lower/upper
barrier for the error
Stores the exterior lower/upper barrier of the last
300 prediction errors or NULL if they are not available.
Nullable interior lower/upper
barrier for the values
Stores the interior lower/upper barrier of the last
300 received values or NULL if they are not available.
Nullable exterior lower/upper
barrier for the values
Stores the exterior lower/upper barrier of the last
300 received values or NULL if they are not available.
Nullable abnormality indicatorStores if the sample is considered abnormal or NULL if the barriers are not available.
Nullable evaluation nameStores the evaluation text or NULL if the barriers are not available. The current evaluation names are the following:
-
normal: for the values inside the barriers.
-
abnormal_low_value: for the values below both the error and value barriers or consecutive suspicious values of the same kind without a known attack name.
-
abnormal_high_value: for the values above both the error and value barriers or consecutive suspicious values of the same kind without a known attack name.
-
suspicious_low_value: for the values between the interior and exterior inferior barriers.
-
suspicious_high_value: for the values between the interior and exterior superior barriers.
-
fdi_zeroing: for the anomalous values identified as zeroing.
-
fdi_switch_heartbeat: for the anomalous values identified as switch with heartbeat.
-
fdi_switch_other_measurement: for the anomalous values identified as switch with other measure.
Table 4. Metrics of candidate forecasting models.
SensorMAPERelative MAE (%)MAEMSEMean Value
4880.005587770.5587035.562635371.99995.632
6000.00546810.546815.440765363.8995
28801.06633 × 10−50.001068898932.151.59092 × 10108.35647 × 108
32322.92522 × 10−60.000292803619.4731.29953 × 1082.11567 × 108
67520.0001373360.014029598.81.59281 × 10106.84653 × 107
69280.0001268780.01299158930.771.6026 × 10106.87431 × 107
75843.2651 × 10−60.000326796753.0911.30425 × 1082.30446 × 108
79363.70951 × 10−60.000371307785.551.30116 × 1082.11564 × 108
96961.06881 × 10−50.001071328953.21.59099 × 10108.35714 × 108
98729.50709 × 10−60.0009527168971.821.6039 × 10109.4171 × 108
132085.426 × 10−60.0005435736947.161.58929 × 10101.27805 × 109
259680.005852850.58423623.004183,670.93937.46
261600.005848090.58369123.140884,808.13964.57
364241.88515 × 10−60.0001886152.735571762.721.45034 × 106
396640.006407890.63962125.356884,897.23964.35
399520.006422580.6411625.243783,658.33937.2
400960.006268380.6245151.86933415.68299.325
403840.008385510.8368751.90657281.01227.82
406720.01923271.9233496.1544251,5424999.34
408160.007756490.7721181.38456172.79179.32
409600.01123891.108910.1746780.77860515.7522
419680.005517720.5519375.494255370.55995.448
477280.008733290.8704820.88287156.7949101.423
480160.008457930.841910.6513225.777977.3622
481600.01896441.892041.1469232.570160.6181
484480.008350130.8302050.36831410.618844.3643
491680.007765310.7739081.39336174.762180.043
497040.008108470.8078170.95599278.5552118.343
499920.01002551.000670.89438140.47689.3778
Table 5. Switch measure categorizations.
CategoryNumber%
normal552.34
abnormal low value108145.96
abnormal high value115349.02
suspicious low value612.59
suspicious high value20.09
Disclaimer/Publisher’s Note: The statements, opinions and data contained in all publications are solely those of the individual author(s) and contributor(s) and not of MDPI and/or the editor(s). MDPI and/or the editor(s) disclaim responsibility for any injury to people or property resulting from any ideas, methods, instructions or products referred to in the content.

