1. Introduction
The rapid growth of data traffic driven by services like video streaming, cloud computing, 5G/F5G, and AI is placing increasing demands on optical networks, which constitute the fundamental backbone infrastructure of telecom and cloud operators [
1,
2].
To face these demands, it is necessary to significantly increase the bandwidth available for data transmission in single-mode optical fibers, which is currently limited by the use of the traditional C band. This band is centered at a wavelength of approximately 1 550 nm and offers a bandwidth of about 4.8 THz. A natural step in this direction is to also use its neighboring band, the L band, since this band supports the same optical amplification technology as the C band: erbium-doped optical amplifiers (EDFAs). Furthermore, combining the C and L bands (C+L band) using a super-band approach provides a total bandwidth of approximately 12 THz [
3], representing an increase of about 150% compared to using the C band alone.
The most widely used solution for providing amplification in C+L-band systems involves first connecting the incoming optical signal from the fiber to a band demultiplexer (DEMUX) to separate the two bands. The separated signals are then individually amplified using dedicated EDFAs for the C and L bands, after which a band multiplexer (MUX) recombines the two signals. This solution has two drawbacks [
4,
5]: (i) the MUX/DEMUX devices introduce insertion losses resulting in additional noise penalties that can be significant, particularly in a large network; (ii) it requires the introduction of a guard-band between the C and L bands, which leads to further capacity penalties. An alternative that avoids these drawbacks is to use a single-wideband amplifier to cover both the C and L optical bands. Importantly, it has been shown that such amplifiers are feasible, either through the use of complex design configurations [
6] or by cascading erbium-doped fiber (EDF) and bismuth-doped fiber (BDF) [
5]. In particular, the latter approach is very promising, as it offers an amplification bandwidth of about 12 THz, enabling the amplification of the Super C+ L band using a single optical amplifier.
From a network design perspective, it is crucial to clearly understand how each of the two discussed amplifier types (band-dedicated and single-wideband) affects network performance. Such analysis can be conducted using the network throughput metric.
Network throughput is an important performance metric for optical networks and is equivalent to network capacity when no traffic blocking occurs. This capacity can be defined as the maximum amount of data that the entire network can handle and that can be computed using Shannon theory, as described in [
7]. The Shannon capacity is computed assuming that signals have a Gaussian distribution [
8] and, in this manner, is considered an upper bound of the real capacity. Furthermore, the real capacity is evaluated using the real modulation schemes supported by the network.
To estimate the optical network capacity, it is necessary not only to consider physical layer aspects, including the characteristics of optical fibers, but also to take into account topological aspects, traffic demands, and routing, as well as wavelength and modulation assignment. The problem of estimating capacity in C+L networks is more challenging than in networks operating only in the C band, because, in addition to the physical impairments encountered in the C band (see [
7]), it is also necessary to account for the stimulated Raman scattering (SRS). This nonlinear effect is responsible for transferring energy from lower-wavelength channels (C band) to higher-wavelength channels (L band). Since SRS efficiency in silica-based optical fibers reaches a maximum value for channel spacings of about 13 THz, it is particularly relevant in Super C+L scenarios and must be considered in capacity evaluations [
9].
In this paper, we propose a methodology to evaluate the throughput of optical backbone networks operating in the Super C+L band, as well as the average channel capacity, assuming a uniform traffic demand pattern between all network nodes. This methodology requires detailed physical layer modeling, as the SRS effect leads to significant energy transfer between the bands. The proposed approach allows us, for the first time, to the best of our knowledge, to compare the throughput of optical networks based on either band-dedicated or single-wideband amplification, as well as to compare the throughput achieved with Gaussian and real modulation schemes.
This paper is organized as follows:
Section 2 outlines the motivations for using the C+L bands.
Section 3 describes the approach used to calculate the signal-to-noise ratio (SNR) for an optical channel considering, namely, the effects of SRS.
Section 4 discusses key aspects of network modeling, including the optical amplifier configurations, while
Section 5 details the main steps and assumptions for throughput evaluation. Afterward,
Section 6 presents the methodologies for generating synthetic data sets and discusses the computed numerical results. Finally,
Section 7 summarizes the main conclusions of the paper.
2. Drivers for C+L-Band Usage in Optical Networks
Today’s optical networks have resulted from breakthroughs in numerous areas, including low-loss optical fibers, erbium-doped fiber amplifiers (EDFAs), dense wavelength-division multiplexing (DWDM), coherent detection and advanced modulation schemes, and high-speed electronics, among others [
10]. Focusing on the former, advancements in glass processing techniques have significantly reduced the attenuation of silica glass, which is the base material used to fabricate single-mode optical fibers, from about 200 dB/km in 1966 [
11] to approximately 0.14 dB/km by 2017 [
12].
The development of optically amplified WDM is also a decisive milestone in the evolution of optical networks. WDM can significantly increase the capacity of optical transmission by simultaneously transmitting multiple optical signals, often referred to as optical channels, through a single optical fiber, with each channel utilizing its own wavelength. On the other hand, optical amplification, particularly through the use of EDFAs, allows for a significant increase in the transmission distance by compensating for the fiber and other device losses in the optical domain.
Regarding modulation schemes, there has been a shift from traditional schemes like OOK (on–off keying), where data is transmitted by varying the intensity of optical signals, to modern coherent modulation techniques such as QPSK (quadrature phase-shift keying) and M-QAM (M-ary quadrature amplitude modulation), which encode data by modulating both the amplitude and phase of the signals. These schemes offer higher spectral efficiency than OOK, which is crucial for modern optical networks. Indeed, OOK provides a spectral efficiency of less than 1 bit/s/Hz, while coherent schemes have demonstrated efficiencies of up to about 17 bit/s/Hz [
13].
In the high-speed electronics field, continuous advances in CMOS chip manufacturing have enabled increasingly higher symbol rates, with today’s state-of-the-art 5 nm and 3 nm technology permitting symbol rates from 140 to 200 Gbaud [
14]. These symbol rates translate into bit rates per optical channel ranging from 1.2 Tb/s [
14] to 1.6 Tb/s [
15] in commercial products. For comparison, standard 16 nm technology operating at 64 Gbaud can achieve bit rates of up to 600 Gbit/s [
14].
Most currently deployed WDM systems utilize the extended C band over standard single-mode fibers. This band has a bandwidth of about 4.8 THz, which, with a channel spacing of 75 GHz (a typical value for operation at 64 Gbaud), supports 64 optical channels. In order to significantly increase the number of optical channels to cope with the enormous growth in bandwidth demand, one can rely on band-division multiplexing (BDM) or space-division multiplexing (SDM). The first technique explores the utilization of other transmission bands beyond the C band, while the second technique focuses on using multiple (parallel) standard single-mode fibers (SSMFs) per link or, alternatively, advanced fibers such as multicore fibers (MCFs) and few-mode fibers (FMFs), with both solutions still operating in the C band [
16].
In scenarios where dark fiber is widely available, the best strategy to meet increasing bandwidth demands is to rely on SDM by lighting new fibers, which is equivalent to deploying additional parallel fibers. In contrast, when fiber is scarce, the optimal approach is to focus on BDM. The use of advanced fibers is not currently advisable due to their technological limitations, including transmission impairments, such as intercore crosstalk, mode mixing, and others.
The BDM strategy, also called multiband transmission, theoretically enables the exploration of the full low-loss spectrum of silica optical fibers, which includes the O, E, S, C, L, and U bands. A key prerequisite for the practical deployment of multiband transmission over medium and long distances is the availability of optical amplifiers using doped fibers for each band. Fluoride glass fibers have been used to demonstrate praseodymium-doped fiber amplification (PDFA) for the O band and thulium-doped fiber amplification (TDFA) for the S band. However, the inability to splice fluoride glass fibers with silica-based SSMFs makes their use problematic for real-world applications. A promising solution currently under investigation is the bismuth-doped fiber amplifier (BDFA), not only because it is based on silica glass fibers but also because it covers a broader spectrum, including the E- and U- bands [
5]. Nevertheless, the immaturity of enabling technologies for multiband transmission, especially optical amplifiers as discussed above, limits the practical deployment of systems across all these bands, at least in the near term. The only exception is the C and L bands, where the availability of EDFAs makes possible the practical use of the C+L solution, as demonstrated in recent trials [
17,
18] and network operator deployments [
19,
20]. Interestingly, the referenced trials were based on Super C+L-band technology, corresponding to a total bandwidth of 12 THz (6 THz+ 6 THz).
3. Optical Channel SNR Modeling
An optical channel can be seen as a communication pathway through which information is transmitted in the optical domain from a sender to a receiver, utilizing an optical fiber as the transmission medium. This channel is characterized by its carrier frequency, denoted as
(or carrier wavelength
for channel
, and occupied bandwidth, denoted as
. The minimum bandwidth that guarantees a signal transmission over the channel without inter-symbol interference is defined by the Nyquist criterion and is equal to the symbol rate (also known as the baud rate),
[
7].
In a transparent optical network, each optical channel typically travels over a set of nodes and links. An optical link represents a physical interconnection between two adjacent nodes, implemented using a pair of optical fibers (to support bidirectional traffic) and optical amplifiers, placed at discrete intervals, with each amplifier exactly compensating for the losses incurred by each fiber span. For a link of length composed of identical spans, the span length is , while the span attenuation is , where α is the fiber attenuation coefficient in dB/km.
Optical amplifiers, besides amplifying the signal, also introduce amplified spontaneous emission (ASE) noise, which contributes to the degradation of the received signal’s quality. Other sources of impairment originate in optical fibers and include, in particular, nonlinear interference (NLI) caused by the Kerr effect (see [
7]), as well as the SRS effect. Accounting for the SRS effect in analysis is not an easy task, because it involves solving a set of coupled Raman equations. This approach is computationally complex and not suitable for use in optical networking analysis, which requires closed-form expressions as simple as possible. The work of Zirngibl [
21] goes in this direction, as he demonstrated that through the approximation of the Raman gain coefficient with a triangular profile, these equations can be solved analytically. Furthermore, through the assumption of a spectrally uniform launch power, the Raman gain (or loss), i.e., the ratio between the power of the signal with SRS and without SRS, for a channel at frequency
is given by
where
is the slope of a linear regression of the normalized Raman gain spectrum (slope of the Raman gain efficiency coefficient) in
,
is the total power launched into the fiber at z = 0, that is, at the output of the optical amplifiers,
is the optical bandwidth of the WDM signal in Hz, assumed to be composed of
channels spaced by
in such a manner that
, and
is the fiber effective length given by
where
is the fiber attenuation coefficient in Np/km; i.e.,
.
It is worth noting that, despite its simplified form, the described model can lead to quite accurate results in certain scenarios. For instance, the authors of [
22] report an error of only 0.18 dB compared to numerical solutions in the case of a relatively high launch power of 28 dBm.
To gain insight into the effect of SRS, also referred to as ISRS (inter-channel SRS), on optical transmission,
Figure 1 plots the SRS gain as a function of channel frequency for different values of total optical power, after a span of 100 km, considering
and
. As can be seen, the effect of SRS increases significantly when moving from a bandwidth of 4.8 THz (C band) to 12 THz (Super C+L band), with the gain variation between the spectral edges increasing from 7.8 dB to 19.6 dB for
=28 dBm.
A commonly used metric to quantify the quality of the signal transported over the optical channel at the receiver side is the SNR. A typical assumption is that the received signal can be modeled using a Gaussian distribution, which is a reasonable approximation for transmission over dispersion-uncompensated links using coherent detection. To analyze the impact of SRS on the SNR in a simplified manner, we followed the procedure suggested in [
9], which considers that the gain of the optical amplifiers is defined not only to compensate for the fiber losses and, in the case of amplifier-dedicated configurations, MUX/DEMUX losses, but also to account for the losses or gain due to SRS. In this case, the SNR for the channel
, at frequency
, is given as
where
denotes the launched average optical power per channel,
is the power spectral density (PSD) of ASE per span, and
is the NLI coefficient per span. The PSD,
, is given by
where
is the Planck’s constant (in joule-second),
is the central band frequency,
is the noise figure (
, with
in dB), and
is the uniform gain (in Np), with
, compensating for fiber span losses, while
is the channel-dependent non-uniform gain (in Np), with
accounting for the SRS effects.
Furthermore, by assuming that WDM channels have a rectangular spectral width and a frequency spacing equal to
, which corresponds to the Nyquist limit, one arrives to the following equation for
:
where
is the fiber nonlinear coefficient in
,
is the fiber dispersion in
, and
is the channel-dependent effective span length in km, which is given as
where
is the span length and
is the effective fiber attenuation coefficient in Np/km, with
, chosen to account for the impact of SRS on the Kerr effect [
9].
A more complex yet still closed-form expression was derived in [
23] to compute
in Equation (3). The derivation is based on the Gaussian noise model approximation in the presence of inter-channel stimulated Raman scattering and accounts for the contributions of self-phase modulation and cross-phase modulation induced by the Kerr effects. Furthermore, it was shown that the referenced expression leads to highly accurate results with an average deviation of about 0.2 dB compared to the exact results.
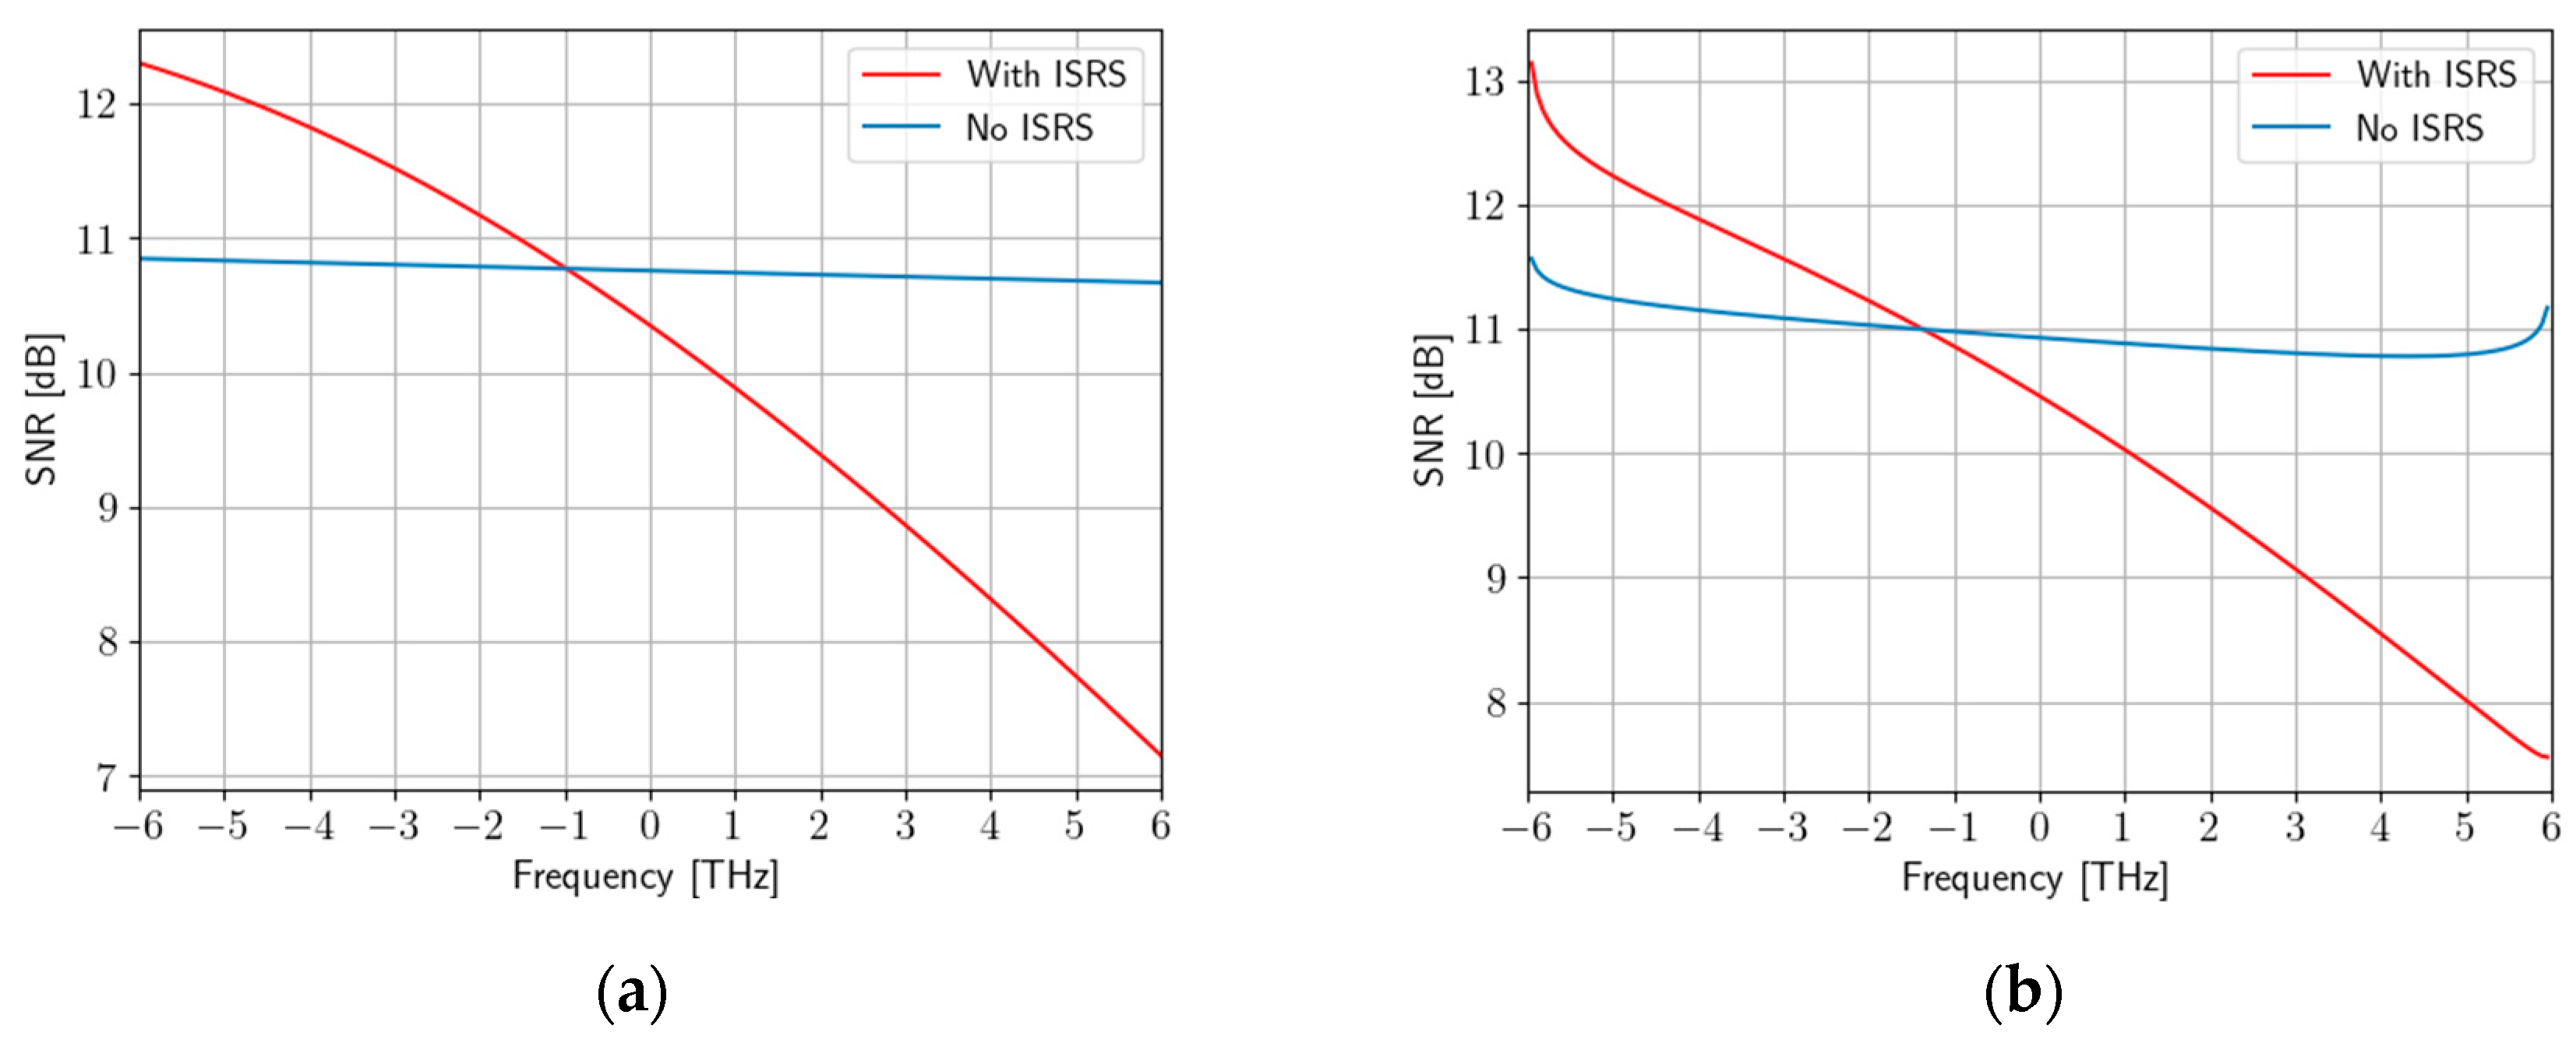
In this regard, it is meaningful to compare the results of our approach (Model 1) with those obtained using the formulation presented in Equation (5) from [
23], (Model 2). This comparison is shown in
Figure 2, using the parameters given in
Table 1 and a propagation over 30 spans. As shown, when SRS is not accounted for, the SNR is almost constant across the entire spectrum. This situation changes significantly in the presence of SRS, due to its dependency on the value of channel frequency. Another conclusion one can draw from the figure is that Model 1 underestimates the SNR, with an error that is generally smaller than 0.5 dB, except for the outer channels, where it can reach 1 dB, which is the result of using a much simpler formulation. Although the later SNR calculations are based on Model 2, Model 1 was described to provide readers with insight into the impact of different physical phenomena.
4. Network Modeling
In our analysis, we assume that the optical backbone networks are transparent, meaning that optical signals are transmitted from the source to the destination without conversion to electrical signals, maintaining their optical nature throughout the entire network. Therefore, in these networks, all node functionalities (such as amplification, multiplexing, switching, etc.) take place in the optical domain, and the node structure is based on reconfigurable optical add–drop multiplexers (ROADMs). The ROADM is responsible not only for locally adding and dropping optical channels, but also for performing optical bypassing by switching them from the incoming to the outgoing optical links. An optical link represents a physical interconnection between two nodes and is implemented using a pair of optical fibers and in-line optical amplifiers adequately spaced to compensate for the fiber losses, as previously mentioned. Each optical fiber supports WDM signals, meaning that it carries a specific number of wavelength channels, with each channel being characterized by its own wavelength. The number of wavelength channels per link, denoted as , is determined by the channel frequency spacing , which in this work is assumed be equal to the baud rate , and the bandwidth of the optical amplifier, which for the extended C band is equal to 4.8 THz and for the Super C+ L band (this work) is equal to 12 THz.
The traditional implementation of in-line optical amplification in C+L-band networks requires the use of DEMUX and MUX devices to separate and recombine the two bands, respectively, along with two parallel EDFAs, with one dedicated to the C band and the other to the L band (band-dedicated EFDA configuration, or Configuration 1), as shown in
Figure 3. This figure also shows an additional block to compensate for the extra losses or gains caused by the SRS effect, to guarantee that all optical channels have identical power at the output of the amplification stage. A drawback of this configuration is that MUX/DEMUX devices introduce insertion losses, resulting in additional noise penalties that can be significant, particularly in large networks. In addition, it requires the introduction of a guard-band between the C and L bands, which leads to further capacity penalties.
A more efficient solution that avoids these drawbacks is to use a single-wideband amplifier to cover both the C and L bands (single-wideband configuration, or Configuration 2). Importantly, it has been shown that such amplifiers are feasible, either through the use of complex design configurations [
6] or by cascading erbium-doped fiber (EDF) and bismuth-doped fiber (BDF) [
5]. In particular, the latter approach is very promising, as it offers an amplification bandwidth of about 12 THz, enabling the amplification of the Super C and Super L bands using a single amplifier, as considered in this work. An alternative solution for implementing single-wideband amplification is to rely on semiconductor optical amplifiers (SOAs). In fact, SOAs with a bandwidth of about 100 nm, corresponding to approximately 12.5 THz, have been demonstrated recently [
5], which aligns with the requirements of single-wideband amplification. However, the use of SOAs has a number of drawbacks, making them unsuitable for real-world applications at the current stage. These drawbacks include, namely, high coupling losses at the fiber–SOA interface, induced interference between channels in WDM transmission, and high noise figures.
The physical topology of an optical network can be described as an undirected graph where } represents the set of ROADM nodes and } represents the set of optical links, with being the number of nodes and the number of links (also called edges). Each link is characterized by two attributes: the link length in kilometers between the nodes and ; and , the link capacity measured in terms of the number of wavelength channels . In this work, we assume that the fiber transmission takes place in the Super C+L band with a total bandwidth of 12 THz. This allows for the support of up to =187 channels, assuming a channel spacing of 64 GHz, corresponding to a baud rate of 64 Gbaud.
On the other hand, the logical topology relates to the flow of information within the networks and is described by the demand matrix , which is an matrix where each entry denotes the number of traffic demands between the source node and termination node with . In this work, we assume a uniform demand profile of 1 for all the node pairs, corresponding to a full-mesh logical topology in which each node is logically connected to every other node in the network.
For each traffic demand it is necessary to find a lightpath in the physical topology between each pair of nodes, allocate a transmission band (either C or L band), and assign a wavelength to that path. In other words, in addition to the traditional routing and wavelength assignment (RWA) problem, our formulation also includes band allocation.
Given that there are multiple paths between each pair of nodes, the routing objective in this work is to find the -shortest paths using a heuristic such as Yen’s algorithm. The shortest path is defined as one that minimizes the total path length of all the links traversed by the path, represented as . This strategy has the advantage of providing alternative paths for each traffic demand if the primary one is unavailable.
Concerning band allocation, we choose the C band first and only move to the L band when it is completely filled, as [
24] shows that this strategy is the best under optimized conditions. Furthermore, the wavelength assignment must ensure that the same wavelength is used for all the links traversed by the lightpath to maintain continuity, and that no two lightpaths can share the same wavelength on a single link. Each lightpath is physically established using an optical channel characterized by its wavelength
and capacity
, specifically for the case of channel
. Note that
, where
is the set of optical channels required to implement a logical full-mesh topology. In order to compute the capacity
, measured in bit/s, it is necessary to determine the total signal-to-noise ratio (
of the optical signal transported by the optical channel at its destination. This step will be carried out in the next section.
5. Optical Channel Capacity and Network Throughput
To evaluate the of channel , we must keep in mind that this channel travels through many intermediate ROADMs and multiple optical links, with the number of ROADMs and links denoted by and , respectively. To simplify the analysis, each ROADM is modeled with a pass-through loss of 18 dB and add/drop losses of 15 dB, independent of the channel frequency. In addition, perfect isolation is assumed, allowing crosstalk effects to be neglected. Switch time is also disregarded, as it is not a relevant parameter in this study, which focuses on static scenarios. To compensate for these losses, post-optical amplifiers are placed at each node. However, these amplifiers are a source of ASE noise, which must be accounted for in the SNR calculation. Additionally, the MUX and DEMUX devices used in Configuration 1 are assumed to have insertion losses of 1 dB each.
Furthermore, the in-line optical line amplifier modules, either in the band-dedicated or single-wideband configuration, are designed not only to compensate for the optical fiber span losses, but also to account for additional losses or gains caused by the SRS effect. As a result, it can be assumed that all optical channels have identical power at the receiving side, equal to
. In this situation, the
at the receiving side is given by
where
is the signal-to-noise ratio at the
optical link, given by (3), with
denoting the powers of the ASE noise generated at the add, intermediate, and drop ROADMs, respectively. It should be noted that a central assumption in deriving Equation 5, and consequently Equation (7), is that the optical bands considered are fully filled. This assumption is reasonable, since in many practical situations the bands are intentionally filled with dummy light (e.g., ASE noise) to facilitate network recovery in the event of failures [
19,
25].
Through knowledge of
, it is possible to compute the channel capacity
of optical channel
. Two formulations can be used to obtain this capacity: (1) Shannon capacity; and (2) real capacity. The Shannon capacity represents the theoretical maximum capacity and assumes that the optical signal has Gaussian modulation. In contrast, the real capacity takes into account the actual modulation formats (e.g., QPSK, 16-QAM) supported by the channel. The Shannon capacity can be evaluated using the Shannon formula, which is
where
is the net payload symbol rate, which is defined as
, with
being the FEC (forward error correction) and mapping overhead within the transponders (see [
7], Sect. 2.2). For the purpose of this analysis, we assume an overhead of 28% and a symbol rate of 64 Gbaud, resulting in
Concerning the real capacity, the strategy is to determine, for each optical channel, the most efficient modulation format that yields the maximum net bit rate, which we define as the channel’s capacity. As a consequence, we have
where
is the number of symbols of the modulation constellation considered for the channel
. A given modulation format can be selected only if the estimated
is higher than the minimum threshold (
) required to achieve a bit error rate
(see
Table 2), measured at the FEC input. Additionally, an adequate system margin must be included to account for factors such as aging, repairs, and other signal degradation effects not considered in the SNR.
Having in mind that the total bandwidth available per link for the Super C+L band is 12 THz, we arrive at the maximum number of wavelength channels, , of 187 per link assuming a baud rate of 64 Gbaud, as previously explained. This link-capacity limitation can cause traffic-demand blocking (wavelength blocking) when at least one link on a given lightpath has no free wavelength channels. An additional blocking source is the absence of optical channels with sufficient quality (SNR blocking) to support the traffic demand. Furthermore, the ROADMs used at network nodes can also be a source of blocking. This occurs whenever a given wavelength is not available to be added or dropped locally, a problem called wavelength contention. Fortunately, this issue can be mitigated using contentionless INCLUDE devices. By adding colorless INCLUDE and directionless (D) capabilities, one arrives at CDC ROADMs, which are assumed to be used in this work.
By applying a constrained routing algorithm along with a first-fit wavelength assignment [
26], we obtain the matrix of established paths,
, and the matrix of blocked paths,
, where
This allows us to determine the average blocking ratio, given by
As discussed before, network capacity refers to the maximum amount of data that the entire network can handle across all optical channels simultaneously per unit of time. It can therefore be calculated by summing up the capacities of all optical channels in the set
S, giving
Another important metric in our study is the network throughput. This metric describes the actual data rate achieved across the entire network, but taking into account real operating conditions, such as the presence of blocking. Consequently, we define network throughput in the following manner:
An additional metric for network analysis is the network-wide average channel capacity, defined as [
26]
where
denotes the expected utilization ratio of channel
. For the sake of simplicity, it is assumed that
for all channels. As a result, the sum in the denominator of (14) equals the total number of optical channels in the network, which, for a full-mesh logical topology, amounts to
.
The reasoning described above for computing the network capacity and average blocking probability enables the implementation of the algorithm, whose flowchart is shown in
Figure 4, for the case of real capacity.
The process begins by computing a set of k-shortest candidate paths for each traffic demand using Yen’s algorithm. For each optical link along these paths, the number of fiber spans, span length, amplifier gain, and optimal launch power per optical channel are determined. Based on this information, the link-level SNR is computed, taking into account ASE, NLI, and the SRS effect. When real modulation formats are considered, the link-level SNR must be evaluated separately for each modulation format to account for modulation-dependent NLI correction factors [
27].
Traffic demands are routed sequentially according to a shortest-first policy, and wavelengths are assigned using a first-fit strategy, starting from the C band as previously mentioned. If a wavelength is available, the end-to-end SNR for the analyzed path is computed by aggregating the inverse SNR contributions of each traversed link, which are precomputed during the link characterization phase, and including additional ROADM-induced noise as described by Equation (7). For real modulations, the algorithm checks whether the SNR supports the highest-order modulation format and, if not, iteratively tests lower-order formats until a suitable one is found. For Gaussian-modulated signals, the same SNR threshold (6.8 dB) is assumed for all channels. If no modulation scheme meets the SNR requirement at the selected wavelength, the next wavelength is tested. If no wavelengths satisfy the quality-of-transmission requirement across all candidate paths, the demand is blocked. The capacity of accepted lightpaths (optical channels) is calculated using Shannon’s formula (Equation (8)) in the case of Gaussian modulation, or the real modulation expression (Equation (9)) when practical formats are used. After all demands are processed, the simulator computes overall network performance metrics, including the average channel capacity, total throughput, and blocking ratio.
6. Data Generation, Results, and Discussion
6.1. Synthetic Topology Data-Set Generation
To investigate the dependence of wavelength usage on network topological parameters and conduct statistical analysis, it is necessary to generate a large set of synthetic network topologies. This can be achieved using random graphs designed to model the characteristics of real-world optical networks. In this work, we use the
-neighbors model described in [
28] for this purpose. In a simplified manner, this model works by randomly placing
network nodes in a 2D space with area
and minimum distance
between them. The nodes are then interconnected with their nearest neighbors based on Euclidian distance. First, each node connects to
nearest neighbors to form an initial graph. A minimum spanning tree is then created to ensure that all nodes are connected. Next, the model continues to add links randomly between the
-nearest neighbors of each node until the maximum average node degree
is reached. During the interconnection process, it must also be ensured that the resulting graph is biconnected to provide a minimum degree of resilience to failures. Specifically, the networks were generated in a 2D space with area
, with
ranging from 10 to 100 and
varying from 2 to 4.8. The
-neighbors model had the following parameters:
= 4 and
= 8, and
was equal to 40 km.
6.2. Results and Discussion
To investigate the dependence of network throughput on network size and to understand how the amplifier configuration type impacts this metric,
Figure 5 shows the variation in network throughput computed using the Shannon approach (Gaussian modulation) as a function of the number of nodes, with (a) corresponding to Configuration 1 and (b) to Configuration 2 for the optical amplifiers. The results are presented using box plots, which are a graphical method for illustrating the statistical distribution of a data set, including the median, the interquartile range, and both the minimum and maximum values. It can be seen that network throughput tends to grow as the number of nodes increases, a trend that is expected from (13). By comparing
Figure 5a,b, one can see that the statistical distributions remain almost the same for the two configurations, but the average throughput is significantly higher for Configuration 2 than for Configuration 1. For example, in a network with 100 nodes, the average throughput is 1539.9 Tb/s for the first case and 1829.4 Tb/s for the second one. Averaging over all the node counts, we conclude that Configuration 2 leads to an improvement of about 18%.
As the number of nodes increases, the number of blocked traffic demands and the average blocking ratio, given by (11), also increase. This behavior is shown in
Figure 6, which depicts the variation in these two parameters as a function of the number of nodes. As a first observation, one can see that the blocking behavior associated with Configuration 2 (
Figure 6a) is only slightly better than that of Configuration 1 (
Figure 6b). As a second observation, it can be noted that blocking impacts the logical topology of optical networks. In fact, a full-mesh logical topology can only be achieved in the absence of blocking. With significant blocking, the logical topology departs considerably from the full mesh. If this type of topology is required, fewer than 40 nodes are feasible. It is also worth noting that in all the scenarios analyzed, blocking was mainly caused by a lack of available wavelength channels, with the fraction of demands blocked due to a poor SNR not exceeding 20%.
The next step in the analysis targets real modulations. For this purpose,
Figure 7 shows box plots of throughput as a function of the number of nodes.
By comparing
Figure 5 with
Figure 7, one can immediately conclude that the throughput values in scenarios using real modulations are considerably lower than those obtained with Gaussian modulations. The average decreases are 56.2% and 51.2% for Configurations 1 and 2, respectively. Furthermore, in these scenarios, Configuration 2 leads to an average throughput improvement of about 31.9% compared to Configuration 1, reflecting the significant advantages of using single-wideband instead of dedicated-band amplification in real scenarios. On the other hand,
Figure 8 shows the blocking behavior for the scenarios with real modulation schemes, where no substantial differences were observed in comparison with the Gaussian modulation scenarios described in
Figure 6.
The average optical channel capacity is another important parameter that deserves to be analyzed. Focusing now only on real modulation scenarios,
Figure 9 depicts the variation in this parameter as a function of the number of nodes for the two amplification configurations. From this figure, one concludes that the statistical distribution of the results for the two configurations is significantly different. In fact, the results for Configuration 2 are more spread out and skewed than those for the other configuration. It is worth noting that the box plots also display outliers, shown as small circles, to indicate data points that differ considerably from the rest of the data set. However, the most important conclusion is that the use of Configuration 2 (single-wideband amplification) leads to a substantial increase in average channel capacity compared to Configuration 1 (band-dedicated amplification). For the first configuration, the channel capacity averaged over all the node counts considered in the analysis is 181.0 Gb/s, while that for the second configuration is 139.2 Gb/s, which corresponds to an increase of about 30%, a value quite similar to the 31.9% improvement in throughput.
7. Conclusions
In this paper, a methodology has been proposed for calculating the throughput of optical backbone networks working in the Super C+L band. This method involved detailed modeling of physical layer aspects, taking into account, namely, the stimulated Raman scattering, responsible for the energy transfer between C and L, along with other limitations. It also required the use of an algorithm capable of computing both the network throughput and blocking, based on a constraint routing procedure that accounts for the limited number of optical channels per link. The algorithm was applied in scenarios with either Gaussian or real modulation schemes. The developed framework was used to compare the behavior of band-dedicated and single-wideband amplifier configurations in the context of Super C+L-band optical networks, showing that the latter can lead to throughput improvements of about 18% and 32% for the Gaussian and real modulation schemes, respectively. The results also show that the idealized Gaussian modulation significantly overestimates the throughput compared to real modulations, by 56.2% for the band-dedicate scheme and 51.2% for the single-wideband scheme.
In summary, the main finding of this work is that single-wideband amplification for Super C+L-band networks has the potential to significantly increase network throughput compared to traditional solutions, highlighting the importance of advancing development efforts for this type of amplifier.


