Abstract
Although the Power Internet of Things (PIoT) significantly improves operational efficiency by enabling real-time monitoring, intelligent control, and predictive maintenance across the grid, its inherently open and deeply interconnected cyber-physical architecture concurrently introduces increasingly complex and severe security threats. Existing IoT security solutions are not fully adapted to the specific requirements of power systems, such as safety-critical reliability, protocol heterogeneity, physical/electrical context awareness, and the incorporation of domain-specific operational knowledge unique to the power sector. These limitations often lead to high false positives (flagging normal operations as malicious) and false negatives (failing to detect actual intrusions), ultimately compromising system stability and security response. To address these challenges, we propose a domain knowledge-driven threat source detection and localization method for the PIoT. The proposed method combines multi-source features—including electrical-layer measurements, network-layer metrics, and behavioral-layer logs—into a unified representation through a multi-level PIoT feature engineering framework. Building on advances in multimodal data integration and feature fusion, our framework employs a hybrid neural architecture combining the TabTransformer to model structured physical and network-layer features with BiLSTM to capture temporal dependencies in behavioral log sequences. This design enables comprehensive threat detection while supporting interpretable and fine-grained source localization. Experiments on a real-world Power Internet of Things (PIoT) dataset demonstrate that the proposed method achieves high detection accuracy and enables the actionable attribution of attack stages aligned with the MITRE Adversarial Tactics, Techniques, and Common Knowledge (ATT&CK) framework. The proposed approach offers a scalable and domain-adaptable foundation for security analytics in cyber-physical power systems.
1. Introduction
As a key enabler of the digital transformation of the power grid, the PIoT plays a central role in next-generation power systems [1,2]. Its secure operation is vital for the safety of critical infrastructure, making cybersecurity a top priority in design and operation [3,4]. Unlike traditional power networks, the open and highly interconnected architecture of the PIoT introduces far more complex threats, ranging from targeted external exploits of system vulnerabilities to internal risks stemming from device failures, misconfigurations, or human error. In recent years, there has been a significant increase in cyberattacks targeting power systems, including malicious command injections [5,6,7], distributed denial-of-service (DDoS) attacks [8,9], and false data injection (FDI) attacks [10,11,12]. These attacks pose a direct threat to the stability and reliability of the power grid. Against this backdrop, real-time threat detection and localization have emerged as a critical component of proactive defense strategies within PIoT environments. Robust detection and localization mechanisms are essential for enhancing grid cybersecurity and safeguarding critical infrastructure from increasingly sophisticated and persistent cyber threats.
Furthermore, compared to traditional power networks, the PIoT exhibits three key characteristics stemming from its scale and diversity. As shown in Figure 1, the PIoT supports various industrial protocols, encompassing communication standards such as High-Performance Power Line Communication (HPLC), ZigBee, LoRa, Modbus TCP, and IEC 61850. This protocol heterogeneity means that an intrusion-detection approach must correctly interpret a wide range of packet formats and command sets. When deployed in a live PIoT environment, the misinterpretation of an uncommon protocol can lead to spurious alerts or undetected attacks against less-monitored channels. Furthermore, the PIoT generates multimodal data—from structured control signals and sensor measurements to unstructured or semi-structured logs—creating a highly complex data landscape that complicates feature extraction and correlation. This diversity often overwhelms simple analytics pipelines, resulting in high false positives (flagging normal operational anomalies as malicious) and false negatives (overlooking stealthy manipulations hidden within legitimate log entries). Moreover, the PIoT’s operational dynamics span multiple time scales, with data exchange and monitoring occurring at intervals from milliseconds (e.g., real-time sensor updates) to minutes (e.g., periodic status reports). This asynchrony makes it difficult for conventional, time-agnostic methods to maintain accurate behavioral baselines; bursts of legitimately high traffic or transient control messages can be mistaken for distributed denial-of-service (DDoS) attacks, while slow, creeping manipulations evade detection entirely. These limitations are especially critical when detecting Advanced Persistent Threats (APTs), whose defining traits include stealth, adaptability, and long-term persistence [13].
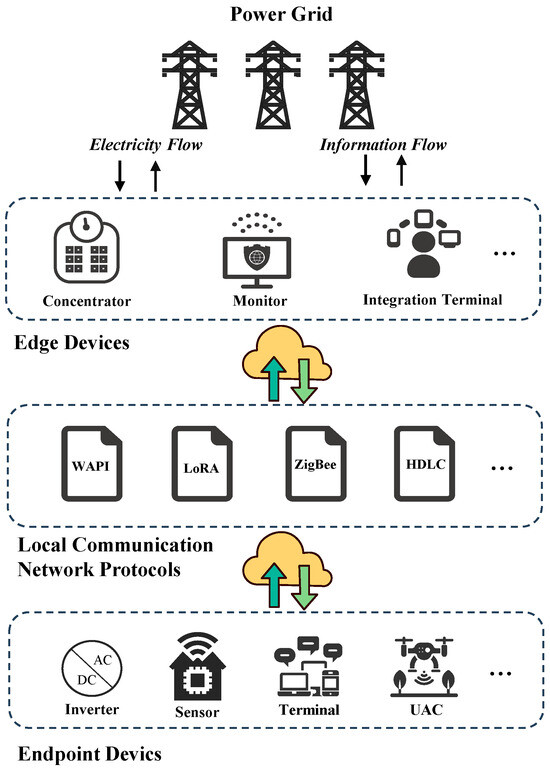
Figure 1.
Typical architecture of a PIoT infrastructure.
APT campaigns often proceed in multiple stages—reconnaissance, initial compromise, lateral movement, and data exfiltration—while blending their activities with normal system behavior [14]. In real-world PIoT deployments, existing anomaly-detection methods, ranging from fixed-threshold statistical approaches to advanced machine learning and deep learning techniques (including unsupervised and weakly supervised models) [15,16], struggle to secure the environment effectively. This inadequacy primarily stems from their inability to fully grasp and utilize power system-specific domain semantics; difficulties in integrating and correlating heterogeneous data across the physical, network, and behavioral layers; and a limited capacity to detect and track stealthy, multi-stage attacks that evolve across various layers and timelines [17,18]. Consequently, these solutions frequently yield excessive false positives or false negatives, failing to link weak indicators across diverse protocols or capture the gradual, multi-stage nature of APTs, where individual phases appear benign but collectively signify a high-level threat [14].
This challenge highlights the need for detection frameworks integrating domain knowledge, temporal modeling, and cross-layer feature fusion to identify coordinated, multi-vector threat behavior. For instance, PIoT threats manifest through diverse signatures: command injection attacks cause abnormal control codes and device shifts [1,5]; distributed denial-of-service (DDoS) attacks induce communication-layer traffic surges, impacting supervisory control [8]; and false data injection (FDI) attacks distort measurement payloads, leading to physical anomalies like voltage fluctuations [10]. These differentiated threat signatures across domains form the foundation for our proposed multi-level detection and localization framework, which integrates domain-specific knowledge to provide precise, interpretable, and robust security analysis in PIoT environments.
To address these challenges, we propose a domain knowledge-driven method for intelligent threat source detection and localization in the PIoT. The proposed framework consists of three core components, each targeting a specific set of challenges: a multi-level PIoT feature engineering module, a threat detection and localization model, and a threat source classification mechanism based on the MITRE ATT&CK framework. The multi-level PIoT threat feature engineering module embeds power-specific semantics to overcome the limited adaptability of conventional feature engineering approaches to power system environments. The threat detection and localization model addresses the challenge of identifying and locating threats in complex, multimodal environments. The proposed framework leverages a hybrid neural architecture comprising the TabTransformer [19] and BiLSTM [20] to facilitate robust representation learning across heterogeneous data modalities. The TabTransformer component effectively captures complex feature interactions within structured electrical- and network-layer inputs, while the BiLSTM module models temporal dependencies embedded in sequential behavioral logs. This architectural design enables the unified encoding of cross-layer threat indicators, enhancing the model’s capacity to detect and contextualize sophisticated cyber-physical attacks. The framework incorporates a threat source detection and localization mechanism grounded in the MITRE ATT&CK framework to further support interpretability and actionable threat attribution. Each detected threat is mapped to a corresponding tactical stage (i.e., initial access, execution, persistence, and lateral movement), allowing the system to reconstruct the adversarial trajectory consistent with established cyber kill chains. This alignment provides semantically meaningful insights into the attack lifecycle and facilitates precise, stage-wise threat localization for critical infrastructure defense.
The main contributions of this paper are summarized as follows:
- We propose a domain knowledge-driven threat source detection and localization method tailored for the PIoT. The method enhances the accuracy and interpretability of threat detection and localization by incorporating power system-specific knowledge, providing a practical and application-focused defense strategy that aligns with the operational realities of PIoT environments.
- We design a multi-level PIoT threat feature engineering module. The framework effectively tackles the challenges of integrating heterogeneous data and adapting domain-specific features by leveraging the diverse communication protocols, multimodal data sources, and temporal dynamics of the PIoT.
- We validate the proposed method through comprehensive experiments in real-world operational environments. The results demonstrate the method’s robustness, scalability, and practical value in enhancing the cybersecurity resilience of the PIoT.
The remainder of this paper is organized as follows. Section 2 reviews related works on intrusion-detection systems, multi-source feature fusion, and power system-specific threat modeling. Section 3 details the proposed framework, including the multi-level PIOT threat feature engineering module, domain knowledge-driven threat detection model, and ATT&CK-based localization mechanism. Section 4 presents the experimental settings and evaluation results based on real-world PIoT datasets, discusses the findings and implications of the results. Finally, Section 5 concludes this paper and outlines future research directions.
2. Related Works
Ensuring the security of PIoT environments requires addressing various cyber threats, including false data injection, protocol misuse, staged command manipulation, and distributed denial-of-service attacks. These threats span multiple system layers—from communication protocols and behavioral logs to physical device states—making detection and attribution challenging. Traditional detection methods, such as intrusion-detection systems (IDSs), remain relevant as foundational tools in this landscape. However, they often fall short of isolating root causes or interpreting threats in domain-specific contexts like power systems.
IDSs can be broadly categorized into Network-based Intrusion-Detection Systems (NIDSs) [21] and Host-based Intrusion-Detection Systems (HIDSs) [22]. NIDSs monitor and analyze network traffic to detect suspicious activities, offering a network-wide view. In contrast, HIDSs focus on individual devices, monitoring system calls, application logs, and file-system modifications. Both approaches are essential components of a layered defense strategy.
A wide range of techniques has been explored to improve NIDS effectiveness. Bala et al. [23] proposed a taxonomy of AI-based DDoS detection strategies, showcasing the potential of graph neural networks in modeling attack topologies, although computational cost remains challenging. Zohourian et al. [24] introduced IoT-PRIDS, a non-ML detection system using header-based packet representations to deliver fast, accurate intrusion detection with minimal resource consumption. Eskandari et al. [25] proposed Passban IDS, which compiles packet features into logic circuits for low-power deployment, although it faces limitations in scalability and rule updates. Dong et al. [26] presented HorusEye, a system that leverages programmable switch hardware for burst-level anomaly detection using allowlist-based rules and deep analysis of flagged flows. While it achieves high throughput and recall, its static rule base and hardware dependencies hinder adaptability. Wang et al. [27] designed BT-TPF, a lightweight transformer pipeline that distills knowledge from a large Vision Transformer into a compact Poolformer model. With only 788 parameters, the model maintains high accuracy and is suited to edge deployment. Similarly, AttackNet [28] achieves high performance in centralized botnet detection using a CNN–GRU hybrid architecture but does not address distributed or adaptive attack surfaces.
HIDS approaches, offering deeper host-level inspection, have also advanced. Khan et al. [29] proposed a lightweight anomaly-detection framework for the healthcare IoT, achieving low overhead but lacking robustness to concept drift and cross-domain generalization. Liang et al. [30] proposed OICS-VFSL, a variational few-shot framework addressing class imbalance in the IoT, although its assumption of device homogeneity limits its applicability in heterogeneous environments. Meta-learning-based models like Meta-IDS [31] use dynamic classifier reweighting to adapt to data diversity in the IoMT but suffer from high training costs and reliance on balanced data.
The increasing complexity of cyber-physical systems like the PIoT has led to new detection challenges in recent years. PIoT environments are characterized by heterogeneous communication protocols (e.g., HPLC, Modbus TCP, ZigBee, IEC 61850), multimodal data, and real-time operations across diverse time scales. In such systems, conventional NIDSs lack visibility into device-level semantics and cannot correlate network-level anomalies with physical state deviations [17,32]. Similarly, HIDSs must contend with high variability in device configurations and difficulty embedding physical-layer semantics into models, limiting their generalizability.
Recent research has increasingly emphasized multi-source data fusion and domain-aware feature engineering to address these issues. Cui et al. [33] proposed attentional feature fusion with multi-scale convolution for fault diagnosis in ship power systems, effectively combining multiple modalities. Yan et al. [34] explored the fusion of electrical and sensor data for tap-changer diagnosis in smart grids. Guarino et al. [35] introduced a two-level cyber-physical fusion framework to detect anomalies through integrated analysis, demonstrating the benefit of correlating physical and digital domains. These works collectively show that multi-domain fusion improves anomaly-detection precision and contextual interpretability, especially in complex, safety-critical infrastructures like the PIoT. Despite these advancements, a persistent limitation is the lack of source-level threat localization and integration of power system-specific knowledge. Existing works often generalize detection across IoT or IIoT contexts without modeling the semantics unique to electrical grids. Our proposed method addresses this gap by incorporating the electrical context into feature engineering. Our framework performs structured fusion across three semantically distinct domains—electrical, network, and behavioral—and embeds power system-specific semantics directly into the feature representation. The TabTransformer enables the dynamic modeling of cross-domain interactions, especially between categorical protocol identifiers and continuous electrical measurements. This is further complemented by the BiLSTM-based sequential modeling of log-derived behavioral patterns. Unlike conventional fusion pipelines that rely on early or late fusion, our method performs contextual and column-specific attention-based fusion, which better preserves the operational semantics of PIoT data.
3. Methodology
This section presents the framework integrating multi-level PIoT threat feature engineering, model design, threat detection, and localization in PIoT environments.
3.1. Overall Architecture
As illustrated in Figure 2, our framework incorporates three primary components: (1) a multi-level PIoT threat feature engineering module, (2) a threat detection and localization model, and (3) a MITRE ATT&CK-based threat source localization mechanism. Stage 1 corresponds to feature engineering and initial threat detection, while Stage 2 focuses on fine-grained threat localization using behavioral features.
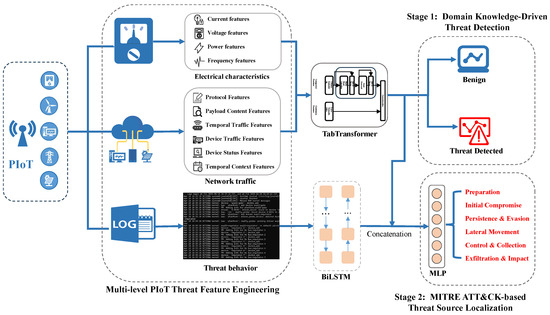
Figure 2.
Overall architecture of the proposed threat source detection and localization method.
As part of our overall threat detection and localization framework, we design a multi-level PIoT threat feature engineering module to extract semantically rich, domain-informed representations from power grid data. This module captures practical operational characteristics and embeds domain expertise from operation and maintenance (O&M) professionals. It reflects the heterogeneous nature of PIoT environments by incorporating electrical measurements, network traffic patterns, and behavioral indicators. Specifically, electrical features—such as current, voltage, frequency, and power—reflect real-time equipment states and serve as a tamper-resistant foundation for anomaly detection. Network-layer features include protocol metadata, communication timing, message payloads, and device-specific traffic statistics, enabling the detection of abnormal exchanges across heterogeneous protocols. Behavioral features are derived from unstructured sources like logs and alarms. We apply natural language processing techniques to uncover latent patterns and adversarial tactics, enhancing the system’s ability to detect and interpret sophisticated cyber threats. By integrating these diverse feature dimensions, this module strengthens the contextual grounding of downstream analytics and significantly improves the accuracy and interpretability of the overall PIoT threat detection pipeline.
In constructing the threat detection and localization model, we employ the TabTransformer to extract features from electrical characteristics and network traffic, which are predominantly structured in tabular format. By incorporating the attention mechanism from the Transformer architecture, the TabTransformer effectively captures contextual dependencies among different feature fields. This method addresses the limitations of traditional MLP-based methods, which have difficulty modeling complex interactions between features. It is especially suited for the PIoT, where the input data frequently comprises categorical and continuous variables. To process behavioral features extracted from system logs—inherently unstructured and sequential data—we adopt a BiLSTM network. This model captures both forward and backward temporal dependencies, allowing for a more comprehensive understanding of the evolution and logical patterns of attack behaviors over time. By integrating these two architectures, the proposed model enhances its ability to detect subtle, continuously evolving threats in complex PIoT environments. Combining the TabTransformer for structured data and BiLSTM for sequential behavioral data strengthens the model’s capacity to handle the diverse and dynamic nature of cyber threats in the PIoT.
The process of the threat source localization module, built upon the MITRE ATT&CK framework, is structured into two stages. In Stage 1, the system assesses whether the input sample indicates potential adversarial behavior based on the output of the TabTransformer-based model. The module proceeds to Stage 2 if the threat is identified, incorporating additional behavioral features to support a more fine-grained tactical attribution. Specifically, the system concatenates the fused static features from Stage 1 with dynamic behavioral indicators to form a unified feature representation. This composite vector is then passed to a multi-class localization head, implemented as an MLP. The classifier employs a softmax activation function to produce a probability distribution over six ATT&CK-defined tactical categories, including Preparation, Initial Compromise, Persistence and Evasion, Lateral Movement, Control and Collection, and Exfiltration and Impact. Ultimately, the system selects the tactic with the highest predicted probability as the most likely stage of the ongoing threat, thereby enabling step-wise inference and precise localization within the adversarial attack chain.
3.2. Multi-Level PIoT Threat Feature Engineering
The multi-level threat feature engineering module collects data across three domains: electrical characteristics, network traffic, and threat behavior. The electrical characteristics extract key physical-layer parameters, such as current, voltage, power, and frequency. These signals are inherently tamper-resistant and provide accurate reflections of the real-time operational status of power equipment. For network traffic, the module captures protocol-specific information, packet payloads, temporal traffic patterns, device traffic statistics, device states, and contextual timestamps, all of which facilitate the detection and localization of anomalous communication behaviors. In the behavioral domain, structured features are derived from system and audit logs to reveal latent attack patterns and irregular operational activities. This diverse feature set provides a comprehensive foundation for downstream deep learning models to identify sophisticated and stealthy threats in Power Internet of Things (PIoT) environments.
3.2.1. Electrical Characteristics
The actual electrical characteristics, such as current, voltage, power, and frequency, capture the fundamental operating state of power equipment. As these measurements originate from the physical layer and are directly sensed from the equipment, they are generally more challenging to manipulate remotely than network-layer features. This makes them helpful in establishing a stable and quantifiable baseline for system state assessment, especially under cyberattacks targeting communication protocols or network behavior. However, it is important to note that this resistance is not absolute—sophisticated attackers with physical access or advanced capabilities may still compromise sensor integrity or inject falsified signals [14]. Therefore, our work assumes that basic physical security mechanisms (e.g., tamper-resistant hardware and trusted sensor placement) are in place. As shown in Table 1, we extract physical-layer measurements across four categories: current, voltage, power, and frequency.

Table 1.
Extracted electrical characteristics used for threat detection and localization.
For the current features, we record both the instantaneous (primary) and root-mean-square (RMS) values for the three-phase currents (A, B, and C) and the zero-sequence current. Denoting these as , , , and , and , , , and , respectively, allows us to capture both transient fluctuations and sustained stability in current behavior, offering complementary evidence for anomaly detection and localization.
The voltage features are derived from single-phase measurements, phase-to-phase combinations, and symmetrical components. Specifically, we include the primary and RMS values of the phase voltages (, , and ), line voltages (, , and ), sequence voltages (, , and ), and synchronized voltage . This comprehensive set characterizes voltage dynamics under a variety of operational conditions.
The power features encompass the active power (), reactive power (), apparent power (), and power factor (PF), which indicates energy conversion efficiency. The continuous monitoring of these metrics supports a holistic view of energy consumption, losses, and grid balance, enabling the prompt detection of deviations caused by equipment faults or cyber intrusions.
The frequency features include the system frequency f and synchronized frequency , which reflect the grid’s immediate response to load changes and dispatch signals. These measurements are critical for preventing frequency-driven cascading failures.
By extracting the fine-grained physical-layer features, our security detection and localization framework can more accurately characterize the real-time operational state of PIoT systems, laying a robust foundation for downstream threat identification and response.
3.2.2. Network Traffic
To comprehensively characterize device communication behaviors in industrial networks, we categorize the network traffic features into six semantically distinct groups. These feature sets are modeled from multiple dimensions, including protocol features, packet payload, temporal traffic, device traffic and status, and temporal context. A complete summary of the extracted feature groups is provided in Table 2.
Table 2.
Extracted network traffic features used for threat detection and localization.
The protocol features primarily characterize the structural properties of communication sessions. The session_duration feature reflects the intensity and length of session activities, while the protocol_type, service, and function_code features denote the standard communication rules and command formats employed by participating devices. Connection flags (e.g., flag, connection_flag) capture transitions in session states, including connection establishment and termination. The src_bytes and dst_bytes features represent the volume and direction of transmitted data. The device_id feature differentiates between individual devices involved in the session. Additionally, the wrong_fragment and urgent features serve as potential indicators of transmission anomalies or malicious behavior.
The packet payload features are extracted via deep semantic analysis of the protocol features to uncover latent indicators of compromise. Based on information entropy theory, the payload_entropy metric quantifies the randomness in the packet payload. Significant deviations in entropy may indicate the presence of encrypted or obfuscated data. Entropy is defined as
where denotes the empirical probability of symbol within the message payload.
In parallel, statistical descriptors such as value_mean, value_std are used to establish a baseline distribution of normal communication parameters. The out-of-range count feature (out_of_range_count) records the frequency of payload values falling outside the expected legitimate range, which may suggest data tampering or device malfunction. The error code count feature (error_code_count) captures the number of error indicators appearing in the payload, where a spike in error occurrences often signals internal system faults or ongoing attacks. Finally, the unauthorized command count feature (unauthorized_command_count) directly measures the number of commands executed without proper authorization, providing strong evidence for detecting privilege abuse or malicious intrusions.
The temporal traffic features are designed to capture the dynamic behavior of communication through a set of time- and frequency-based metrics. The count and srv_count features represent the number of connections established within a specific time window to a given host and service, reflecting the density of communication activity. The request_rate and response_rate metrics describe the frequency of outgoing and incoming traffic, which helps identify denial-of-service (DoS) attacks or device overload conditions. Features such as avg_response_time and max_response_time capture the processing capacity and stability of the device.
To model temporal regularity, the mean and standard deviation of request intervals—request_interval_mean and request_interval_std—are computed to reveal the communication periodicity and its fluctuations. Furthermore, retransmission_rate and burstiness indicate abnormal transmission behaviors, including packet loss, congestion, or malicious activity. By establishing a baseline of normal traffic dynamics, the feature group facilitates the rapid detection of deviations from expected communication patterns.
The device-level traffic features quantify the overall communication characteristics from the perspective of individual devices. The dst_host_count feature indicates the total number of connections directed to a specific device, while the dst_host_srv_count feature captures the number of connections involving the same service. These features describe the breadth and depth of the device’s communication footprint and can help identify abnormally high activity levels.
Additional indicators include dst_host_error_rate and dst_host_auth_fail_rate, which reflect potential communication issues such as failed connection attempts or unsuccessful authentications. The dst_host_unusual_service_rate feature identifies whether a device has been subject to access attempts for unauthorized or unknown services, which is particularly relevant in detecting abnormal inter-device communication patterns typical of distributed or coordinated attacks.
The temporal context features are incorporated to capture the inherent periodicity of communication behaviors in industrial devices. This feature group includes variables such as hour_of_day, day_of_week, is_peak_hour, and season, which provide contextual information about the timing of the network activities. These features facilitate the modeling of temporal patterns and enhance the system’s capacity to detect periodic anomalies and time-dependent attack behaviors.
This section introduced a comprehensive and hierarchical feature representation framework that characterizes device communication behavior in the network from multiple perspectives. The proposed design offers theoretical depth and practical applicability, providing a robust foundation for future research in anomaly detection and threat localization for critical infrastructure systems.
3.2.3. Threat Behavior
In power systems, various devices—including edge terminals, substation RTUs, and master stations—generate logs during normal and abnormal operations. These logs typically record information such as device status, error messages, and network interactions and are commonly stored in semi-structured text formats. A raw log entry generally includes a timestamp, a device module, and a textual description of the corresponding event.
This paper employs a template extraction approach to standardize log formats by transforming raw logs into structured log templates. A log template represents the fixed structural pattern of a log message, where variable elements (e.g., IP addresses, user IDs) are replaced with a wildcard symbol <*>. For example, the original log entry
Apr 18 18:49:20 SCT230A sshd[19603]: Accepted password for sysadmin from 172.20.7.93 port 48134 ssh2
is abstracted into the template
<*> <*> <*> <*> sshd[*]: Accepted password for <*> from <*> port <*> ssh2.
This method effectively removes parameter-level variability while preserving the semantic content of the log, enabling the extraction of consistent behavioral patterns.
Template extraction naturally aligns with field-failure data analysis (FFDA) principles, a foundational methodology in industrial systems engineering. FFDA systematically examines operational logs and failure records to identify recurring fault patterns and hidden system vulnerabilities [36]. Similarly, by abstracting heterogeneous device logs into structured templates, our approach enables the consistent capture of behavioral anomalies across devices and over time. This mirrors the role of FFDA in supporting root cause analysis and reliability enhancement in traditional industrial contexts. By integrating template-based log analysis with domain-specific threat modeling, our method effectively extends the utility of FFDA from reliability engineering to the cybersecurity domain of power systems, facilitating more accurate threat interpretation and enabling actionable, context-aware responses.
The template text is first tokenized to capture the semantic features of log templates. Tokenization decomposes each template into a sequence of lexical tokens, facilitating the modeling of semantic relationships among words. For instance, the template
RTU failed to respond from IP
is tokenized into
["RTU", "failed", "to", "respond", "from", "IP"].
These tokens are subsequently mapped to continuous vector representations using a trainable word embedding layer.
3.3. Design of Threat Detection and Localization Model
To address the challenge of modeling complex feature interactions in multi-source heterogeneous environments, we employ the TabTransformer to encode structured features, encompassing electrical characteristics and network traffic. The TabTransformer leverages the self-attention mechanism intrinsic to the Transformer architecture, effectively capturing contextual dependencies across different feature fields. This approach mitigates the limitations of conventional models, such as multilayer perceptrons (MLPs), in capturing high-order feature interactions. It is particularly well-suited to the PIoT, which is characterized by a mixture of categorical and continuous attributes.
We further utilize a Bidirectional Long Short-Term Memory (BiLSTM) network to model threat behaviors extracted from log sequences. The BiLSTM network captures temporal dependencies in both the forward and backward directions, enhancing the model’s capacity to interpret behavioral semantics and distinguish between threats.
We construct a structured input set , comprising both electrical-related and network-related features, and feed it to the TabTransformer. Categorical features are embedded into a continuous vector space via an embedding matrix , where V denotes the vocabulary size and is the embedding dimension. Continuous features are normalized using the function and subsequently incorporated into the feature set. The initial representation , where M denotes the number of categorical fields, is formed based solely on categorical embeddings. At the same time, continuous features are integrated downstream after Transformer encoding.
The categorical embeddings are then processed through L stacked Transformer encoder layers, each consisting of a multi-head self-attention (MHSA) mechanism and a feedforward network (FFN) as follows:
where denotes the multi-head self-attention mechanism that models inter-field dependencies and is the position-independent feedforward network.
After the final Transformer layer, the output is aggregated using field-wise attention pooling to obtain a fixed-level structured feature representation :
The pooling operation adaptively weights the contributions of different feature fields based on their learned importance scores.
For the transformed log sequences , each token is mapped to an embedding vector using either pre-trained word embeddings or character-level embeddings. The resulting sequence is then fed into the BiLSTM network:
The final semantic representation of the log, , is obtained by concatenating the forward and backward hidden states, followed by pooling:
Let . The fused representation is obtained via an L-layer MLP [37]:
where and denote the weight matrix and bias vector at each layer, and is a nonlinear activation function such as ReLU.
Finally, for threat localization, we train the model using the multi-class cross-entropy loss:
where C denotes the number of tactical categories, is the ground-truth label, and is the predicted probability derived from the softmax function.
3.4. MITRE ATT&CK-Based Threat Source Detection and Localization
To address the increasingly diverse and complex attack surface inherent in the PIoT, we propose a dual-stage threat detection and tactical localization mechanism based on the MITRE ATT&CK framework. The TabTransformer model encodes fused feature representations derived from electrical characteristics and network traffic in the first stage. These encoded features are subsequently fed into an MLP classifier utilizing a sigmoid activation function to produce a threat likelihood score. As a binary classifier, this stage differentiates between threat and benign events, effectively filtering out a large volume of non-malicious events.
The proposed method transitions to the second stage upon detecting a potential threat. Sequential behavioral logs are introduced and temporally modeled in this stage using a BiLSTM network. The resulting sequence embeddings are concatenated with the fused features from the first stage to form a comprehensive threat representation. This unified representation is fed into a multi-class MLP classifier, which utilizes a softmax activation function to produce a probability distribution across six consolidated ATT&CK tactical categories: Preparation, Initial Compromise, Persistence and Evasion, Lateral Movement, Control and Collection, and Exfiltration and Impact, as summarized in Table 3. By modeling the attack lifecycle from a tactical perspective, the proposed method reconstructs discrete alert events into coherent sequences of tactical execution. This improves the interpretability of detection results regarding cybersecurity semantics and enhances the model’s generalizability and practical applicability in real-world industrial environments.
Table 3.
Merged cybersecurity tactical categories.
4. Experiments
This section evaluates the effectiveness of the proposed domain knowledge-driven threat source detection and localization method on the PIoT threat dataset. The dataset and preprocessing procedures are first introduced, followed by the comparison methods and evaluation metrics. The experimental implementation details and hyperparameter settings are then provided. Finally, the overall experimental results are presented to analyze the contribution of each module, followed by a discussion of the experimental results.
4.1. Dataset Description
The dataset used in the experiments originates from the IoT infrastructure deployed by a provincial-level electric power utility. It comprises multi-source, heterogeneous data collected across three distinct layers: electrical, network communication, and behavioral layers.
Time-series data were initially collected from 120 intelligent sensors measuring current, voltage, and other electrical parameters at the electrical layer, resulting in over 6 million records. From this, we selected a diverse subset of approximately 200,000 records for model development and reproducible evaluation. This subset was chosen to capture a wide range of operating conditions, including steady-state and transient events, and includes instantaneous values (e.g., voltage and current) and derived metrics (e.g., RMS values, power factor, and frequency). This downsampling balances computational efficiency with maintaining robust coverage of power system behavior.
Approximately 4 GB of traffic data was extracted from a larger capture exceeding 15 GB at the network communication layer. The selected data include Modbus TCP and DNP3 protocol traffic, encompassing normal operations and synthetically injected attack sequences. Network features include session duration, protocol type, function codes, connection flags, byte counts, and error indicators—all of which are critical for detecting anomalies in communication patterns.
Over two months of device logs were collected at the behavioral layer, yielding more than 2.5 million entries. From these, we curated a subset of approximately 100,000 log entries for experimental use. This selection covers device configuration changes, fault messages, authentication attempts, and other operational activities. The curated subset preserves the temporal and contextual diversity of the full log pool while ensuring the data remains manageable for annotation and model training.
The annotation process employed a semi-automated pipeline combining rule-based pattern matching with script-assisted log parsing to generate initial labels. Techniques included regular expressions for known error codes, protocol signatures for attack traffic, and operational templates for benign events. A team of experienced grid operation and maintenance (O&M) experts manually validated and refined these labels using a structured annotation protocol guided by internal fault manuals and predefined attack scenarios.
Synthetic attack traffic was generated and embedded into real-world background data to ensure comprehensive coverage of diverse threat scenarios. Due to privacy and operational constraints, attack traces in critical infrastructure are often inaccessible, making synthetic generation a practical alternative. Attack scenarios were designed based on documented incidents in power systems and aligned with the MITRE ATT&CK framework, covering tactical categories such as initial access, execution, lateral movement, and data exfiltration. Simulated behaviors included unauthorized command injection, misuse of protocol functions (e.g., forced Modbus coil writes), credential abuse, and stealthy data exfiltration.
Synthetic sequences were sparsely inserted over time and across devices to preserve the statistical characteristics of normal operations. Behavioral logs were co-generated to reflect realistic system responses, such as error messages and unauthorized access events. Although synthetic traffic cannot fully reproduce the unpredictability of real-world APTs, it provides a controllable testbed for benchmarking under known ground truth. Operational engineers validated the scenarios to ensure consistency with realistic incident profiles. Each data record was annotated with a binary label (threat vs. benign) and, when applicable, a multi-class label corresponding to the attack stage.
The dataset was randomly split into training and testing subsets using an 80:20 ratio. This ratio balances sufficient training data to localize threats with adequate testing data to evaluate generalization capability. The split also preserves the distribution across threat stages, ensuring that the model is trained and tested on a representative dataset. The training set was used to optimize the detection model, while the testing set enabled robust evaluation of detection accuracy and localization performance under operational conditions.
4.2. Experimental Settings
All models were implemented using PyTorch 2.2.1 and trained on an NVIDIA RTX 3090 GPU with 24 GB of memory, providing sufficient computational capacity for handling large-scale data batches and complex model architectures. Each model was trained for up to 100 epochs with early stopping based on validation loss, using a patience of 10 epochs to prevent overfitting during plateau phases. The dataset was initially split into training and testing sets with a ratio of 8:2. From the training set, we further allocated 10% of the data as a validation set to support hyperparameter tuning and early stopping. This three-way split ensured that model selection and performance evaluation were conducted on disjoint data, reducing the risk of overfitting and data leakage. We applied targeted data augmentation techniques to the behavioral log sequence to improve robustness in scenarios with limited labeled attack samples. Specifically, we used random window slicing and temporal shuffling within each window (window length = 100) to simulate timing variability and non-deterministic log behavior. This encouraged the BiLSTM module to learn more generalizable temporal patterns rather than overfitting fixed log sequences.
4.3. Hyperparameter Tuning
As shown in Table 4, key hyperparameters were selected based on empirical performance and then fine-tuned via grid search. The embedding dimension for structured tabular features was set to , balancing expressive capacity and computational efficiency. The TabTransformer used attention heads to capture diverse feature interactions. For modeling sequential behavioral logs, the BiLSTM hidden size was configured as , allowing the network to capture long-range dependencies while maintaining manageable model complexity.
Table 4.
Hyperparameter search space and final selected values.
All models were trained using the Adam optimizer due to its adaptive learning rate and stability in noisy gradient environments. The initial learning rate was set to , a commonly practical value confirmed through grid search. A weight decay of was applied to prevent overfitting by regularizing the model weights.
A mini-batch size of 256 was adopted to achieve a good trade-off between training stability and GPU memory utilization. This batch size was empirically verified to support fast convergence without degrading model performance. Table 4 summarizes the search ranges and selected values.
4.4. Experimental Results
4.4.1. Experimental Evaluation of Threat Source Detection
We use the TabTransformer module to learn representations of structured features, including physical characteristics and network traffic. The generated embeddings were then fed into an MLP with multiple hidden layers for binary classification, distinguishing between threat and benign events. We conducted experiments on a real-world power threat IoT dataset to assess the model’s performance, using accuracy, precision, recall, and F1-score as evaluation metrics.
We repeated each experiment five times using different random seeds to ensure statistical reliability and report the mean and standard deviation (mean ± std) for each metric. The results are shown in Table 5.
Table 5.
Detection performance comparison of different model structures on the PIoT dataset.
As shown in Figure 3, the TabTransformer consistently outperformed MLP, TabNet, FT-Transformer, and 1D CNN across all evaluation metrics. Specifically, it achieved the highest F1-score (90.0%) compared to FT-Transformer (88.3%), TabNet (85.0%), and MLP (81.0%). We examined how the TabTransformer differed from other baselines to better understand the performance gap. Unlike MLP and TabNet, which apply fixed transformations across all inputs, the TabTransformer employs column-wise attention over categorical embeddings. This allows the model to capture nuanced relationships between operational states, protocol types, and device roles—interactions often underrepresented in conventional architectures. The TabTransformer also showed notable robustness under sparse or partially missing categorical inputs, a common occurrence in real-world sensor systems. Rather than relying on heuristic imputation, its attention mechanism dynamically prioritized the most informative features, improving stability and lowering false positive rates. Furthermore, its ability to jointly model mixed-type inputs was key. In our dataset, categorical attributes (e.g., port function) coexist with continuous features (e.g., voltage). The TabTransformer embeds categorical fields into a learned semantic space while integrating continuous features via residual connections, enabling effective cross-type dependency learning. This helps the model detect subtle anomalies, such as unusual combinations of communication behavior and physical signals, that MLPs or CNNs typically overlook.
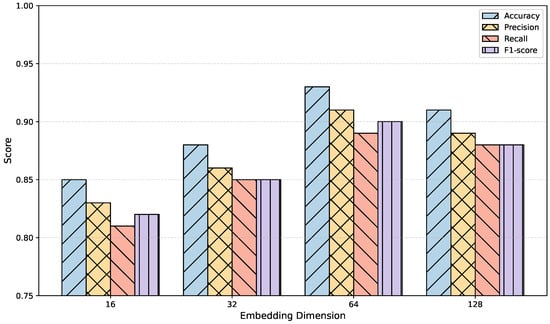
Figure 3.
Impact of embedding dimension on detection performance using the TabTransformer.
Additionally, as shown in Figure 3, we investigated the effect of the embedding dimension on the model’s performance within the TabTransformer. A smaller embedding dimension may restrict the model’s representational capacity, making it harder to capture complex semantic relationships between features. Conversely, a larger embedding dimension may offer richer representations but could also introduce redundant information, increasing training complexity and potentially leading to overfitting. To systematically evaluate the impact of hyperparameters on performance, we consistently kept the model architecture, number of training epochs, optimizer settings, and dataset split unchanged. The embedding dimension d was varied across 16, 32, 64, and 128, with the evaluation based on accuracy, precision, recall, and F1-score.
The results indicate that the model’s performance gradually improved as the embedding dimension increased from 16 to 64. This suggests that a higher-level vector space enhances the model’s nonlinear expressive capacity, effectively allowing the TabTransformer to differentiate between threat and benign samples. However, when the embedding dimension was increased to 128, slight declines were observed in some metrics, such as accuracy and F1-score. This suggests the model may suffer from redundant dimensions, leading to overfitting and reduced training efficiency.
This experiment further validates the sensitivity of structured feature modeling to the embedding dimension and emphasizes the need to balance model performance with computational cost in practical deployment. An embedding dimension that is too small limits the model’s expressiveness, while one that is too large incurs unnecessary computational overhead and generalization risks. Based on a comprehensive evaluation, we recommend using as the default embedding dimension for the TabTransformer to achieve optimal threat detection performance and resource efficiency.
4.4.2. Experimental Evaluation of Attack-Stage Localization
As shown in Table 6, we evaluated the effectiveness of the proposed method for localizing threat source attack stages. Under the complete model configuration, the technique demonstrated superior performance across all evaluation metrics. Each configuration was trained and evaluated independently five times to ensure statistical soundness. The table reports the average results along with the standard deviations.
Table 6.
Ablation study results for attack-stage localization: average accuracy (%) with standard deviation over five runs.
We conducted ablation experiments to further understand the contributions of different feature types and architectural components. The results revealed that each layer of features plays a vital and irreplaceable role in the model’s localization performance. Removing the electrical characteristics resulted in notable degradation, with the F1-score dropping to 90.5%. Similarly, excluding the network traffic features led to a further drop to 89.6%, emphasizing the importance of communication semantics in identifying threats such as command injections and unauthorized access. In contrast, removing the behavioral features caused a smaller decline, reducing the F1-score to 91.6%, suggesting that, while important, behavioral data alone may not suffice for precise localization without the context of system-layer information.
In addition to feature-level analysis, we replaced key model components to assess their impact on performance. When the TabTransformer module was substituted with a conventional MLP, the F1-score dropped significantly to 88.6%. This highlights the limitation of static feedforward structures in modeling complex tabular inputs, especially in capturing high-order interactions between categorical and continuous features. MLP treats each input dimension independently, without mechanisms to model semantic interdependencies. Replacing the TabTransformer with a 1D CNN slightly improved the F1-score to 89.5%, benefiting from the CNN’s ability to learn local temporal patterns. However, CNNs are inherently limited when handling unordered tabular features and lack flexibility for mixed-type data. FT-Transformer, a more advanced transformer-based baseline, achieved an F1-score of 91.0% due to its ability to model global attention across features. Nonetheless, it lacks the column-specific embedding mechanism of the TabTransformer, which proves more effective for heterogeneous sensor data with diverse semantics.
From an embedding perspective, the TabTransformer provides a distinct advantage in handling categorical inputs. It learns token embeddings per column and applies column-wise attention, enabling the model to distinguish attributes such as device role, protocol type, and command category, each contributing differently to threat inference. In contrast, the MLP and CNN typically rely on fixed encodings like one-hot or dense vectors, which lack adaptability in varying threat scenarios. Furthermore, the TabTransformer facilitates cross-type interaction modeling, allowing it to capture dependencies between categorical and continuous features—such as the interplay between protocol identifiers and voltage fluctuations—critical for identifying multi-stage threats in the PIoT. Its attention-based integration mechanism contributed to the highest F1-score (95.2%), confirming the benefit of context-aware feature fusion.
Finally, we observed a notable impact of the temporal modeling capacity. Replacing the BiLSTM network with a unidirectional LSTM network reduced the F1-score to 89.5%, indicating the necessity of bidirectional context for accurately capturing the temporal evolution of threat behaviors. BiLSTM enabled the model to integrate past and future states, which is particularly important when threat indicators span multiple behavioral events.
To investigate the impact of sequence length on model performance, we conducted experiments using varying sequence lengths of 20, 50, 100, and 200. Figure 4 illustrates the results across four key metrics: accuracy, precision, recall, and F1-score.
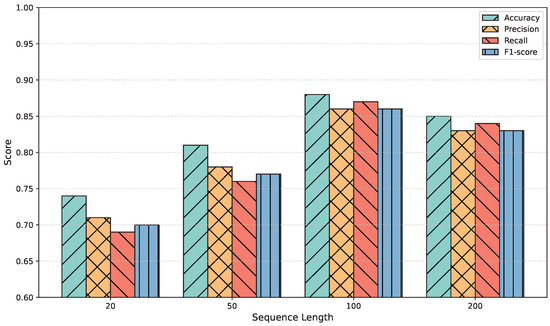
Figure 4.
Impact of sequence length on threat source attack-stage localization performance.
All performance metrics improved significantly as the sequence length increased from 20 to 100. Specifically, the F1-score increased from 70.0% to 86.0%, highlighting that extended sequences allow the model to capture more comprehensive temporal patterns associated with threat behaviors. However, when the sequence length was further increased to 200, a slight performance degradation was observed across all metrics. This decline is attributed to the introduction of redundant information and the increased difficulty of learning long-term dependencies, which may lead to overfitting or optimization challenges. Based on these observations, a sequence length of 100 was selected as the default setting for subsequent experiments.
The experiment results in the ’Experimental Evaluation of Attack-Stage Localization’ section demonstrate that the proposed multi-level PIoT threat feature engineering strategy and tailored neural network architecture offer substantial performance advantages for threat source localization in PIoT systems. Each feature group and model component is critical for achieving strong performance, validating the effectiveness of combining domain knowledge-guided feature engineering with deep learning. These findings have practical implications for enhancing the security and resilience of PIoT infrastructures.
While the proposed method demonstrates strong effectiveness in both controlled and real-world evaluation settings, its deployment in industrial environments may face practical challenges. Specifically, the strategy relies on domain-specific knowledge and high-quality labeled data, which can be challenging to obtain, particularly in large-scale or legacy power systems. Similarly, annotating threat events requires expert input, introducing additional operational costs. Nevertheless, our method has been successfully deployed and validated in practical scenarios, demonstrating its feasibility and adaptability when such knowledge is available or can be incrementally acquired. These observations suggest that, although some integration effort is required, domain-driven threat detection and localization remain viable and valuable solutions for enhancing PIoT security. Future work may further reduce this dependence by incorporating hybrid or self-supervised learning strategies to improve scalability in knowledge-constrained settings.
5. Conclusions
This paper proposes a threat detection and localization framework rooted in the intrinsic physical characteristics and operational behaviors of power systems. The proposed method significantly enhances the contextual adaptability and precision of threat source identification by integrating power-specific knowledge into the detection and localization pipeline. Unlike conventional techniques that rely on pattern-matching or statistical models, our method leverages prior domain knowledge to address critical challenges, including scenario-specific adaptability, precise localization during the attack stage, and the integration of heterogeneous data sources within power system environments. The architecture comprises a multi-level PIoT threat feature engineering module and a specialized threat detection and localization model tailored to the unique attributes of cyber-physical power systems (CPSs).
It is important to note that the acquisition of domain knowledge presents significant challenges in industrial practice. Data analysts and engineers are often required to derive insights from raw and unlabeled data, especially in dynamic system configurations or where proprietary knowledge is limited. This highlights a key trade-off in our proposed method: while domain knowledge enhances interpretability and performance, it limits scalability in knowledge-scarce environments. Despite their generally lower accuracy, unsupervised anomaly-detection methods offer a valuable alternative where annotated datasets or expert input are unavailable. As part of future work, we plan to explore hybrid approaches that combine lightweight domain priors with unsupervised or self-supervised learning mechanisms, thereby improving adaptability and generalization in real-world PIoT scenarios.
Additionally, future research will explore integrating online and transfer learning to enable continuous model adaptation in non-stationary environments. Similar works have investigated the Android platform [41]. Specifically, developing efficient incremental learning algorithms will be critical for supporting real-time threat detection without disrupting ongoing monitoring operations. Beyond internal data fusion, the framework can be extended to facilitate cross-departmental and cross-sectoral threat intelligence sharing, thereby enhancing coordinated cyber defense capabilities across power systems and other critical infrastructure sectors. Ultimately, this method establishes a multi-layered, cross-domain early warning and response system for cyber-physical security. We will also investigate how to adopt techniques like fuzzing [42] to expose vulnerable code in PIoT devices.
Author Contributions
Conceptualization, Z.G.; methodology, W.L.; software, J.G.; validation, Z.G., J.G., J.X. and Y.S.; formal analysis, J.X. and Y.S.; investigation, J.G., J.X. and Y.S.; resources, W.L.; data curation, J.X. and Y.S.; writing—original draft preparation, Z.G.; writing—review and editing, Z.G. and W.L.; visualization, J.G.; supervision, Z.G.; project administration, Z.G.; funding acquisition, Z.G. All authors have read and agreed to the published version of the manuscript.
Funding
This research was supported by the Management Science and Technology Program of the State Grid Corporation of China (SGCC) under the project titled “Research on Key Technologies for Vulnerability Mining and Security Assessment of Power Near-Field Networks and Edge Devices” (Project No. 5700-202418245A-1-1-ZN).
Data Availability Statement
All data for this article can be obtained by email from the corresponding author.
Conflicts of Interest
Authors were employed by the company State Grid Jiangsu Electric Power Co., Ltd. The authors declare that the research was conducted in the absence of any commercial or financial relationships that could be construed as a potential conflict of interest.
References
- Bedi, G.; Venayagamoorthy, G.K.; Singh, R.; Brooks, R.R.; Wang, K.C. Review of Internet of Things (IoT) in electric power and energy systems. IEEE Internet Things J. 2018, 5, 847–870. [Google Scholar] [CrossRef]
- Song, F.; Zhu, M.; Zhou, Y.; You, I.; Zhang, H. Smart collaborative tracking for ubiquitous power IoT in edge-cloud interplay domain. IEEE Internet Things J. 2019, 7, 6046–6055. [Google Scholar] [CrossRef]
- Zhang, X.; Chen, L.; Fan, J.; Wang, X.; Wang, Q. Power IoT security protection architecture based on zero trust framework. In Proceedings of the 2021 IEEE 5th International Conference on Cryptography, Security and Privacy (CSP), Zhuhai, China, 8–10 January 2021; IEEE: Toulouse, France, 2021; pp. 166–170. [Google Scholar]
- Sarjan, H.; Ameli, A.; Ghafouri, M. Cyber-security of industrial internet of things in electric power systems. IEEE Access 2022, 10, 92390–92409. [Google Scholar] [CrossRef]
- Chakrabarty, S.; Sikdar, B. Detection of Malicious Command Injection Attacks Against Static Var Compensators in Smart Grids. IEEE Trans. Smart Grid 2024, 15, 6142–6157. [Google Scholar] [CrossRef]
- Chakrabarty, S.; Sikdar, B. Unified Detection of Attacks Involving Injection of False Control Commands and Measurements in Transmission Systems of Smart Grids. IEEE Trans. Smart Grid 2022, 13, 1598–1610. [Google Scholar] [CrossRef]
- Wali, S.; Farrukh, Y.A.; Khan, I.; Hamilton, J.A. Covert penetrations: Analyzing and defending scada systems from stealth and hijacking attacks. Comput. Secur. 2025, 156, 104449. [Google Scholar] [CrossRef]
- Diaba, S.Y.; Elmusrati, M. Proposed algorithm for smart grid DDoS detection based on deep learning. Neural Netw. 2023, 159, 175–184. [Google Scholar] [CrossRef]
- Acarali, D.; Rao, K.R.; Rajarajan, M.; Chema, D.; Ginzburg, M. Modelling smart grid IT-OT dependencies for DDoS impact propagation. Comput. Secur. 2022, 112, 102528. [Google Scholar] [CrossRef]
- Reda, H.T.; Anwar, A.; Mahmood, A. Comprehensive survey and taxonomies of false data injection attacks in smart grids: Attack models, targets, and impacts. Renew. Sustain. Energy Rev. 2022, 163, 112423. [Google Scholar] [CrossRef]
- Li, Y.; Wei, X.; Li, Y.; Dong, Z.; Shahidehpour, M. Detection of false data injection attacks in smart grid: A secure federated deep learning approach. IEEE Trans. Smart Grid 2022, 13, 4862–4872. [Google Scholar] [CrossRef]
- Li, X.; Wang, Y.; Lu, Z. Graph-based detection for false data injection attacks in power grid. Energy 2023, 263, 125865. [Google Scholar] [CrossRef]
- Qaddos, A.; Yaseen, M.U.; Al-Shamayleh, A.S.; Imran, M.; Akhunzada, A.; Alharthi, S.Z. A novel intrusion detection framework for optimizing IoT security. Sci. Rep. 2024, 14, 21789. [Google Scholar] [CrossRef]
- Zhang, J.; Pan, L.; Han, Q.L.; Chen, C.; Wen, S.; Xiang, Y. Deep Learning Based Attack Detection for Cyber-Physical System Cybersecurity: A Survey. IEEE/CAA J. Autom. Sin. 2022, 9, 377–391. [Google Scholar] [CrossRef]
- Abshari, D.; Sridhar, M. A Survey of Anomaly Detection in Cyber-Physical Systems. arXiv 2025, arXiv:2502.13256. [Google Scholar]
- Krzysztoń, E.; Rojek, I.; Mikołajewski, D. A Comparative Analysis of Anomaly Detection Methods in IoT Networks: An Experimental Study. Appl. Sci. 2024, 14, 11545. [Google Scholar] [CrossRef]
- Bakhsh, S.A.; Khan, M.A.; Ahmed, F.; Alshehri, M.S.; Ali, H.; Ahmad, J. Enhancing IoT network security through deep learning-powered Intrusion Detection System. Internet Things 2023, 24, 100936. [Google Scholar] [CrossRef]
- Holubenko, V.; Gaspar, D.; Leal, R.; Silva, P. Autonomous intrusion detection for IoT: A decentralized and privacy preserving approach. Int. J. Inf. Secur. 2025, 24, 7. [Google Scholar] [CrossRef]
- Huang, X.; Khetan, A.; Cvitkovic, M.; Karnin, Z. Tabtransformer: Tabular data modeling using contextual embeddings. arXiv 2020, arXiv:2012.06678. [Google Scholar]
- Imrana, Y.; Xiang, Y.; Ali, L.; Abdul-Rauf, Z. A bidirectional LSTM deep learning approach for intrusion detection. Expert Syst. Appl. 2021, 185, 115524. [Google Scholar] [CrossRef]
- Sheng, C.; Zhou, W.; Ma, W.; Zhu, X.; Wen, S.; Xiang, Y. Network Traffic Fingerprinting for IIoT Device Identification: A Survey. IEEE Trans. Ind. Inform. 2025, 21, 3541–3554. [Google Scholar] [CrossRef]
- Zhong, M.; Lin, M.; Zhang, C.; Xu, Z. A survey on graph neural networks for intrusion detection systems: Methods, trends and challenges. Comput. Secur. 2024, 141, 103821. [Google Scholar] [CrossRef]
- Bala, B.; Behal, S. AI techniques for IoT-based DDoS attack detection: Taxonomies, comprehensive review and research challenges. Comput. Sci. Rev. 2024, 52, 100631. [Google Scholar] [CrossRef]
- Zohourian, A.; Dadkhah, S.; Molyneaux, H.; Neto, E.C.P.; Ghorbani, A.A. IoT-PRIDS: Leveraging packet representations for intrusion detection in IoT networks. Comput. Secur. 2024, 146, 104034. [Google Scholar] [CrossRef]
- Eskandari, M.; Janjua, Z.H.; Vecchio, M.; Antonelli, F. Passban IDS: An Intelligent Anomaly-Based Intrusion Detection System for IoT Edge Devices. IEEE Internet Things J. 2020, 7, 6882–6897. [Google Scholar] [CrossRef]
- Dong, Y.; Li, Q.; Wu, K.; Li, R.; Zhao, D.; Tyson, G.; Peng, J.; Jiang, Y.; Xia, S.; Xu, M. {HorusEye}: A realtime {IoT} malicious traffic detection framework using programmable switches. In Proceedings of the 32nd USENIX Security Symposium (USENIX Security 23), Anaheim, CA, USA, 9–11 August 2023; pp. 571–588. [Google Scholar]
- Wang, Z.; Li, J.; Yang, S.; Luo, X.; Li, D.; Mahmoodi, S. A lightweight IoT intrusion detection model based on improved BERT-of-Theseus. Expert Syst. Appl. 2024, 238, 122045. [Google Scholar] [CrossRef]
- Kuznetsov, O.; Zakharov, D.; Frontoni, E.; Maranesi, A. AttackNet: Enhancing biometric security via tailored convolutional neural network architectures for liveness detection. Comput. Secur. 2024, 141, 103828. [Google Scholar] [CrossRef]
- Khan, M.M.; Alkhathami, M. Anomaly detection in IoT-based healthcare: Machine learning for enhanced security. Sci. Rep. 2024, 14, 5872. [Google Scholar] [CrossRef]
- Liang, W.; Hu, Y.; Zhou, X.; Pan, Y.; Kevin, I.; Wang, K. Variational few-shot learning for microservice-oriented intrusion detection in distributed industrial IoT. IEEE Trans. Ind. Inform. 2021, 18, 5087–5095. [Google Scholar] [CrossRef]
- Zukaib, U.; Cui, X.; Zheng, C.; Hassan, M.; Shen, Z. Meta-IDS: Meta-learning based smart intrusion detection system for internet of medical things (IoMT) network. IEEE Internet Things J. 2024, 11, 23080–23095. [Google Scholar] [CrossRef]
- Diana, L.; Dini, P.; Paolini, D. Overview on Intrusion Detection Systems for Computers Networking Security. Computers 2025, 14, 87. [Google Scholar] [CrossRef]
- Cui, R.; Wang, J.; Wang, Y.; Wang, S.; Zhang, S.; Si, Y. Fault diagnosis of ship power grid based on attentional feature fusion and multi-scale 1D convolution. Electr. Power Syst. Res. 2025, 228, 111232. [Google Scholar] [CrossRef]
- Yan, H.; Ma, H.; Wen, M.; Dang, S.; Xu, H. Multi-Feature Fusion-Based Mechanical Fault Diagnosis for On-Load Tap Changers in Smart Grid with Electric Vehicles. IEEE Sens. J. 2021, 21, 1559–1568. [Google Scholar] [CrossRef]
- Guarino, F.; Vitale, F.; Flammini, L.; Faramondi, L.; Mazzocca, N.; Setola, R. A Two-Level Fusion Framework for Cyber-Physical Anomaly Detection. IEEE Trans. Ind.-Cyber-Phys. Syst. 2023, 2, 1–13. [Google Scholar] [CrossRef]
- Dong, X.; Jing, Z.; Dai, Y.; Wang, P.; Chen, Z. Failure prediction and replacement strategies for smart electricity meters based on field failure observation. Sensors 2022, 22, 9804. [Google Scholar] [CrossRef] [PubMed]
- Gibert, D.; Planes, J.; Mateu, C.; Le, Q. Fusing feature engineering and deep learning: A case study for malware classification. Expert Syst. Appl. 2022, 207, 117957. [Google Scholar] [CrossRef]
- Kiranyaz, S.; Avci, O.; Abdeljaber, O.; Ince, T.; Gabbouj, M.; Inman, D.J. 1D convolutional neural networks and applications: A survey. Mech. Syst. Signal Process. 2021, 151, 107398. [Google Scholar] [CrossRef]
- Gorishniy, Y.; Rubachev, I.; Khrulkov, V.; Babenko, A. Revisiting deep learning models for tabular data. Adv. Neural Inf. Process. Syst. 2021, 34, 18932–18943. [Google Scholar]
- Arik, S.Ö.; Pfister, T. Tabnet: Attentive interpretable tabular learning. In Proceedings of the AAAI Conference on Artificial Intelligence, Virtually, 2–9 February 2021; Volume 35, pp. 6679–6687. [Google Scholar]
- Chen, X.; Li, C.; Wang, D.; Wen, S.; Zhang, J.; Nepal, S.; Xiang, Y.; Ren, K. Android HIV: A study of repackaging malware for evading machine-learning detection. IEEE Trans. Inf. Forensics Secur. 2019, 15, 987–1001. [Google Scholar] [CrossRef]
- Zhu, X.; Wen, S.; Camtepe, S.; Xiang, Y. Fuzzing: A Survey for Roadmap. ACM Comput. Surv. 2022, 54, 1–36. [Google Scholar] [CrossRef]
Disclaimer/Publisher’s Note: The statements, opinions and data contained in all publications are solely those of the individual author(s) and contributor(s) and not of MDPI and/or the editor(s). MDPI and/or the editor(s) disclaim responsibility for any injury to people or property resulting from any ideas, methods, instructions or products referred to in the content. |
© 2025 by the authors. Licensee MDPI, Basel, Switzerland. This article is an open access article distributed under the terms and conditions of the Creative Commons Attribution (CC BY) license (https://creativecommons.org/licenses/by/4.0/).