Article

Attention-LightNet: A Lightweight Deep Learning Real-Time Defect Detection for Laser Sintering

by
Trishanu Das
1,
Asfak Ali
2,*,
Arunanshu Shekhar Kuar
1,
Sheli Sinha Chaudhuri
2 and
Nonso Nnamoko
3,*
1
Department of Production Engineering, Jadavpur University, Kolkata 700032, India
2
Department of Electronics and Telecommunication Engineering, Jadavpur University, Kolkata 700032, India
3
Department of Computer Science, Edge Hill University, Ormskirk L39 4QP, UK
*
Authors to whom correspondence should be addressed.
Electronics 2025, 14(13), 2674; https://doi.org/10.3390/electronics14132674
Submission received: 16 April 2025 / Revised: 22 June 2025 / Accepted: 30 June 2025 / Published: 1 July 2025
(This article belongs to the Section Artificial Intelligence)

Abstract

Part defects in additive manufacturing (AM) operations like laser sintering (LS) can negatively affect the quality and integrity of the manufactured parts. Therefore, it is important to understand and mitigate these part defects to improve the performance and safety of the manufactured parts. Integrating machine learning to detect part defects in AM can enable efficient, fast, and automated real-time monitoring, reducing the need for labor-intensive manual inspections. In this work, a novel approach incorporating a lightweight Visual Geometry Group (VGG) structure with soft attention is presented to detect powder bed defects (such as cracks, powder bed ditches, etc.) in laser sintering processes. The model was evaluated on a publicly accessible dataset (called LS Powder bed defects) containing 8514 images of powder bed images pre-split into training, validation, and testing sets. The proposed methodology achieved an accuracy of 98.40%, a precision of 97.45%, a recall of 99.40%, and an f1-score of 98.42% with a computation complexity of 0.797 GMACs. Furthermore, the proposed method achieved better performance than the state-of-the-art in terms of accuracy, precision, recall, and f1-score on LS powder bed images, while requiring lower computational power for real-time application.

1. Introduction

Three-dimensional (3D) printing is an additive manufacturing (AM) technique used to produce components with minimal material waste, reduced human intervention, and improved energy efficiency [1]. Laser sintering (LS) is a widely used AM technique in which a high-powered laser selectively fuses powdered materials like polyamide (PA 12), polystyrene, thermoplastic elastomers, and polypropylene [2]. This layer-by-layer fusion process creates solid objects based on a computer-aided design (CAD) model, enabling the production of complex geometries and intricate designs without the need for support structures. To meet industrial standards for large-scale production, effective quality management is essential to monitor and optimize the quality of the produced parts [3].
The quality of the fabricated parts depends on the fusion bonding among consecutive powder layers and hatches, the stability of powder distribution, and the integrity of the powder bed [4]. Powders with consistent particle size distribution and suitable material properties promote better fabrication. In order to manufacture a high-quality fabricated part, a uniform, clean powder bed with no irregularities is desirable [3]. Powder bed defects like part edges, part accumulation, and powder trenches pose a threat to controlling the quality of the fabricated parts. Understanding these defects is crucial as they result in increased material wastage, additional cost, and lower efficiency [4]. Table 1 shows some common powder bed defects, their causes, and potential mitigation strategies. Figure 1a,b highlights examples of powder beds without and with irregularities, respectively.
The early detection of powder bed defects leads to immediate corrective measures, ensuring part quality while reducing costs and waste [4]. Defect detection technology for AM must be affordable, capable of fast detection, adaptable to complex geometries, and able to detect multiple defects. Defect detection methods are typically categorized into two types: traditional non-destructive defect detection technology and machine learning-based defect detection processes [5].
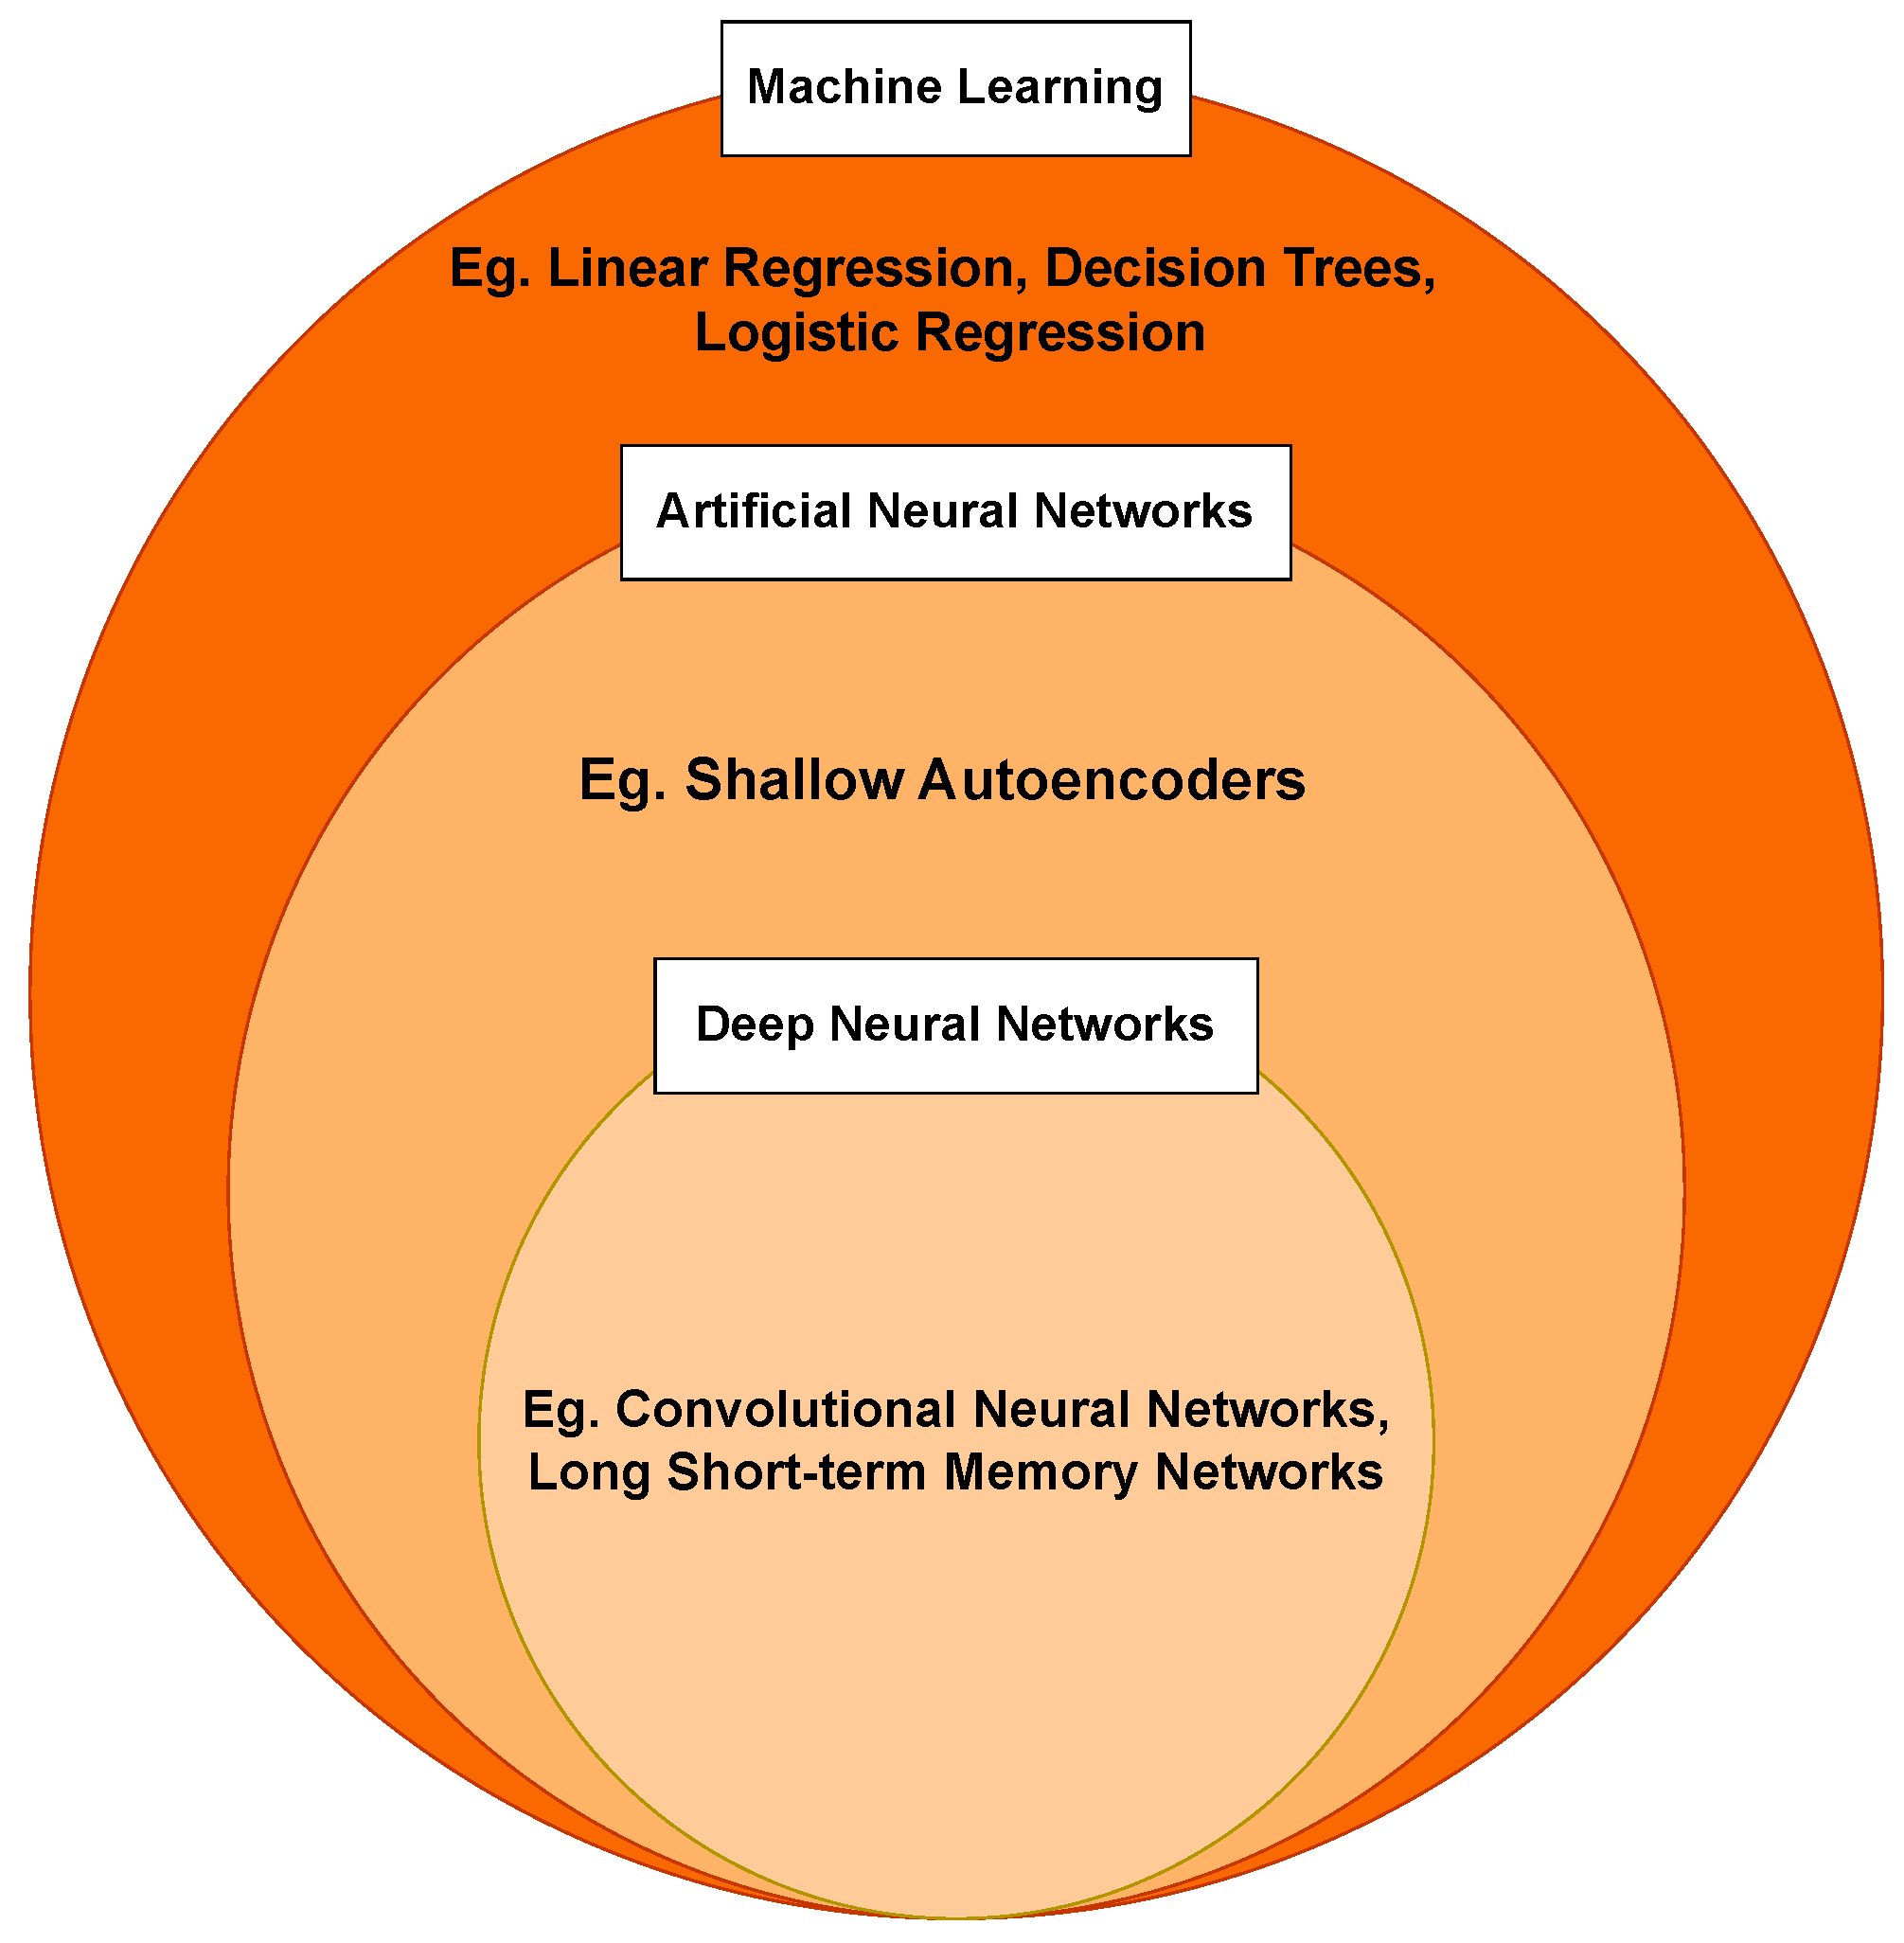
In recent years, machine learning (ML) has gained popularity in the AM domain [6] and has proven effective in optimizing process parameters that affect part build quality. It is also being employed in in situ monitoring systems to establish an efficient defect detection process. By utilizing training datasets, ML algorithms can identify patterns and make inferences on test datasets. A hierarchical relationship among the ML algorithms is summarized in the diagram shown in Figure 2.
Traditional ML algorithms rely on well-defined features, requiring extensive feature extraction and engineering [8]. This limitation is addressed by advanced DL algorithms, which automatically extract relevant features. However, DL algorithms demand substantial computational resources for improved robustness and accuracy. This paper makes the following contributions to the field:
  • A lightweight VGG-based architecture with an integrated novel soft-attention mechanism, requiring 104 times fewer parameters than VGGNet, minimizing computational resources and enabling deployment on low-end devices.
  • The architecture outperforms state-of-the-art models in Accuracy, Precision, Recall, and F1 score on the same dataset, with nearly 10 times fewer MAC operations.
The paper is organized as follows: Section 2 reviews the existing research related to the proposed study. Section 3 details the proposed architecture and model intricacies. Section 4 presents the experimental results, with analysis and discussion. Section 5 summarizes the work, highlighting the advantages, limitations, and future potential of the proposed architecture.

2. Literature Survey

The application of deep convolutional neural networks (CNNs) in large-scale image classification has become widespread [9]. The use of CNNs, transfer learning techniques, and ensemble methods has demonstrated promising outcomes in the field of additive manufacturing (AM) [10,11,12,13,14].
Notably, Westphal et al. [3] proposed a novel approach using VGG16 and Xception networks for defect detection in powder bed images obtained during the laser sintering (LS) manufacturing process. Random oversampling and undersampling were employed to address the class imbalance problem. The VGG16 architecture achieved the highest performance, with a classification accuracy of 97.10% on non-augmented data. Abhilash et al. [15] proposed a Residual Neural Network (ResNet50)-based model that achieved 96% accuracy in predicting the surface condition in a selective laser melting (SLM) process, followed by wire electric discharge polishing (WEDP) to polish the surfaces of the manufactured components. Kim et al. [16] employed a failure detection model using the VGG19 CNN to detect the filament tangling phenomenon, known as the “spaghetti-shape-error”, in metal extrusion processes, achieving 97% accuracy. Pandiyan et al. [17] demonstrated the technique of transfer learning using two networks, VGG16 and ResNet18, trained on spectrograms of acoustic emissions from the laser powder bed fusion (LPBF) process of stainless steel. These networks were retrained using transfer learning on the spectrograms of LPBF processes involving bronze for a similar classification problem. Jin et al. [18] proposed an autonomous correction system for Fused Deposition Modeling (FDM), incorporating a pre-trained ResNet50, which achieved over 98% accuracy in defect detection and used a feedback loop to adjust 3D printing parameters, ensuring a defect-free design by self-correcting issues like over-extrusion or under-extrusion.
Among the contemporary studies, Westphal et al. [3] stands out for achieving the highest reported performance, with a classification accuracy of 97.10%. Their use of a publicly available dataset is particularly useful for this research, as it facilitates a direct comparison with the approach presented here. Ansari et al. [19] also used a dataset labeled with CAD design data and post-build X-ray computed tomography (XCT) scans. Data augmentation techniques, including vertical and horizontal flips, were applied to address the class imbalance. A novel CNN architecture, tuned using a hyper-band optimization algorithm, achieved 90% accuracy on CAD design-labeled images and 97% accuracy on XCT-assisted labeled images. Cue et al. [20] conducted extensive experiments to assess the impact of various CNN hyperparameters, such as L2 regularization, dropout rates, and the number of convolution layers, on the performance of a network trained on a laser metal deposition dataset. The final architecture achieved an accuracy of 92.1% with a latency of 8.01 milliseconds during image classification. Caggiano et al. [21] devised a bi-stream deep CNN architecture with skip connections for online defect detection in SLM processes due to improper process conditions. This algorithm implemented a feature fusion technique while analyzing both SLM powder layers and part slices images, achieving a high accuracy of 99.4%.
Bimrose et al. [22] trained an ML model based on the ResNet-34 architecture to automatically detect hidden defects in AM parts using their X-ray CT images, achieving an accuracy of over 98% in fewer than 50 epochs with approximately 1000 images. Ruan et al. [23] proposed EPSC-YOLOv9 to improve defect detection in industrial surfaces by detecting small and complex-shaped defects. The algorithm, which incorporated efficient multi-scale attention mechanisms and pyramid convolutions in the backbone network, achieved superior performance compared to YOLOv9c, YOLOv10, and MSFT-YOLO. The methodology also incorporated Soft-NMS and a new convolution attention module called the CISBA module, which improved the detection of small targets in complex backgrounds. Notably, this method demonstrated excellent performance on the NEU-DET and GC10-DET datasets. Abdalla et al. [24] introduced an ensemble of deep neural networks trained on various features representing drugs and polymeric materials to predict the printability of drug formulations using LS. The model achieved over 90% accuracy when trained on Morgan fingerprint (MFP) features. Xiang et al. [25] proposed a novel defect detection network named BMA-YOLO, incorporating three modules: Block-wise Feature Fusion Convolution (BFFConv) to reduce model complexity, Multidimensional Convolutional Depooling Attention (MCDA) to improve contextual understanding, and an Auxiliary Training Head (AuxHead) to enhance model stability and generalization. The proposed model achieved impressive results with a mean Average Precision (mAP@0.5) of 77.7% on the NEU-DET dataset, 99.4% on the DAGM2007 dataset, and 95.4% on the PCB-DET dataset, making the model robust and scalable for industrial surface defect detection.
Zhao et al. [26] proposed a real-time defect detection system for Laser Powder Bed Fusion using 3D point cloud data and deep learning. They compared PointNet, PointNet++, and Point Cloud Transformer (PCT), with PCT achieving the best performance (mean Intersection over Union (mIoU): 82.83%, overall segmentation accuracy (OA): 98.34%). However, these models struggled to detect small and complex defects due to feature loss during downsampling. To overcome this issue, the authors introduced a 2D projection-based approach using DeepLabV3+, which improved accuracy and reduced inference time to 11 ms per layer. The system was deployed in a closed-loop control setup, achieving 100% defect correction with zero false detections in real-world printing tests. Ero et al. [27] proposed a novel methodology consisting of a self-organizing map, a fuzzy logic scheme, and a tailored U-Net architecture for in situ defect detection during the LPBF process using optical tomography (OT) data. The proposed model demonstrated high performance, with defect probability scores ranging from 0.375 to 0.819 for lack of fusion defects and from 0.391 to 0.616 for intentional keyhole defects. This framework also allowed the integration of expert knowledge through customizable fuzzy rules, enhancing its adaptability and interpretability, making it a practical tool for real-time quality assurance in additive manufacturing. Nevertheless, the dataset provided by Westphal et al. [3] remains particularly well-aligned with the focus of this paper, making it an ideal choice for comparison with the approach proposed here.

3. Materials and Methods

This section provides a detailed description of the proposed model, focusing on the architecture and its key components. It introduces a lightweight, soft-attention-based CNN framework for classifying powder bed images, which uses fewer parameters than state-of-the-art models like VGG19 and ResNet50, making it more computationally efficient.

3.1. Soft-Attention

In classification tasks, only a small portion of a powder bed image is relevant, while the rest of the image can be considered unimportant. Therefore, the model must focus on the relevant regions. This is achieved through the proposed soft-attention mechanism. Building upon the work of Tomita et al. [28] in detecting cancerous and precancerous esophagus tissues, and Xu et al. [29] in image caption generation, this paper uses 3D-convolution-based soft attention [30] to highlight the pertinent regions of the image required for classification.
The soft-attention module takes a feature tensor t as input [28,31]. As shown in Figure 3, this tensor t R w × h × d is convolved with a 3D convolution layer containing weights W k R w × h × d × K , where K is the number of 3D weights. The resulting feature maps are passed through a softmax activation layer to generate K = 16 attention or context-aware maps. These maps are then aggregated to form a unified feature map, denoted by β , which is multiplied by the original feature tensor t to produce the final tensor κ .
In this work, we apply a 3D-convolution-based soft-attention mechanism in the context of 2D image analysis to effectively capture inter-channel and spatial feature dependencies, which are critical for identifying fine-grained powder bed defects such as cracks and ditches. While traditional 2D attention mechanisms operate primarily along spatial dimensions, the 3D convolutional structure allows the model to jointly encode information across the channel and spatial dimensions, thus enabling more expressive feature learning without a significant increase in computational complexity. The 3D convolution operates over the intermediate feature maps rather than the raw 3D data, effectively modeling context across adjacent layers in a compact form. This design choice was found to offer improved defect localization and representation capacity during our experiments.
Gradient-weighted Class Activation Maps (GradCAM) [32] is a visualization technique used in deep learning that highlights the relevant features of an image used to predict the target class. It produces a localization map by computing the gradients of the error for the particular target class with respect to the feature maps for a particular convolutional layer. Figure 4 demonstrates the credibility of the Soft-Attention block with the help of GradCAM applied on the max-pooling layer after the Soft-Attention block. Areas with higher activation are denoted in red. The Soft-Attention block helps the model to focus on relevant parts of the powder bed required for classification and also plays an important role in making the architecture lightweight yet powerful, surpassing all state-of-the-art models in terms of performance, as demonstrated in the ablation study in Section 4.5.

3.2. VGG

Simonyan et al. [33] introduced a very deep convolutional neural network called VGG19 that achieved state-of-the-art results on the ImageNet Large Scale Visual Recognition Challenge (ILSVRC) [34]. In comparison to VGG16, the VGG19 network has nineteen weight layers in total. The feature extractor of the architecture consists of sixteen convolutional layers organized into five blocks, each followed by a max-pooling layer of size 2 × 2 and a stride of two. The convolutional layers have a filter size of 3 × 3 with a stride of one and a padding of one in order to preserve the spatial features. ReLU [35] serves as the activation function in the network. Block one includes two convolutional layers with sixty-four filters, while block two consists of two convolutional layers with 128 filters. Block three comprises four convolutional layers with 256 filters, and Blocks four and five each contain four convolutional layers with 512 filters.

3.3. Proposed Method

In our experiments, a custom-made lightweight architecture based on soft attention was utilized to classify LS powder bed images. Similar to the VGG19 architecture, the proposed design comprises sixteen convolutional neural network layers divided into five blocks. Each convolutional neural network layer has a filter size of 3 × 3 with a stride of one and padding of one. This is followed by a batch normalization layer to (a) address the problem of internal covariate shift [36], (b) inject slight regularization, and (c) ensure stable gradient flow for improved neural network training. Subsequently, a Parametric Rectified Linear Unit (PReLU) activation layer [37] is implemented to facilitate enhanced model training while minimizing the risk of over-fitting.
In the feature extractor part of the architecture, every block except the last one is followed by a max-pooling layer of size 2 × 2 . Block one comprises two convolutional layers with 16 filters, while block two has two convolutional layers with 32 filters. Block three contains four convolutional layers with 64 filters, and blocks four and five each consist of four convolutional layers with 128 filters.
The features from the last convolutional layer are passed into the soft-attention layer, which gives κ as the output. Subsequently, a max-pooling layer with a size of 2 × 2 and a stride of one was applied on κ , resulting in an output tensor γ . A residual connection from the last convolutional layer is passed to a max-pooling layer with a size of 2 × 2 and a stride of one, which is then concatenated with the tensor γ . The resulting feature map is followed by a PReLU activation layer that is followed by a global average pooling and a batch-normalization layer. A linear layer with 256 units was applied next, followed by a PReLU layer and a batch normalization layer. A linear layer with two units was finally applied to classify the images. Figure 5 illustrates the system architecture and data flow.

4. Experiments and Results

This section discusses the dataset and the training procedure used for training the model. It also provides a detailed discussion and analysis of the results obtained from the experiments.

4.1. Dataset Description

The proposed model was trained and evaluated on the dataset contributed by Westphal et al. [3], without applying any data augmentation techniques. This dataset originally contained 9426 LS powder bed images. After removing unnecessary images, 8514 images were retained. Black borders were cropped from the edges, and each image was resized so that its shorter side measured 180 pixels. A centered square crop of size 180 × 180 pixels was then extracted from each image. The images were manually labeled based on domain expertise, resulting in 7808 images classified as ‘OK’ and 706 as ‘DEF’. To address class imbalance, Westphal et al. [3] applied random undersampling to reduce the number of ‘OK’ images to 2000 and performed oversampling of the ‘DEF’ images to increase their count to 2000, thereby creating a balanced dataset with a total of 4000 images. The balanced dataset was then split into training, validation, and testing datasets by the authors. The training dataset consists of 2000 images with 1000 images in each class. Both the validation and the test dataset contains 1000 images with 500 images belonging to each class. The dataset split and class distribution is in Table 2.

4.2. Experimental Setup and Hyperparameter Tuning

For all the experiments, a three-fold cross-validation sampling strategy was followed. Each fold was trained for 15 epochs with a batch size of 64, using an early stopping mechanism set with patience of 10. The network was trained using the Adam optimizer [38] with a learning rate of 3 × 10 4 and a weight decay of 5 × 10 4 . Cross-entropy was used as the loss function, with a label smoothing factor of 0.1 to prevent model over-fitting and to enhance training stability. The learning rate was scheduled to reduce by a factor of 0.2 with a patience of 5. All the experiments were performed using the PyTorch v2.7.0 framework on a P100 GPU on Kaggle. The hyperparameters used in the architecture are listed in Table 3.
Figure 6 shows the training and validation loss and accuracy plots of the proposed approach.

4.3. Evaluation Metrics

Before presenting the metrics used to evaluate the proposed methodology, it is essential to define the fundamental concepts underlying these metrics. A True Positive (TP) refers to samples where both the true label and the predicted label are classified as positive. A True Negative (TN) represents samples where both the true label and the predicted label are classified as negative. False Positives (FP) are instances that the model incorrectly classifies as positive when their true labels are negative. Conversely, False Negatives (FN) are instances that the model incorrectly classifies as negative when their true labels are positive.
The model was evaluated using four primary metrics: accuracy, precision, recall, and F1-score. Accuracy, as defined in Equation (1), is the ratio of correctly predicted instances to the total number of samples in the dataset [39]. Precision, as given in Equation (2), is the proportion of true positive instances among all instances predicted as positive by the model. Recall, defined in Equation (3), is the ratio of true positive instances to the total number of actual positive samples. Finally, the F1-score, expressed in Equation (4), is the harmonic mean of precision and recall.
Accuracy = T P + T N T P + T N + F P + F N
Precision = T P T P + F P
Recall = T P T P + F N
F 1 - score = 2 × Precision × Recall Precision + Recall = 2 × T P 2 × T P + F P + F N

4.4. Results and Analysis

The proposed method is evaluated on the test dataset to ensure model generalization and efficacy. The proposed architecture achieved an accuracy of 98.40%, precision of 97.45%, recall of 99.40%, and f1-score of 98.42%. The proposed architecture has 1.33 million parameters and a computational complexity of 0.797 GMacs. The model executed at 218.575 FPS on a 16 GB P100 GPU with 29 GB of RAM, at 185.473 FPS on a system with an RTX 3060 GPU with 16 GB of RAM, and at 34.136 FPS when offloaded to the CPU of the same system. Figure 7 shows the confusion matrix to support this claim.
Table 4 compares the proposed methodology with the technique proposed by Westphal et al. [3], which utilizes transfer-learning techniques due to the scarcity of sufficient data, along with other lightweight state-of-the-art models. Evidently, the proposed architecture outperforms the models proposed by Westphal et al. [3] on all metrics while having fewer parameters and being less computationally expensive. Moreover, the proposed method outperforms other lightweight state-of-the-art models such as ShuffleNet_V2 and MobileNet_V3_Small. Recent models like Vision Transformer (ViT) and Swin Transformer also show a lower performance compared to the proposed approach.
To ensure the efficacy of the proposed model, t-SNE visualization is utilized to analyze the ability of the proposed architecture to distinguish between the two classes. The t-SNE plot depicts the feature representation of all samples in the test dataset. It is notable (from Figure 8) that the clusters representing the two classes are well separated, indicating the strong differentiation power of the proposed architecture. This separation between the two clusters indicates the model’s capability to capture relevant features characteristic of each class, thereby helping in accurate classification. Despite the majority of samples being correctly grouped, some overlap is also observed, indicating misclassifications by the proposed architecture. This analysis highlights the strengths and weaknesses of the proposed model, suggesting opportunities for further improvement. The proposed model achieves an AUC score of 98.40%, as shown in Figure 9.

4.5. Ablation Study

Ablation analysis was initially performed to demonstrate and validate the efficacy of the proposed model by varying the number of filters in the CNN network as shown in Table 5. Since the proposed model is similar to the VGG19 architecture, the number of filters present in the convolutional network was varied by a factor of 1, 2, 4, and 8 relative to the network. Notably, the network achieved the highest performance when the filters of the convolutional layers were reduced by a factor of 4, and it only has 1.33 million parameters.
Table 6 illustrates the results of another ablation study conducted to demonstrate the impact of the soft attention mechanism on the proposed model. The results clearly show that the modified VGG19 model integrated with soft attention significantly outperforms the baseline modified VGG19 model by 2% in terms of accuracy and F1-score. We also conducted a comparison using a modified VGG19 model integrated with SE and CBAM attention modules, which yielded lower accuracies by approximately 1% and 1.2%, respectively, compared to our proposed approach. This performance improvement highlights the effectiveness of the soft attention module, which enables the model to selectively focus on the most important regions of the input image, thereby enhancing its classification capability.
Table 7 presents the inference time of the proposed model across a range of hardware platforms, including both CPUs and GPUs. The results demonstrate the model’s adaptability and efficiency on diverse computational environments. On high-performance GPUs such as the NVIDIA Tesla P100, the model achieves extremely fast inference (0.0027 s), while still maintaining reasonable performance on edge devices like the Jetson Nano and Raspberry Pi. This highlights the suitability of the proposed model for deployment in both cloud-based and resource-constrained real-time applications.

5. Conclusions

The process of in situ defect detection in the field of AM is growing in importance. This work introduces a lightweight CNN architecture paired with a Soft-Attention mechanism for classifying powder bed images. Extensive experimentation and detailed analysis demonstrates that the model not only achieves better performance compared to previous work but also has fewer parameters, thereby facilitating deployment on lighter devices. The proposed model achieved an accuracy of 98.40% and AUC score of 98.40%, as shown in Figure 9, which is only 0.9% lower than existing work, with nearly 10 times less computational complexity than the state-of-the-art. However, there are some limitations. The model was tested on a small dataset due to the lack of available datasets in this domain. This limitation affects the generalizability of the results, and further testing on larger datasets is required to validate its robustness.
As part of future work, we aim to develop a larger and more diverse dataset to evaluate the model’s performance across a broader range of scenarios. Additionally, we plan to address the limitations of the proposed architecture by optimizing its computational efficiency, thereby further reducing the carbon footprint during both training and inference. We also intend to explore various data augmentation techniques to enhance the model’s robustness and improve its generalization capabilities. Furthermore, we aim to extend the applicability of our model to metallic powder materials in future studies by evaluating its adaptability across diverse material domains. Given the image-based nature of the task, the model can be efficiently retrained using datasets that consist of metallic powder bed images. Although the proposed approach demonstrates strong performance on the current dataset, its ability to handle real-world industrial challenges, such as variations in illumination and sensor noise, remains a limitation. Addressing these issues will be a key focus of our future research.
Moreover, a real-time, in situ process monitoring system could be developed to observe the powder bed during the build process. This system would employ a camera mounted within the build chamber to capture layer-wise images of the powder bed during printing. These images would then be processed in real time using the proposed model deployed on platforms such as an Intel Xeon 2.20 GHz CPU, an NVIDIA Tesla P100 GPU, or any edge device. By quantizing the model to FP16, significant speedups could be achieved on edge devices. Upon completion of the build, a comprehensive diagnostic report could be generated based on the layer-by-layer analysis. Additionally, a closed-loop feedback control system could be designed to dynamically adjust process parameters in response to the in situ diagnostic results for each layer, leading to significant improvements in part quality and process stability within powder bed fusion (PBF) additive manufacturing.

Author Contributions

Formal analysis, investigation, validation, data curation, visualization, writing—original draft preparation, conceptualization, methodology T.D. and A.A.; software, resources T.D.; validation, project administration A.S.K., S.S.C. and N.N.; supervision, writing—review and editing A.A. and N.N. All authors have read and agreed to the published version of the manuscript.

Funding

This research received no external funding.

Data Availability Statement

All datasets used for this study is publicly available on Mendeley Dataset entitled LS Powder bed defects (https://data.mendeley.com/datasets/2yzjmp52fw/1, accessed on 1 April 2025).

Conflicts of Interest

The authors declare no financial interests. However, the corresponding author [NN] is an editor for the special issue of J. Electronics and requests to be excluded from all editorial processes related to this manuscript.

References

  1. Jandyal, A.; Chaturvedi, I.; Wazir, I.; Raina, A.; Haq, M.I.U. 3D printing—A review of processes, materials and applications in industry 4.0. Sustain. Oper. Comput. 2022, 3, 33–42. [Google Scholar] [CrossRef]
  2. Mazzoli, A. Selective laser sintering in biomedical engineering. Med. Biol. Eng. Comput. 2013, 51, 245–256. [Google Scholar] [CrossRef] [PubMed]
  3. Westphal, E.; Seitz, H. A machine learning method for defect detection and visualization in selective laser sintering based on convolutional neural networks. Addit. Manuf. 2021, 41, 101965. [Google Scholar] [CrossRef]
  4. Xiao, L.; Lu, M.; Huang, H. Detection of powder bed defects in selective laser sintering using convolutional neural network. Int. J. Adv. Manuf. Technol. 2020, 107, 2485–2496. [Google Scholar] [CrossRef]
  5. Chen, Y.; Peng, X.; Kong, L.; Dong, G.; Remani, A.; Leach, R. Defect inspection technologies for additive manufacturing. Int. J. Extrem. Manuf. 2021, 3, 022002. [Google Scholar] [CrossRef]
  6. Meng, L.; McWilliams, B.; Jarosinski, W.; Park, H.Y.; Jung, Y.G.; Lee, J.; Zhang, J. Machine learning in additive manufacturing: A review. JOM 2020, 72, 2363–2377. [Google Scholar] [CrossRef]
  7. Goodfellow, I.; Bengio, Y.; Courville, A. Deep Learning; Springer: Berlin/Heidelberg, Germany, 2018; Volume 19, pp. 305–307. [Google Scholar]
  8. Janiesch, C.; Zschech, P.; Heinrich, K. Machine learning and deep learning. Electron. Mark. 2021, 31, 685–695. [Google Scholar] [CrossRef]
  9. Krizhevsky, A.; Sutskever, I.; Hinton, G.E. ImageNet classification with deep convolutional neural networks. Commun. ACM 2017, 60, 84–90. [Google Scholar] [CrossRef]
  10. Zhu, Z.; Ferreira, K.; Anwer, N.; Mathieu, L.; Guo, K.; Qiao, L. Convolutional neural network for geometric deviation prediction in additive manufacturing. Procedia Cirp 2020, 91, 534–539. [Google Scholar] [CrossRef]
  11. Banadaki, Y.; Razaviarab, N.; Fekrmandi, H.; Sharifi, S. Toward enabling a reliable quality monitoring system for additive manufacturing process using deep convolutional neural networks. arXiv 2020, arXiv:2003.08749. [Google Scholar]
  12. Scime, L.; Beuth, J. A multi-scale convolutional neural network for autonomous anomaly detection and classification in a laser powder bed fusion additive manufacturing process. Addit. Manuf. 2018, 24, 273–286. [Google Scholar] [CrossRef]
  13. Balu, A.; Ghadai, S.; Lore, K.G.; Young, G.; Krishnamurthy, A.; Sarkar, S. Learning localized geometric features using 3d-cnn: An application to manufacturability analysis of drilled holes. arXiv 2016, arXiv:1612.02141. [Google Scholar]
  14. Li, Z.; Zhang, Z.; Shi, J.; Wu, D. Prediction of surface roughness in extrusion-based additive manufacturing with machine learning. Robot. Comput.-Integr. Manuf. 2019, 57, 488–495. [Google Scholar] [CrossRef]
  15. Abhilash, P.; Ahmed, A. Convolutional neural network–based classification for improving the surface quality of metal additive manufactured components. Int. J. Adv. Manuf. Technol. 2023, 126, 3873–3885. [Google Scholar] [CrossRef]
  16. Kim, H.; Lee, H.; Kim, J.S.; Ahn, S.H. Image-based failure detection for material extrusion process using a convolutional neural network. Int. J. Adv. Manuf. Technol. 2020, 111, 1291–1302. [Google Scholar] [CrossRef]
  17. Pandiyan, V.; Drissi-Daoudi, R.; Shevchik, S.; Masinelli, G.; Le-Quang, T.; Loge, R.; Wasmer, K. Deep transfer learning of additive manufacturing mechanisms across materials in metal-based laser powder bed fusion process. J. Mater. Process. Technol. 2022, 303, 117531. [Google Scholar] [CrossRef]
  18. Jin, Z.; Zhang, Z.; Gu, G.X. Autonomous in-situ correction of fused deposition modeling printers using computer vision and deep learning. Manuf. Lett. 2019, 22, 11–15. [Google Scholar] [CrossRef]
  19. Ansari, M.A.; Crampton, A.; Garrard, R.; Cai, B.; Attallah, M. A Convolutional Neural Network (CNN) classification to identify the presence of pores in powder bed fusion images. Int. J. Adv. Manuf. Technol. 2022, 120, 5133–5150. [Google Scholar] [CrossRef]
  20. Cui, W.; Zhang, Y.; Zhang, X.; Li, L.; Liou, F. Metal additive manufacturing parts inspection using convolutional neural network. Appl. Sci. 2020, 10, 545. [Google Scholar] [CrossRef]
  21. Caggiano, A.; Zhang, J.; Alfieri, V.; Caiazzo, F.; Gao, R.; Teti, R. Machine learning-based image processing for on-line defect recognition in additive manufacturing. CIRP Ann. 2019, 68, 451–454. [Google Scholar] [CrossRef]
  22. Bimrose, M.V.; Hu, T.; McGregor, D.J.; Wang, J.; Tawfick, S.; Shao, C.; Liu, Z.; King, W.P. Automatic detection of hidden defects and qualification of additively manufactured parts using X-ray computed tomography and computer vision. Manuf. Lett. 2024, 41, 1216–1224. [Google Scholar] [CrossRef]
  23. Ruan, S.; Zhan, C.; Liu, B.; Wan, Q.; Song, K. A high precision YOLO model for surface defect detection based on PyConv and CISBA. Sci. Rep. 2025, 15, 15841. [Google Scholar] [CrossRef] [PubMed]
  24. Abdalla, Y.; Ferianc, M.; Awad, A.; Kim, J.; Elbadawi, M.; Basit, A.W.; Orlu, M.; Rodrigues, M. Smart laser Sintering: Deep Learning-Powered powder bed fusion 3D printing in precision medicine. Int. J. Pharm. 2024, 661, 124440. [Google Scholar] [CrossRef] [PubMed]
  25. Xiang, Z.; Jia, J.; Zhou, K.; Qian, M.; Wu, W. Block-wise feature fusion for high-precision industrial surface defect detection. In The Visual Computer; Springer: Berlin/Heidelberg, Germany, 2025; pp. 1–19. [Google Scholar]
  26. Zhao, J.; Yang, Z.; Chen, Q.; Zhang, C.; Zhao, J.; Zhang, G.; Dong, F.; Liu, S. Real-time detection of powder bed defects in laser powder bed fusion using deep learning on 3D point clouds. Virtual Phys. Prototyp. 2025, 20, e2449171. [Google Scholar] [CrossRef]
  27. Ero, O.; Taherkhani, K.; Hemmati, Y.; Toyserkani, E. An integrated fuzzy logic and machine learning platform for porosity detection using optical tomography imaging during laser powder bed fusion. Int. J. Extrem. Manuf. 2024, 6, 065601. [Google Scholar] [CrossRef]
  28. Tomita, N.; Abdollahi, B.; Wei, J.; Ren, B.; Suriawinata, A.; Hassanpour, S. Attention-based deep neural networks for detection of cancerous and precancerous esophagus tissue on histopathological slides. JAMA Netw. Open 2019, 2, e1914645. [Google Scholar] [CrossRef]
  29. Xu, K.; Ba, J.; Kiros, R.; Cho, K.; Courville, A.; Salakhudinov, R.; Zemel, R.; Bengio, Y. Show, attend and tell: Neural image caption generation with visual attention. In Proceedings of the International Conference on Machine Learning PMLR, Lille, France, 7–9 July 2015; pp. 2048–2057. [Google Scholar]
  30. Tran, D.; Bourdev, L.; Fergus, R.; Torresani, L.; Paluri, M. Learning spatiotemporal features with 3d convolutional networks. In Proceedings of the IEEE International Conference on Computer Vision, Santiago, Chile, 7–13 December 2015; pp. 4489–4497. [Google Scholar]
  31. Shaikh, M.A.; Duan, T.; Chauhan, M.; Srihari, S.N. Attention based writer independent verification. In Proceedings of the 2020 17th International Conference on Frontiers in Handwriting Recognition (ICFHR) IEEE, Dortmund, Germany, 8–10 September 2020; pp. 373–379. [Google Scholar]
  32. Mu, W.; Jiang, L.; Shi, Y.; Tunali, I.; Gray, J.E.; Katsoulakis, E.; Tian, J.; Gillies, R.J.; Schabath, M.B. Non-invasive measurement of PD-L1 status and prediction of immunotherapy response using deep learning of PET/CT images. J. Immunother. Cancer 2021, 9, e002118. [Google Scholar] [CrossRef]
  33. Simonyan, K.; Zisserman, A. Very deep convolutional networks for large-scale image recognition. arXiv 2014, arXiv:1409.1556. [Google Scholar]
  34. Russakovsky, O.; Deng, J.; Su, H.; Krause, J.; Satheesh, S.; Ma, S.; Huang, Z.; Karpathy, A.; Khosla, A.; Bernstein, M.; et al. ImageNet Large Scale Visual Recognition Challenge. Int. J. Comput. Vis. (IJCV) 2015, 115, 211–252. [Google Scholar] [CrossRef]
  35. Agarap, A.F. Deep learning using rectified linear units (relu). arXiv 2018, arXiv:1803.08375. [Google Scholar]
  36. Ioffe, S.; Szegedy, C. Batch normalization: Accelerating deep network training by reducing internal covariate shift. In Proceedings of the International Conference on Machine Learning PMLR, Lille, France, 6–11 July 2015; pp. 448–456. [Google Scholar]
  37. He, K.; Zhang, X.; Ren, S.; Sun, J. Delving deep into rectifiers: Surpassing human-level performance on imagenet classification. In Proceedings of the IEEE International Conference on Computer Vision, Santiago, Chile, 7–11 July 2015; pp. 1026–1034. [Google Scholar]
  38. Kingma, D.P.; Ba, J. Adam: A method for stochastic optimization. arXiv 2014, arXiv:1412.6980. [Google Scholar]
  39. Han, J.; Kamber, M.; Pei, J. Data Mining: Concepts and Techniques, 3rd ed.; Morgan Kaufmann Publishers Inc.: San Francisco, CA, USA, 2011. [Google Scholar]
  40. Ma, N.; Zhang, X.; Zheng, H.T.; Sun, J. ShuffleNet V2: Practical Guidelines for Efficient CNN Architecture Design. In Proceedings of the European Conference on Computer Vision (ECCV), Munich, Germany, 8–14 September 2018. [Google Scholar]
  41. Howard, A.; Sandler, M.; Chen, B.; Wang, W.; Chen, L.C.; Tan, M.; Chu, G.; Vasudevan, V.; Zhu, Y.; Pang, R.; et al. Searching for MobileNetV3. In Proceedings of the 2019 IEEE/CVF International Conference on Computer Vision (ICCV), Seoul, Republic of Korea, 27 October–2 November 2019; IEEE Computer Society: Washington, DC, USA, 2019; pp. 1314–1324. [Google Scholar]
  42. Dosovitskiy, A.; Beyer, L.; Kolesnikov, A.; Weissenborn, D.; Zhai, X.; Unterthiner, T.; Dehghani, M.; Minderer, M.; Heigold, G.; Gelly, S.; et al. An image is worth 16 × 16 words: Transformers for image recognition at scale. arXiv 2020, arXiv:2010.11929. [Google Scholar]
  43. Liu, Z.; Lin, Y.; Cao, Y.; Hu, H.; Wei, Y.; Zhang, Z.; Lin, S.; Guo, B. Swin Transformer: Hierarchical Vision Transformer using Shifted Windows. In Proceedings of the 2021 IEEE/CVF International Conference on Computer Vision (ICCV), Montreal, QC, Canada, 10–17 October 2021; pp. 9992–10002. [Google Scholar] [CrossRef]
Figure 1. Image examples of an LS bed with print jobs: (a) a powder bed without irregularities, (b) a powder bed with irregularities, red box indicates irregularities.
Electronics 14 02674 g001
Figure 2. A diagram highlighting the machine learning concepts and its classes [7].
Electronics 14 02674 g002
Figure 3. Representation of the soft attention module used in the network.
Electronics 14 02674 g003
Figure 4. GradCAM maps used for analysis on the test data. The GradCAMs are obtained using the gradients from the max-pooling layer present after the Soft-Attention block.
Electronics 14 02674 g004
Figure 5. Architecture overview: the feature extractor consists of five convolutional blocks (16 to 128 filters), each followed by 2 × 2 max-pooling (except the last). Features are processed by a soft-attention mechanism, fused with a residual path, and passed through PReLU, global average pooling, batch normalization, and fully connected layers for classification.
Electronics 14 02674 g005
Figure 6. Accuracy and loss plots during training and validation of the proposed model.
Electronics 14 02674 g006
Figure 7. Confusion matrix obtained during evaluation on the test data.
Electronics 14 02674 g007
Figure 8. A t-SNE plot illustrating the strengths and weaknesses of the proposed architecture.
Electronics 14 02674 g008
Figure 9. Receiver Operating Characteristic (ROC) plot of the proposed method.
Electronics 14 02674 g009
Table 1. Common powder bed defects along with their causes and mitigation strategies.
DefectCauseMitigation
Irregular Part EdgesThermal distortion, over-sintering, uneven powder layers.Optimizing laser settings, applying contour scanning, preheating the powder bed, ensuring uniform powder spreading.
Material AccumulationRecoater interference, poor powder flow, edge curling.Using spherical powders with high flowability, maintaining recoater condition.
Powder TrenchesOverheating, spatter, multiple scans, recoater interaction with curled parts.Optimizing scan path and energy input, avoiding redundant scanning, implementing real-time monitoring.
DelaminationInadequate interlayer bonding due to insufficient fusion or cooling gradients.Optimizing energy density and scan strategy, maintaining consistent bed temperature.
Table 2. Distribution of images present in the LS bed dataset.
ClassSettingSamples
Training1000
OKValidation500
Testing500
Training1000
DEFValidation500
Testing500
Table 3. Hyperparameters used during the training.
HyperParameterValue
OptimizerAdam
Learning rate (Lr) 3 × 10 4
Weight decay 5 × 10 4
Lr decayfactor: 0.2, patience: 5
Early stoppingpatience: 10
Batch size64
Epochs for 1 fold15
Loss functionCross-Entropy, label-smoothing: 0.1
Table 4. Comparative analysis of the proposed model with previous work and other state-of-the-art models.
ArchitectureAccuracy (%)Precision (%)Recall (%)F1-Score (%)No. of Parameters (in Million)Computational Complexity (GMACs)
VGG16 Westphal et al. [3]97.196.398.097.2138.3587.735
Xception Westphal et al. [3]50.0100.050.066.722.862.89
Shufflenet_v2 [40]71.8064.3897.6077.581.800.109
Mobilenet_v3_small [41]62.0056.8399.8072.421.230.043
ViT_b_16 [42]53.9052.7275.6062.1285.817.61
Swin_t [43]87.3080.9397.6088.4927.932.25
Proposed model98.4097.4599.4098.421.330.797
Table 5. Ablation analysis of the proposed architecture by varying the number of filters of the network by a factor f.
FactorAccuracy (%)Precision (%)Recall (%)F1-Score (%)No. of Parameters (in Million)Computational Complexity (GMACs)
198.0096.8899.2098.0220.3112.42
298.3097.4599.2098.325.153.13
498.4097.4599.4098.421.330.797
891.9086.1899.8092.490.350.21
Table 6. Ablation study of the modified VGG model with and without the soft-attention mechanism.
ModelAccuracy (%)Precision (%)Recall (%)F1-Score (%)
Modified-VGG96.4093.9499.2096.50
Modified-VGG + CBAM97.2095.3899.2097.25
Modified-VGG + SE97.4095.5899.4097.45
Modified-VGG + Soft-attention98.4097.4599.4098.42
Table 7. Performance comparison of proposed model on different hardware setups.
ModelProcessing Time (s)
Intel Xeon 2.20 GHz CPU0.9296
NVIDIA Tesla T4 GPU0.0319
NVIDIA Tesla P100 GPU0.0027
ARM Cortex-A72 CPU (Raspberry Pi)3.5374
ARM Cortex-A57 CPU (Jetson Nano)3.818
128-core Maxwell GPU (Jetson Nano)3.225
Disclaimer/Publisher’s Note: The statements, opinions and data contained in all publications are solely those of the individual author(s) and contributor(s) and not of MDPI and/or the editor(s). MDPI and/or the editor(s) disclaim responsibility for any injury to people or property resulting from any ideas, methods, instructions or products referred to in the content.

