Article

Real-Time DDoS Detection in High-Speed Networks: A Deep Learning Approach with Multivariate Time Series

by
Drixter V. Hernandez
1,
Yu-Kuen Lai
1 and
Hargyo T. N. Ignatius
2,*
1
Department of Electrical Engineering, Chung Yuan Christian University, Taoyuan 320314, Taiwan
2
Department of Computer Engineering, Universitas Multimedia Nusantara, Banten 15810, Indonesia
*
Author to whom correspondence should be addressed.
Electronics 2025, 14(13), 2673; https://doi.org/10.3390/electronics14132673
Submission received: 17 May 2025 / Revised: 19 June 2025 / Accepted: 27 June 2025 / Published: 1 July 2025
(This article belongs to the Special Issue Emerging Technologies for Network Security and Anomaly Detection)

Abstract

The exponential growth of Distributed Denial-of-Service (DDoS) attacks in high-speed networks presents significant real-time detection and mitigation challenges. The existing detection frameworks are categorized into flow-based and packet-based detection approaches. Flow-based approaches usually suffer from high latency and controller overhead in high-volume traffic. In contrast, packet-based approaches are prone to high false-positive rates and limited attack classification, resulting in delayed mitigation responses. To address these limitations, we propose a real-time DDoS detection architecture that combines hardware-accelerated statistical preprocessing with GPU-accelerated deep learning models. The raw packet header information is transformed into multivariate time series data to enable classification of complex traffic patterns using Temporal Convolutional Networks (TCN), Long Short-Term Memory (LSTM) networks, and Transformer architectures. We evaluated the proposed system using experiments conducted under low to high-volume background traffic to validate each model’s robustness and adaptability in a real-time network environment. The experiments are conducted across different time window lengths to determine the trade-offs between detection accuracy and latency. The results show that larger observation windows improve detection accuracy using TCN and LSTM models and consistently outperform the Transformer in high-volume scenarios. Regarding model latency, TCN and Transformer exhibit constant latency across all window sizes. We also used SHAP (Shapley Additive exPlanations) analysis to identify the most discriminative traffic features, enhancing model interpretability and supporting feature selection for computational efficiency. Among the experimented models, TCN achieves the most balance between detection performance and latency, making it an applicable model for the proposed architecture. These findings validate the feasibility of the proposed architecture and support its potential as a real-time DDoS detection application in a realistic high-speed network.

1. Introduction

Modern infrastructure uses high-speed networks with many connected devices that transmit a vast amount of time-sequenced traffic. As the network speed increases, the volume and velocity of the data also increase, thus posing a challenge for real-time monitoring and security in the network environment. Distributed Denial-of-Service (DDoS) attacks are among the most disruptive threats that overwhelm targeted systems with malicious traffic. Recent studies show an exponential surge of DDoS attack volume from Gbps to Tbps. In June 2020, a DDoS attack targeted Akamai [1] with a peak traffic of 1.44 Tbps. From 2023 to 2025, the DDoS threat intensified significantly. In 2024 alone, there was a 108 % global increase in attack frequency, according to StormWall [2], a staggering 16,073% rise in detections reported by Vercara [3], and a 53% increase in mitigation attacks by Cloudflare [4] that blocked 21.3 million attacks. The peak volumes of the attacks also reached staggering levels, with a record-breaking 5.6 Tbps UDP attack in October 2024, along with other notable peaks at 1.6 Tbps (StormWall) and 1.4 Tbps (Vercara). The frequency of volumetric DDoS attacks over 1 Tbps grew by 1885% quarter-over-quarter in Q4 2024, highlighting the immense growth. While many attacks remain short, with an average of 10–39 min [2,4], and some incidents lasting over an hour, the number of incidents surged by 120% [2]. The attack structure exhibited an ON-OFF pattern commonly used to evade detection. These attacks exploit predictable and anomalous traffic patterns to bypass traditional defenses, making timely detection essential [5].
DDoS detection frameworks can be categorized into flow-based and packet-based approaches. A flow-based approach mostly uses software-defined networking (SDN) using flow-level information to monitor aggregated traffic flows and classify DDoS attacks [6]. Flow-based features are processed using an SDN controller that manages network traffic and collects flow statistics from the switches/routers using protocols like OpenFlow. Studies incorporate flow features into machine learning models to detect and classify DDoS attacks, as these flows provide a higher-level abstraction of network activity. One method utilizes flow tables, statistical traffic monitoring, and predictive models like ARIMA and chaos theory for anomaly detection [7]. Another technique employs multistage detection frameworks that use statistical flow features to trigger further analysis using K-Nearest Neighbors (KNN) classification [8]. However, latency limits SDN-based flow-level approaches while generating flow features. As the network traffic volume increases, the controller’s burden also increases. As a result, the efficiency of DDoS detection decreases when the network experiences high-speed traffic. In comparison, packet-based detection utilizes hardware acceleration to analyze individual packets quickly [9]. Using FPGAs to perform packet-level inspection in network traffic allows quick identification of malicious traffic. Unlike flow-based methods, packet-based systems can detect low-latency threats applicable for applications such as real-time DDoS detection in high-throughput networks. In particular, a hybrid FPGA/software filtering datapath focused on mitigating volumetric DDoS attacks [10]. Using an FPGA-based approach, it offloads filtering processing and handles process traffic at 10 Gbps by heuristically balancing the load between hardware and software components to filter DDoS attacks. While packet-based approaches achieve real-time performance, they also face challenges. For instance, FPGA-based systems exhibit high false positive rates due to simplified statistical feature representations [11] and limitations in binary classification for attack mitigation strategy [12].
This study addresses the limitations of existing DDoS detection architectures for real-time high-speed networks. Flow-based SDN architecture suffers from high latency when processing flow-level features, while packet-based methods often result in high false positive rates. Additionally, attack mitigation response times increase due to the added identification process of the attack, as most FPGA-based architectures rely on binary classification. While existing studies on DDoS detection using multivariate time series have primarily relied on software-based processing or conventional deep learning approaches, few have explored hybrid hardware-software architectures. Specifically, prior works have not entirely utilized the capability of FPGA-based preprocessing to reduce data complexity before GPU-accelerated deep learning inference. This study aims to bridge this gap by integrating FPGA-based preprocessing with a deep learning model optimized for real-time multivariate time series DDoS detection in high-speed network applications. We propose a novel real-time DDoS detection architecture designed for high-speed network environments. Our approach uses multivariate time series-based features from raw packet data and integrates deep learning models for classification. Specifically, this study explores and validates models commonly used in previous studies, such as TCN, LSTM, and Transformer, to classify DDoS patterns in time series data. We introduce a preprocessing pipeline that extracts statistical features from Layer 3 and 4 headers over fixed observation windows and converts them into multivariate time series suitable for hardware-accelerated processing using FPGAs. To optimize performance and reduce computational overhead, we apply SHAP (SHapley Additive exPlanations) analysis [13] to the preprocessed features to identify and rank the most important features to help reduce the number of features needed for effective detection and reduce the system’s time, computational cost, and resource consumption for high-speed network deployment. In summary, the key contributions of this study are:
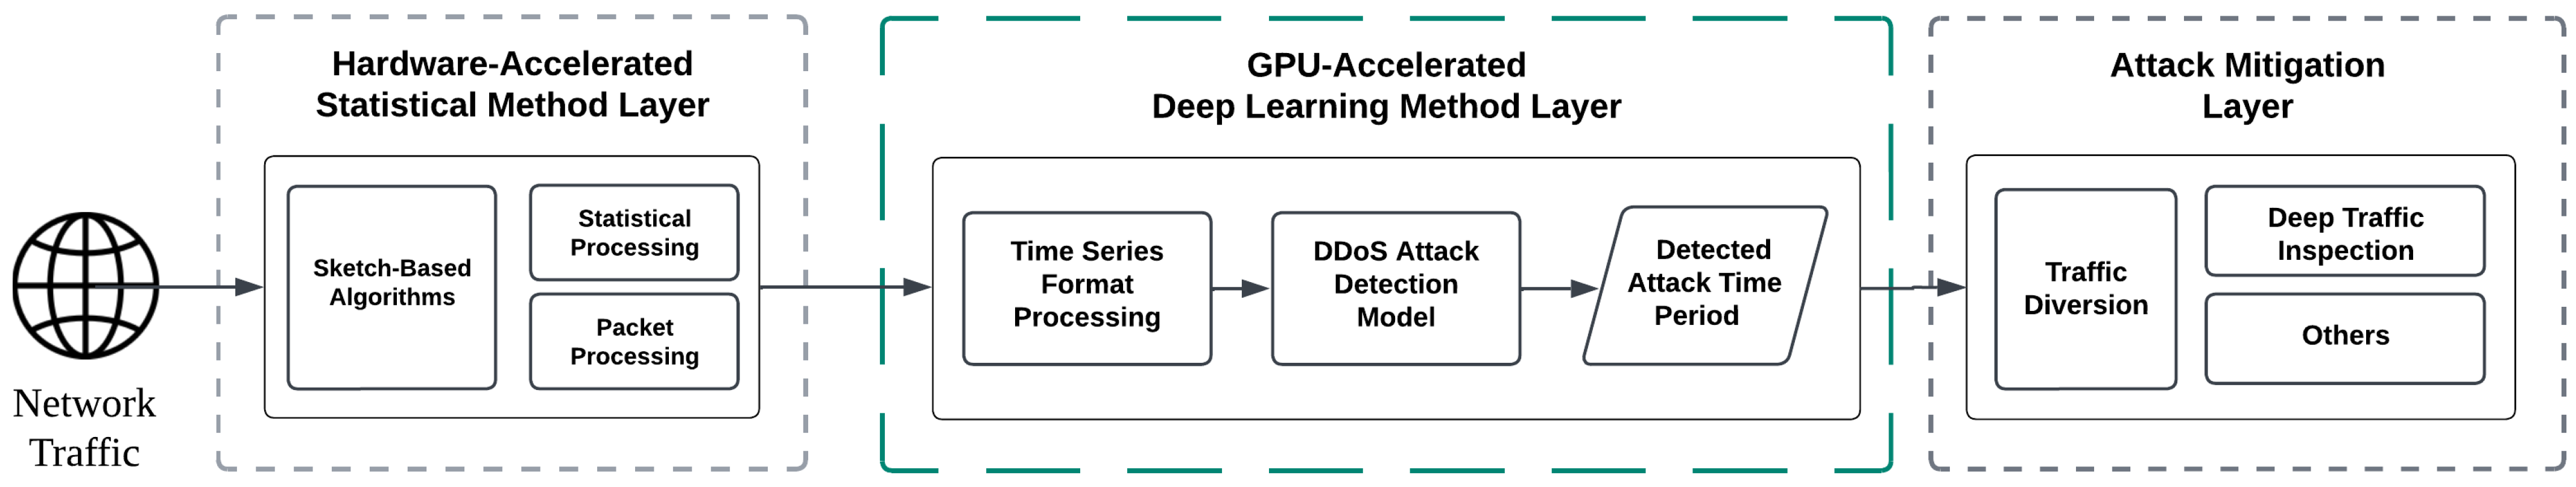
  • Reference Architecture for Real-time DDoS Detection: A reference multi-layered architecture for real-time DDoS detection that utilizes hardware acceleration and multivariate time series features. The modular and extendable architecture allows adaptation for different application domains and performance requirements.
  • Model Validation: Comprehensive evaluation of deep learning models (TCN, LSTM, Transformer) demonstrating the potential for effective integration into the proposed high-speed architecture.
  • Feature Selection for Efficiency: Critical features are identified using SHAP analysis to enable lightweight and high-speed processing essential for real-time performance and cost-effective deployment.
This study is structured as follows: Section 2 provides the background of the study, covering DDoS detection approaches, flow-based features, packet-based features, and a comparison of DDoS detection architectures. Section 3 discusses the proposed real-time DDoS architecture for high-speed networks. Section 4 describes the GPU-accelerated deep learning method layer, specifically the multivariate time series processing, deep learning models, and model evaluation metrics. Section 5 validates each model’s performance in a multivariate time series dataset and the importance of features using SHAP Analysis. Section 6 presents the conclusions and outlines potential directions for future work.

2. Related Work

The exponential growth of distributed denial-of-service attacks has led to vast research on developing real-time DDoS detection from traditional statistical and entropy-based detection to machine learning (ML) and deep learning (DL) models. Gaur et al. [14] categorize these methods into three distinct groups: Statistical-Based Detection, Machine Learning-Based Detection, and Deep Learning-Based Detection. Each detection method has strengths and limitations that restrict real-time application and scalability. However, despite the diversity of approaches, two fundamental classes of detection features have emerged: flow-based and packet-based processing. Each comes with performance trade-offs regarding latency, false positive rate, and scalability under high-speed, real-world network conditions.

2.1. Detection Approaches

Statistical-based detection represents a standard in intrusion detection that uses statistics and information theory principles [12,15,16]. The limitation of this method is its adaptability to emerging attacks. Machine learning-based detection utilizes machine learning models like ESVM [17] and KNN for intrusion detection [8,18]. However, machine learning models can be vulnerable to adversarial attacks in which attackers manipulate input data to evade detection. Deep learning-based detection detects intrusions by using deep multi-layer models. Deep learning models can learn hierarchical and temporal representations to detect complex and evolving attack patterns more effectively. However, deep learning models often require high computational power and have high latency during inference, which hinders the practical deployment in real-time DDoS detection [19]. Studies incorporate hybrid detection strategies that combine each approach’s strengths to reduce the computational complexity and integrate them into their architectures [7,19]. Another limitation in developing real-time DDoS detection is the features needed in each approach. Two feature techniques to detect DDoS as input in different detection approaches are flow-based and packet-based features, as summarized in Table 1.

2.2. Flow-Based Features

Flow-based detection architectures rely on aggregated statistics derived from traffic flows (e.g., source/destination IPs, packet counts, byte counts) and are often implemented using Software-Defined Networking (SDN). SDN controllers collect these features using protocols like OpenFlow, allowing for centralized network behavior analysis.
Studies incorporate flow features into statistical and machine learning models to detect and classify DDoS attacks, as these flows provide a higher-level abstraction of network activity. In a statistical approach, Fouladi et al. [7] combined flow tables and traffic pattern monitoring with predictive models such as AutoRegressive Integrated Moving Average (ARIMA) and chaos theory to detect anomalies using the Unique Source IP Addresses (USIP) feature. For the Destination IP addresses (UDIP), they utilized the Exponential Filter in conjunction with a Dynamic Threshold. The method aims to enhance anomaly detection using different network features. A disadvantage of this architecture is the limited adaptability to changes, where there are changes and noise in real-world traffic.
In another study, Gebremeskel et al. [19] utilize a deep learning approach to solve the limitations of machine learning approaches regarding adaptability to changes, proposing a hybrid approach that combines statistical and deep learning-based detection. The method used for early attack detection is entropy-based, and an LSTM model is used for fine-grained packet-based detection to ensure high accuracy and computational efficiency. It is important to note that the architecture focuses on distributed computing to avoid a single point of failure. It also uses flow-based features that can pose a challenge in real-time DDoS detection in high-speed networks regarding high feature processing latency. Another study, Tan et al. [8], employs a dual-stage detection mechanism. In the data plane, a DDoS detection trigger counts the sending rate of packet messages. The anomaly traffic is transferred to the controller upon detecting abnormality, which utilizes a combined K-means and KNN approach for identifying suspicious traffic. The authors also introduce novel features based on the rate and asymmetry characteristics of the flows. The challenge in this architecture is scalability and robustness, where the performance degraded in a high packet rate due to the architecture’s centralized decision-making, as there are latency limits on SDN-based architecture while generating flow features. As a result, the efficiency of DDoS detection decreases when the network experiences high-speed traffic. Yungaicela-Naula et al. [20] proposed an architecture using an LSTM model for slow-rate DDoS attack detection and mitigation strategies. However, the model distinguishes between attack and regular traffic up to 90.87% accuracy, and the IDS shows the capability to perform the correct mitigation actions using the SDN architecture. Some studies use an FPGA in flow-based features. Shi et al. [15] proposed an adaptive DDoS attack detection that uses a dynamic threshold update based on the network situation, using an FPGA for real-time implementation in flow-based features. Although it is applicable for real-time detection because of its dynamic adaptability, it still has limitations, such as a fixed sampling rate and sketch size. Flow-based methods suffer from inherent latency caused by the time required to collect, transmit, and process flow records [19], particularly in SDN-based systems. As traffic volumes and attack rates increase, these architectures struggle with responsiveness and scalability [7] due to centralized decision-making [8] and flow table limitations.

2.3. Packet-Based Features

Packet-based detection utilizes hardware acceleration to analyze individual packets quickly. Using FPGAs to perform packet-level inspection in network traffic allows quick identification of malicious traffic. Unlike flow-based methods, packet-based systems can detect threats in low latency, which is applicable for applications such as real-time DDoS detection in high-throughput networks.
Hoque et al. [12] use statistical methods to detect DDoS attacks in FPGA. Using a proposed correlation method, NaHiD achieves a real-time performance in detecting attacks. Another method implements a hybrid FPGA/software filtering datapath to mitigate volumetric DDoS attacks [10]. Using an FPGA-based engine, it offloads filtering processing and handles process traffic at 10 Gbps by heuristically balancing the load between hardware and software components to filter DDoS attacks. It shows that incorporating hardware and software helps improve the offloading of the processing overhead time. However, both current studies only present a two-class classification, where there is a need for further inspection to identify the type of DDoS attack that increases the delay in mitigation response. In our previous research [18], a hardware-accelerated framework was implemented to convert raw packet headers into statistical features using sketch-based techniques. The system then used Dense and Autoencoder models to perform classification. While the FPGA-based approach achieved high processing speed and memory efficiency, it still exhibited a slightly higher precision than recall, indicating a trade-off between false positives and detection sensitivity, as they often use simplified statistical or heuristic features. Furthermore, many studies are limited to binary classification, which reduces the precision of mitigation strategies against specific attack types. Despite the recent advancements in real-time DDoS detection, limitations remain. Flow-based feature studies have high feature processing latency and struggle under high-speed network conditions. Meanwhile, packet-based feature studies can generate high false positives and lack multiclass classification capabilities. Moreover, most existing architectures do not fully utilize hardware acceleration for end-to-end detection pipelines. To address these gaps, our proposed architecture uses the strengths of each approach, where the FPGA-based approach is the low-latency feature processing, and the deep learning approach is the high classification performance. This pipeline minimizes latency, reduces false positives, and enables scalable multiclass detection, potentially suitable for deployment in high-speed networks. Furthermore, a complete feature analysis is evaluated in this study to determine the most important feature in detecting DDoS. Recent studies [21,22,23] integrate SHAP analysis into their DDoS models to interpret the models’ prediction and know each feature’s importance. Using SHAP analysis, this study identifies the common features in each model, reducing the feature processing overhead in model classification.

3. Proposed Architecture

This paper builds on our previous research [18] and extends our earlier work [23]. The proposed architecture of the real-time DDoS detection and mitigation system efficiently and robustly addresses the limitations of previous studies by other researchers. As shown in Figure 1, the architecture comprises three layers: Hardware-Accelerated Statistical Method Layer, GPU-Accelerated Deep Learning Method Layer, and Attack Mitigation Layer.

3.1. Hardware-Accelerated Statistical Method Layer

The Hardware-Accelerated Statistical Method Layer is responsible for raw packet ingestion and processing using sketch-based algorithms, statistical processing, and packet handling. This layer draws on our previous research in machine learning accelerators [18], which uses time-window statistical features processing in an FPGA as the input for the detection models. This method has a more stable performance in a high-speed network than packet-based processing. FPGA performs memory-efficient and high-speed packet processing for high-speed networks using sketch-based algorithms for feature processing. We utilized the Xilinx Alveo U200 FPGA platform within the NetFPGA PLUS open-source framework from our previous research [18] implementation. The hardware design was developed using Verilog HDL and the platform’s support for block RAM (BRAM), DSP slices, and MAC (Multiply-Accumulate) units to enable highly parallelized pipelined network traffic processing.

Sketch-Based Algorithms

The implementation comprises a header parser module that extracts fields from packet headers for feature processing. The extracted features are processed using a set of sketch-based algorithms and on-chip statistical operators to estimate traffic characteristics in real time. Below is a detailed breakdown of the sketch implementations and their estimated hardware resource consumption based on previous research evaluation [24]:
  • Alon-Matias-Szegedy (AMS) Sketch [25]: Using the MassDAL [26] AMS Sketch implementation. Each feature uses five 512-entry tables with 32-bit entries and approximately 70 KB of storage. Computationally, this requires seven 32-bit multipliers and fourteen 64-bit multipliers to calculate the second to fourth statistical moments.
  • Distributed Distribution (DD) Sketch [27]: Implemented as a histogram with 800 entries of 64 bits each, the DD Sketch consumes approximately 43.7 KB of storage. This approach supports quantile estimations with index-based table traversal and cumulative counts.
  • Flajolet—Martin (FM) Sketch [28]: Each feature uses a 128×64-bit table for cardinality estimation and requires approximately 2.1 KB of storage. Hashing computations are optimized using H3 hash functions implemented in combinational logic that eliminate the need for multipliers.
  • Entropy Estimation (Clifford and Cosma Method [29]): This method uses twenty tables of 2048 entries with 32-bit words per feature, resulting in about 1.09 MB of storage. Computational demand is high, with approximately 280 32-bit multipliers employed for weighted frequency calculations and entropy tabulation. We implemented the hardware-accelerated processing of time-window entropy on downstream systems and support packet processing up to 40 Gbps [16].
  • Mean Calculation: Implemented with two 64-bit registers per feature, one for summation and one for count. The mean requires minimal storage (64 bytes) and no multiplier resources.
The pipeline supports concurrent processing of multiple features to enable throughput at high rates typical of modern data center networks. The resource utilization is based on estimates from previous research. The next stage involves implementing the proposed real-time DDoS detection architecture for high-speed networks, guided by the results of the SHAP analysis simulations conducted in this study for the GPU-accelerated Deep Learning Method Layer. This study highlights the importance of feature selection in focusing on the most essential features and minimizing pre-processing within the Hardware-Accelerated Statistical Method Layer. To ensure data is filtered and organized for model readiness, enabling scalable and efficient detection pipelines in high-speed network environments.

3.2. GPU-Accelerated Deep Learning Method Layer

The GPU-accelerated deep learning method layer comprises time series formatting and DDoS attack classification. The preprocessed data from the hardware-accelerated layer is structured into multivariate time series data and stored in the historical preprocessed data to capture the critical temporal patterns in identifying and classifying DDoS attacks. The DDoS attack classification model is based on a deep learning approach and accelerated using GPUs for low-latency inference and detection. The main improvement is detecting DDoS attacks using time-window features to localize the attack duration for early detection of DDoS attacks. The GPU acceleration helps ensure real-time detection under high traffic volume for a quicker and more accurate response to different attacks, including volumetric and amplified DDoS attacks.
Several deep learning models can be integrated and validated during the evaluation phase to enhance this layer further. These models have been used mainly in past studies to detect DDoS attacks. Long-Short-Term Memory (LSTM) [20] networks are well-suited for learning temporal dependencies in time-series data and are highly effective for detecting gradual or patterned attacks. Temporal Convolutional Networks (TCNs) [30,31], or Transformer-based architectures [32] can be explored for more complex and hierarchical sequence modeling, offering high performance and parallelism when combined with GPU resources. This study evaluates the models’ accuracy, detection latency, and robustness against DDoS attacks by comparing these models in a high background network traffic environment and the types of DDoS attacks to validate the performance of the proposed real-time DDoS detection architecture. To align with the proposed GPU-accelerated detection method layer for adaptability and efficiency.

3.3. Attack Mitigation Layer

The last layer is an attack mitigation layer that compromises traffic diversion, deep traffic inspection, and other mitigation methods tailored to each environment. This layer helps to minimize service disruption and supports countermeasures based on the detected attack in the previous layer. In the detected time window of the attack, suspicious traffic is redirected to secure environments or scrubbing centers for further inspection to confirm and analyze the nature of the attack.
The Attack Mitigation Layer offers a customization framework, making the architecture highly extendable and adaptable to different deployment environments. For instance, network operators can improve machine learning-based traffic classification into the deep inspection module to dynamically adapt filtering rules based on evolving attack signatures [10]. In past studies, using Software-Defined Networks [20] for traffic diversion in real-time enables responsive and efficient load balancing or redirection based on current network conditions. Moreover, scrubbing strategies can be adapted based on the targeted application layer. Many businesses rely on 24/7 mitigation services from providers like Cloudflare, Akamai, Verisign, Radware, and Arbor Networks. High-profile attacks on platforms like AWS and GitHub used AWS Shield and Akamai Prolexic services to mitigate the attack [33]. In summary, the attack mitigation layer counteracts threats. It is a flexible framework for organizations to integrate their defense tools, policy-based routing, or test mitigation strategies in a controlled traffic environment.

4. Deep Learning for Time Series DDoS Detection

This section discusses preprocessing methods to transform raw data into a sliding window time series format. This stage is essential for the GPU-accelerated deep learning method layer, where DDoS detection relies on learning temporal patterns from the input. Converting the time window-based packet-level statistical data into a multivariate time-series format allows deep learning models such as LSTM, TCN, and Transformers to learn patterns over time to distinguish between benign and classified DDoS attacks. Without this transformation, deep models would lack the temporal features necessary for accurate classification. This section identifies the features needed to process in the hardware-accelerated statistical method layer and the input requirements of deep learning models. It ensures that the architecture can perform real-time detection effectively.

4.1. Multivariate Time Series Data

This section describes the transformation of the raw packet header to multivariate time series data. The capture packet header details in layers three and four are concatenated in an observation time of one second. Then, we develop varying lengths for the multivariate time series, allowing the model to look back at the previous preprocessed features to improve classification effectiveness.

4.1.1. Dataset

We develop a multivariate time series dataset using the CICDDoS2019 [34] as the foundational dataset. The CICDDoS2019 benchmark dataset, deployed in an infrastructure comprising two independent networks, consists of 113 thousand instances of regular traffic and approximately 70 million instances of DDoS attack traffic and is categorized into 13 classes shown in Table 2. For the analysis of DDoS attacks in time series data, two labeling techniques are used, as shown in Figure 2:
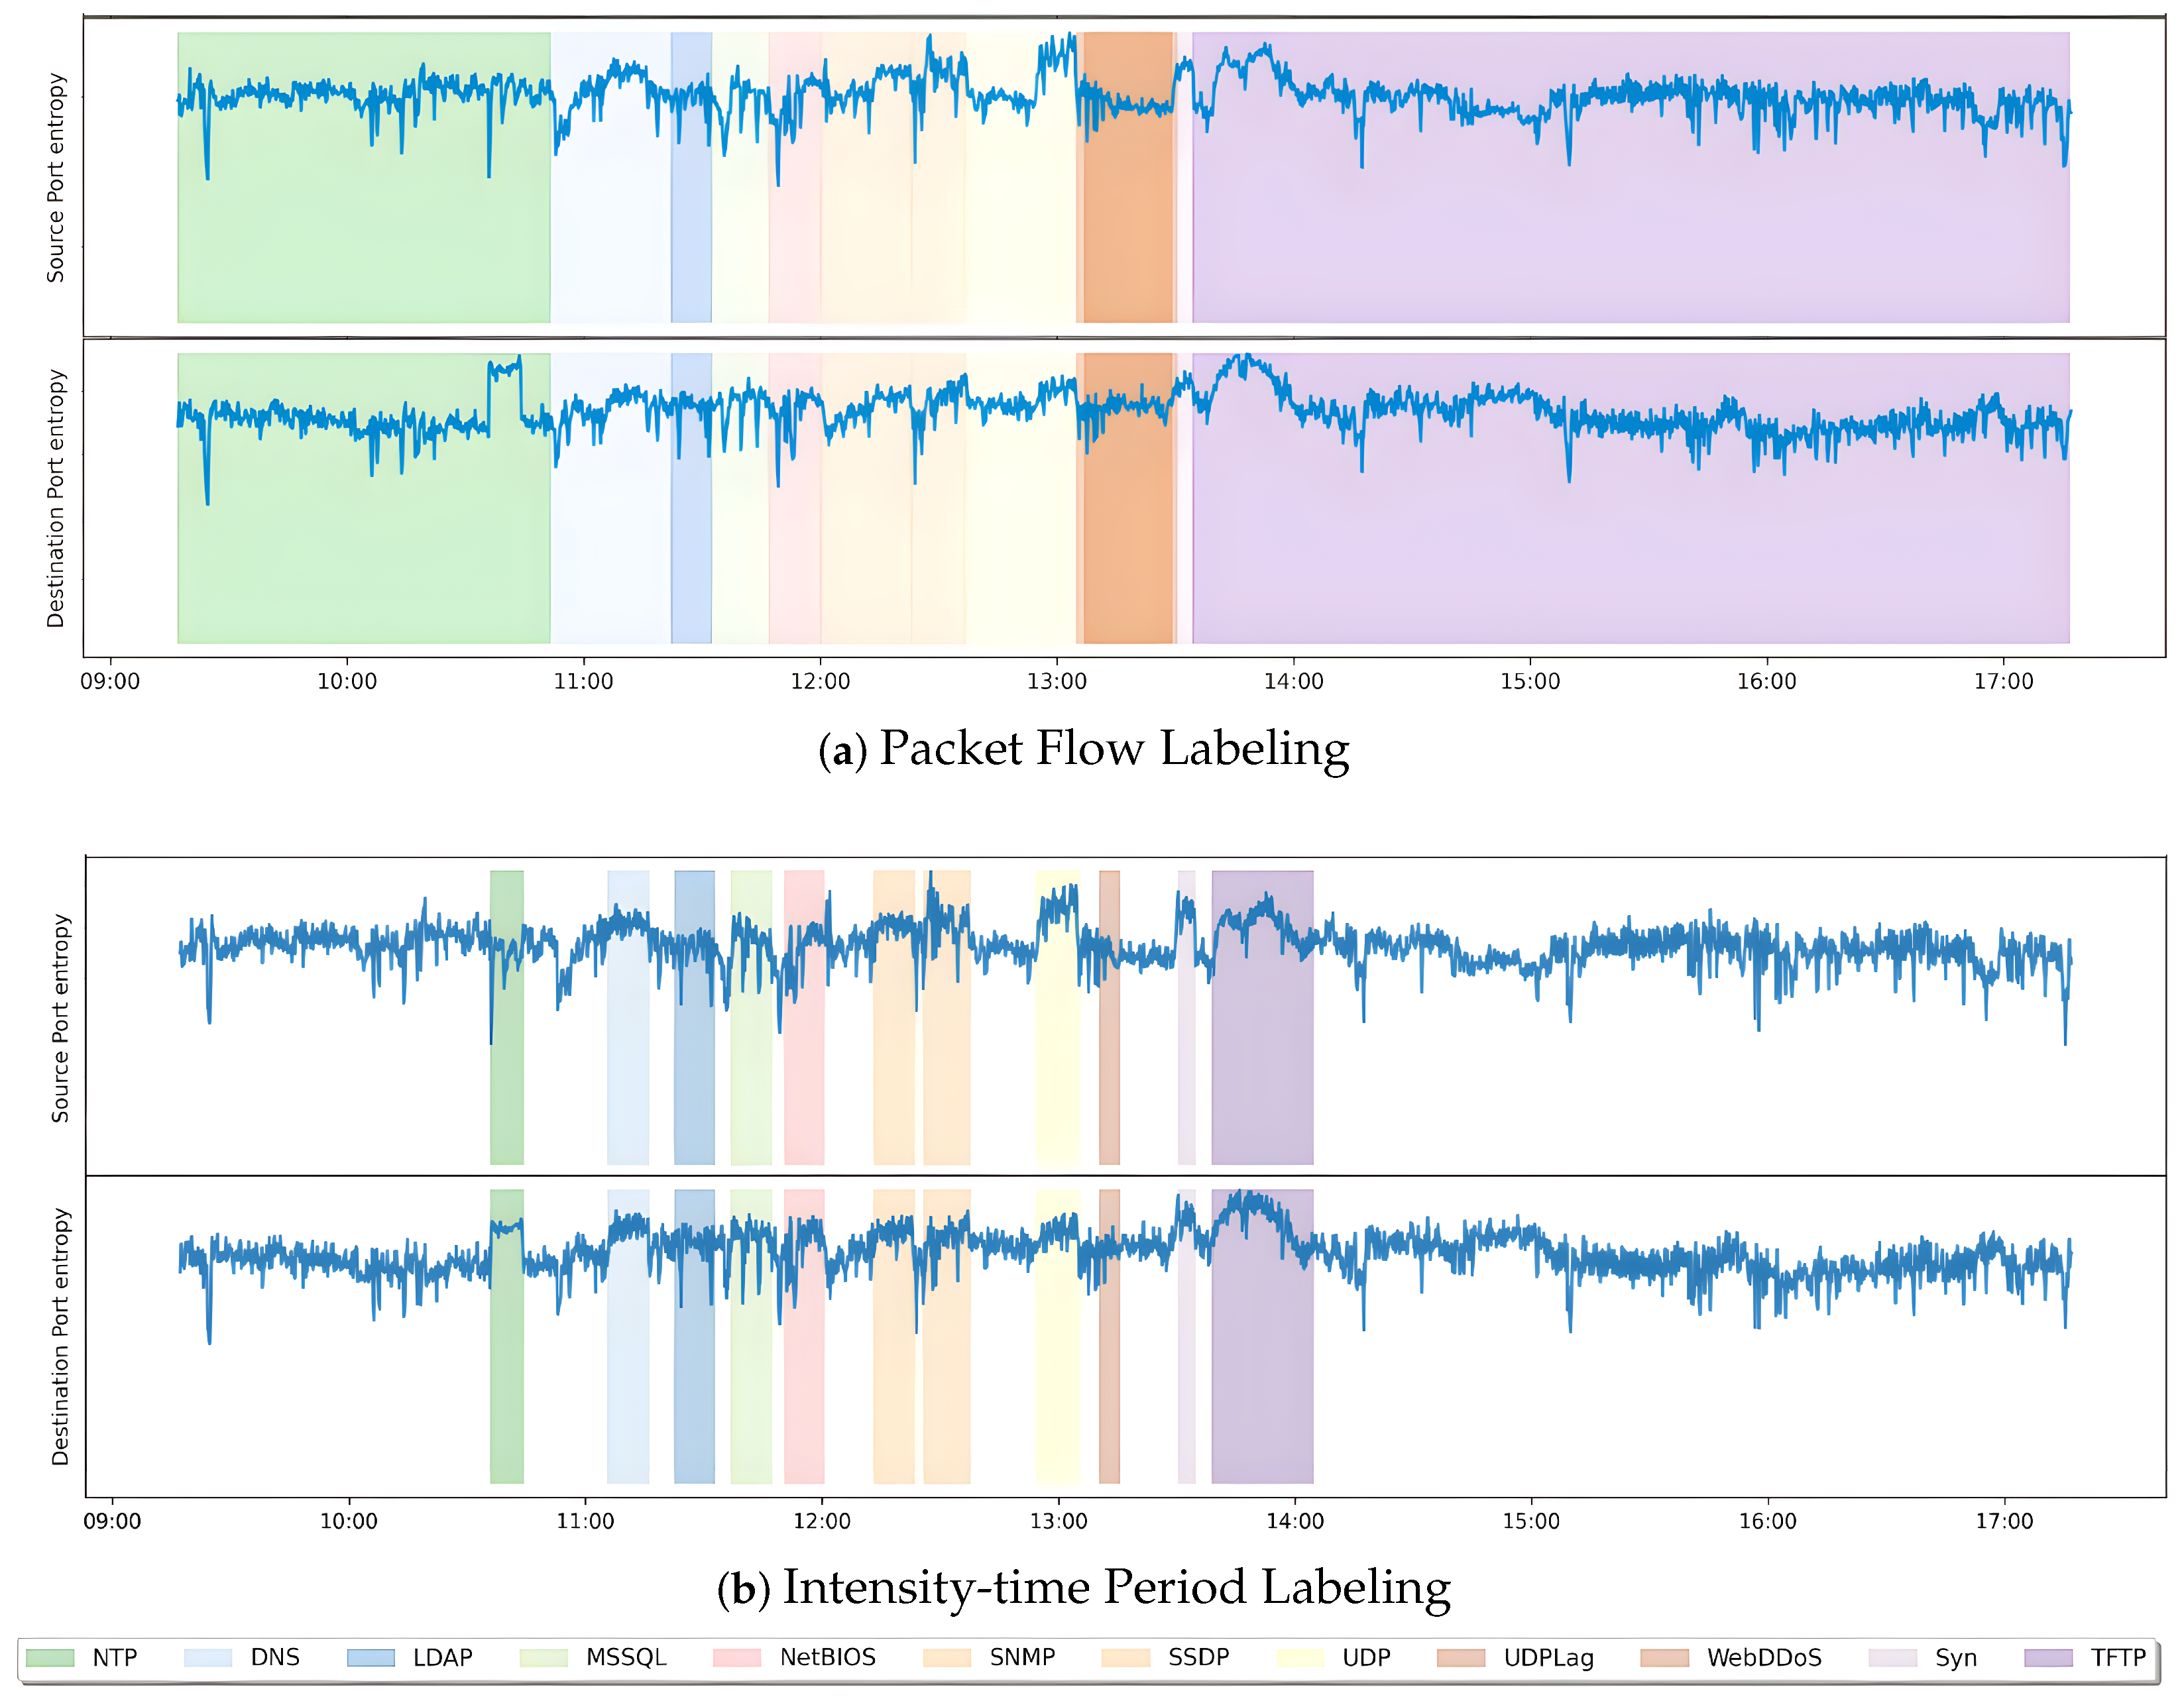
  • Packet flow labeling labels based on each packet are used to examine attack vectors and specific traits in detail.
  • Intensity-time period labeling labels data based on periods where the attack’s intensity surpasses set thresholds to emphasize segments with peak attacks based on the Table 2.
Table 3 shows the class-wise distribution for both raw packets and the process time series data using two labeling schemes: packet flow and intensity-time period labeling. Expected with realistic attack traffic, the dataset displays a significant imbalance between benign and attack traffic and among the different DDoS attack classes. For instance, attack classes such as TFTP and MSSQL have tens of millions of packet instances, and WebDDoS and Portmap occur far less frequently. To reflect real-world network conditions, we did not apply synthetic resampling techniques to balance the dataset to preserve the natural traffic distribution and maintain realistic network behavior during attack events. We incorporate a weighted cross-entropy loss function to address the class imbalance during training that penalizes misclassifications based on class frequency to ensure that underrepresented attack types contribute more significantly to the training without disrupting the overall traffic distribution. This approach reflects on recent research prioritizing preserving real-world class distributions while compensating for imbalance through loss-level weighting. Combining original time series representation with training-aware imbalance mitigation focuses on practical and effective solutions for real-world deployment scenarios.

4.1.2. Data Preprocessing

This section describes the preprocessing methods for generating raw packet headers into time series data. This enables the capture of historical information as the headers are concatenated through a time window period, forming a comprehensive record of the observed time as presented in Figure 3.
  • Dataset Cleaning—The dataset contains several records irrelevant to creating time series data. Features not associated with Network Layers 2 and 3, along with sparse values, are eliminated to prioritize the model’s focus on essential features.
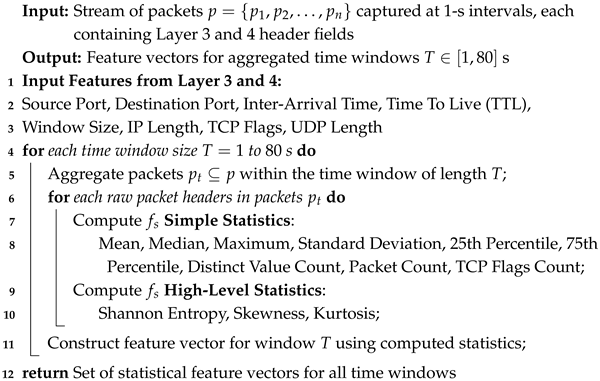
  • Feature Extraction—The dataset consists of raw packet-level headers extracted from Layer 3 and 4 of the network traffic, using statistical methods to extract significant information. In line with prior works [31,35,36], we adopt a preprocessing approach that transforms low-level raw packet features into statistical features. Let p t denote the raw packet headers captured at 1-s intervals, and f s represent the statistical features extracted from each packet header, including source/destination ports, inter-arrival time, time to live (TTL), window size, IP length, TCP flags, and UDP length. As detailed in Algorithm 1, for each time window T [ 1 , 80 ] s, the algorithm aggregates these raw packet headers into statistical features by computing both simple statistics (mean, median, max, standard deviation, 25th and 75th percentiles, distinct count, packet count, and flags count) and high-level statistics (Shannon entropy, skewness, and kurtosis). This multi-variate temporal representation captures variations in traffic behavior and is essential for classification tasks such as anomaly detection or DDoS attack classification.
  • Feature Scale—Our normalization method is MinMaxScaler to rescale the data to a range of [0–1] using the minimum and maximum values. Normalizing the data eliminates the bias in each feature due to different scales and ensures that each feature contributes to model training equally.
  • Time Series Formatting—The dataset was transformed into a time series format using a sliding window approach. Each preprocessed feature transforms as a sequential window based on different time series lengths T [ 1 , 80 ] in seconds. For multivariate time series classification, the input size D = ( X n , Y n ) , where X n represents the input feature sequence and Y n is the corresponding label. Specifically, X n has the shape [ n , T , f s ] , where n is the number of samples, T is the time window length, and f s is the number of features.
Algorithm 1: Multivariate statistical feature extraction from network traffic.
Electronics 14 02673 i001

4.2. Deep Learning Models

This section discusses three deep learning (DL) models that align with the proposed real-time DDoS detection architecture. These models were selected based on their effectiveness in prior studies for time series and network intrusion detection tasks and their compatibility with GPU-accelerated high-speed traffic systems. The base models examined in this study, as illustrated in Figure 4, are Temporal Convolutional Networks (TCN), Long Short-Term Memory (LSTM) networks, and Transformer-based architectures. Each model presents distinct strengths in handling temporal dependencies and complex traffic patterns as a suitable candidate for integration within the proposed architecture’s deep learning layer.

4.2.1. Temporal Convolutional Networks (TCN)

Temporal Convolutional Networks (TCNs) have performed DDoS detection tasks by extracting spatial features in network traffic. TCN’s ability to capture local relations helps to distinguish attack patterns. In the study by Lopes et al. [30], the authors evaluated the effectiveness of temporal CNNs in time-series classification on DDoS attacks with a high accuracy and low latency. In another study, Doriguzzi-Corin et. al. [31] utilized a lightweight CNN architecture for a resource-constrained environment. The performance of CNN in detecting DDoS in this study shows a low processing overhead and matches the accuracy of the state-of-the-art models. We adopt a temporal CNN architecture that processes network traffic data using a purely convolutional structure shown in Figure 4a. The model applies stacked one-dimensional convolution layers across the temporal dimension, enabling the network to capture local and mid-range temporal dependencies without relying on recurrent mechanisms. Global average pooling condenses temporal features and fully connected layers to perform classification. This model provides a practical and scalable solution for real-time DDoS detection with reduced computational cost.

4.2.2. Long Short-Term Memory (LSTM)

Long-short-term memory (LSTM) networks based on Recurrent Neural Networks (RNNs) solve the vanishing gradient problem designed to capture long-term dependencies in sequential data. LSTM introduces memory cells and gating mechanisms that regulate the flow of information. Gaur et al. [14] employed the LSTM time series model using flow-based features to classify diverse DDoS attacks from the CICDDoS2019 Attack dataset, achieving an impressive 99% accuracy in multiclass time series classification by organizing each class into four groups. However, Yungaicela-Naula et al. [20] explored incorporating the LSTM model for intrusion detection and mitigation strategies in slow-rate DDoS attacks, with the model failing to achieve perfect separation between attack and regular traffic. We adopt an LSTM model shown in Figure 4b to learn and retain critical temporal patterns in network traffic, such as the progression and timing of DDoS attack behaviors, thereby improving detection performance in scenarios where long-range dependencies are essential for accurate classification.

4.2.3. Transformer

The surge in the popularity of Transformers crosses various areas. It shows efficacy in parallel processing and captures long sequential data applicable to time series models, particularly forecasting and classification. Using multi-head attention allows the model to identify different aspects of information at diverse positions. The concatenated outputs from multiple heads are transformed linearly to create a comprehensive representation. Although studies adapting transformers in time series classification are emerging, it is worth noting that most of these studies use flow-based features. Ta and Park [32] implemented a multi-attention model (MAN) to identify economic denial of sustainability attacks (EDoS) as a low-rate attack. The model captures low-rate DDoS attacks and performs well compared to traditional RNN-based models. It shows the effectiveness of transformer-based models in detecting DDoS attacks within network security. In our past studies [23], we also incorporated transformers shown in Figure 4c in classifying DDoS detection and applied feature importance to identify each feature’s impact on the model’s output. In this study, we extended the paper to evaluate other models in detecting and classifying DDoS.

4.3. SHAP (SHapley Additive exPlanations) Analysis

Past studies [21,22] have utilized SHAP (SHapley Additive exPlanations) to interpret model outputs and identify important features. SHAP uses game theory to provide interpretable attributions and identify the most influential feature based on the model’s predictions. Wei et al. [37] discuss the interpretation of decision-making of the output of the MLP classifier in detecting DDoS attacks using the CICDDoS2019 dataset. The study uses the SHAP value to explain the prediction result, where it shows the feature contribution from decreasing order from high to low, a visual representation of the influential features, and an interpretation of feature contribution in both legitimate traffic and malicious traffic. In this study, the primary purposes of using SHAP analysis are (1) to interpret and explain the prediction outcomes of the deep learning models by identifying which features most influence their decisions and (2) to guide feature selection by ranking feature importance and reducing computational overhead while maintaining detection accuracy. This study aims to identify and optimize the standard features in different environments without reducing classification performance. The integration of SHAP provides transparency into the models’ decision processes and provides interpretability and efficiency for Hardware-Accelerated Statistical Method Layer deployment.

4.4. Performance Evaluation

Utilizing the CICDDoS2019 dataset, the target split ratio allocates 60% for training and 40% for final model evaluation. Each time series period assesses the model’s capability to classify each class. A test dataset, not exposed to the model during training, is created to evaluate the model’s performance on unseen data. The evaluation comprises the efficiency and effectiveness of different time lengths in classification. The effective metrics include recall, precision, and F1 score. The efficiency metric is prediction serving latency.
  • Precision: The accuracy of positive predictions, where the true positive is computed over the data that is predicted as positive.
    Precision = T P T P + F P
  • Recall: The percentage of actual positive predictions correctly identified, where the true positive is computed over all positives in the data.
    Recall = T P T P + F N
  • F1-Score: The harmonic mean of precision and recall.
    F 1 = 2 × Recall × Precision Recall + Precision
  • Average Inference Time: The model’s average time to predict in a serving environment.
    Average Inference Time = 1 n i = 1 n X i

5. Results and Discussion

This section discusses the model implementation environment and the results of each experiment. The experiments evaluate the performance of each model in anomaly detection and DDoS classification under different label strategies and background traffic conditions. The implementation environment comprises an NVIDIA A100 GPU, Ubuntu 18.04, CUDA 11.4, and Python version 3.9. We evaluate each model across a time window sequence range of 1 s to 80 s in each model experiment. Based on our earlier work [23], a time window range of 1–80 s effectively captured the temporal patterns associated with attack behaviors while maintaining a manageable class distribution. Additionally, the scarcity of certain attack classes (WebDDoS and Portmap) shown in the Table 3, which will increase as the time window enlarges, which could lead to severe class imbalance and insufficient samples for classification. To address this, we constrained the upper limit to 80 s to balance capturing temporal dependencies and preserving a sufficient class distribution for training and evaluation. We train the models using the same hyperparameters to ensure consistency and comparability. With a batch size 16, a learning rate of 1 × 10 4 , and 200 training epochs throughout the experiments. We select these hyperparameters to set a uniform experiment and do not specifically optimize for the performance of each model. It is important to note that the models used in this study employ baseline parameter configurations and are not optimized for maximum performance. The study objective is to evaluate and compare the capability and behavior of the model architectures under different detection scenarios rather than focusing on hyperparameter tuning or fine-grained performance optimization. Details of the individual model parameters and architectural configurations are provided in Appendix A.

5.1. Packet Flow vs. Intensity-Time Period Labeling

Based on different models, this experiment analyzes the relationship between packet flow and traffic intensity labeling over specific periods. It compares the performance in anomaly detection and DDoS classification to assess the effectiveness of the labeling approaches in distinguishing benign traffic and different types of DDoS attacks for reliable and adaptive network security.

5.1.1. Anomaly Detection

Anomaly detection identifies unusual patterns in network traffic that indicate a potential DDoS attack. In this experiment, we present how various models detect anomalies in the presence of both normal and attack traffic.
Table 4 presents the F1 scores obtained in TCN, LSTM, and Transformer. These models used two distinct labeling strategies for anomaly detection across multiple time windows: packet flow and intensity-time period labeling. The results show performance variations between the models and the labeling methods.
In packet flow labeling at a granular level of information, the TCN and LSTM models consistently outperform the Transformer across different time windows. The highest F1 score of 99.61% was achieved by LSTM in a 65-s window, closely followed by TCN in 99. 53% for the same window. In contrast, the performance of the Transformer remained comparatively lower, with a maximum of 97.90%. Time windows of 3–20 s resulted in lower F1 scores. This signifies that limited temporal information makes distinguishing anomalies difficult for the model. The model’s performance improved and stabilized as the time window increased from 25 to 80 s. This indicates that a larger time window provides more context and allows for more accurate detection.
The intensity-time period labeling approach emphasizes the time of peak attacks. This labeling shows consistently higher F1 scores across all models than packet flow labeling. The TCN achieved a peak performance of 99.86% at 35 s, and also from a 10–80 s time window has a consistent 99%, while the LSTM also reached 99% across a 15–80 s time window with the highest of 99.86% at 30 s, and indicates robustness to variation in different sequence lengths. In contrast, the Transformer model also performed better under this labeling method, achieving its best result of 99.13% at 80 s. However, it still lags behind TCN and LSTM models, potentially due to insufficient long-term sequence patterns, as it only achieves 99% at 80 s. The results indicate that intensity-based labeling focusing on the attack peak activity helps reduce the noise in the benign traffic and improves the attack discrimination in each model. Moreover, this labeling aligns with real-world DDoS attacks that display bursts of high-volume traffic.
TCN consistently demonstrated prominent performance across both labeling strategies among the evaluated architectures, indicating strong local pattern extraction and feature generalization capability. LSTM also performed competitively, particularly in longer windows, benefiting from its ability to model sequential dependencies. In contrast, the Transformer model used for sequence modeling showed lower performance, indicating the need for further optimization, such as model depth adjustment or pretraining with domain-specific data. The most effective time windows were observed in the 25 to 75-s range, where both packet-level and intensity-based labeling strategies produced the highest F1 scores. In time window analysis on anomaly detection, the performance at very short time windows (3–5 s) indicates insufficient temporal context for models to capture the advanced attack behavior, resulting in lower F1 scores across all models. The 1-s time window performance is similar in medium to high time windows, indicating that 1-s information can help detect the anomaly. In contrast, larger windows enable the accumulation of more discriminative statistical features that improve model stability and detection accuracy. However, larger windows (70–80 s) introduce operational latency and increased computational cost that is impractical for real-time applications. Based on these anomaly detection results, the optimal deployment range for real-time anomaly detection lies between 25 and 60 s to balance accuracy and detection latency while minimizing resource consumption.

5.1.2. Distributed Denial-of-Service Attack Classification

This experiment discusses the results of each labeling strategy on DDoS classification models to distinguish between legitimate traffic and different DDoS attacks. Deep learning models are tested in a classification task with 14 classes to determine their accuracy in detecting different DDoS attacks based on labeled datasets. Table 5 presents the F1 scores of TCN, LSTM, and Transformer in DDoS detection. Under the packet flow labeling strategy, the results show a trend of increasing F1 scores with longer time windows. TCN and LSTM models performed best in the 55–80 s range, peaking at 98.91% for TCN and 99.21% for LSTM. Although the Transformer model initially lagged 75.47% at 1 s, it exhibited progressive improvements, reaching 94.90% at 80 s.
The performance result shows that a longer temporal window helps models to capture more discriminative features essential for multi-class DDoS classification. However, the TCN and LSTM models consistently outperformed the Transformer across all window sizes, indicating their advantage in capturing spatial-temporal patterns in DDoS attacks. All models showed a significant performance boost with intensity-time period labeling. This labeling method significantly improved the classification effectiveness, especially in shorter windows. For instance, at just 10 s, the TCN and LSTM achieved F1 scores of 99.09% and 99.15%, in contrast to 92% scores under packet flow labeling for the same duration. In comparison, the Transformer model showed considerable progress under this strategy, peaking at 99.06% at 80 s. This indicates that intensity-based labeling enhances the model’s focus on critical attack periods that improve multi-class classification and mitigate label noise caused by benign traffic fluctuations.
The results support the effectiveness of intensity-time period labeling for multi-class DDoS classification tasks. Focusing on peak traffic segments associated with attack activity enhances model precision and reduces misclassification. It also provides better generalizability across varying time windows, with consistently high F1 scores observed even at shorter durations. In contrast, while packet flow labeling enables finer-grained annotation, it may weaken attack strength with noise from benign packets. As a result, models require longer temporal inputs to achieve comparable performance. The time window analysis for DDoS classification shows consistent trends across models. Performance was poor in the short time window range (3–5 s) due to insufficient aggregated temporal patterns to accurately distinguish between different attack types. In contrast, anomaly detection achieved higher performance within a 1-s time window than the 3–5-s range, showing the importance of temporal information in classifying various DDoS attack types by relying on capturing sequential patterns in the differentiation of each DDoS attack. While anomaly detection can effectively operate with minimal temporal context, DDoS classification models require medium to long windows to capture the complex temporal dependencies between network events. Detection performance improved as the time window increased, peaking between 50 and 75 s. For deployment, 25–60-s time windows balance detection latency and classification accuracy, particularly in high-speed network environments.

5.2. Simulating High-Volume Background Traffic for DDoS Detection

This experiment explores the impact of adding real high-volume background traffic to the DDoS detection dataset. By simulating realistic network environments with significant background traffic using MAWI Lab [38] traffic traces, the experiment evaluates how well the model learns and adapts to high-volume background traffic in detecting DDoS attacks, where the ratio of the attack volume is only up to 10%. MAWI (Measurement and Analysis on the WIDE Internet) Lab is a long-running project collecting daily traffic traces from a trans-Pacific backbone link of the WIDE network in Japan that is publicly available for traffic research. To achieve this, a full-day traffic trace from the MAWI archive dated 14 April 2021, was merged as the background traffic. This trace was randomly selected from the available MAWILab v1.1 traces to minimize selection bias and to capture real traffic patterns. The experiment aims to reflect real-world conditions where high-volume benign traffic might mask the signs of an ongoing attack.

5.2.1. Evaluation of DDoS Detection Models in High-Volume Conditions

Figure 5 shows the performance comparison of F1 scores for TCN, LSTM, and Transformer models in their original CICDDoS2019 and merged MAWI + CICDDoS2019 datasets. It shows the model’s generalization in handling high-volume real background traffic over varying time window sizes. In the overall comparison of the merged models in Figure 5d, both TCN (Merged) and LSTM (Merged) consistently outperform Transformer (Merged) in all time window sizes, achieving F1 scores of up to 99% even for larger windows. It indicates that the Transformers have difficulty capturing complex patterns in high-volume traffic data. LSTM (Merged) shows competitive performance, particularly in mid-range time windows (20–50 s). However, it exhibits a slight decline and fluctuation as the window size increases, likely due to its inherent challenges in retaining long-term dependencies. The TCN (Merged) model exhibits consistent performance convergence as the time window increases. Initially, it lags behind the other models at smaller time windows. Still, it demonstrates a smoother convergence curve as the feature extraction efficiency improves with larger time windows under dynamic traffic patterns.
Analyzing individual models highlights the effect of merging high-volume background traffic on performance. For the TCN in Figure 5a, merging improves stability. It maintains higher F1 scores across all windows, particularly for smaller time windows that increase the F1 score by about 2–4% compared to the original model. The LSTM in Figure 5b shows more noticeable benefits from merging as the small windows F1 score improves by 3–4%, but shows slight performance fluctuation as the window size increases. The Transformer in Figure 5c exhibits improved F1 scores in smaller windows, but the divergence between original and merged results as the time window increases shows its vulnerability in high-volume traffic. These findings indicate that merging improves the scalability and generalizability of all models, especially in smaller windows. TCN is shown to be the most suitable for real-world applications involving dynamic high-volume traffic. The LSTM alternative is for high-performing scenarios in small to mid-size time windows. The Transformer can be better suited for specific and less dynamic environments. The results emphasize the importance of model selection, merging techniques, and TCN as the leading choice for complex and high-volume traffic.

5.2.2. Reliability and Efficiency of DDoS Model Architectures

To improve the reliability and robustness of the reported performance, we evaluated each model using stratified 5-fold cross-validation in a merged CICDDoS2019 + MAWI dataset in the Intensity-Time Period label, shown in Table 6. Given the highly imbalanced nature of our dataset across different DDoS attack types and benign traffic (see Table 3),it captures the aggregated impact of each class over time, which is more representative of real-world network monitoring conditions. Some attack types, such as TFTP and Syn, have thousands of samples, while other attacks, like Portmap and WebDDoS, are significantly undersampled. A simple random split would likely cause these minority classes to be absent or severely underrepresented in some folds, skewing the evaluation and potentially biasing the learning process. Stratified cross-validation ensures that each fold maintains the same relative distribution of all attack classes and benign traffic, providing more reliable, consistent, and generalizable performance estimates. This is particularly critical in high-class-imbalance scenarios where conventional cross-validation may fail to expose the model’s weaknesses on minority classes. It provides enough variance to calculate standard deviations of the performance metrics across folds, which we report to reinforce confidence in the model’s stability under different traffic conditions.
Table 6 shows the mean and standard deviation (std) for Recall, Precision, F1 Score, and Inference Time. The CNN model achieved consistent performance with a low standard deviation across all metrics, highlighting its reliability and stability in classification tasks. At the same time, the LSTM model exhibited slightly higher variance in recall and F1 scores, indicating more fluctuation in detection sensitivity across folds. The Transformer model showed relatively strong precision of 97.04% and had the lowest recall of 95.49% among the three, indicating it is missing positive cases. Also, the Transformer had the highest inference time (2.35s ± 0.78), making it less suitable for real-time detection compared to CNN (0.34s ± 0.04) and LSTM (1.23s ± 0.14). These results show that CNN offers the best trade-off between high performance and low computational cost for real-time intrusion detection scenarios.

5.3. SHAP Analysis Simulation

In this experiment, applying SHAP (Shapley Additive exPlanations) analysis on the trained models helps to gain insights into the model’s decision-making. This analysis helps to interpret the model outputs by identifying the most critical features in model predictions and shows transparency into how the models classify DDoS attacks on network traffic. Due to limitations in SHAP’s DeepExplainer, PyTorch RNN-based models such as LSTM are excluded from the explainability analysis, as they are not officially supported and may result in misleading attributions [13,39]. As a result, only the TCN and Transformer models are included in the SHAP analysis, while the LSTM-based models are excluded.

5.3.1. SHAP Feature Importance on Original Background Traffic

This experiment discusses the SHAP analysis results when applied to the model trained on the original background traffic. By examining how each feature impacts the model’s decision-making, we explore the model’s ability to discern attack patterns in natural traffic fluctuations.
Figure 6 presents a comparative summary plot of SHAP analysis of the top 20 features that influence the TCN and Transformer model predictions trained on the original CICDDoS2019 dataset. For the TCN model shown in Figure 6a, the analysis indicates that TTL_std, TTL_s_entropy, and Destination_Port_std are the top three influential features of the model’s predictions. The SHAP values for these features range from −0.3 to 0.4, indicating a moderate yet significant impact on the classification outcomes. Higher (red color) TTL_std and Destination_Port_std values increase the probability of a DDoS detection, while lower (blue color) values correspond to a decreased likelihood. Additionally, TCN shows sensitivity to inter-arrival times and window size features, such as iat_max and window_size_q1. However, these have a relatively lower contribution than TTL and port-based statistics. The importance of ports and TTL features indicates that the TCN model takes advantage of the spatial irregularities associated with DDoS attack traffic, such as changes in TTL and ports.
In contrast, the Transformer model’s SHAP summary plot shown in Figure 6b indicates different important features. TTL_s_entropy is the most important feature, followed by protocol-related features such as Protocol_q2, Protocol_max, and Protocol_med. The range of SHAP values in the Transformer extends from -0.4 to 1.0. This shows that the model’s shap values have a more decisive view of feature contributions. Unlike TCN, the Transformer focuses on entropy-based and protocol distribution features, emphasizing its ability to capture sequential and temporal dependencies characteristic of DDoS traffic. Features like window_size_s_entropy and iat_s_entropy are important in the Transformer’s predictions, which indicate focus on irregular traffic flow and behavior patterns, while TCN focuses on static metrics on window size. While both models effectively detect DDoS attacks, they differ in their reliance on particular traffic features. The TCN model mainly depends on static packet-level features such as port and TTL statistics, while the Transformer model depends on sequence-based, entropy-driven, and protocol-related features. This difference shows how model architecture influences feature interpretation and decision-making. The Transformer’s ability to capture temporal and sequential anomalies gives it a broader interpretative range, while the TCN remains efficient in identifying localized feature variations common in attack traffic.
Table 7 highlights the top 20 most influential features from the Transformer and TCN models, presenting a consolidated view of which traffic features most significantly impact DDoS detection performance in the original CICDDoS2019 dataset. TTL_s_entropy ranks constant at the top for both models. Statistical Features such as Destination Port_max, Source Port_std, and TTL_std indicate the importance of packet-level statistics in identifying anomalous traffic behaviors. Entropy-based features such as iat_s_entropy, ip_length_s_entropy, and window_size_s_entropy maintained in the combined ranking show the significance of traffic flow irregularities across both models. The combined ranking shows balanced packet-level, entropy-based, and protocol-related features as the main contributions to DDoS attack detection.
Figure 7 SHAP analysis results comparing model performance with the top 20, 15, and 10 features on classification effectiveness across TCN, LSTM, and Transformer architectures. All models maintained stable F1 scores when features were reduced from the original to the top 20 and 15, with only slight performance decreases. A more noticeable performance drop occurred when using only the top 10 features, showing a critical point below which model effectiveness begins to degrade. The 40–60-s time windows showed the most consistent performance across different feature sets, indicating temporal stability in this range.
The results show the trade-off between computational efficiency and model performance. Reducing the features to 20 resulted in only a 2–3% decrease in F1 score compared to the complete feature set, which makes it applicable to high-speed network processing resource-constrained environments. In deployment setup, retaining 15–20 features appears optimal for balancing efficiency and effectiveness. On the other hand, using the top 10 features is sufficient in scenarios where minor performance losses are all right. The results show the value of SHAP-based feature selection in optimizing model architectures without significantly sacrificing classification accuracy.

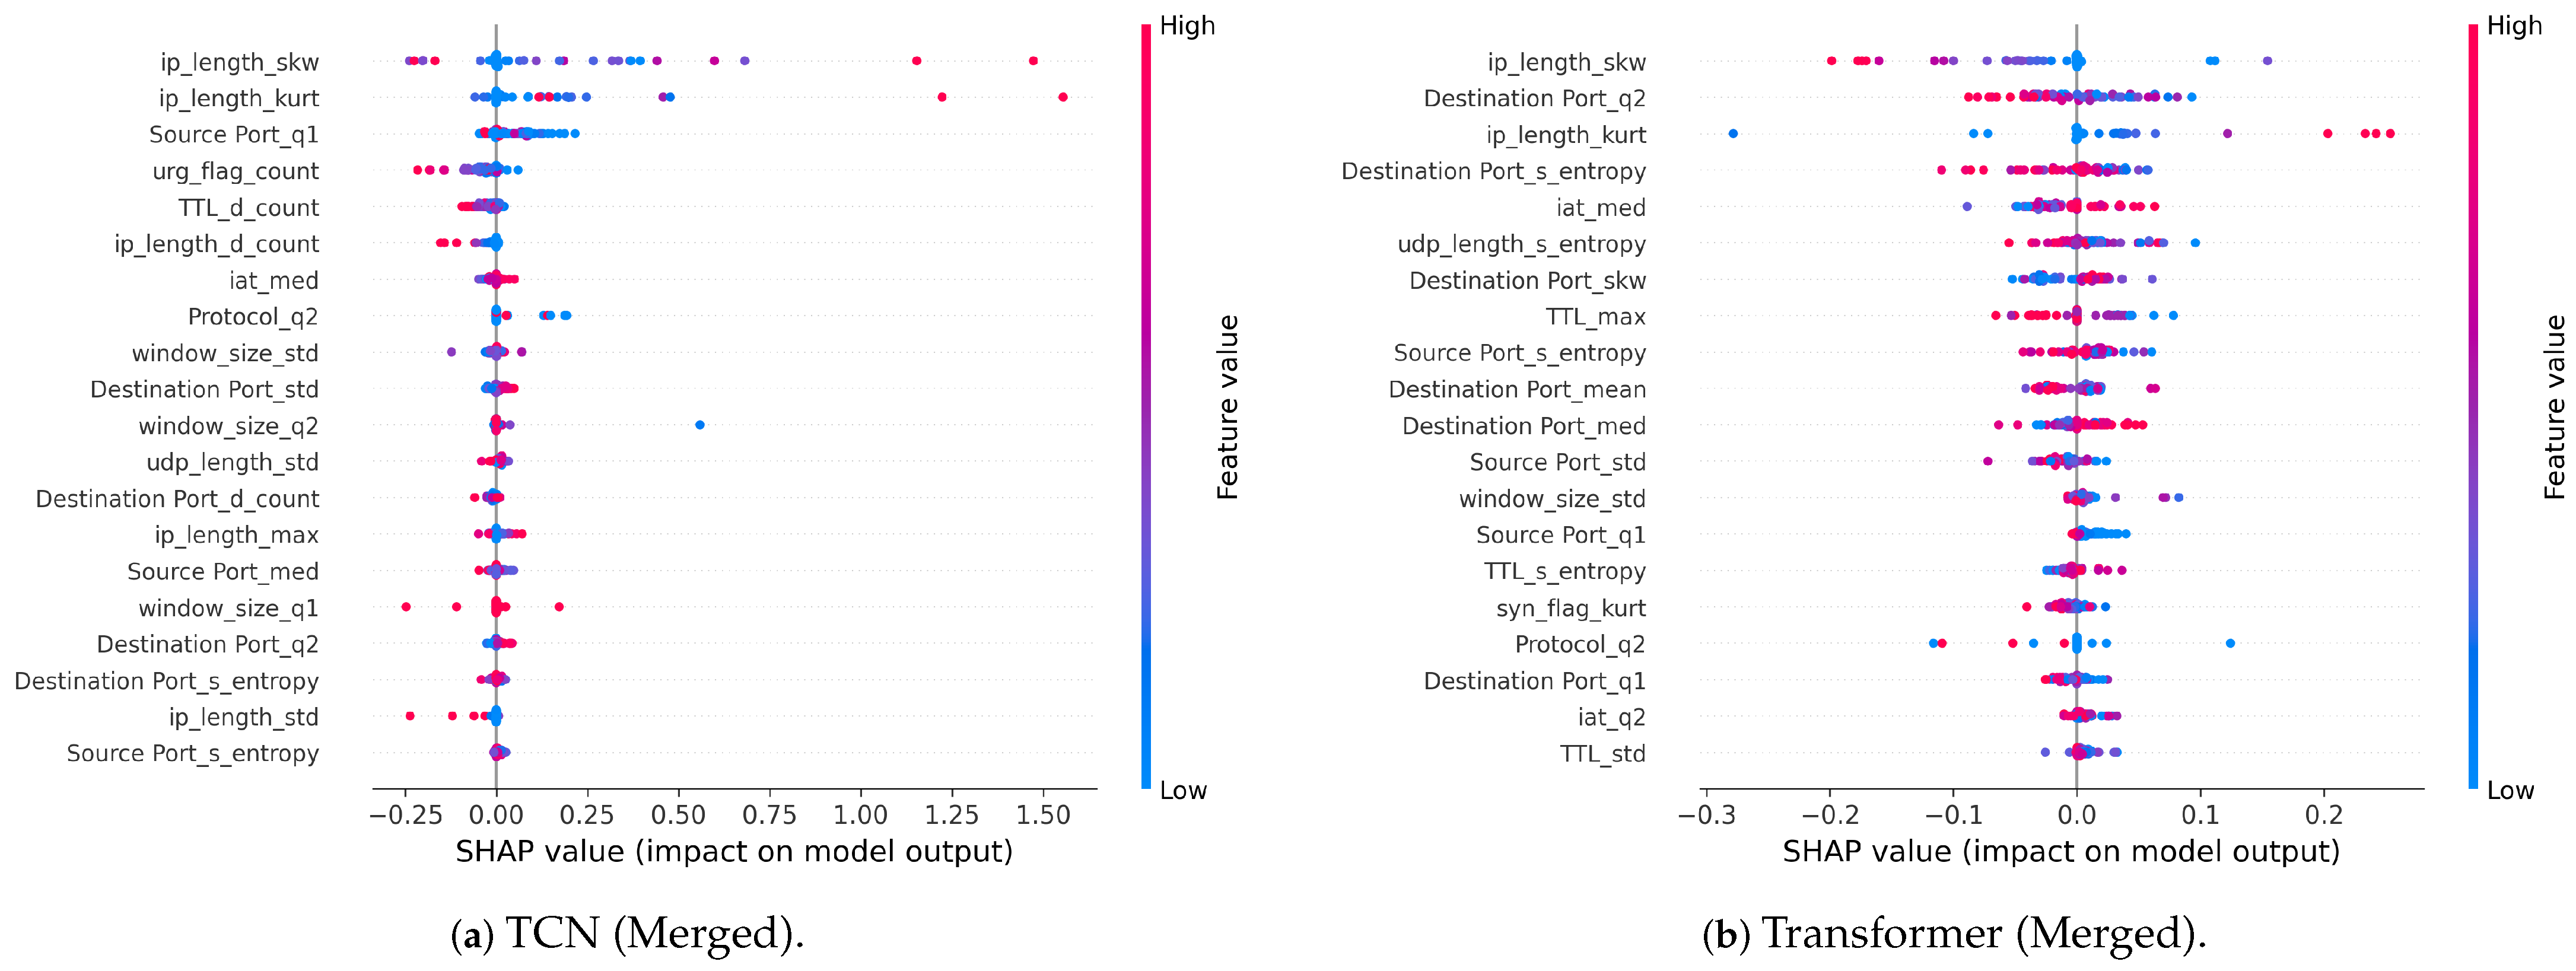
5.3.2. SHAP Feature Importance on MAWI-CICDDoS2019 Merged Background Traffic

This experiment presents the SHAP analysis results for models trained on the merged MAWI + CICDDoS2019 datasets. This analysis provides insights into complex and high-volume traffic and reveals its robustness in diverse network conditions.
Figure 8 shows a comparative summary plot of SHAP analysis of the top 20 features that influence the TCN and Transformer model predictions trained on the merged MAWI and CICDDoS2019 dataset. For the TCN model shown in Figure 8a, the most relevant features were primarily related to the statistical characteristics of IP length and port distributions. For example, ip_length_skw, ip_length_kurt, and Source_Port_q1 had the highest SHAP values that strongly influence the model’s predictions. High values of ip_length_skw and ip_length_kurt, which correspond to packet length skewness and kurtosis, were associated with an increased probability of an attack classification. The SHAP color patterns further showed that lower values of features such as Source Port_q1 and ip_length_d_count contributed positively to attack prediction. In comparison, higher skewness values and kurtosis in packet length had the same effect. It indicates that rarity and abnormality in feature distributions are important indicators for TCN.
In contrast, the Transformer model shown in Figure 8b emphasized distributional and entropy-based features. While ip_length_skw remained the top contributor in the TCN model, the Transformer gave more weight to features such as Destination Port_q2, Destination Port_s_entropy, and udp_length_s_entropy. Features like TTL_s_entropy, Source Port_s_entropy, and iat_q2 further show the model’s ability to focus on complex patterns and anomalies that are less noticeable in simple statistical information.
Both models show standard-related features such as IP_length_skw and port-related quantiles, which emphasize their central role in DDoS detection. The TCN model aligns with localized features such as counts and moments in identifying peak traffic attacks, while Transformers strengths lie in identifying subtle distributional patterns and making them better at identifying low-rate attacks.
Table 8 presents the top 20 features ranked based on a combined scoring system that integrates individual importance scores from the Transformer and TCN models in merged MAWI-CICDDoS2019. The top two features are ip_length_skw and ip_length_kurt, which are the most influential for both models. This highlights that packet length distribution, such as skewness and kurtosis, is a critical feature of DDoS attacks. Median inter-arrival time (iat_med) and entropy or statistical quantiles related to source and destination ports also appeared in the rankings, reflecting the importance of both time and ports in DDoS classification. The combined ranking supports the value of statistical and entropy-based features in enhancing detection performance on different deep-learning architectures.
Figure 9 The SHAP analysis on the merged dataset (MAWI-CICDDoS2019) reveals distinct performance patterns when reducing features to the top 20, 15, and 10. In this scenario, TCN and LSTM models perform better than Transformer, particularly in shorter time windows (0–10 s). The F1 scores for TCN show significant improvements in low time windows (below 5s) when using reduced feature sets, indicating that the model benefits from feature pruning in high-volume traffic conditions. On the other hand, the Transformer exhibits relatively stable but lower performance across all time windows, indicating it may be less suited for this specific traffic environment. The improvement plots highlight that reducing features enhances TCN’s effectiveness for the top 20 and 15 features, where its F1 score surpasses both LSTM and Transformer in the early time window. This improvement derives from removing redundant or noisy features introduced by background traffic, allowing TCN’s localized feature extraction to better focus on discriminative patterns. LSTM also performs well and maintains competitive F1 scores across most time windows, though it shows less noticeable gains than TCN in shorter intervals. These findings recommend that TCN is particularly effective in real-time, high-volume scenarios where rapid feature processing is critical, and LSTM provides a balanced performance across varying time scales. The Transformer’s shown weaker performance indicates that its attention mechanism may struggle with the merged dataset’s noise, making it less optimal for this application. For deployment, retaining 15–20 features appears optimal, and it balances efficiency and accuracy while maximizing TCN’s strengths in low-latency detection.

5.3.3. Common Discriminative Features Analysis

Table 9 presents the top-20 ranked feature list of both CICDDoS2019 and merged MAWI + CICDDoS2019 Datasets. The common features, including Destination Port_std, Destination Port_s_entropy, Protocol_q2, Source Port_med, and TTL_max, validate their relevance across both datasets and also align with the directions of the proposed real-time DDoS detection architecture. The persistence of these features in top SHAP rankings suggests they encapsulate key discriminative patterns associated with DDoS behavior, such as high entropy in TTL values or unusual port usage distributions. While the original dataset places stronger emphasis on TTL and port standard deviations, the merged dataset shifts some importance toward ip_length_skw and ip_length_kurt, indicating that feature saliency adapts slightly in response to the complexity and variability introduced by MAWI traffic. The common presence of several features highlights their essential role in enabling effective and interpretable DDoS detection in different traffic environments. These findings support the value of SHAP-guided feature selection in identifying common indicators of attack behavior that remain stable across real-world and synthetic traffic blends. These changes are also reflected in the cumulative SHAP contribution analysis, where the top 20 features account for 71.35% and 73.49% of the total importance in the TCN and Transformer models, respectively, using the original dataset. After merging, the TCN model’s cumulative importance increased slightly to 73.54%. At the same time, the Transformers decreased to 69.11%, suggesting that TCN benefited from the additional traffic diversity. In contrast, the Transformer was more affected by increased noise and variability (see Appendix C, Figure A1 for detailed graphs).
Although the SHAP analysis experiment excludes the LSTM-based models due to compatibility limitations between the SHAP package and the PyTorch RNN module, the analysis still provides valuable insights into model behavior. Notably, SHAP analysis of the TCN and Transformer models revealed consistent influential features. Furthermore, the practical relevance of the SHAP-derived features is evident in our evaluation. Using the Top-k combined features identified through SHAP, we observed that the LSTM model still outperforms the Transformer in certain conditions in complex and high-volume traffic environments despite being excluded from the SHAP process. Because these features consistently contribute to high model performance, their integration ensures accuracy and model interpretability, which is critical for real-time systems. The objective is a lightweight, modular, and high-speed operation of the system to scale across deployment environments and application domains. These features are computationally efficient and well-suited for the Hardware-Accelerated Statistical Method Layer extraction process in sketch-based algorithms and FPGA hardware modules that perform high-speed and low-latency processing. The features’ simplicity and discrimination reduce the burden on downstream processing and enable the system to maintain throughput even under high-volume traffic. Furthermore, these features are the primary inputs to the GPU-accelerated deep Learning Method Layer using deep learning models such as LSTM, TCN, and Transformers.

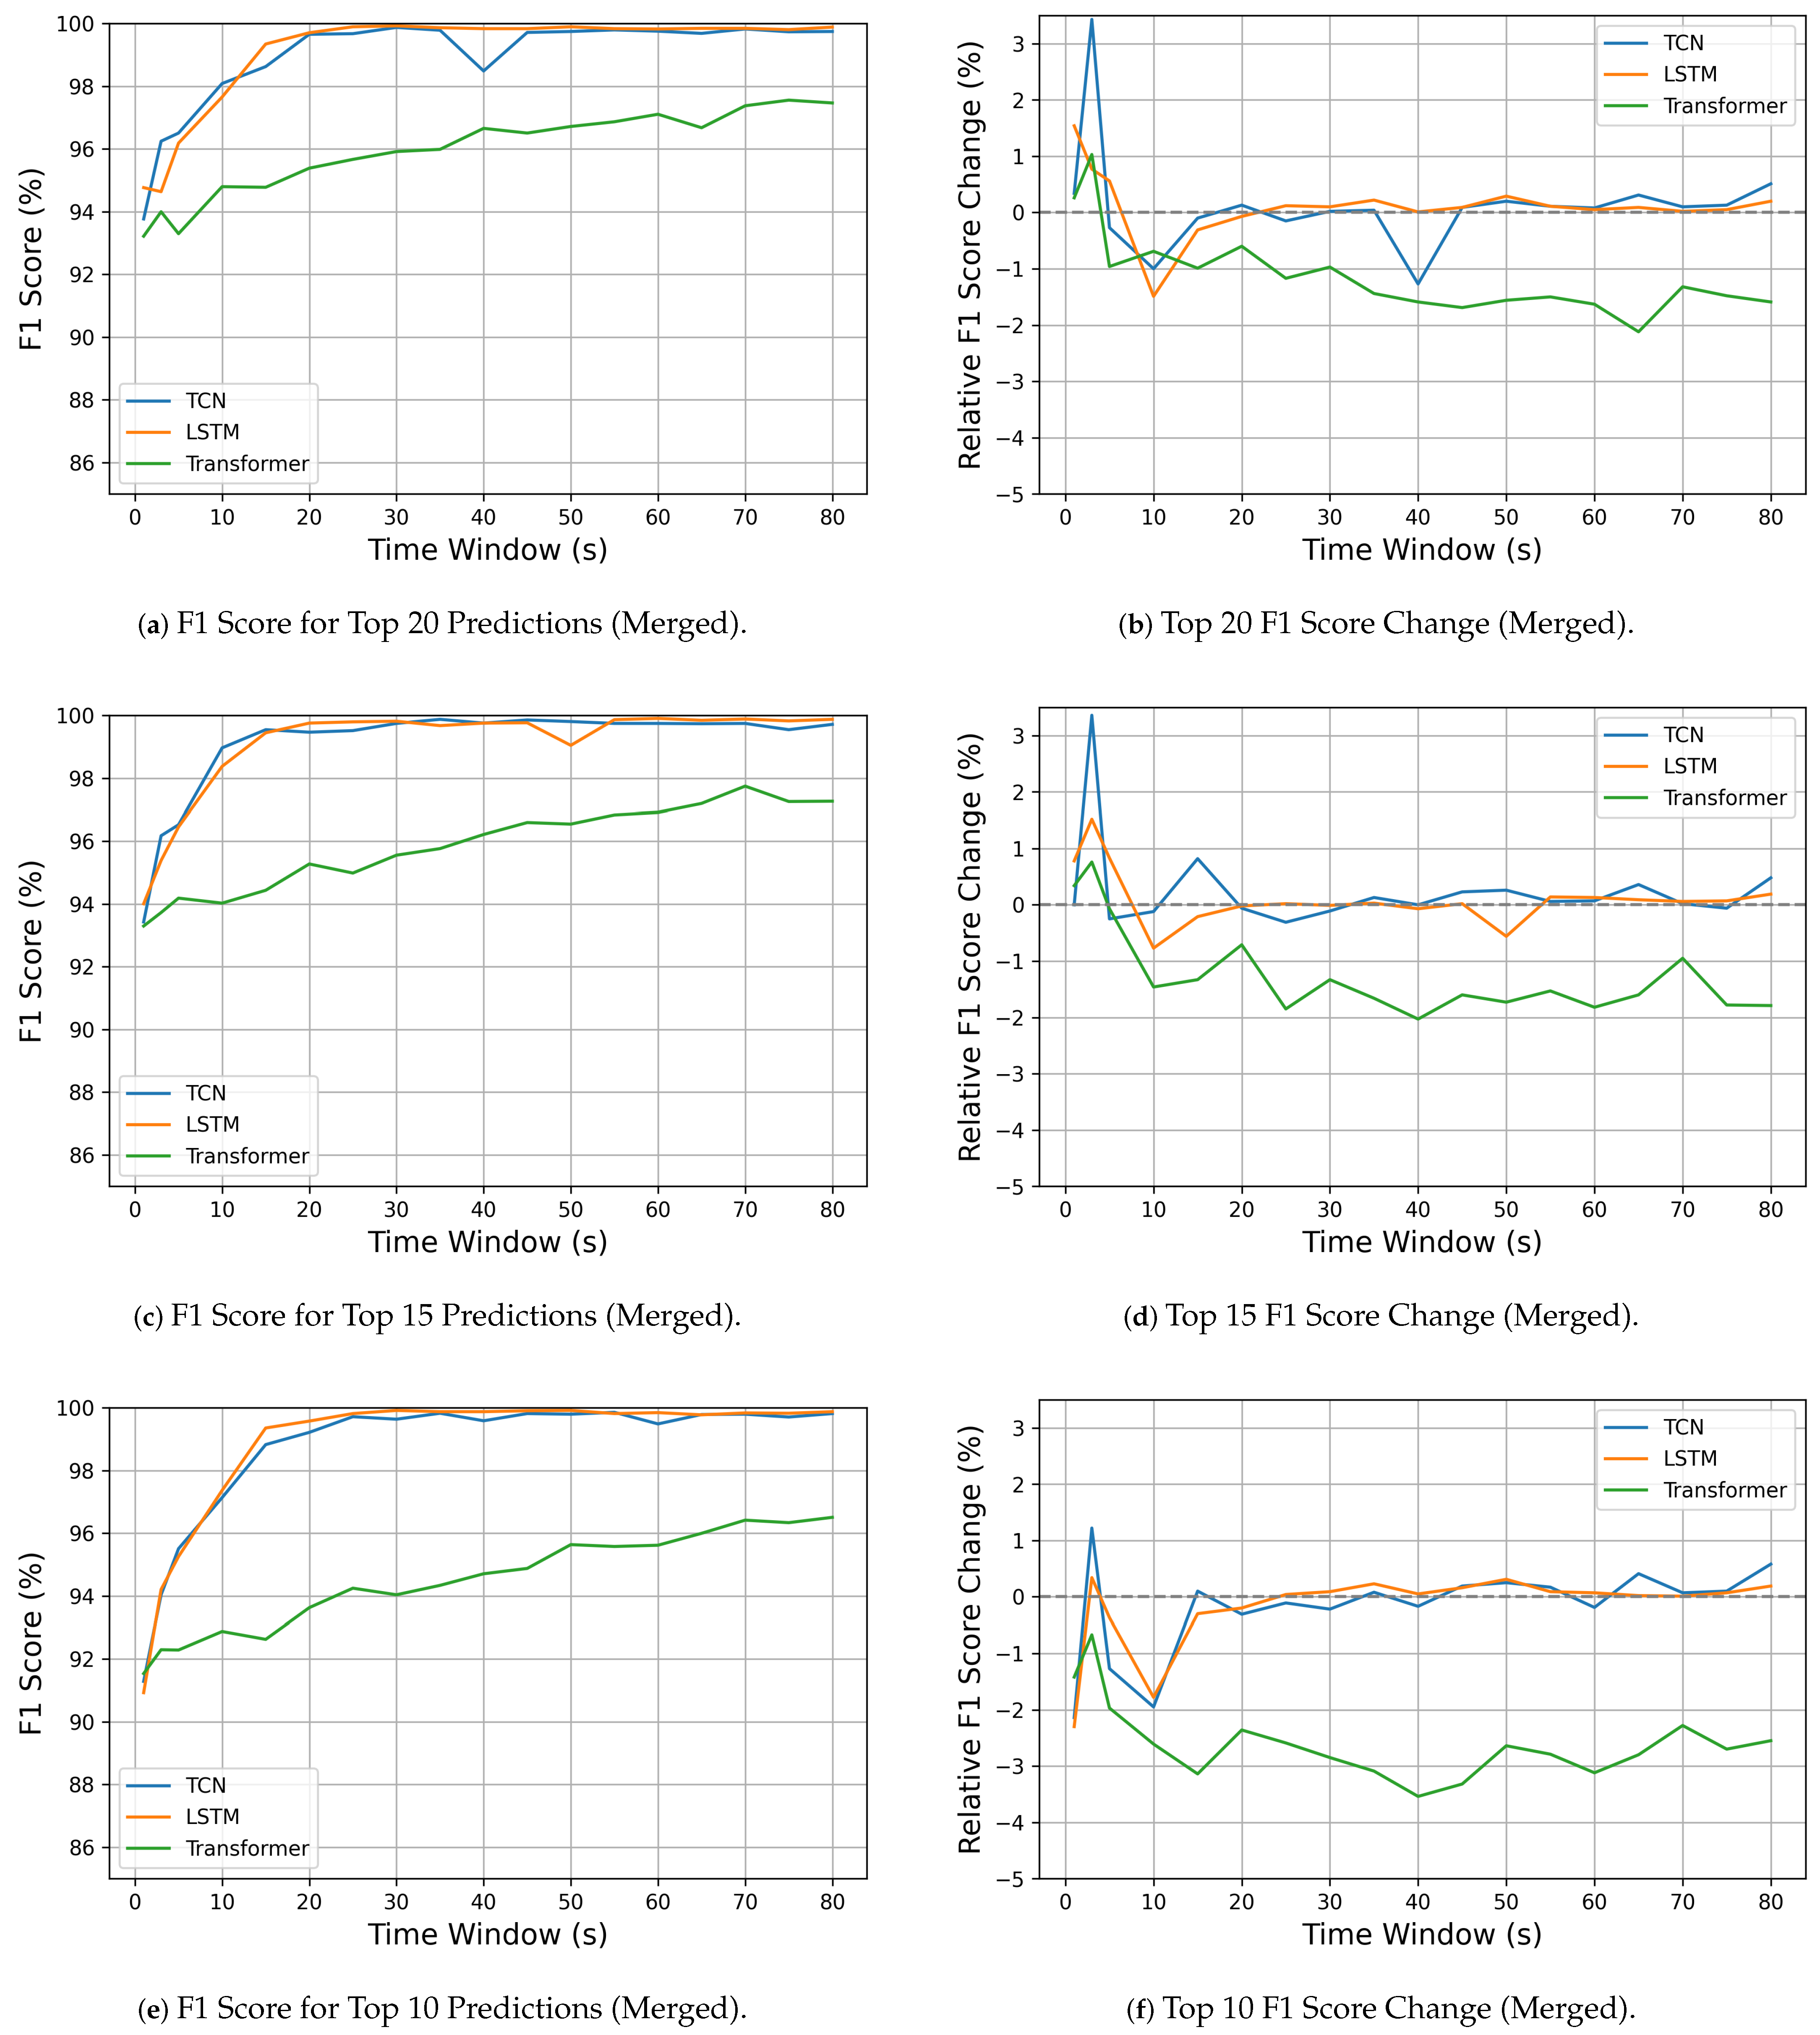
5.4. Model Performance Trends Across Detection Scenarios

Following the comprehensive performance evaluation and explainability analysis presented in the prior sections, this section consolidates the results across all experiments based on anomaly detection, multi-class DDoS classification, high-volume background traffic simulations, and SHAP-based feature elimination. The purpose is to provide a comparative interpretation of the behavior, stability, and limitations of the three deep learning architectures: Temporal Convolutional Networks (TCN), Long Short-Term Memory (LSTM) networks, and Transformer-based models.

5.4.1. Model Detection Performance

TCN consistently shows better detection accuracy among the evaluated models across all observation window sizes. Its use of 1D convolutions with hierarchical receptive fields enables efficient capture of local temporal patterns while remaining computationally lightweight and highly parallelizable. This design allows TCN to maintain consistent performance, even under high-volume background traffic conditions and when features are reduced through SHAP analysis. In contrast, the Transformer model showed significant challenges at shorter time windows, and its reliance on global attention mechanisms struggled to extract meaningful temporal dependencies from limited sequential patterns [40]. This led to lower F1 scores than TCN and LSTM in anomaly detection and classification tasks. Meanwhile, Transformer performance improved progressively as the time window length increased, showing its strength in long-range dependencies. The advantage comes at the cost of increased computational complexity, which can hinder its feasibility for real-time detection in high-speed networks. Furthermore, the SHAP-based feature elimination experiments validated these observations. When reducing feature sets to the top 10, 15, and 20 most important variables, the Transformer’s performance declined more significantly than TCN and LSTM, confirming its greater sensitivity to feature availability and input dimensionality. TCN maintained its resilience and stability even with reduced feature inputs, reinforcing its practicality for deployment in resource-constrained and latency-sensitive environments. These findings show that the Transformer model requires further optimization to adapt effectively to high-speed and feature-reduced scenarios. Moreover, Transformers can be better suited for larger input ranges or batch processing contexts instead than low-latency detection tasks.

5.4.2. Inference Latency and Computational Efficiency

Figure 10 presents the relationship between inference time and time step, averaged across experiments involving feature elimination (top 20, 15, and 10 features) on original and merged datasets. The focus is on the pattern of inference time rather than model-to-model comparison, as the models are not optimized. The inference time for the TCN remains low and stable across all time steps, indicating that its computational cost does not increase with longer input sequences. It indicates that TCNs are well-suited for real-time applications with essential constant latency. In contrast, the LSTM exhibits a linear trend in inference time as the number of time steps increases. The linear increase is due to the sequential nature of LSTM processing, which extends the sequences, resulting in greater computational demands. As a result, expanding the sequence length increases the computational demand and inference time. The observation is identical to the study of Hansen et al. [41], where the authors discuss how LSTM inference time is linearly related to input length. The study emphasizes that sequential processing prevents parallel execution across time steps and leads to increased inference latency as sequences increase. The Transformer model shows a relatively constant inference time, with only minor fluctuations, and utilizes its parallel processing capabilities. Its baseline inference time is higher than the TCN and initially comparable to the LSTM. This experiment shows that the inference time patterns reflect the architectural differences of the models in processing sequential data, and sequence length has a more critical role than feature dimensionality in influencing inference time.

6. Threats to Validity

This section discusses potential threats to the validity of our findings and acknowledges the limitations of our proposed real-time DDoS detection architecture.

6.1. Threats to External Validity

External validity threats focus on the generalizability of the results and the replicability of experimental findings across different environments and conditions. In this study, we utilized CICDDoS2019 and MAWILab, which are publicly available DDoS datasets. Although these datasets are widely used in recent studies [7,16,19], they may not fully capture the diversity of evolving DDoS attacks, traffic patterns, and network behaviors observed in real-world high-speed networks. The characteristics and possible biases of these datasets may limit the direct applicability of the model’s performance to a real-world environment. To address some of these limitations, we combined CICDDoS2019 with MAWILab to simulate a high-speed backbone environment with diverse and realistic traffic patterns. This integration enhances external validity by introducing complex and noisy backbone traffic, where the ratio of attack to benign flows is substantially reduced. Notably, low-rate attack types such as Portmap and UDP-Lag account for less than 1% of the overall traffic in the merged dataset. This low visibility better reflects operational environments, particularly in MAWI’s internet backbone traces that make benign traffic dominate. Such an imbalanced setting poses a greater challenge for the detection model and improves the robustness of our evaluation. The current study focuses primarily on detecting common DDoS attack types. However, this study does not thoroughly assess how effective the proposed architecture is against advanced attack vectors like stealthy attacks, limiting the findings’ broader applicability to advanced DDoS systems. The experiment data used are publicly available with a controlled environment setup. The performance metrics, such as detection latency and accuracy, may vary under real-world operational conditions involving fluctuating network loads, heterogeneous hardware infrastructures, and different bandwidth capacities across various attack intensities.

6.2. Threats to Internal Validity

Threats to internal validity occur from architectural design, model parameterization, and experimental setup. This study proposes and theoretically validates a novel architectural framework for real-time DDoS detection. Although the experimental results are based on the model performance, they do not include a full-scale, production-level deployment in an operational network environment. Practical factors such as system integration complexity and hardware compatibility, which are essential components of real-world deployment, are beyond the scope of this investigation. These aspects represent limitations regarding the immediate applicability of the proposed framework in real-world integration settings. The performance of deep learning models inherently depends on architectural configuration. However, in this work, we did not perform extensive hyperparameter optimization. This study aims to assess the detection performance of various model architectures under different time windows. The method aimed to identify the dataset attack’s most effective temporal resolution and examine how different features influence model decisions across architectures. The results are based on baseline implementations without hyperparameter fine-tuning. Although further optimization could improve detection accuracy and reduce inference latency, our focus on comparative temporal evaluation and architectural interpretability provides foundational insights. The methodology incorporates SHAP-based analysis to assess feature importance and guide potential feature pruning. While this method offers valuable interpretability, the computational resource implications of SHAP-based pruning in real-time deployment scenarios have not been fully quantified. Moreover, in dynamic network environments, the relevance of individual features may shift over time.

6.3. Threats to Construct Validity

Threats to construct validity concern the extent to which the selected evaluation metrics accurately capture the underlying concepts being studied. Although this study targets real-time DDoS detection, the current evaluation metrics may not fully encapsulate the subtle requirements of real-time performance in high-speed network environments. Based on model inference within a GPU-accelerated environment, the reported metrics partially reflect real-time characteristics but may not account for full system-level constraints and integration challenges in real-world deployments.

7. Conclusions

This study proposed a real-time Distributed Denial-of-Service (DDoS) detection architecture tailored for high-speed network environments. Using multivariate time series features derived from raw packet headers and integrating deep learning models: Temporal Convolutional Networks (TCN), Long Short-Term Memory (LSTM) networks, and Transformer architectures. The performance evaluation across different time window lengths confirmed that larger observation windows enhance detection accuracy. TCN and LSTM models consistently outperform the Transformer in complex, high-volume traffic environments. In terms of model latency, TCN and Transformer exhibited constant latency across all time windows, while the LSTM model’s latency increased linearly as the time window size increased. Considering both latency and detection performance, the TCN model demonstrated the most balanced and efficient results, making it well-suited for the proposed real-time and high-speed DDoS detection applications.
The application of SHAP (SHapley Additive exPlanations) analysis identified the most discriminative traffic features contributing to DDoS detection. This feature selection approach improved model interpretability and reduced computational overhead to support real-time deployment feasibility on hardware-accelerated platforms. Experiments integrating high-volume background traffic further validated the robustness and adaptability of the proposed architecture under realistic network conditions. Future work will explore hybrid models, optimize deep learning architectures, and integrate the complete system architecture to validate its end-to-end performance and scalability in real-world, high-speed network environments, including evaluating the approach on additional datasets (e.g., CAIDA, UNSW-NB15), analyzing hyperparameter sensitivity, and incorporating adaptive feature selection to ensure robustness under evolving network conditions and operational variability.

Author Contributions

Conceptualization, Y.-K.L. and D.V.H.; Methodology, D.V.H., Y.-K.L. and H.T.N.I.; Software, D.V.H.; Formal analysis, D.V.H.; Resources, Y.-K.L.; Data curation, D.V.H.; Validation, D.V.H. and H.T.N.I.; Writing—original draft preparation, D.V.H. and H.T.N.I.; Writing—review and editing, D.V.H., H.T.N.I. and Y.-K.L.; Visualization, D.V.H.; Project administration, Y.-K.L.; Funding acquisition, Y.-K.L. Supervision, Y.-K.L. All authors have read and agreed to the published version of the manuscript.

Funding

This research was funded by the National Science and Technology Council (NSTC), Taiwan, under grant numbers MOST 111-2221-E-033-032-MY2 and NSTC 113-2221-E-033-056.

Data Availability Statement

The datasets used in this study are MAWI Traffic Archive and CICDDoS2019. The MAWI dataset can be accessed at http://www.fukuda-lab.org/mawilab/v1.1/2021/04/14/20210414.html (accessed on 7 May 2025), and the CICDDoS2019 dataset is available at https://www.unb.ca/cic/datasets/ddos-2019.html (accessed on 7 May 2025). Processed data are available upon request from the corresponding author. More detailed metrics of the experiment are provided in Appendix B.

Conflicts of Interest

The authors declare no conflicts of interest.

Appendix A. Model Parameters

Table A1. TCN Model Parameters.
ParameterValue
Number of convolutional layers2
Conv1d layer 1: out channels64
Conv1d layer 1: kernel size3
Conv1d layer 1: padding1
Conv1d layer 2: out channels128
Conv1d layer 2: kernel size3
Conv1d layer 2: padding1
Global average pooling1
Fully connected layer256
Activation functionsReLU
OptimizerAdam
Table A2. LSTM Model Parameters.
ParameterValue
Number of layers4
Number of LSTM units256
Dropout rate0.3
OptimizerAdam
Table A3. Transformer Model Parameters.
ParameterValue
Number of layers6
Number of attention heads4
Feed-forward dimension512
Embedding/model dimension512
Positional encodingYes
MaskingNo
Dropout rate0.5
OptimizerAdagrad

Appendix B. Detailed Model Metrics

Table A4. Detailed performance comparison of TCN, LSTM, and Transformer models across different time windows for anomaly detection in packet flow labeling.
TW (ms)TCN (%)LSTM (%)Transformer (%)
RecPreF1AIT (ms)RecPreF1AIT (ms)RecPreF1AIT (ms)
198.0298.0198.010.4797.9597.9597.940.4197.2597.2597.242.09
394.9694.9894.960.4695.8295.8195.810.5794.9495.1495.002.28
595.6995.6795.670.4993.7393.7793.740.7393.0694.0593.312.26
1095.6995.7295.700.4794.0994.0694.070.8893.8194.2393.942.29
1597.7497.7397.730.4996.8496.8496.831.0994.4694.9494.592.30
2097.4297.5597.450.4696.9596.9596.941.1193.9294.7194.142.33
2598.3798.3698.350.5198.6298.6298.611.3995.8295.9195.852.20
3098.1098.1898.120.4897.8597.8597.841.5196.3296.5096.372.28
3598.4798.4798.440.4598.8598.8698.851.7096.4096.6696.482.24
4098.7898.8098.780.4098.2098.1998.191.7995.2796.0695.462.19
4599.0599.0599.040.5199.1599.1599.151.9896.9897.1397.032.27
5099.0099.0098.990.4798.6098.6098.602.1096.8896.8996.882.21
5599.3899.3999.380.5299.1799.1799.162.3897.4597.6197.492.47
6099.0599.0899.050.4899.2299.2199.213.1697.6397.7297.662.44
6599.5399.5399.530.4999.6299.6299.612.5997.8597.9097.862.39
7098.8598.9298.860.5199.0099.0199.002.8697.9097.9197.902.49
7599.4799.4799.460.5999.5099.5199.502.9897.6597.8997.702.54
8098.9398.9698.940.5399.0799.0799.063.0997.7697.9397.802.55
Note: Rec = Recall, Pre = Precision, F1 = F1 Score, AIT = Average Inference Time (ms).
Table A5. Detailed performance comparison of TCN, LSTM, and Transformer models across different time windows for anomaly detection in intensity-time period labeling.
TW (ms)TCN (%)LSTM (%)Transformer (%)
RecPreF1AIT (ms)RecPreF1AIT (ms)RecPreF1AIT (ms)
195.3195.3795.280.4695.2795.4395.230.5695.0795.2095.032.11
394.5194.5094.490.4794.0194.0094.000.5595.2195.2595.182.27
597.1097.1097.100.4895.7795.7895.760.7395.5795.6095.552.37
1099.7099.7099.700.4998.8298.8298.811.1096.4096.4096.402.38
1599.7099.7099.700.4799.7299.7299.711.1396.7596.7596.752.39
2099.5799.5799.560.4899.8399.8399.831.1896.9997.0396.972.51
2599.8399.8399.830.4999.7799.7799.761.3397.5497.5397.532.14
3099.8399.8399.830.4699.8799.8799.861.6199.8799.8797.832.19
3599.8799.8799.860.4999.7099.7099.701.7297.9897.9897.982.17
4099.7299.7299.710.4299.7599.7599.751.7998.4898.4898.482.23
4599.8399.8399.830.4699.8399.8399.831.9998.3298.3398.312.29
5099.6899.6899.680.4999.7599.7599.752.4698.1798.1998.164.29
5599.8299.8299.810.4999.8399.8399.832.3498.9798.9798.962.44
6099.8299.8299.810.4999.3599.3599.342.5098.5898.5898.582.48
6599.4099.4199.400.4999.8099.8099.792.6398.0098.0498.002.43
7099.7599.7599.740.5299.2899.2999.283.5898.8398.8598.832.42
7599.8099.8099.790.5299.8399.8399.833.0398.9598.9598.942.47
8099.6299.6299.610.4999.7299.7299.713.1699.1398.1398.132.47
Note: Rec = Recall, Pre = Precision, F1 = F1 Score, AIT = Average Inference Time (ms).
Table A6. Detailed performance comparison of TCN, LSTM, and Transformer models across different time windows for DDoS detection in packet flow labeling.
TW (ms)TCN (%)LSTM (%)Transformer (%)
RecPreF1AIT (ms)RecPreF1AIT (ms)RecPreF1AIT (ms)
178.4278.4577.910.4779.2779.0578.970.4075.9775.8575.472.08
380.2380.0980.050.5379.0078.9578.830.5577.7277.6777.582.37
584.0984.1083.990.4682.8182.6982.620.7079.8379.8479.762.31
1091.8392.0191.840.4890.5190.4890.460.8781.8982.4382.062.28
1594.4194.6494.380.4796.3496.3396.331.0383.9483.9483.902.32
2096.1796.3096.180.4596.3596.4096.361.1985.1085.4285.182.34
2597.2097.2797.190.4597.8497.8397.831.3585.9686.3386.022.16
3097.3497.3997.320.3996.6796.7796.571.6087.6687.8787.692.79
3597.5597.6297.560.4698.6898.6898.681.5889.0689.2089.092.25
4098.1298.1298.110.4398.0098.0097.991.7589.5089.9089.582.20
4597.9398.0097.920.4898.8598.8598.841.8990.8091.1090.872.24
5098.0898.1298.080.4698.6098.6198.602.0490.9391.0790.972.17
5598.8798.8998.870.5096.2096.6896.252.2993.1393.2293.152.39
6098.5898.5998.570.5298.9098.9198.892.3893.7193.8493.722.45
6598.5898.6298.580.4899.1899.1999.182.5693.8193.8193.792.42
7098.9198.9298.910.5098.9298.9298.912.6993.3894.1693.432.51
7597.6397.8197.600.4999.2299.2299.212.8894.2594.4094.232.44
8098.2598.3298.260.5099.0599.0599.042.9394.8895.0394.902.65
Note: Rec = Recall, Pre = Precision, F1 = F1 Score, AIT = Average Inference Time (ms).
Table A7. Detailed performance comparison of TCN, LSTM, and Transformer models across different time windows for anomaly detection in intensity-time period labeling.
TW (ms)TCN (%)LSTM (%)Transformer (%)
RecPreF1AIT (ms)RecPreF1AIT (ms)RecPreF1AIT (ms)
193.6393.3593.430.5593.3393.2493.230.4193.3692.7892.962.15
392.2893.6792.820.4794.0993.7293.870.5692.7893.4192.972.33
596.7296.9496.780.4895.6995.6095.630.7194.1394.5694.262.38
1099.0899.1399.090.4699.1799.1799.150.8695.3795.6995.492.44
1598.6798.9298.730.3999.6799.6799.661.0195.6796.0595.772.39
2099.5399.5599.530.4799.7899.7999.781.4495.8496.3295.992.40
2599.8399.8399.830.4999.7899.7899.781.3496.7797.0196.842.22
3099.8799.8799.860.4499.8399.8399.831.5496.8996.9896.892.30
3599.7599.7599.750.4599.6599.6799.651.6897.3797.5797.432.24
4099.7799.7799.760.3899.8399.8399.831.7798.2898.2598.252.24
4599.6399.6499.630.4599.7599.7599.751.9798.2098.2498.202.26
5099.5599.5699.550.3899.6299.6299.612.1498.2798.3198.282.25
5599.7099.7099.690.4999.7399.7399.733.0698.3298.4998.372.52
6099.6899.6999.680.4399.7899.7999.782.4298.7398.7798.742.45
6599.3899.4099.380.4699.7799.7799.762.6498.8098.8398.802.47
7099.7399.7499.730.5099.8399.8399.832.8198.7098.7298.702.51
7599.6299.6299.610.4799.7799.7799.762.9599.0399.0799.042.57
8099.2599.2599.240.4999.7099.7099.693.2999.0799.0799.062.55
Note: Rec = Recall, Pre = Precision, F1 = F1 Score, AIT = Average Inference Time (ms).
Table A8. Detailed performance comparison of TCN, LSTM, and Transformer models across different time windows for merged MAWI+CICDDoS2019 DDoS detection in intensity-time period labeling.
TW (ms)CNN (%)LSTM (%)Transformer (%)
RecPreF1AIT (ms)RecPreF1AIT (ms)RecPreF1AIT (ms)
194.2296.6195.100.4295.4796.7995.960.3794.1995.9694.882.09
396.7097.2696.910.4396.3696.6996.500.5594.5896.1595.182.34
597.4298.0497.630.4497.3697.6597.470.6594.4996.4895.222.30
1098.9199.1898.990.4399.0099.0499.010.8595.1696.8695.772.33
1599.0099.1299.020.4299.3699.3999.370.9794.7796.8195.472.37
2099.7499.7499.730.4099.7899.7899.771.1395.7097.1796.222.35
2599.7099.7399.700.4399.3999.4299.391.3196.1197.6196.642.22
3099.7699.7799.760.3999.9599.9599.941.4796.5797.4896.902.21
3599.7799.7799.770.3999.9099.9099.891.6696.0697.5596.562.23
4099.8099.8199.800.3999.8699.8699.861.7996.0697.6596.592.22
4599.8199.8299.810.4498.8899.2799.002.0095.7197.6196.342.24
5099.8699.8799.860.4099.9299.9299.922.1596.0297.6396.542.24
5599.7799.7899.770.4199.9199.9299.912.3395.7197.5696.302.49
6099.7099.7199.700.4299.8299.8299.822.4496.7497.8497.102.46
6599.7699.7699.760.4199.7599.7699.752.7496.6397.7897.022.41
7099.7099.7199.700.4099.8999.8999.882.8497.0398.0697.362.50
7599.8599.8599.840.3999.7899.7899.773.0396.5597.8396.962.48
8099.6899.6999.680.4299.8699.8699.853.1596.3897.7196.802.48
Note: Rec = Recall, Pre = Precision, F1 = F1 Score, AIT = Average Inference Time (ms).

Appendix C. SHAP Analysis Cumulative Graph

Figure A1. Cumulative SHAP feature importance graphs for each model configuration. (a) Temporal Convolutional Network (TCN), (b) Transformer, (c) Temporal Convolutional Network (TCN) trained on the merged dataset, and (d) Transformer trained on the merged dataset. These graphs illustrate the cumulative contribution of the top 20 features to each model’s predictions. The maximum cumulative contributions are: TCN = 71.35%, Transformer = 73.49%, TCN (Merged) = 73.54%, and Transformer (Merged) = 69.11%.
Electronics 14 02673 g0a1

References

  1. Jakober, L. Akamai Mitigates Sophisticated 1.44 Tbps and 385 Mpps DDoS Attack. Security Boulevard, Boca Raton, FL, USA. 2020. Available online: https://securityboulevard.com/2020/06/akamai-mitigates-sophisticated-1-44-tbps-and-385-mpps-ddos-attack (accessed on 11 April 2025).
  2. StormWall. 2024 in Review: DDoS Attacks Report by StormWall. StormWall s.r.o., Bratislava, Slovakia. 2025. Available online: https://stormwall.network/resources/blog/ddos-attack-statistics-2024 (accessed on 12 June 2025).
  3. Wallance, R. Annual DDoS Report 2024 Trends and Insights. Vercara, Herndon, VA, USA. 2025. Available online: https://vercara.digicert.com/resources/annual-ddos-report-2024-trends-and-insights (accessed on 12 June 2025).
  4. Yoachimik, O.; Pacheco, J. Record-Breaking 5.6 Tbps DDoS Attack and Global DDoS Trends for 2024 Q4. Cloudflare, London, UK. 2025. Available online: https://blog.cloudflare.com/ddos-threat-report-for-2024-q4/ (accessed on 12 June 2025).
  5. Wagner, D.; Kopp, D.; Wichtlhuber, M.; Dietzel, C.; Hohlfeld, O.; Smaragdakis, G.; Feldmann, A. United We Stand: Collaborative Detection and Mitigation of Amplification DDoS Attacks at Scale. In Proceedings of the 2021 ACM SIGSAC Conference on Computer and Communications Security, Virtual Event, Republic of Korea, 15–19 November 2021; pp. 970–987. [Google Scholar] [CrossRef]
  6. Sayed, M.S.E.; Le-Khac, N.A.; Azer, M.A.; Jurcut, A.D. A Flow-Based Anomaly Detection Approach With Feature Selection Method Against DDoS Attacks in SDNs. IEEE Trans. Cogn. Commun. Netw. 2022, 8, 1862–1880. [Google Scholar] [CrossRef]
  7. Fouladi, R.F.; Ermis, O.; Anarim, E. A DDoS attack detection and defense scheme using time-series analysis for SDN. J. Inf. Secur. Appl. 2020, 54, 102587. [Google Scholar] [CrossRef]
  8. Tan, L.; Pan, Y.; Wu, J.; Zhou, J.; Jiang, H.; Deng, Y. A New Framework for DDoS Attack Detection and Defense in SDN Environment. IEEE Access 2020, 8, 161908–161919. [Google Scholar] [CrossRef]
  9. Haseeb-ur rehman, R.M.A.; Aman, A.H.M.; Hasan, M.K.; Ariffin, K.A.Z.; Namoun, A.; Tufail, A.; Kim, K.H. High-Speed Network DDoS Attack Detection: A Survey. Sensors 2023, 23, 6850. [Google Scholar] [CrossRef]
  10. Salopek, D.; Mikuc, M. Enhancing Mitigation of Volumetric DDoS Attacks: A Hybrid FPGA/Software Filtering Datapath. Sensors 2023, 23, 7636. [Google Scholar] [CrossRef]
  11. Scherrer, S.; Vliegen, J.; Sateesan, A.; Hsiao, H.C.; Mentens, N.; Perrig, A. ALBUS: A Probabilistic Monitoring Algorithm to Counter Burst-Flood Attacks. In Proceedings of the 2023 42nd International Symposium on Reliable Distributed Systems (SRDS), Marrakesh, Morocco, 25–29 September 2023; pp. 162–172. [Google Scholar] [CrossRef]
  12. Hoque, N.; Kashyap, H.; Bhattacharyya, D. Real-time DDoS attack detection using FPGA. Comput. Commun. 2017, 110, 48–58. [Google Scholar] [CrossRef]
  13. Lundberg, S.M.; Lee, S.I. A Unified Approach to Interpreting Model Predictions. In Advances in Neural Information Processing Systems; Guyon, I., Luxburg, U.V., Bengio, S., Wallach, H., Fergus, R., Vishwanathan, S., Garnett, R., Eds.; Curran Associates, Inc.: Nice, France, 2017; Volume 30. [Google Scholar]
  14. Gaur, V.; Dogra, A.; Gupta, A.; Tibrewal, A. Multiclass classification for DDoS attacks using LSTM time-series model. In Proceedings of the 7th International Conference on Computing in Engineering & Technology (ICCET 2022), Online, 12–13 February 2022; pp. 135–141. [Google Scholar] [CrossRef]
  15. Shi, H.; Cheng, G.; Hu, Y.; Wang, F.; Ding, H. RT-SAD: Real-Time Sketch-Based Adaptive DDoS Detection for ISP Network. Secur. Commun. Networks 2021, 2021, 1–10. [Google Scholar] [CrossRef]
  16. Lai, Y.K.; Huang, P.Y.; Lee, H.P.; Tsai, C.L.; Chang, C.S.; Nguyen, M.H.; Lin, Y.J.; Liu, T.L.; Chen, J.H. Real-Time DDoS Attack Detection using Sketch-based Entropy Estimation on the NetFPGA SUME Platform. In Proceedings of the 2020 Asia-Pacific Signal and Information Processing Association Annual Summit and Conference (APSIPA ASC), Auckland, New Zealand, 7–10 December 2020; pp. 1566–1570. [Google Scholar]
  17. Ramamoorthi, A.; Subbulakshmi, T.; Shalinie, S.M. Real time detection and classification of DDoS attacks using enhanced SVM with string kernels. In Proceedings of the 2011 International Conference on Recent Trends in Information Technology (ICRTIT), Chennai, India, 3–5 June 2011; pp. 91–96. [Google Scholar] [CrossRef]
  18. Lai, Y.K.; Chang, K.P.; Ku, X.W.; Hua, H.L. A Machine Learning Accelerator for DDoS Attack Detection and Classification on FPGA. In Proceedings of the 2022 19th International SoC Design Conference (ISOCC), Gangneung-si, Republic of Korea, 19–22 October 2022; pp. 181–182. [Google Scholar] [CrossRef]
  19. Gebremeskel, T.G.; Gemeda, K.A.; Krishna, T.G.; Ramulu, P.J. DDoS Attack Detection and Classification Using Hybrid Model for Multicontroller SDN. Wirel. Commun. Mob. Comput. 2023, 2023, 1–18. [Google Scholar] [CrossRef]
  20. Yungaicela-Naula, N.M.; Vargas-Rosales, C.; Perez-Diaz, J.A.; Jacob, E.; Martinez-Cagnazzo, C. Physical Assessment of an SDN-Based Security Framework for DDoS Attack Mitigation: Introducing the SDN-SlowRate-DDoS Dataset. IEEE Access 2023, 11, 46820–46831. [Google Scholar] [CrossRef]
  21. Fuladi, R.; Baykas, T.; Anarim, E. The Use of Statistical Features for Low-Rate Denial of Service Attack Detection. In Proceedings of the 2023 2nd International Conference on 6G Networking (6GNet), Paris, France, 18–20 October 2023; pp. 1–6. [Google Scholar] [CrossRef]
  22. Cynthia, C.; Ghosh, D.; Kamath, G.K. Detection of DDoS Attacks Using SHAP-Based Feature Reduction. Int. J. Mach. Learn. 2023, 13, 173–180. [Google Scholar] [CrossRef]
  23. Hernandez, D.V.; Chen, M.T.; Lai, Y.K. Identification of DDoS Attacks Through SHAP-Based Feature Analysis and Transformer Models: A Multivariate Time Series Data Approach. In Proceedings of the TENCON 2024—2024 IEEE Region 10 Conference (TENCON), Singapore, 1–4 December 2024; pp. 632–635. [Google Scholar] [CrossRef]
  24. Chang, K.-P. A Machine Learning Accelerator for DDoS Attack Detection and Classification on FPGA. Ph.D. Thesis, Chung Yuan Christian University, Taoyuan, Taiwan, 2022. [Google Scholar]
  25. Alon, N.; Matias, Y.; Szegedy, M. The Space Complexity of Approximating the Frequency Moments. J. Comput. Syst. Sci. 1999, 58, 137–147. [Google Scholar] [CrossRef]
  26. Cormode, G. MassDAL Public Code Bank: Sketches and Frequent Items. 2004. Available online: https://www.dimacs.rutgers.edu/~graham/code/ (accessed on 11 June 2025).
  27. Masson, C.; Rim, J.E.; Lee, H.K. DDSketch: A fast and fully-mergeable quantile sketch with relative-error guarantees. Proc. VLDB Endow. 2019, 12, 2195–2205. [Google Scholar] [CrossRef]
  28. Flajolet, P.; Nigel Martin, G. Probabilistic counting algorithms for data base applications. J. Comput. Syst. Sci. 1985, 31, 182–209. [Google Scholar] [CrossRef]
  29. Clifford, P.; Cosma, I. A simple sketching algorithm for entropy estimation over streaming data. In Proceedings of the Sixteenth International Conference on Artificial Intelligence and Statistics, Scottsdale, AZ, USA, 29 April–1 May 2013; Volume 31, pp. 196–206. [Google Scholar]
  30. Lopes, I.O.; Zou, D.; Abdulqadder, I.H.; Akbar, S.; Li, Z.; Ruambo, F.; Pereira, W. Network intrusion detection based on the temporal convolutional model. Comput. Secur. 2023, 135, 103465. [Google Scholar] [CrossRef]
  31. Doriguzzi-Corin, R.; Millar, S.; Scott-Hayward, S.; Martinez-del Rincon, J.; Siracusa, D. Lucid: A Practical, Lightweight Deep Learning Solution for DDoS Attack Detection. IEEE Trans. Netw. Serv. Manag. 2020, 17, 876–889. [Google Scholar] [CrossRef]
  32. Ta, V.; Park, M. Man-edos: A multihead attention network for the detection of economic denial of sustainability attacks. Electronics 2021, 10, 2500. [Google Scholar] [CrossRef]
  33. Karnani, S.; Shakya, H.K. Mitigation strategies for distributed denial of service (DDoS) in SDN: A survey and taxonomy. Inf. Secur. J. A Glob. Perspect. 2023, 32, 444–468. [Google Scholar] [CrossRef]
  34. Sharafaldin, I.; Lashkari, A.H.; Hakak, S.; Ghorbani, A.A. Developing Realistic Distributed Denial of Service (DDoS) Attack Dataset and Taxonomy. In Proceedings of the 2019 International Carnahan Conference on Security Technology (ICCST), Chennai, India, 1–3 October 2019; pp. 1–8. [Google Scholar] [CrossRef]
  35. Kind, A.; Stoecklin, M.; Dimitropoulos, X. Histogram-based traffic anomaly detection. IEEE Trans. Netw. Serv. Manag. 2009, 6, 110–121. [Google Scholar] [CrossRef]
  36. Fouladi, R.; Kayatas, C.; Anarim, E. Statistical Measures: Promising Features for Time Series Based DDoS Attack Detection. In Proceedings of the International Workshop on Computational Intelligence for Multimedia Understanding (IWCIM), Izmir, Turkey, 2–5 May 2018; p. 96. [Google Scholar] [CrossRef]
  37. Wei, Y.; Jang-Jaccard, J.; Singh, A.; Sabrina, F.; Camtepe, S. Classification and Explanation of Distributed Denial-of-Service (DDoS) Attack Detection using Machine Learning and Shapley Additive Explanation (SHAP) Methods. arXiv 2023, arXiv:2306.17190. [Google Scholar] [CrossRef]
  38. Fontugne, R.; Borgnat, P.; Abry, P.; Fukuda, K. MAWILab: Combining diverse anomaly detectors for automated anomaly labeling and performance benchmarking. In Proceedings of the 6th International COnference, Philadelphia, PA, USA, 30 November–3 December 2010; pp. 1–12. [Google Scholar] [CrossRef]
  39. GitHub Contributors. SHAP Issue #3415: Pytorch LSTM Not Recognizednn.Model:LSTM. 2023. Available online: https://github.com/shap/shap/issues/3415 (accessed on 10 June 2025).
  40. Vaswani, A.; Shazeer, N.; Parmar, N.; Uszkoreit, J.; Jones, L.; Gomez, A.N.; Kaiser, L.; Polosukhin, I. Attention Is All You Need. arXiv 2023, arXiv:1706.03762. [Google Scholar]
  41. Hansen, C.; Hansen, C.; Alstrup, S.; Simonsen, J.G.; Lioma, C. Neural Speed Reading with Structural-Jump-LSTM. arXiv 2019, arXiv:1904.00761. [Google Scholar] [CrossRef]
Figure 1. Proposed multi-layer architecture for DDoS attack detection and mitigation. The system is composed of three layers: (1) a Hardware-Accelerated Statistical Method Layer for efficient preprocessing using sketch-based algorithms, statistical, and packet processing; (2) a GPU-Accelerated Deep Learning Method Layer for time series formatting, DDoS attack detection, and attack period identification; and (3) an Attack Mitigation Layer for traffic diversion, deep traffic inspection, and further mitigation strategies.
Electronics 14 02673 g001
Figure 2. Merged entropy graphs of MAWI (background) and CICDDoS2019 (attack) traffic in 2nd day. (a) Packet Flow Labeling: labels each packet to capture detailed attack traits. (b) Intensity-Time Period Labeling: time segments with peak attack intensity based on Table 2.
Electronics 14 02673 g002
Figure 3. Illustration of the Proposed Feature Extraction and Preprocessing Workflow Transforming Raw Network Traffic Packet Data into Multivariate Time Series Data for Detecting DDoS Attacks.
Electronics 14 02673 g003
Figure 4. Overview of the three deep learning architectures used for time series classification. (a) Temporal Convolutional Network (TCN) architecture consists of stacked 1D convolutional layers, global pooling, and a classification head. (b) Long Short-Term Memory (LSTM) architecture with stacked LSTM layers and dropout regularization before the final classification. (c) Transformer-based architecture utilizing multi-head attention and feedforward MLP blocks with normalization and residual connections.
Electronics 14 02673 g004
Figure 5. Performance comparison of F1 scores across different models in merging high-volume background traffic over varying time window sizes. Subfigures (ac) illustrate the performance of TCN, LSTM, and Transformer models, showing both the original and merged results. Subfigure (d) presents an overall comparison of the merged performance across all three models.
Electronics 14 02673 g005
Figure 6. Summary Plot of SHAP Analysis on Top 20 features using (a) TCN and (b) Transformer Model using the original CICDDoS2019 dataset.
Electronics 14 02673 g006
Figure 7. Feature selection based on SHAP analysis F1 Score and F1 Score Improvement over different time windows (in seconds) across TCN, LSTM, and Transformer on the original CICDDoS2019 dataset. (a,c,e) compare the F1 scores for the top 20, 15, and 10 selected features. (b,d,f) display the corresponding F1 score improvements over time.
Electronics 14 02673 g007
Figure 8. Summary Plot of SHAP Analysis on Top 20 features using (a) TCN and (b) Transformer Model using the merged MAWI-CICDDoS2019 dataset.
Electronics 14 02673 g008
Figure 9. Feature selection based on SHAP analysis F1 Score and F1 Score Improvement over different time windows (in seconds) across TCN, LSTM, and Transformer on the merged MAWI-CICDDoS2019 dataset. (a,c,e) compare the F1 scores for the top 20, 15, and 10 selected features. (b,d,f) display the corresponding F1 score improvements over time.
Electronics 14 02673 g009
Figure 10. Inference time comparison of TCN, LSTM, and Transformer models across different time windows.
Electronics 14 02673 g010
Table 1. Comparison of DDoS Detection Architectures in Terms of Performance, Dataset, Features, and Detection Method.
PaperAccRecF1DataFeatureArchiDetection Method# of Class
[17]99.32%Attack Generation ToolFlowEnhanced SVM2
[8]98.85%98.47%NSL-KDDFlowSDNK-means and KNN2
[7]98.82%98.80%MAWI DatasetFlowSDNARIMA, Chaos Theory, Exp. Filter + Dynamic Threshold2
[19]99.42%99.46%99.43%CICDDoS2019FlowSDNEntropy Threshold + LSTM6
[20]90.87%SDN-SlowRate-DDoSFlowSDNLSTM Model2
[15]99.51%CERNETFlowFPGADynamic Threshold Update13
[12]99.95%CAIDA DDoS 2007PacketFPGACorrelation Measure (NaHiD)2
[16]96.63%98.35%96.63%CAIDA DDoS 2007 + MAWIPacket Time SeriesFPGAEntropy-Based2
[18]98.40%97.20%97.80%CICDDoS2019Packet Time SeriesFPGADense + Autoencoder Model9
Ours99.87%99.87%99.86%CICDDoS2019Packet Time Series (30 s)FPGA + GPUTCN (ITPL)14
Ours99.83%99.83%99.83%CICDDoS2019Packet Time Series (30 s)FPGA + GPULSTM (ITPL)14
Ours99.86%99.87%99.86%CICDDoS2019 + MAWIPacket Time Series (50 s)FPGA + GPUTCN (ITPL)14
Ours99.94%99.95%99.95%CICDDoS2019 + MAWIPacket Time Series (30 s)FPGA + GPULSTM (ITPL)14
Note: “–” indicates no available data. ITPL = Intensity Time Period Label.
Table 2. CIDDoS2019 Dataset: Attack time and classes.
Classes1st Day2nd Day
DNS-10:52–11:05
LDAP10:21–10:3011:22–11:32
MSSQL10:33–10:4211:36–11:45
NTP-10:35–10:45
NetBIOS10:00–10:0911:50–12:00
Portmap9:43–9:51-
SNMP-12:12–12:23
SSDP-12:27–12:37
SYN11:28–17:3513:29–13:34
TFTP-13:35–17:15
UDP10:53–11:0312:45–13:09
UDPLag11:14–11:2413:11–13:15
WebDDoS-13:18–13:29
Table 3. Class distribution for Raw Packets and Time Series (1 s observation time).
ClassPacketsTime Series
Packet FlowIntensity-Time Period
Benign112,233659917,911
Syn5,902,48738802168
TFTP20,079,91052741522
UDP6,915,27124381263
MSSQL10,297,52016891115
LDAP4,292,51611731084
NetBIOS7,548,31012571082
UDPLag1,090,9861343744
SSDP2,609,774821704
DNS5,069,3611552624
SNMP5,158,820994614
NTP1,202,1162467490
WebDDoS437512470
Portmap191,694427255
Table 4. Anomaly detection f1 scores for packet flow and intensity-time period labeling across models and time windows.
Time
Window (s)
Packet Flow Labeling (%)Intensity-Time Period Labeling (%)
TCNLSTMTRFTCNLSTMTRF
198.0197.9497.2495.2895.2395.03
394.9695.8195.0094.4994.0095.18
595.6793.7493.3197.1095.7695.55
1095.7094.0793.9499.7098.8196.40
1597.7396.8394.5999.7099.7196.75
2097.4596.9494.1499.5699.8396.97
2598.3598.6195.8599.8399.7697.53
3098.1297.8496.3799.8399.8697.83
3598.4498.8596.4899.8699.7097.98
4098.7898.1995.4699.7199.7598.48
4599.0499.1597.0399.8399.8398.31
5098.9998.6096.8899.6899.7598.16
5599.3899.1697.4999.8199.8398.96
6099.0599.2197.6699.8199.3498.58
6599.5399.6197.8699.4099.7998.00
7098.8699.0097.9099.7499.2898.83
7599.4699.5097.7099.7999.8398.94
8098.9499.0697.8099.6199.7199.13
Note: Time Window (s) = seconds; % denotes the F1 Score; TRF refers to the Transformer Model. Bold values indicate F1 Scores greater than or equal to 99%.
Table 5. DDoS classification f1 Scores for packet flow and intensity-time period labeling across models and time windows.
Time
Window (s)
Packet Flow Labeling (%)Intensity-Time Period Labeling (%)
TCNLSTMTRFTCNLSTMTRF
177.9178.9775.4793.4393.2392.96
380.0578.8377.5892.8293.8792.97
583.9982.6279.7696.7895.6394.26
1091.8490.4682.0699.0999.1595.49
1594.3896.3383.9098.7399.6695.77
2096.1896.3685.1899.5399.7895.99
2597.1997.8386.0299.8399.7896.84
3097.3296.5787.6999.8699.8396.89
3597.5698.6889.0999.7599.6597.43
4098.1197.9989.5899.7699.8398.25
4597.9298.8490.8799.6399.7598.20
5098.0898.6090.9799.5599.6198.28
5598.8796.2593.1599.6999.7398.37
6098.5798.8993.7299.6899.7898.74
6598.5899.1893.7999.3899.7698.80
7098.9198.9193.4399.7399.8398.70
7597.6099.2194.2399.6199.7699.04
8098.2699.0494.9099.2499.6999.06
Note: Time Window (s) = seconds; % denotes the F1 Score; TRF refers to the Transformer Model. Bold values indicate F1 Scores greater than or equal to 99%.
Table 6. Performance metrics (mean ± standard deviation) across 5-fold stratified cross-validation.
ModelRec (%) (Mean ± Std)Pre (%) (Mean ± Std)F1 (%) (Mean ± Std)AIT (ms) (Mean ± Std)
CNN99.62 ± 0.1699.64 ± 0.1599.63 ± 0.160.34 ± 0.04
LSTM99.35 ± 0.7599.48 ± 0.4999.39 ± 0.671.23 ± 0.14
Transformer95.49 ± 0.3497.04 ± 0.2996.03 ± 0.162.35 ± 0.78
Note: Rec = Recall, Pre = Precision, F1 = F1 Score, AIT = Average Inference Time (ms).
Table 7. Top 20 Combined features based on transformer and TCN rankings (original dataset).
RankFeatureTransformer RankTCN RankCombined Score
1TTL_s_entropy12199
2Destination Port_max65191
3Source Port_std49189
4TTL_std141187
5window_size_q1106186
6Protocol_d_count134185
7iat_s_entropy1110181
8Destination Port_std203179
9Protocol_max320179
10TTL_max168178
11ip_length_s_entropy1215175
12window_size_max217174
13window_size_s_entropy523174
14Destination Port_s_entropy1814170
15TTL_q12513164
16Protocol_q2238162
17Source Port_med734161
18window_size_med2818156
19Protocol_med839155
20TTL_med2621150
Table 8. Top 20 Combined features based on transformer and TCN rankings (merged dataset).
RankFeatureTransformer RankTCN RankScore
1ip_length_skw11200
2ip_length_kurt32197
3iat_med57190
4Source Port_q1143185
5Destination Port_q2217183
6Destination Port_s_entropy418180
7window_size_std139180
8Protocol_q2178177
9Source Port_s_entropy920173
10udp_length_s_entropy624172
11TTL_d_count285169
12TTL_max826168
13Destination Port_std2510167
14udp_length_std2312167
15Destination Port_d_count2213167
16Destination Port_med1127164
17ip_length_d_count346162
18iat_q21922161
19Destination Port_q11825159
20Source Port_med2915150
Table 9. Top 20 ranked features for CICDDoS2019 and merged MAWI + CICDDoS2019 datasets.
RankCICDDoS2019MAWI + CICDDoS2019
1TTL_s_entropyip_length_skw
2Destination Port_maxip_length_kurt
3Source Port_stdiat_med
4TTL_stdSource Port_q1
5window_size_q1Destination Port_q2
6Protocol_d_countDestination Port_s_entropy
7iat_s_entropywindow_size_std
8Destination Port_stdProtocol_q2
9Protocol_maxSource Port_s_entropy
10TTL_maxudp_length_s_entropy
11ip_length_s_entropyTTL_d_count
12window_size_maxTTL_max
13window_size_s_entropyDestination Port_std
14Destination Port_s_entropyudp_length_std
15TTL_q1Destination Port_d_count
16Protocol_q2Destination Port_med
17Source Port_medip_length_d_count
18window_size_mediat_q2
19Protocol_medDestination Port_q1
20TTL_medSource Port_med
Disclaimer/Publisher’s Note: The statements, opinions and data contained in all publications are solely those of the individual author(s) and contributor(s) and not of MDPI and/or the editor(s). MDPI and/or the editor(s) disclaim responsibility for any injury to people or property resulting from any ideas, methods, instructions or products referred to in the content.

