1. Introduction
The need to assess electromagnetic field exposure of workers in Industry 4.0 environments stems from the unprecedented integration of wireless, automated, and interconnected technologies that generate complex, multi-frequency electromagnetic environments. Wireless communication is essential for smart industry 4.0 because it enables seamless, pervasive, and scalable connectivity among machines and sensors as well as mobile entities, such as mobile robots, automated guided vehicles (AGVs), drones, and humans [
1].
The deployment of private 5G networks in smart industry 4.0 introduces unique RF EMF exposure scenarios for workers. In general, there are two main types of 5G equipment used to build a private network that could obtain good coverage inside of smart factory buildings: a limited number of beamforming base stations (BS), which are able to cover larger areas with a signal, or multiple low-power radio heads, which are able to obtain good coverage even in an environment with many obstacles. The main differences between these devices are the radiation pattern and the antenna gain. Beamforming antennas have high maximum gains (G = 15–23 dBi) and steering of the beam, whereas low-power radio heads have either omnidirectional or partially directive radiation patterns (G = 0–4 dBi). As the total maximum output power is usually similar (up to several watts), this results in very different exposure scenarios close to the source, where beamforming antennas yield exposures that are several orders of magnitude higher very close to antennas. The benefit of high-gain beamforming antennas is limited by the presence of obstacles, whereas multiple low-power radio heads benefit from the ability to cover the majority of the area due to their distribution throughout the building with a high percentage of clutters.
There is a lack of research exploring workers’ radiofrequency (RF) electromagnetic field (EMF) exposure in fully operational private 5G networks in Industry 4.0. One of the reasons is the quite slow adoption of private 5G networks in smart industries due to a combination of high costs, technical challenges, and uncertain returns on investment. In addition, researchers’ access to industrial areas where newly introduced 5G private networks operate is very limited, as owners seldom approve access and publication of research results within the area of an individual factory. Most often, lengthy procedures are required to conclude a Non-Disclosure Agreement (NDA) contract, which often ends with cancellation of the contract by company management.
A few published studies have reported that while 5G’s beamforming concentrates energy toward intended receivers, dynamic beam patterns and time-averaged power allocation reduced overall worker exposure compared to static sector antennas, with power density often remaining below 1% of International Commission on Non-Ionizing Radiation Protection (ICNIRP) guidelines in controlled scenarios [
2]. However, near-field conditions in industrial settings, where workers operate close to BSs, require precise assessment due to the rapid spatial decay of reactive fields and potential hotspots from beam misalignment [
3,
4].
Massive MIMO exposure at 3.5 GHz using a Maximum Ratio Transmission precoding scheme in the downlink from a 36-element antenna array in an industrial indoor environment was investigated [
5]. Most of the massive MIMO downlink (DL) exposure was produced in the vicinity of the user equipment (UE), as the authors observed an enhancement of the time-averaged Poynting vector by 10 dB at the location of the receiver. In addition, it was found that the peak spatial-averaged SAR in 10 g in the phantom’s head was directly proportional to the hot-spot power flux density and that the normalized peak spatial-averaged SAR in 10 g complied with ICNIRP basic restrictions.
Another paper [
6] reported on the exposure of users and non-users of small cell BS widely deployed in 5G networks. Results showed that exposure levels were below the limits for occupational exposure (at distances between 0.5 m and 1 m from the base station) issued by ICNIRP. The maximum exposure ratio was 0.15. The authors state that the exposure of a non-user within an active network depends on the distribution of users, their usage, and the beamforming capabilities of the base station radio.
A special hybrid approach (ray tracing and the finite-difference time-domain technique) was proposed to assess peak spatial averaged SAR in 10 g in the head of users and non-users due to an RF massive MIMO array system at 3.5 GHz deployed in an industrial indoor setting [
7]. It was found that the peak spatial averaged SAR in 10 g of users is nearly eight times higher than the one experienced by non-users.
The validation of ray tracing methods for RF EMF calculations in 5G base stations has been rigorously explored through in situ measurements and simulations, demonstrating their reliability in predicting spatial and temporal exposure patterns. For instance, studies leveraging ray tracing frameworks integrated detailed 3D environmental models—including building geometry, material properties, and multipath propagation—to simulate RF EMF distributions in dense working areas. These simulations were validated against empirical measurements of power density and electric field strength near 5G massive MIMO antennas with beamforming capabilities. Results showed strong alignment, with discrepancies under 10% in far-field regions, although near-field scenarios required finer mesh resolution to account for beamforming edge effects [
5,
8]. A key finding from measurements reported by several authors [
5,
6,
7,
9,
10] revealed that peak RF EMF levels during maximum network load (e.g., 5.5 V/m for worst-case downlink traffic) remained well below the ICNIRP safety limits, even after scaling to theoretical maximum power outputs (e.g., 0.62% of ICNIRP guidelines at 200 W).
Additionally, hybrid methodologies combining ray tracing with finite-difference time-domain (FDTD) techniques improved accuracy in modeling localized exposure hotspots, particularly in industrial indoor environments with metallic obstructions [
7]. Challenges persist in capturing dynamic beamforming variations, but advancements, such as beam pattern envelopes and power reduction factors (e.g., 0.25 scaling for time-averaged 5G traffic beams), have enhanced prediction accuracy [
8]. These validated models underscore the utility of ray tracing in compliance assessments, offering a cost-effective alternative to operator-dependent measurements [
2,
6,
9].
2. Materials and Methods
The objective of the current work is to provide a systematic approach to assess workers’ exposure to RF EMF resulting from a private standalone (SA) 5G network in a warehouse and a production hall in one of the smart industry facilities of a key global leader in smart IoT solutions by presenting a case study.
To determine RF EMF exposure due to private 5G networks, both measurements and numerical modeling calculations were used. Compared to numerical modeling, measurements are limited by the number of measurement points. By supplementing the results of measurements with numerical modeling, it is possible to gain insight into the spatial behavior of exposure in non-uniform scenarios like indoor exposure. Numerical modeling alone is used for EMF prediction frequently. However, for new exposure scenarios and complicated environments with multiple objects, and when material properties data are unavailable, the reliability of computational assessment is reduced. Therefore, a combination of both methods provides the most reliable results at a reasonable cost.
2.1. Private SA 5G Network
The private network operated in the medium band of the 5G frequency spectrum, namely, band n78, and it was allocated the frequency range from 3700 to 3800 MHz for industrial use (100 MHz bandwidth). For the indoor network, Nokia’s AirScale AWHQB pico indoor remote radio heads (pRRH) served as small cell access points with a maximum power of 1 W. These were connected at every relevant location in the warehouse and the production building with an ASiR hub with a direct optic fiber connection to the baseband unit (BBU) and the core server in the central data center. The industrial private network under test was composed of 4 pRRHs spread over the entire warehouse building and 6 pRRHs covering the production hall. In the warehouse, pRRHs were mounted under the roof at a height of about 5 m. In the production hall, four of them were mounted on the roof beams at a height of about 5.9 m, whereas two of them were mounted under the balcony at a height of 3.1 m. The radiation pattern of the pRRHs was nearly isotropic, with antenna gain of 0 dB. The network’s time division duplex (TDD) ratio, indicating the maximum time portion during which the network operates in downlink mode, was 0.6.
Also, both buildings shared the same basic characteristics. Both buildings had a concrete floor, the walls were made mostly of concrete, and the roof was made of trapezoidal corrugated metal.
2.2. Warehouse
The warehouse building covers an area of 3399 m
2, and its height is 5.5 m. The warehouse is mainly used for storing reprocessing material, other necessary components and final products, high-tech digital structures, and circuits. There are two offices inside of the warehouse; the offices are made of metallic walls with large windows. The offices extend up to the ceiling, and the racks’ top shelves are located close to the ceiling so that when they are full, stored items nearly reach the ceiling. The pallet racks are 1 m deep, with the exception of the first (lowest) rack, which is wider, with very narrow passages between. The racks and offices cover about 40% of the warehouse’s area. The detailed geometry of the warehouse is shown in
Figure 1 and
Figure 2.
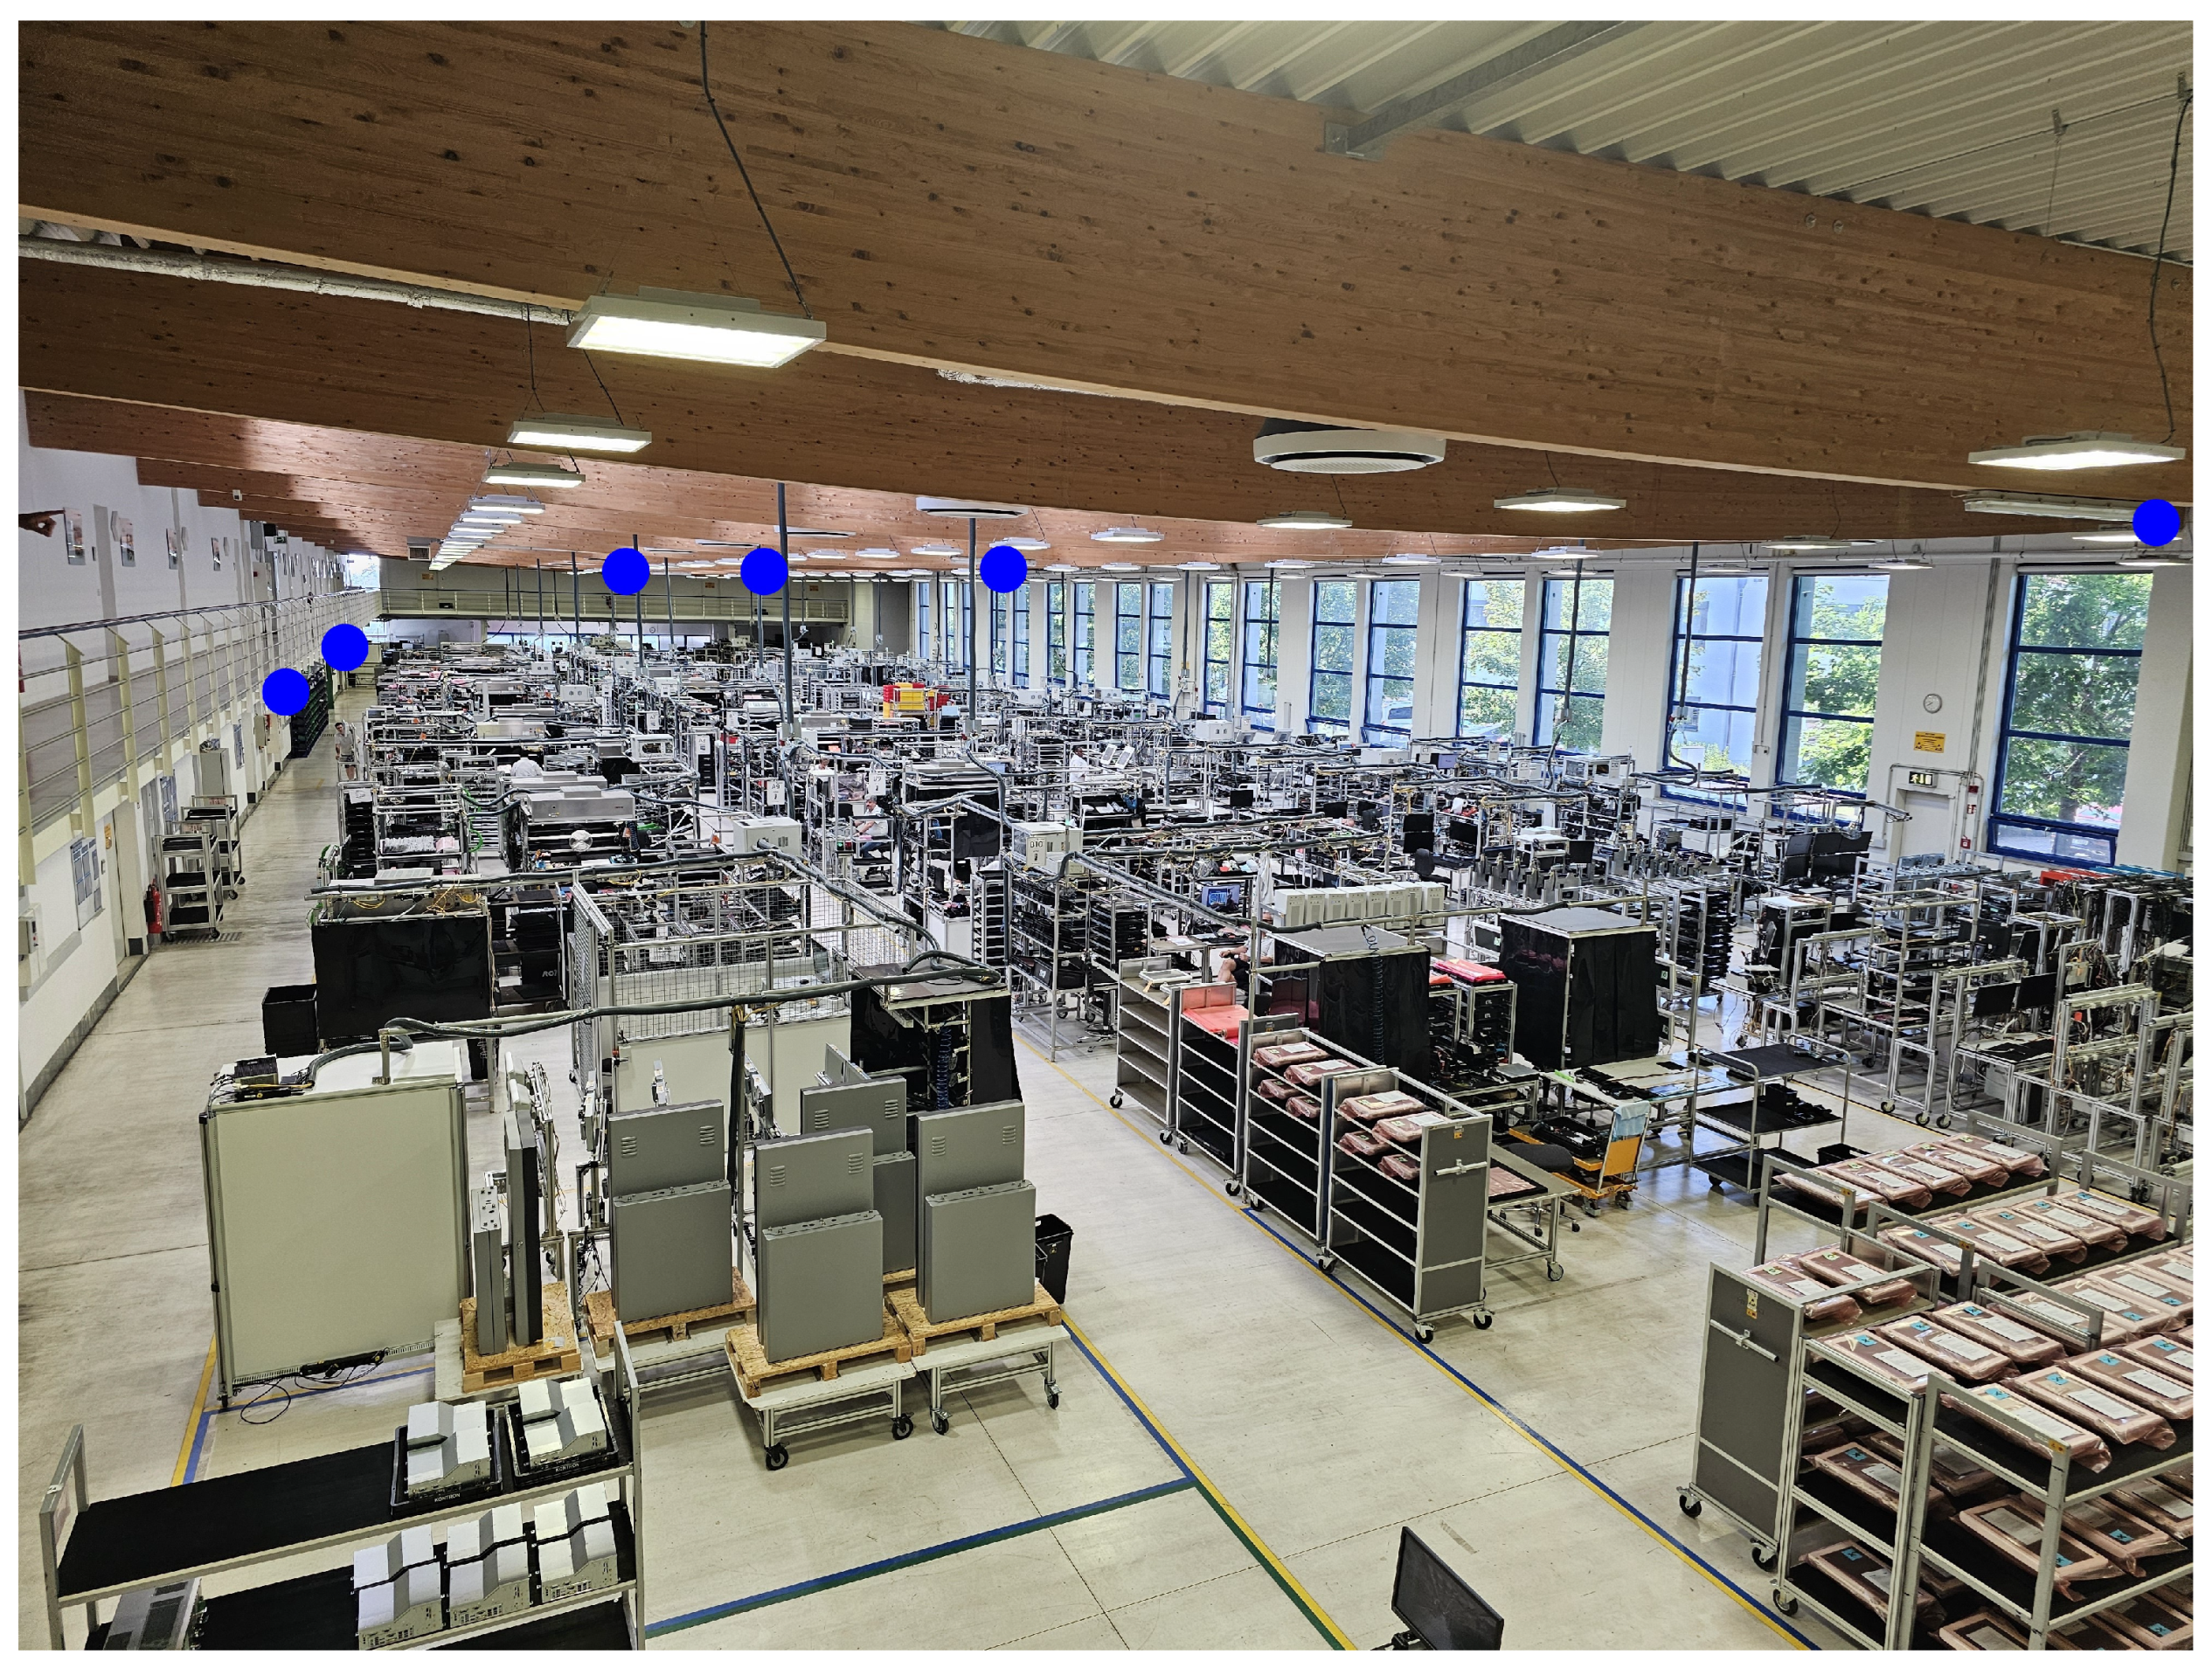
2.3. Production Hall
The production building, which is attached to the warehouse, covers an area of about 2800 m2, and its height is 6.9 m. The majority of the production building is occupied by a production hall with a surface of 2117 m2. The remainder of the building is occupied by two-level offices, with a balcony on the first floor running at a height of 3.4 m, extending inside of the production hall.
Inside oof the hall there are several dedicated working places for different tasks, mainly for assembly and testing, which are grouped into 4 production areas with 4 corridors between. The production areas cover about 35% of the total area of the production building and 46% of the production hall. However, because the production facilities cover only a portion of the production area, the effective equipment coverage of the production hall is below 20%. All equipment is relatively low, with the tallest items not exceeding 2.5 m. The detailed geometry of the production hall is shown in
Figure 3 and
Figure 4.
2.4. RF EMF Exposure Assessment
In this section, we briefly discuss the two different approaches for estimating the workers’ EMF exposure due to the private 5G network applied in the real industrial environment, i.e., through spot measurements and numerical modeling.
2.4.1. RF EMF Measurements
The RF EMF measurements inside of the warehouse and the production hall were conducted as spot measurements on a selected grid of points combined with additional measurements close to some of the pRRHs. There are two conceptually different methods to measure electric fields emitted by 5G base stations: broadband measurements and selective measurements. With broadband measurements, one measures the whole frequency band in which the equipment under test is working, and the result is the exposure at the time of the measurements. If full traffic is induced during measurements, broadband measurements can represent worst-case exposure. In selective measurements, the electric field strength of either a specific part of the spectrum (frequency-selective) or a specific pilot signal (code-selective) is measured. Based on the technical data of the network, it is possible to extrapolate selectively measured values to determine worst-case exposure, which is usually the requirement of the regulations or recommendations. Both methods are described in the current standard for measurements IEC 62232:2022 [
11].
In the case of the studied private 5G network, both methods could be used. Because no other nearby network operated in the same frequency band and it is an indoor, private network, the typical limitation of broadband measurements—distinguishing contributions from the network under test and other networks—was not a concern. However, during the measurements, there was no traffic in the network under test, and, due to technical reasons, it was not possible to generate traffic. To determine the worst-case exposure scenario, code-selective measurements were conducted based on the measurement procedures specified in the IEC 62232:2022 standard [
11]. Extrapolation to full traffic has already been used for studying exposure in 2G networks and up to the fourth generation (4G), so this was a relatively straightforward process where an extrapolation factor was applied to the measured value of a reference signal to calculate the maximum value of the electric field [
12,
13]. However, with the introduction of beamforming, the method has become much more complicated [
14]. In the case of beamforming, the extrapolation factor does not only take certain technology-specific aspects into consideration, like bandwidth, subcarrier spacing, the uplink to downlink factor, known as TDD, and the synchronization signal block (SSB) to traffic block power ratio, but also geometric factors, like azimuth and tilt from the antenna to the point of evaluation [
15]. Failure to account for these aspects may lead to underestimation of the actual maximum possible exposure levels. However, the network under test did not use beamforming, and the process of extrapolation was therefore straightforward. To measure the reference signal (RS) of the cell, which has constant power, code-selective 5G demodulator mode on a spectrum analyzer Narda SRM 3006 was used. The reference level was set to 4 V/m, and the sensitivity of the 5G demodulator was set to normal. By extrapolating the measured value of the reference signal RS with the factors, depending on the technical characteristics of the base station, the worst-case exposure conditions under the full load of the base station were determined. For the network under test, with 100 MHz channel bandwidth, 30 kHz subcarrier spacing, and a duty cycle of 0.6, the extrapolation factor for the electric field was calculated according to the IEC 62232 standard [
11] and found to be 44.34. RF EMF measurements were performed on a 10 m grid along the corridors at a height of 1.5 m above the ground (
Figure 1 and
Figure 3). RF EMF measurements were performed with the spectrum analyzer, Narda SRM 3006, connected to a three-axis antenna, Narda 3502/01. The expanded measurement uncertainty of the equipment was ±3.5 dB (see
Table 1).
During the actual RF EMF measurements, one micro-location that represents the worst-case scenario for worker exposure was identified, as the pRRH at this location is placed quite low, so a worker can get in close proximity to it.
A set of measurements was conducted under the pRRH mounted under the balcony at a height of only 3.1 m. The detailed RF EMF measurements were performed in three different directions just beneath the pRRH, at a height of 1.5 m and in the vertical direction below the pRRH. The horizontal distances of the measurement locations from the pRRH ranged from 0.2 to 5 m. All measurement locations were in the far field region, with the exception of three measurements close to pRRH mounted under the balcony at distances of 0.3 m, 0.6 m, and 1.1 m, which were in the radiating near field region.
In addition to the spot measurements, a walk-through RF EMF measurement along the corridors at a height of 1.5 m above the ground was conducted. For all spot measurements, the spectrum analyzer was mounted on the tripod, whereas for walk-through measurements it was carried by a person with the antenna pointed away from the body to minimize the influence of the human body on the results. For spot measurements, the maximum value of the reference signal RS was stored during a period of 20 to 40 s, whereas for walk-through measurements the actual value of the reference signal RS was stored for an interval of 5 to 7 s.
All measurement locations were located inside of two halls. The temperature inside of both halls during measurements was between 17 °C and 20 °C, and the humidity was between 40 and 50%.
2.4.2. Calculations
Numerical calculations were independently performed by two laboratories using two different numerical calculation tools: a commercial program package, Narda EFC-400, and a MATLAB ray tracing tool.
For comparison purposes, only the warehouse was modeled to the full extent using both numerical tools. The production hall was modeled only partially around the worst-case scenario in the vicinity of one pRRH.
The program package Narda EFC 400 is based on a ray tracing algorithm, and it uses a synthetic model for improved accuracy of near-field calculations according to the IEC 62232:2022 standard [
11]. The program package incorporates the multiple rays method and considers multiple reflections from object surfaces as well as attenuation and diffusion by objects. The model includes all of the necessary technical data of the pRRHs as well as the geometry of the warehouse, including the pallet racks. The attenuation loss was defined individually for each object, but the Narda EFC 400 program package applies a single reflectance value to all objects except for the ground. The calculation included 5 reflections. Material properties for the model were taken from the database within the Narda EFC 400 program package. For the ground, made of solid concrete, a reflection coefficient of 0.35 was used, while for the concrete walls the reflection coefficient was 0.20. Those values relate well with data from the literature [
16,
17]. The roof is made of trapezoidal corrugated metal, which has a significantly lower effective reflection coefficient than a flat metal surface [
18]; therefore, a value of 0.2 was used. Pallet racks were modeled as a solid block with a reflection coefficient of 0.2. The attenuation of the pallet racks was not known, and it was not possible to determine it from the literature, as pallet racks are composed of several materials, including metallic frames, wooden shelves, cardboard or wooden boxes filled with different materials, etc.
The numerical tool developed in MATLAB was used to calculate the incident electric field on a grid of receivers with spacing of 0.25 m. It utilizes MATLAB’s built-in ray tracing propagation model to identify the line-of-sight (LOS) and non-line-of-sight (NLOS) propagation paths between the transmitters and the receivers within a 3D model of the environment, which was created using Blender software Ver 4.4. For NLOS paths, the model implements the Shooting and Bouncing Rays (SBR) method [
19], where a number of uniformly spaced rays are launched from the transmitter and reflected by surrounding objects. The angular separation between the rays was set to 0.5°, and the maximum number of reflections was limited to two. For each ray that reaches a receiver, the total path loss is calculated, which includes the free space and the reflection loss. Considering the transmitter output power for each of the four transmitters, the received power of each ray was calculated. The power from all rays that reached the receiver was then summed and converted into electric field values. Five materials were used in the 3D model of the environment: concrete for the floor and walls, glass for the office windows, metal for the ceiling and the racks, wood for the pallets and chipboard for the boxes that were placed on the pallets. Reflection coefficients were computed for each ray at each reflection point using the Fresnel equations, based on the complex relative permittivity of each material as specified in ITU-R P.2040 [
20]. As such, the reflection loss depends on both the material properties and the angle of incidence of the ray on the surfaces. For a typical incident angle of 30°, the reflection coefficients are approximately 0.4 for concrete, 0.43 for glass, 1 for metal, 0.18 for wood, and 0.24 for chipboard.
Due to the various limitations of the two numerical tools, there were some variations in the modeling of the warehouse environment. As previously mentioned, pallet racks were modeled significantly different. Another difference concerned the wall attenuation: in the program package Narda EFC-400, the attenuation of all walls was set to 10 dB, whereas in the MATLAB tool, it was considered infinite. However, since most of the walls are external, the latter had only a limited effect on the results.
2.5. Parametric Study of Clutter Attenuation
A parametric study was conducted to determine the value of the attenuation of the pallet racks that gave the most accurate results compared to the measurements. The value of the reflection coefficient of the pallet racks varied from 2 dB to 5 dB, with an additional value of 100 dB representing the case of infinite attenuation of pallet racks. Results of all calculations at the measurement locations (
Figure 1) were compared to the results of measurements. Several statistical metrics were calculated to determine the most accurate value of the reflection coefficient:
Relative error of the 95th and 50th percentiles of the electric field; the closer the value of both percentiles for the calculated and measured results, the more accurate the value of the reflection coefficient. The 95th and 50th percentiles of the electric field were determined by first squaring all results, calculating the percentile value of squares, and, finally, rooting the percentile value;
Root mean square error, normalized root mean square error, and root mean square relative error of the calculated electric field compared to the measured electric field; square errors are more appropriate than linear errors, as the exposure is related to the square of the electric field. The lower the errors, the better the agreement of both results;
Pearson correlation coefficient r; the higher the number of the r parameter, the better the correlation of the calculated data with the measured data. The Pearson correlation coefficient was calculated for the square of the electric field;
Kolmogorov–Smirnov (K-S) test; the Kolmogorov–Smirnov test gives information about the similarity of two distributions. All previous metrics compare results point to point. However, in the complex indoor environment, there are many variables and factors affecting detailed electric field distribution that are not possible to include in a model. This means that calculated results and measured results can differ significantly if compared point to point but the overall exposure is still very similar, because maybe the model predicted one hotspot at a certain location, but, in reality, it was positioned on some other location. Therefore, important information when comparing two datasets of results that represent the exposure is the similarity of the distributions of both datasets. The smaller the value of the Kolmogorov–Smirnov test, the more similar the distributions of both results.
The analysis presented in
Table 2 confirms that 3 dB attenuation delivered the best overall performance across all evaluation metrics. It achieved the lowest error for the 50th percentile (E50), the smallest root mean square and normalized root mean square errors, and optimal distributional match (lowest K-S statistic). While ranking second for 95th percentile (E95) estimation and third for Pearson correlation coefficient (r = 0.893), its correlation performance remained nearly identical to the top result (0.895). Importantly, this 3 dB value consistently ranked among the top two performers for all statistical measures evaluated, demonstrating the best trade-off between under- and over-estimation across corridors with varying clutter densities. Given the practical need for a single representative attenuation value, 3 dB provided the smallest average error, the strongest distributional similarity, and robust correlation, making it the most balanced and reliable selection for comprehensive modeling.
Therefore, for further numerical modeling, the attenuation of 3 dB was selected for pallet racks in Narda EFC 400 models.
For the MATLAB simulations, the pallet racks were modeled as wooden pallets carrying chipboard boxes of various sizes arranged on metallic frames (see
Figure 2). The racks were mostly filled, with only about 10 to 20 % of the volume remaining empty. Because the MATLAB tool does not account for transmission through objects, it was assumed that the partial transmittance through the racks was proportional to the percentage of empty space. Based on this assumption, the effective attenuation introduced by the pallet racks was estimated to be between 14 and 20 dB.
4. Discussion
The exposure of the workers due to a real private 5G installation was analyzed for two typical cases, the first being a warehouse with pallet racks used to store reprocessing material and final products and the second being a production hall mainly used for assembly and testing of high-end electronic devices. To gain detailed insight into the spatial variability of exposure within both premises, detailed grid measurements were combined with numerical calculations covering the entire area. Additional detailed measurements were carried out for the worst-case exposure situation under the lowest RRH-u, which was mounted 3.1 m above floor level. The exposure was also analyzed using walk-through measurements. All results of measurements were extrapolated for full load conditions.
Results of measurements and calculations clearly show that the electric field strength values were low at all locations accessible to workers in the warehouse. The maximum value, obtained through measurements and using both models, was between 1.4 and 1.5 V/m. The 95th percentile value was significantly lower and below 1.1 V/m. The exposure in the production hall was slightly higher; for 36 measurements distributed through the whole production hall, the maximum value was 2.1 V/m, and the 95th percentile was 1.2 V/m. The reason for the slightly higher values in the production hall was the number of objects in the environment. In the warehouse, there were several high pallet racks mostly full of different items, whereas in the production hall the equipment was relatively low and covered only part of the production areas (see
Figure 4). Therefore, the attenuation of the EMF emitted by pRRHs was much lower in the production hall than in the warehouse. This led to higher values in the production hall.
The maximum value in the production hall was measured at a location close to the lowest two pRRHs. In the warehouse, all four pRRHs were mounted at a height of about 5 m, whereas in the production hall four of them were mounted at a height of about 5.9 m and two at a height of 3.1 m. Due to the closer proximity of the pRRHs mounted at a height of 3.1 m, it was expected that the highest values would be measured there. It is not expected that pRRHs will be mounted significantly lower than the analyzed case; therefore, this situation represents the worst-case situation that is expected to be found in private network installations. To further analyze the worst-case scenario, 22 additional detailed measurements were performed in the vicinity of one of the pRRHs mounted at a height of 3.1 m. For these detailed measurements, the maximum value at a height of 1.5 m was 3.1 V/m for measurements and 2.7 V/m for calculations, obtained right below the pRRHs. The 95th percentile value was slightly lower at 2.5 V/m and 2.3 V/m. The difference between the maximum value and the 95th percentile value was significantly smaller for these detailed measurements compared to the whole production hall. The reason is that in the case of detailed measurements, all measurement points were relatively close to the pRRHs and the largest horizontal distance was 5 m; therefore, the EMF radiated by the pRRHs did not decrease as significantly as in the case of larger distances. To further determine the values even closer than 1.6 m from the pRRHs, measurements closer to the pRRHs were conducted. At a distance of 0.6 m from the pRRHs, the measured value of the electric field was 5.1 V/m, and, at a distance of 0.3 m, it was 8.9 V/m.
All above values were well below the Directive 2013/35/EU [
21] action values of 140 V/m, as well as the 1999/519/EC [
22] reference levels of 61 V/m, which should ensure adequate protection of workers at particular risk (workers wearing active or passive implanted or body-worn medical devices, pregnant workers) [
23]. The average exposure index for measurements in the warehouse was 0.000015 for action values from [
21] and 0.000080 for reference levels from [
22]. In the production hall, the average exposure index for measurements in the whole production hall was 0.000036 for action values from [
21] and 0.000190 for reference levels from [
22].
Results of walk measurements in
Figure 12 (warehouse) and
Figure 16 (production hall) also show that indoor occupational exposure was low. In the warehouse, the maximum 6 min average value was 0.70 V/m, and the 30 min average value was 0.54 V/m. In the production hall, the values are slightly higher, as the maximum 6 min average value was 1.45 V/m and the 30 min average value was 0.87 V/m.
Private 5G networks exhibit variable exposure characteristics depending on frequency band and deployment. Sub-6 GHz operations produce exposure profiles broadly comparable to 4G macrocell networks, albeit with potentially higher localized levels near densely deployed low-power small cells offset by reduced per-cell transmit power, while millimeter wave (mmWave) deployments generate highly focused, shallow-penetration (skin-surface level) EMF due to beamforming and obstruction losses, resulting in significantly lower whole-body exposure outside of the beam path. Compared to other industrial systems, typical 5G small cell exposure (0.1–2 W) is analogous to Wi-Fi routers (0.05–0.1 W) or LoRaWAN gateways (0.5–5 W) at similar proximity, although user devices (e.g., smartphones) often dominate personal exposure during active use (0.1–0.5 W peak for 5G/4G vs. 0.01–0.05 W for Wi-Fi). Technologies like LoRa end-devices and Bluetooth exhibit negligible exposure due to ultra-low power (≤0.1 W) and sporadic transmission duty cycles. When compared to Zigbee, 5G exposure will be significantly higher, as Zigbee uses limited transmit powers and focuses on lower data rates, which will low power consumption. Similarly, other industrial wireless technologies like WirelessHART also focus on lower data rates with limited transmit power. Their main use is process monitoring and optimization, while 5G enables more advanced functionalities like robotics, low-latency video streaming, etc. Generally speaking, all systems operate well below international exposure guideline (ICNIRP), with worker exposures typically representing 0.01–0.1% of permissible levels.
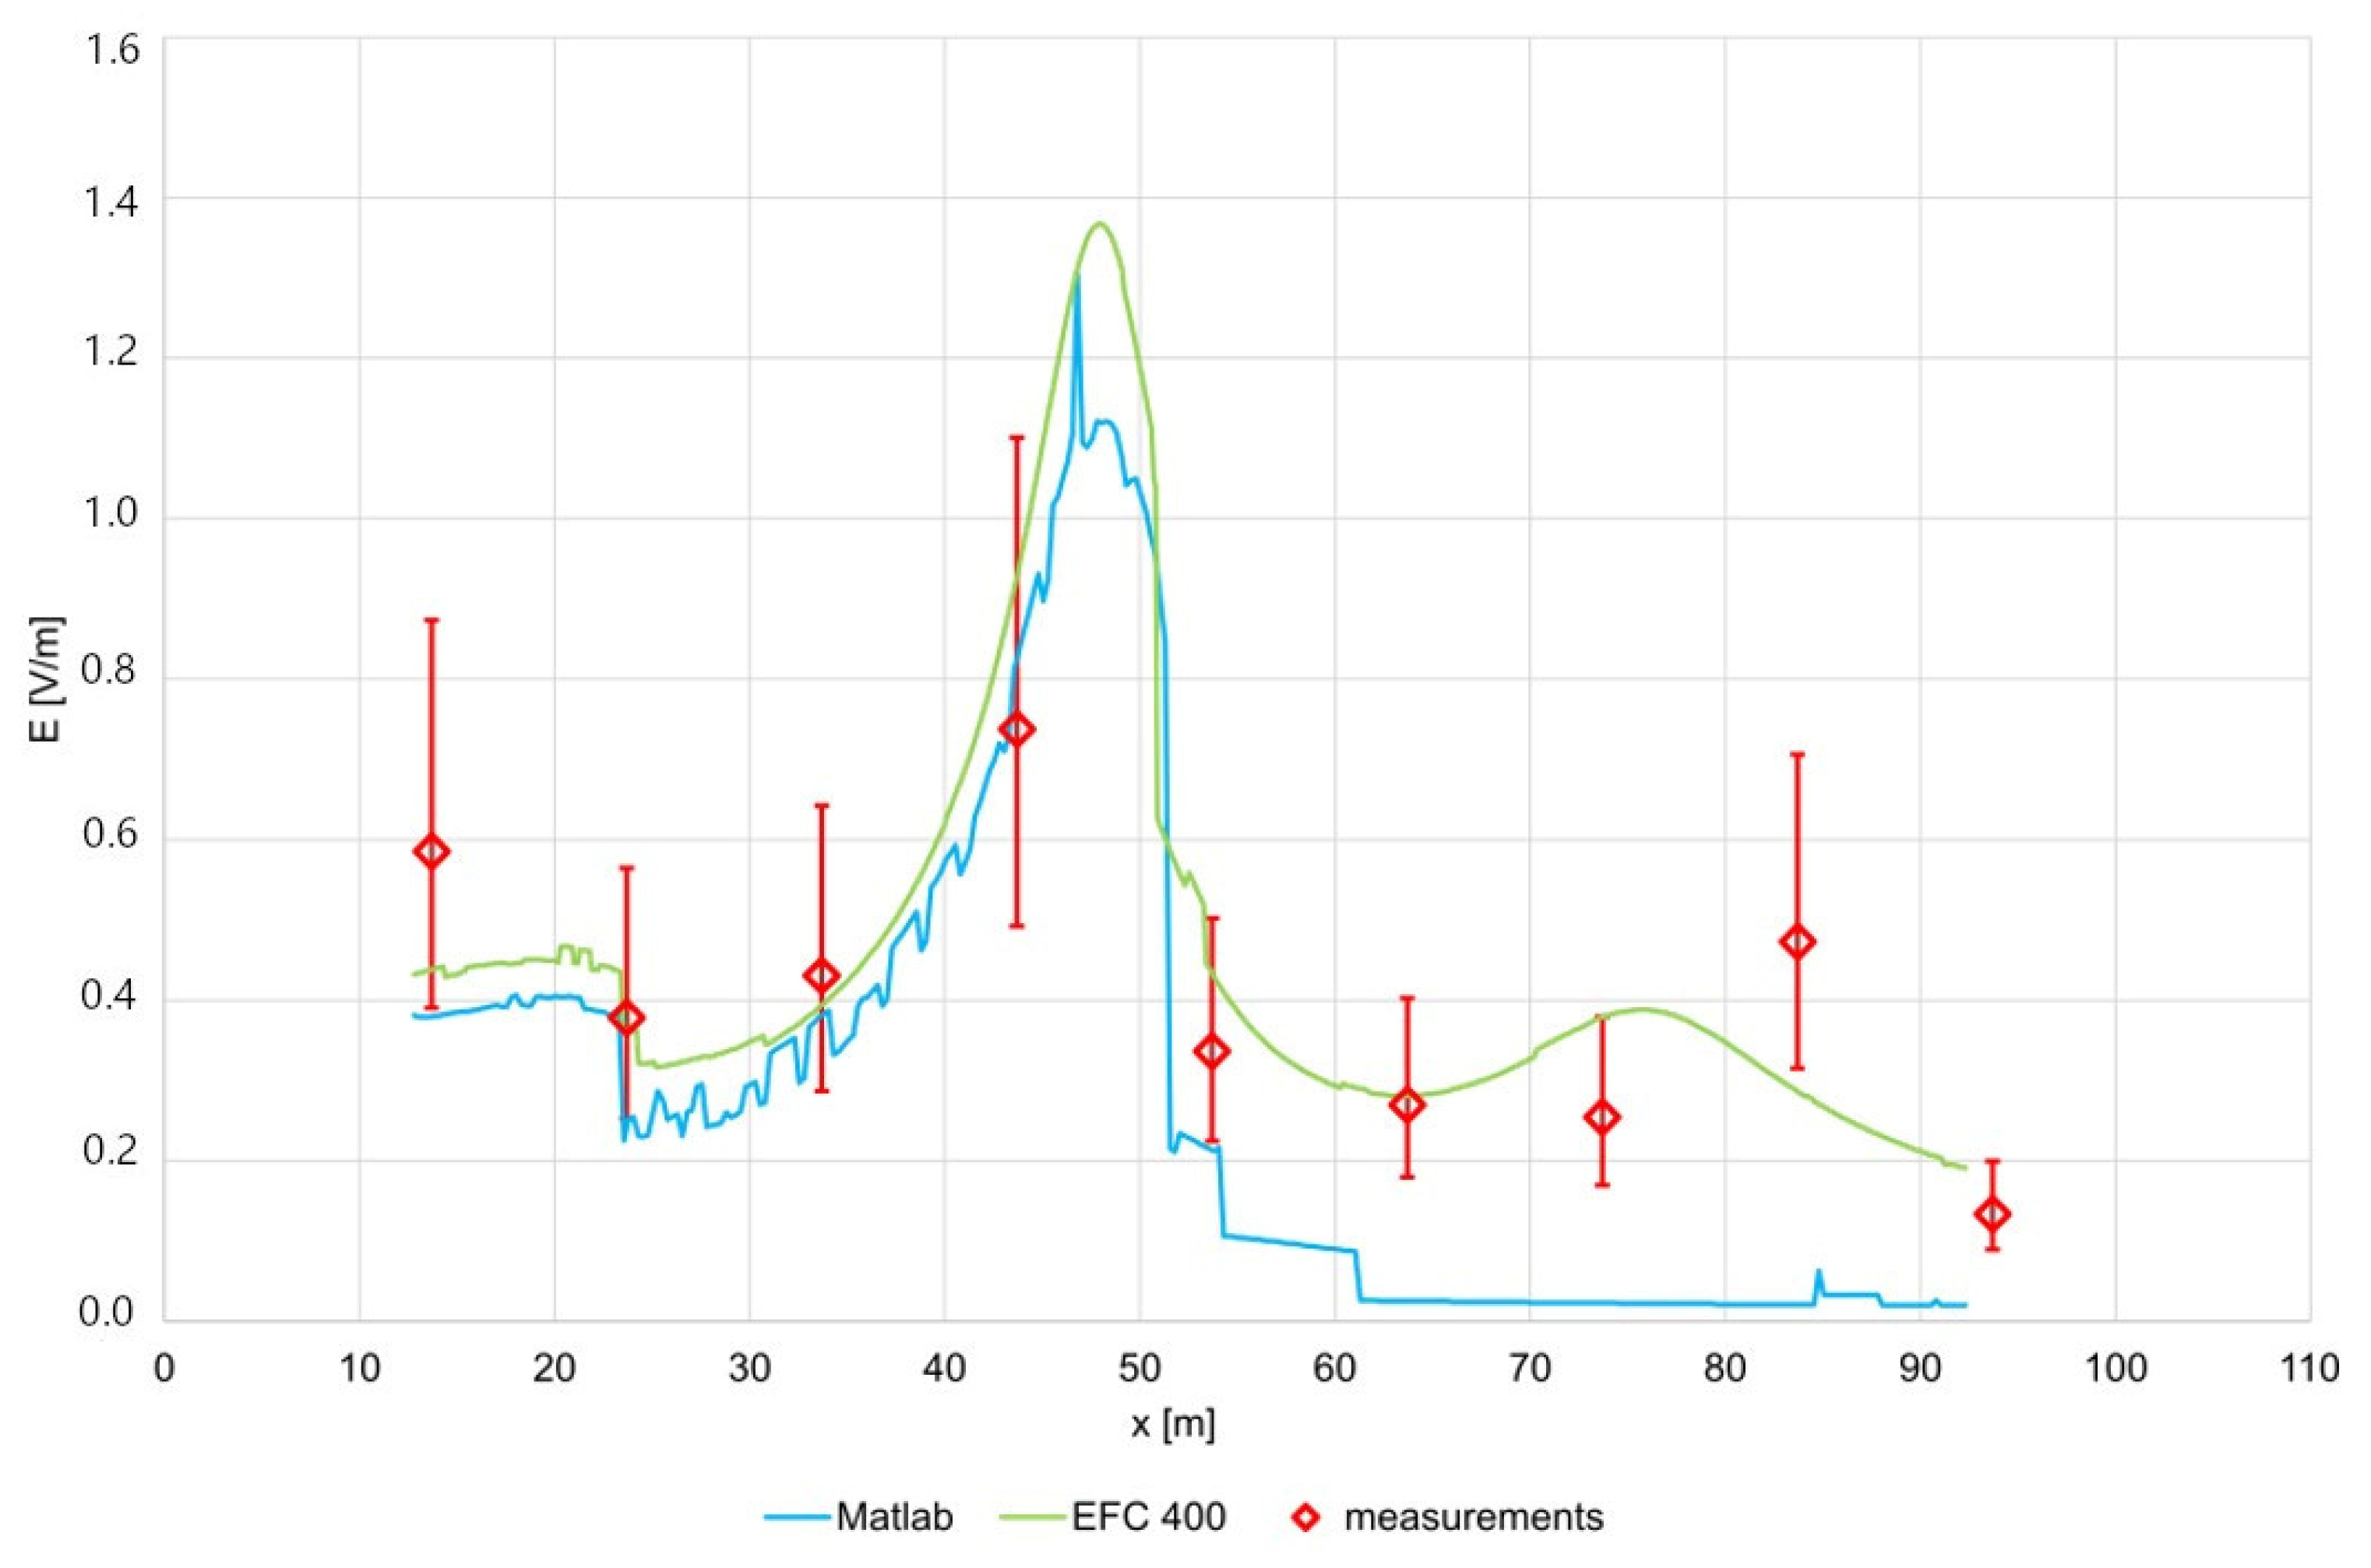
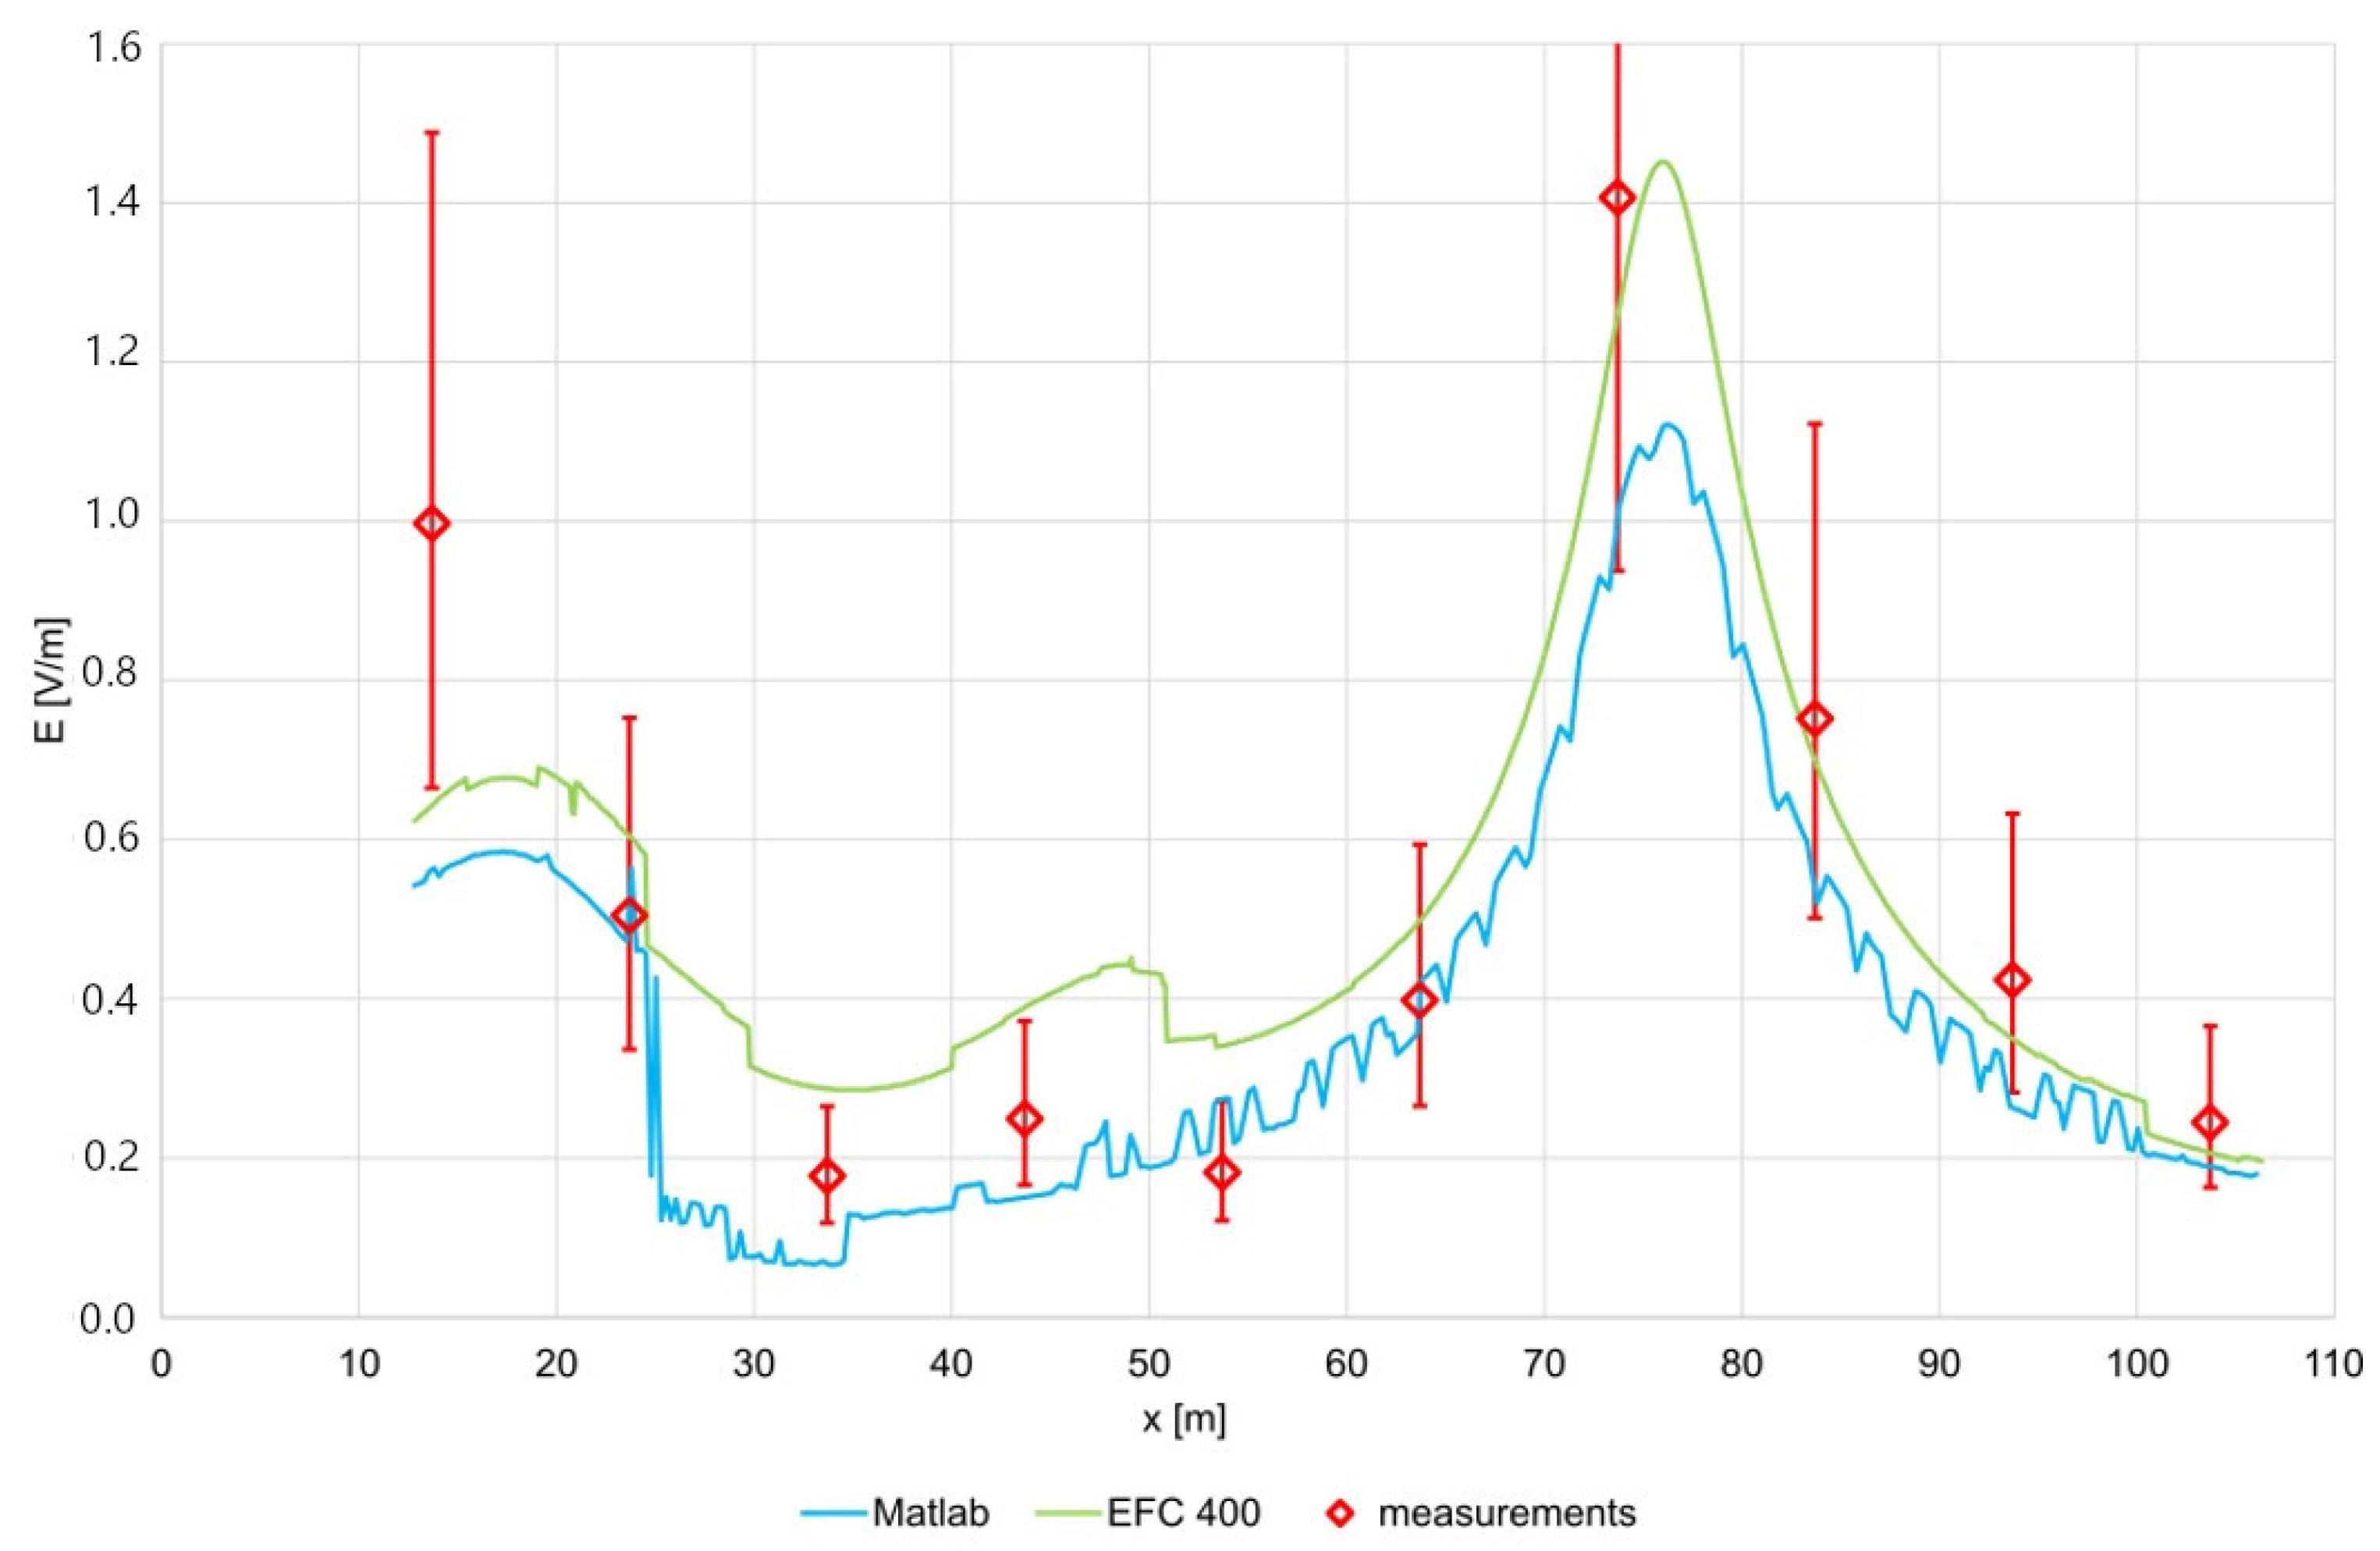
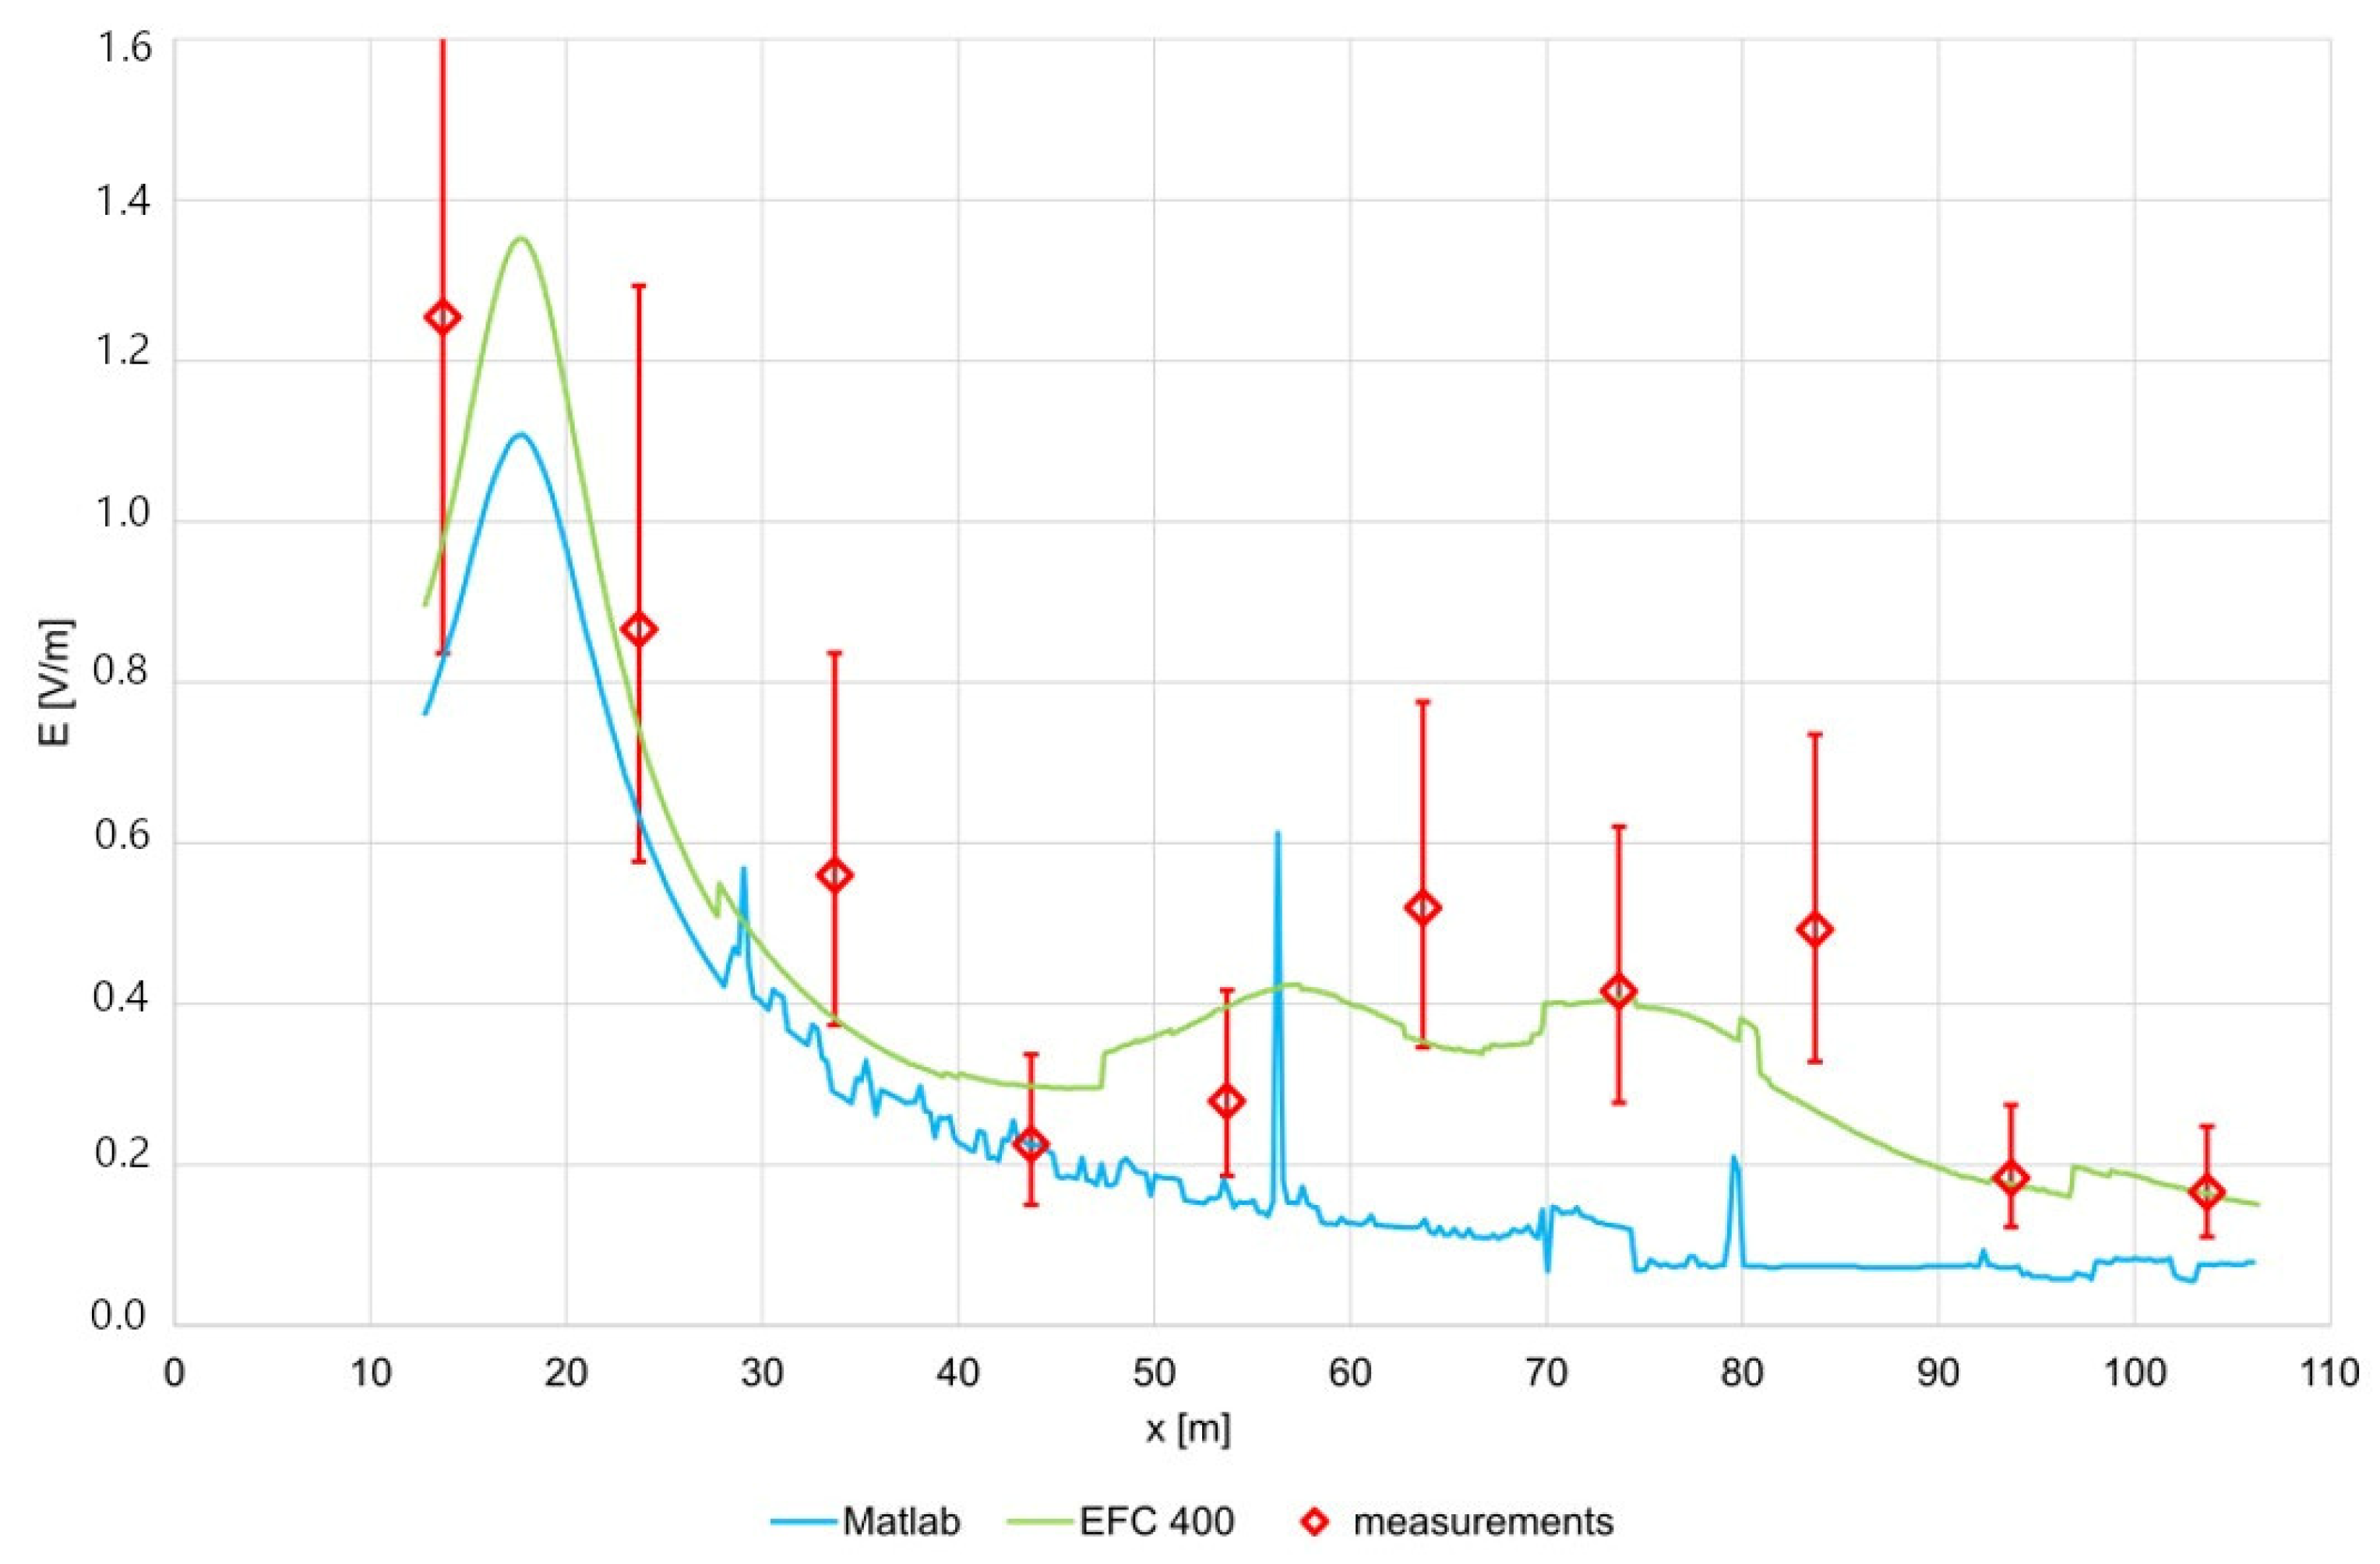
From the comparisons of results of measurements and calculations, we can see that the results of both models agreed well with the measurements. Scatter plots in
Figure 5 show the same trends for both models. From
Figure 7,
Figure 8,
Figure 9,
Figure 10 and
Figure 11, we can see that the calculated values mostly fell inside of the measurement uncertainty of the measured values. When considering this, it must be taken into account that during the measurements the pallet racks were almost fully occupied. The material stored on the pallets was a mix of small to medium plastic and metallic items stored mostly in cardboard boxes, which were placed on wooden pallets stored on the racks. The exact content of the items stored at each part of the racks was not known. Furthermore, some racks were fully loaded, whereas on some racks some pallets were missing and/or some pallets were not fully loaded. Thus, it can be expected that the racks’ attenuation and reflection of the EMF was highly inhomogeneous. To further complicate the matter, very limited data are available regarding the attenuation and reflection of such occupied pallet racks at the frequency of 3500 MHz. Therefore, the attenuation for the Narda EFC 400 tool was determined through a parametric study, and reflection coefficients for the MATLAB tool were assigned uniformly for all packages corresponding to cardboard. If we analyze the results along corridor 3 in
Figure 9, we can see that the Narda EFC 400 model underestimated the values at distances of about 70 to 80 m. This means that there, the real value of the attenuation of pallet racks was lower than 3 dB, as higher measured values were due to the contribution of pRRHs in corridor 2. However, if we focus on corridor 2 in
Figure 8, we can see that the Narda EFC 400 model overestimated the values at distances of about 40 to 50 m. This means that there, the real value of the attenuation of pallet racks was higher than 3 dB, as higher calculated values were due to the contribution of pRRHs in the corridor 2, which in reality was lower than modeled. These cases clearly show that attenuation of the pallet racks significantly affects the results locally.
The primary difference between the Narda EFC-400 and MATLAB tools that affects the calculated electric field values lies in how each handles transmission through pallet racks. The Narda tool applies a uniform attenuation value of 3 dB for the racks, which was selected through a parametric study to best match measured data. In contrast, the MATLAB model does not account for field transmission through objects, so the electric field can only propagate through the empty spaces within the racks, resulting in effective attenuation of up to 20 dB. This substantial difference is likely the main reason for the discrepancies observed between the two sets of simulation results. Despite these limitations, both models demonstrated good agreement with measurements in terms of maximum, average, and 95th percentile values, with differences typically below 20%, as shown in
Table 3 and
Table 4.
Regarding unmeasured areas, these modeling differences imply that each tool may have strengths in different spatial contexts. The Narda model, by including partial transmission, even if uniformly applied, offers more realistic predictions in cluttered zones where some energy penetration through racks is expected. The MATLAB model, while more accurate in modeling material-specific reflections, tends to underestimate exposure in obstructed areas due to its lack of transmission modeling. Nevertheless, because both models aligned well with measurements in representative parts of the facility, we consider their predictions in unmeasured areas to be reliable within a reasonable margin of uncertainty. Importantly, using two independent modeling approaches provides confidence in the robustness of the overall assessment, especially when combined with spatially distributed measurements.
Numerical modeling is a widely used method to determine EMF exposure for both indoor and outdoor exposure scenarios. Up-to-date scientific publications clearly demonstrate that the mean public 5G network exposure levels of the general public ranged from 0.35 to 0.81 V/m in ten different EU countries in a non-user scenario [
24]. In [
25], the electric field from 5G was reported to be in the range of 0.14–0.57 V/m and 0.19–4.10 V/m in urban and rural locations, respectively. In [
26], the average total E fields were found to be 0.77 V/m, 0.35 V/m, and 0.08 V/m for different micro-environments after clustering into three groups. However, limited studies deal with complex geometries and exposure scenarios, like the one presented here. Therefore, by complementing the results of measurements with results of two different numerical models using different software packages, different groups, and different principles of geometric representation, we validated the use of the numerical modeling method to estimate RF EMF exposure for such complex environments.
5. Conclusions
The RF EMF exposure of workers due to private standalone (SA) 5G networks in a warehouse and a production hall in a smart industry facility of a key global leader in smart IoT solutions was found to be very low and far below the current exposure limits for workers.
The maximum output power of each pRRH was only 1 W, meaning that only 4 W of output power was installed in the warehouse and 6 W in the production hall in total with an antenna gain of 0 dB. Using multiple low-power pRRHs benefits from the ability to obtain good coverage in both halls, even in an environment with a lot of clutter.
It is expected that this could be similar to most indoor scenarios in smart industry sectors due to the relative low output power of base stations used for indoor private networks. It is also a common practice to mount the pRRH at ceiling level, mainly to obtain good coverage, thus reducing exposure at worker-accessible locations. In the studied case, the pRRHs were located just under the roof at a height of 5 m. To minimize the average downlink exposure levels, it is advised to strive for a maximally homogeneous distribution of (lower) electric field levels. This can be realized by either increasing the installation height of pRRHs and increasing their power as needed, or, alternatively, reducing their output power but increasing the amount of transmitters accordingly to maintain coverage.
Results of measurements of RF EMF exposure of workers showed that in the warehouse, the maximum 6 min average value was 0.70 V/m, and the 30 min average value was 0.54 V/m. In the production hall, the values were slightly higher, as the maximum 6 min average value was 1.45 V/m and the 30 min average value was 0.87 V/m. The results clearly demonstrate that EMF exposure of workers was far below the existing exposure limits and that similar exposure scenarios could also be expected for other indoor or outdoor pRRH–5G private networks in smart industries.
During the measurement process, one location was identified where the pRRH was installed at a lower height of 3.1 m, which represents the worst-case conditions. The maximum electric field value at a sensor height of 1.5 m was 3.1 V/m for measurements and 2.7 V/m for calculations, obtained right below the pRRHs. The 95th percentile value was slightly lower at 2.5 V/m and 2.3 V/m, respectively.
In addition to the measurements, numerical modeling with two different tools was used to estimate the electric field distribution in the warehouse and the production hall. Both models demonstrated relatively good overall agreement with the measured values, particularly in terms of maximum, average, and 95th percentile levels, with differences generally below 20%. Although local deviations occurred due to the complex and inhomogeneous nature of pallet rack loading and limited information on material properties, the models provided valuable spatial insight and were shown to be effective for estimating exposure levels in areas not directly measured. Importantly, numerical modeling can also help identify potential exposure hotspots that might be overlooked during spot measurements, especially in large or cluttered environments. These results support the use of numerical modeling as a complementary method to measurements, particularly for RF EMF exposure assessment of indoor private 5G networks installed in large spaces.
Based on our measurements and the obtained results, the RF EMF exposure of workers due to a private standalone (SA) 5G network in the smart industry facilities was found to be significantly below the exposure limits, with the maximum not exceeding 0.01% of the reference level specified by Directive 2013/35/EU [
21].
Although this study offers a detailed evaluation of worker exposure to RF EMF in an operational smart industry environment, the findings are derived from measurements and simulations performed at a single facility. Consequently, extrapolating these results to other industrial settings requires careful consideration. Exposure levels may differ due to factors like variations in transmitter power, deployment density, beamforming antenna configurations, structural design, material composition, and the arrangement of equipment and reflective surfaces. For instance, facilities with higher-power transmitters, antennas mounted at lower heights, or more densely packed metallic infrastructure could exhibit distinct exposure distributions. However, the methodology presented here—combining measurements with numerical modeling—can be applied to other industrial settings for assessing worker exposure.


