1. Introduction
Public concern over exposure to electromagnetic fields (EMFs) remains high, particularly with the rollout of 5G networks. For example, in Italy, this concern was magnified by widespread debates over health and environmental risks, with more than 300 municipalities banning 5G rollout between April and June 2020, largely influenced by fears surrounding EMF exposure and its potential impacts on public health [
1]. Previous studies showed that EMF exposure mainly fluctuates over the years with the introduction of new cellular technologies (2G–4G) and does not follow a distinctly upward or downward pattern [
2]. In Greece, a preliminary study [
3] focusing on the period when the 5G technology was launched, concluded a limited impact of the 5G new radio (NR) network on the total radio frequency (RF) exposure when measured without induced traffic. Pre-5G cellular networks do not use beamforming, resulting in a nearly constant radiation pattern. In contrast, 5G networks utilize advanced technologies, including massive MIMO and beamforming, which focus beams towards users [
4]. The ability to direct signals toward specific areas and users has necessitated the development of new assessment methods to evaluate maximum exposure, as described in [
5].
This study presents the results of 400 in situ measurements taken outdoors at ground level across four distinct regions in Greece. The selection of measurement locations did not consider the proximity to cellular base station (BS) antennas, even though the density of BS in these areas was identified. Measurements were conducted without inducing additional traffic, using standard procedures to explore the impact of the 5G technology on the overall exposure. The first part of this research analyzed the data in relation to exposure limits and examined the contribution of cellular networks—from 2G to 5G—to the overall EMF levels. We also explored the specific impact of each cellular technology on the total field produced by cellular sources. The Kruskal–Wallis test [
6] was applied to identify statistical differences between the recorded electric fields in different environments (urban/suburban). In the second part, we explored the correlation between EMF measurements in the 5G NR band at 3.5 GHz and their distance from 5G BS antennas, without causing traffic, which can be induced by using a smartphone. The studies of different propagation models [
7] show that the signal from BS attenuates with distance. For that reason, the distance from BS is a significant input for artificial intelligence (AI) models aiming to predict the electric field levels [
8,
9]. Regardless of traffic load, 2G, 3G, and 4G BS antennas maintain a nearly stable radiation pattern. In contrast, 5G BS antennas primarily broadcast signals which are usually transmitted periodically in varying directions. It is of interest to explore whether the variable radiation pattern of a 5G BS, without inducing traffic toward the measurement location, also leads to an inverse correlation between the recorded electric field strength and distance.
2. Materials and Methods
2.1. Measurement Equipment and Methodology
During the in situ measurements, an SRM-3006 basic unit (Narda Safety Test Solutions GmbH, Pfullingen, Germany) was used. This device, which covers a frequency range from 9 kHz to 6 GHz, was directly connected to two isotropic tri-axial E-field antennas, also from Narda Safety Test Solutions. These antennas have distinct frequency ranges (27 MHz to 3 GHz and 420 MHz to 6 GHz) and dynamic measurement ranges (0.2 mV/m to 200 V/m and 0.14 mV/m to 160 V/m, respectively). Two service tables were created: the first table included frequencies from 27 MHz to 3 GHz, measured with the first antenna, while the second table encompassed frequencies from 3 GHz to 6 GHz, measured with the second antenna. The SRM-3006 was configured in the “safety evaluation” mode, and E-field measurements for each frequency range in the service tables were taken. The resolution bandwidth (RBW) during the measurements was set to the device’s automatic setting. According to the SRM-3006’s internal configuration, this automatic mode ensures that the RBW is less than or equal to one-quarter of the frequency span of the narrowest service band being measured. For each band, the device then selects the closest smaller available RBW value based on this criterion, as described in [
10]. It is important to note that each frequency band is measured with its own dedicated RBW, adapted according to the specific span of that band.
At each measurement location, measurements were conducted at three distinct heights: 110 cm, 150 cm, and 170 cm, according to the guidelines of the IEC 62232:2022 standard [
5]. The E-field value at each height and frequency band f corresponding to the chosen service were recorded. The electric field for each frequency band f was calculated using the data gathered at the three different heights at each measurement site as follows:
The total E-field value for that particular location was subsequently determined as follows:
It is important to mention that all in situ measurements took place on weekdays, between 09:00 and 15:00. By reviewing the data gathered by the National Observatory of Electromagnetic Fields (NOEF) [
11], we confirmed that the measurements were taken during periods of high telecommunications traffic.
To avoid generating downlink traffic that could trigger beamforming towards the measurement device and increase the BS antenna output power, all mobile devices held by operators were set to flight mode. This approach was intentionally selected to assess exposure levels in public areas accessible to everyone, such as squares, parks, and high-traffic locations such as bus and transportation stations, without inducing any traffic load by the operator.
2.2. Selected Urban and Suburban Environments
The measurements were conducted in four regions—two urban and two suburban—each covering approximately 4–7 km
2 in the regions of Attica and Central Macedonia, Greece.
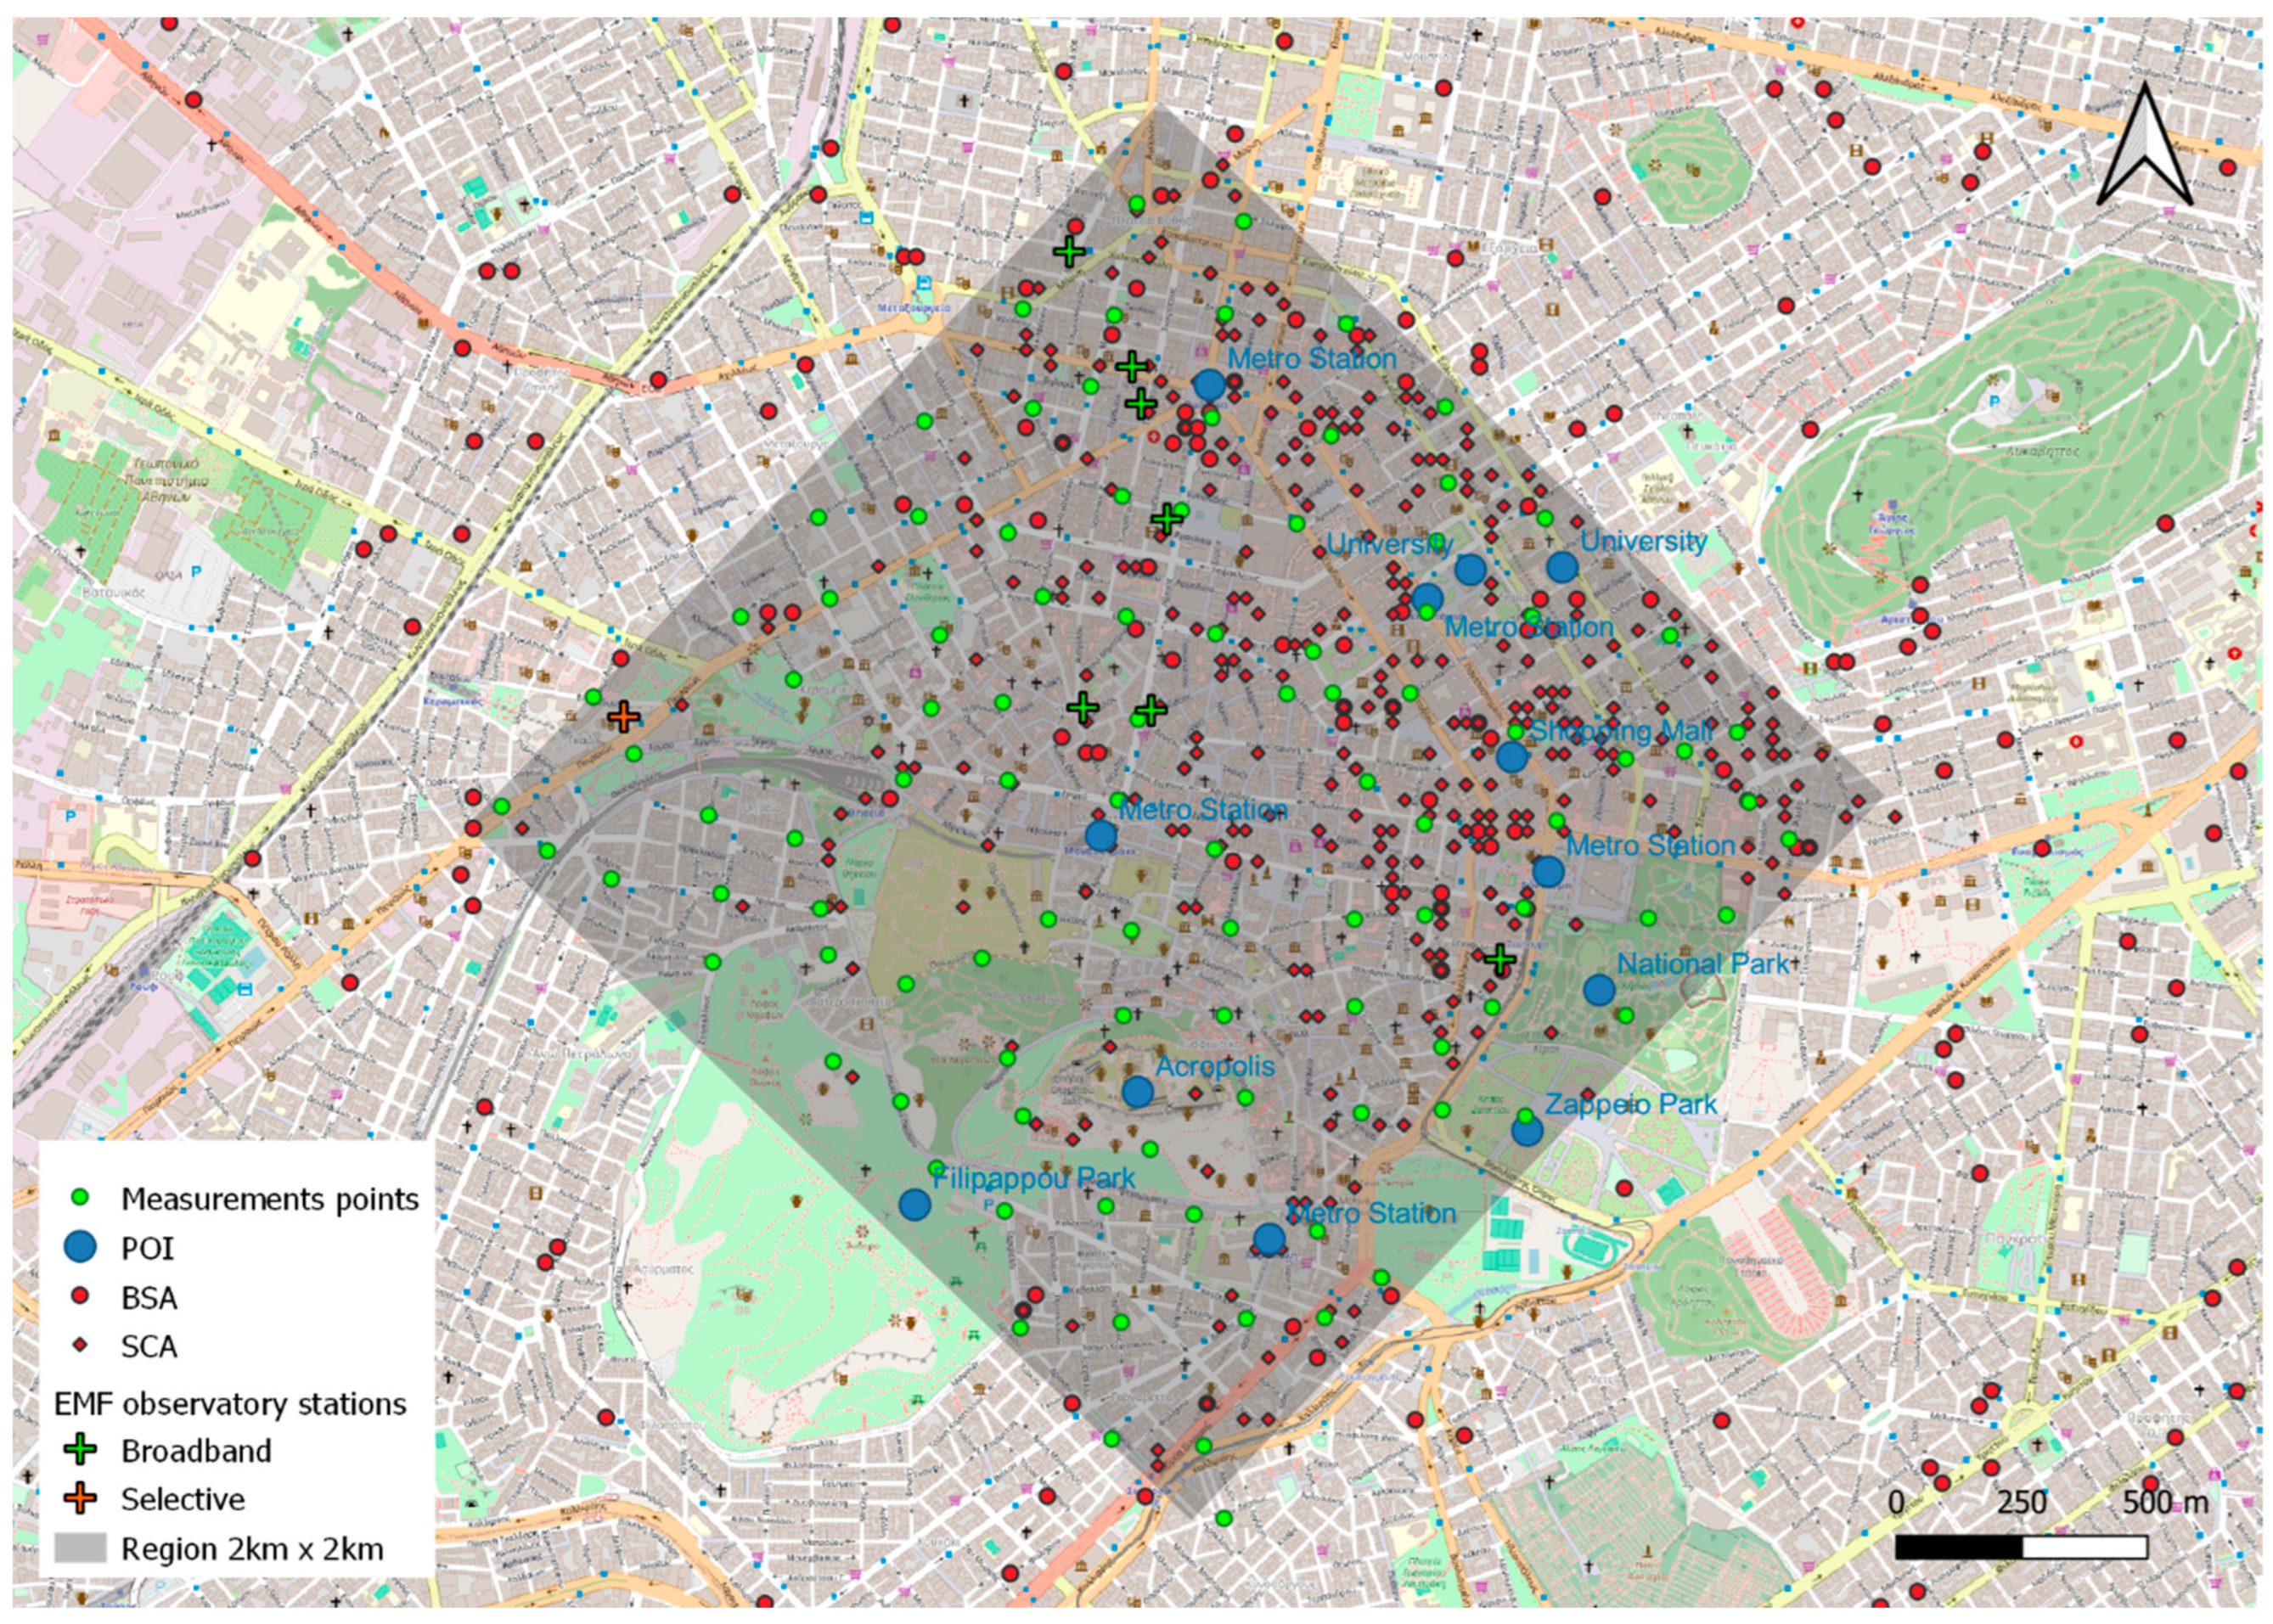
Table 1 provides an overview of these regions, which are subdivided into the noted municipalities and include various points of interest (POIs) such as parks, bus stations, university campuses, and shopping malls, areas that typically have higher public concentrations. Within each region, a grid was established by appropriately spacing measurement points, considering the existence of POIs, thus creating a grid with 100 measurement points at ground level. As an example,
Figure 1 illustrates the Attica urban region with measurement points, POIs, locations of base station antennas (BSAs), small cell antennas (SCAs) and NOEF broadband and selective stations. The initial placement of each point was predetermined; however, adjustments may have been necessary if (a) physical access to a point was obstructed by obstacles or private properties or (b) closer proximity to POIs was required.
In the Results section, we performed a Kruskal–Wallis test to compare the measurement results across the various environments and regions. This non-parametric statistical method assesses whether there are statistically significant differences between two or more groups. Consistent with prior research, we anticipated significant differences in values between urban and suburban environments, as observed in previous studies [
13]. Regarding cellular networks, BS density typically correlates with population density. Suburban areas, characterized by lower populations, more sparse development, and shorter buildings compared to urban areas, likely have fewer BS. This, in turn, contributes to lower EMF values in these regions.
To calculate the percentage contribution of different wireless applications to the total field, we used the following formula:
where
is the recorded electric field within the frequency band i and
represents the total electric field resulting from all frequency bands.
2.3. EMFs from 5G Base Stations Relative to Distance
The second part of the analysis explored the potential inverse correlation between EMF measurements around 3.5 GHz and the distance to 5G BS. As the distance from a BS increased, the strength of the electric field decreased due to the propagation characteristics of electromagnetic waves. In free space, the electric field strength diminished following an inverse law, meaning that the electric field strength dropped proportionally to 1/d, where d is the distance from the source, as described by the Friis transmission equation [
14]. Signal propagation in real-world environments is influenced by various factors, including obstacles, terrain, and weather conditions. When signals encounter barriers, they undergo phenomena such as reflection, refraction, and diffraction, which lead to scattering and attenuation of the signal strength. The complexity of path loss behavior in these scenarios is modeled by empirical models, such as the Okumura–Hata model [
15] and the COST 231 Walfisch–Ikegami model [
16].
A current trend in research is the increasing use of AI in various fields. Path loss and EMF prediction models are no exception to this trend [
8,
9,
17]. These models commonly use the distance from BS antennas as an input variable (or “feature”). Combined with other features, such as transmitted antenna power, line-of-sight (LOS) or non-line-of-sight (NLOS) conditions, and more, these inputs help predict the target values accurately.
Antennas for 2G, 3G, and 4G BS were engineered to consistently cover sectors within a hexagonal cellular network layout. These antennas maintain an almost stable radiation pattern regardless of the traffic load. The inverse relationship between distance and the E-field has been examined in many works, especially for previous generations of cellular technologies [
18]. In contrast, 5G BS primarily broadcast signals, such as the synchronization signal block (SSB), which are typically transmitted periodically in different directions. It is of interest to explore whether the varying radiation pattern from a 5G BS, without forcing traffic to the measuring spot, still leads to a decrease in the recorded electric field strength as the distance increases.
For the analysis, it was crucial to determine the distance between each measurement spot and the BS that include 5G antennas. To this end, we gathered information about the coordinates of 5G antennas and loaded it, along with the measurement coordinates, into the QGIS software (Desktop version 3.34.3) [
19]. For each spot, we independently calculated the distance from that spot to the nearest 5G BS. Additionally, we calculated the average distances from each spot to the two closest, three closest, four closest, and five closest 5G BS. This study utilized data from the Hellenic Telecommunications and Post Commission (EETT) database [
12], which contains the locations of all BS antennas. Moreover, specific information relating only to the locations of 5G BS was used. The first 5G antenna in Greece was installed in June 2019. By March 2024, more than 500 5G BS had been installed all over Greece.
Figure 2 depicts the monthly number of 5G BS installed in Greece, starting from 2019. The spot measurements across four different environments were conducted over the period from May 2023 to January 2024. The last column of
Table 1 contains the information on how many 5G BS at 3.5 GHz were in operation in each environment during the measurements. Since no 5G BS were installed in the municipality of Thermi, the suburban environment of Central Macedonia was excluded from the analysis.
The method for exploring whether the electric field in the 5G band decreases with increasing distance can be summarized in the following steps:
Perform measurements (27 MHz–6 GHz) without generating data traffic;
Record the coordinates of the measurement spots;
Isolate measurements in the 3.5 GHz band (FR1, 5G band);
Retrieve the locations of BS operating in the same band;
Calculate the average distance between the measurement spots and the nth closest 5G BS using QGIS software (where n ranges from 1 to 5);
Since the electric field is inversely proportional to the distance, , plot the log10(distance) vs. log10(E-field) and draw the linear regression line, anticipating a decrease in electric field strength as the distance increases;
Compute Spearman’s correlation coefficient [
20] between the electric field and the distance to the nth closest BS (where
n ranges from 1 to 5).
3. Results
3.1. Statistical Analysis
In this section, we present the spot measurement results from the four regions.
Figure 3 depicts the boxplot of the total E-field values, alongside a separate boxplot for the E-field values registered from all cellular frequency bands.
Table 2 summarizes the results, showing the minimum (Min), maximum (Max), and root mean square (RMS) calculated electric field values for both the entire measurement frequency range (27 MHz–6 GHz) and the 5G FR1 band (3.4 GHz–3.8 GHz), for each region. As observed, there was a high dispersion in the measurements. This is because the spots were selected randomly, irrespective of the distance from the BS, LOS, and the built area around the spot, which are the factors that play a significant role in the propagation of electromagnetic waves and, consequently, the levels of EMFs. It is worth noting that none of the 400 values exceeded the ICNIRP limits [
21] or the stricter Greek national limits, which are 60% of the ICNIRP values [
22], even when considering the expanded uncertainty of the measurements. The expanded uncertainty of the measurement equipment used in Central Macedonia was 36.2% for the total electric field, while in Attica, it was 37.2%. The highest total electric field value recorded across all four regions, even when accounting for the respective uncertainty levels, remained at least 1.5 times below the strictest Greek national limit. Observing the values, it is clear that higher values are associated with higher population and BS density, which are detailed in
Table 1.
Conducting the Kruskal–Wallis test on the data from different environments revealed significant differences in the E-field values (p-value < 0.05) between urban and suburban regions of Central Macedonia and Attica for both total and cellular band E-field levels. A potential statistical correlation was observed only in the urban regions of Central Macedonia and Attica, specifically for the E-field derived from cellular bands (p-value = 0.12). These two regions have similar built-up area patterns, although the population and BS density in the urban area of Attica are higher. The suburban regions of Attica and Central Macedonia differ significantly not only in population and BS density, but also in built-up area patterns; in Thermi, the built-up area is sparser, with lower-height buildings. These results suggest that geographic and urban/suburban categorizations significantly impact electric field measurements in these regions of Greece.
Examining the contribution of cellular bands to the total electric field (
Figure 4) revealed that they are the dominant contributors to EMFs in the two urban areas. On the contrary, in the suburban area of Attica, they account for 49% of the total electric field, whereas in the C. Macedonia suburban environment, they account for only 28%. It is worth noting that the higher contribution of FM and “Other” frequency bands in suburban areas is not due to these bands being higher than in urban areas, but rather because the lower field values from cellular frequencies make the contribution of the other bands relatively higher.
In Greece, the 3G network was abolished by all providers before mid-2023. The 900 MHz band was retained for the 2G technology, primarily for long-distance voice communication. In addition to the band around 3.5 GHz, a band in the 700 MHz range was allocated for 5G connectivity. All other frequency bands are used for the 4G cellular system. Isolating the total electric field from cellular bands and using Equation (3) to find the percentage contribution from each cellular generation (2G, 4G, and 5G) revealed that, during the period when spot measurements were performed, the highest contribution was from 4G cellular networks in all the environments. The 5G network in the 3.5 GHz band had a small contribution in all cases. This can be explained by the relatively low usage of 5G FR1 mobile terminals, the small number of BS installed and the fact that only broadcasting signals are active, without directing a beam towards the measurement spot. Although no 3.5 GHz 5G base stations were deployed in the suburban region of Central Macedonia during the measurement period, a small contribution in this band appears in
Figure 4b. This can be attributed to two main factors. First, the overall recorded electric field levels from cellular networks in the area were low, which makes even small contributions in the 3.5 GHz band more prominent in relative terms. Second, even without local 3.5 GHz transmitters, weak emissions from distant 5G base stations—potentially reaching the area under favorable propagation conditions such as LOS—may have contributed marginally to the measured field. Together, these factors may explain the minor, yet detectable, presence of 5G signals in this band.
3.2. Distance-Based Analysis Results of EMFs from 5G BS
Figure 5 presents scatterplots of the RMS values of the electric field (log10(E)) recorded in the 5G 3.5 GHz band versus the average distance (log10(distance)) to the five closest BS, covering the urban regions of Attica and Central Macedonia, as well as the suburban region of Attica. The closest horizontal distance of a spot measurement to the nearest 5G BS was 31 m, considering all three regions. The corresponding farthest distance was 777 m, considering the fifth closest BS from the spots. It is worth noting that in the 3.5 GHz band, over 95% of the measurements fell below 0.4 V/m across all the environments.
The above graphs also include linear regression lines to highlight the negative slope, suggesting that increased distance correlates with lower electric field strength. Additionally,
Table 3 presents Spearman’s correlation coefficients for the measurements and the nth closest BS (n = 1, 2, 3, 4, 5). The negative coefficients further confirm that as the distance to the nearest BS increases, the recorded electric field measurements decrease. It is worth noting that the highest negative correlation coefficient was found in the urban area of Central Macedonia. In this region, we cross-checked and adjusted the publicly available data on BS locations by using up-to-date imagery from Google Street View. For instances where BS were not visible due to outdated images or other factors, we performed on-site visits to accurately document their positions. In the other two regions, discrepancies in the registered BS locations led to lower correlation coefficients.
4. Discussion
Although our analysis was based on spot measurements, which have inherent limitations in capturing temporal variations, they still provide practical and informative records of EMF levels across different environments. Such measurements are particularly valuable for assessing conformity with national exposure limits, identifying spatial exposure patterns, and determining the dominant contributing technologies across varying urban densities. While this study focused on idle traffic conditions, it is important to note that 5G systems employ advanced technologies such as beamforming and massive MIMO, which introduce directional and time-varying exposure characteristics. These effects become more pronounced during periods of active user transmission. As highlighted by Aerts et al. [
23], real-world 5G NR exposure levels can vary significantly depending on factors such as beam direction, user location, and network traffic load.
In the first part of our study, we demonstrated that EMF measurements were higher in the urban areas than in the suburban areas, consistent with findings from previous research in Greece [
3,
13]. This difference likely arose from the lower population density and reduced number of BS in the suburban areas. Consequently, EMF contributions in the suburban areas were less dominated by cellular networks. In contrast, in the two urban areas, the contribution from cellular frequencies was clearly higher than that from other wireless applications. The largest contribution to cellular frequency exposure originated from 4G networks across all the areas, indicating that these networks were predominantly utilized compared to other cellular technologies at the time the measurements were conducted. The low 5G EMF levels measured in Greece without generating user traffic are consistent with recent European studies that have evaluated baseline exposure under similar non-traffic conditions in the same frequency bands. The French spectrum regulator ANFR conducted extensive measurements across 1062 operational 5G sites in the 3.5 GHz band and reported that, under idle conditions, the mean electric field strength was only 0.11 V/m [
24]. Prior to 5G activation, this band exhibited only residual background levels averaging 0.02 V/m, highlighting the negligible contribution of 5G to ambient exposure in the absence of user activity. Likewise, Veludo et al. found that the 3.5 GHz 5G NR band contributed negligibly to the overall exposure in the non-user scenario, becoming a dominant source only during active downlink transmission [
25].
Exploring how the recorded electric field around the 3.5 GHz band changes with distance from BS, we generally observed that greater distance was associated with a decrease in electric field levels, though this trend was not uniformly consistent. Variability in the results can be attributed to additional influential factors such as LOS or NLOS conditions, variations in antenna power and gain, and surrounding built environments. Each of these factors significantly impacts the electric field at any given location. In AI models designed to predict EMF levels, the distance to the BS is treated as a standalone feature. The complexity that other parameters, such as LOS conditions or building density, add is addressed as separate features. Despite this, demonstrating a general inverse relationship between distance and the electric field, specifically for 5G frequencies, underscores the relevance of distance as a reliable predictive feature. This insight is especially valuable as it supports the integration of distance as a core input for AI-based EMF prediction models, contributing to their accuracy in 5G EMF exposure assessments. In the context of this study, such models are primarily intended for spatial prediction, estimating EMF levels at unmeasured locations based on features such as distance from BS, BS technical specifications, and urban morphology (e.g., built area).
5. Conclusions
This study presents a descriptive statistical analysis of electric field measurements in four different regions in Greece, focusing on both the existing cellular networks and the emerging 5G technology. The findings reveal that electric field levels vary considerably across different environments, with urban areas exhibiting higher values due to greater population density and a higher concentration of BS. Cellular networks, especially 4G, contribute significantly to the overall electric field levels, whereas the 5G network shows only a minor contribution. Recording the electric field at the 3.5 GHz band without generating data traffic and examining its correlation with distance from BS, we observed that, in general, as distance increased, the recorded electric field decreased. Our results confirm that distance from BS antennas should be included as a predictive feature in AI models for EMF levels, not only for 2G, 3G, and 4G networks, but also for 5G. This finding highlights the enduring significance of distance as a key factor for accurately predicting EMF levels in the 5G band, where its influence on field strength is clearly observed.
Author Contributions
Conceptualization, A.M. and M.C.; methodology, A.M., M.C., E.K., and T.S.; software, A.M. and S.D.; validation, S.D., N.P., and E.K.; formal analysis, A.M.; investigation, A.M., M.C., and E.K.; resources, S.D., N.P., and T.S.; data curation, S.D. and N.P.; writing—original draft preparation, A.M.; writing—review and editing, A.M., M.C., E.K., and T.S.; visualization, A.M., M.C., and N.P.; supervision, E.K. and T.S.; project administration, T.S.; funding acquisition, T.S. All authors have read and agreed to the published version of the manuscript.
Funding
Funding for this research was provided by the European Union’s Horizon Europe Framework Programme under grant agreement number 101057622 (SEAWave Project).
Data Availability Statement
The data presented in this study are available upon request from the corresponding author due to the data being part of the SEAWave project with restrictions, and will be published in a public repository after the completion of the project.
Conflicts of Interest
The authors declare no conflicts of interest. The funders had no role in any aspect of the study.
Abbreviations
The following abbreviations are used in this manuscript:
| AI | Artificial intelligence |
| BS | Base station |
| BSA | Base station antenna |
| EMF | Electromagnetic field |
| ICNIRP | International Commission on Non-Ionizing Radiation Protection |
| LOS | Line-of-sight |
| MIMO | Multiple-input and multiple-output |
| NLOS | Non-line-of-sight |
| NOEF | National Observatory of Electromagnetic Fields |
| POIs | Points of interest |
| SCA | Small cell antenna |
| SSB | Synchronization signal block |
References
- Gerli, P. Municipal 5G bans during the COVID-19 pandemic: The case of Italy. Digit. Policy Regul. Gov. 2021, 23, 553–573. [Google Scholar] [CrossRef]
- Manassas, A.; Apostolidis, C.; Iakovidis, S.; Babas, D.; Samaras, T. A study of the long-term changes in the electromagnetic environment using data from continuous monitoring sensors in Greece. Sci. Rep. 2023, 13, 13784. [Google Scholar] [CrossRef] [PubMed]
- Christopoulou, M.I.; Kyritsi, T.; Yalofas, A.; Koutounidis, D.; Karabetsos, E. 5G NR launching in Greece: Preliminary in situ and monitoring network measurements of electromagnetic fields exposure levels at rooftops. Bioelectromagnetics 2024, 45, 193–199. [Google Scholar] [CrossRef] [PubMed]
- Dreifuerst, R.M.; Heath, R.W. Massive MIMO in 5G: How beamforming, codebooks, and feedback enable larger arrays. IEEE Commun. Mag. 2023, 61, 18–23. [Google Scholar] [CrossRef]
- International Electrotechnical Commission (IEC). IEC 62232:2022 Determination of RF Field Strength, Power Density and SAR in the Vicinity of Base Stations for the Purpose of Evaluating Human Exposure; IEC: Geneva, Switzerland, 2022. [Google Scholar]
- McKnight, P.E.; Najab, J. Kruskal-Wallis test. In The Corsini Encyclopedia of Psychology, 4th ed.; Weiner, I.B., Craighead, W.E., Eds.; Wiley: Hoboken, NJ, USA, 2010. [Google Scholar] [CrossRef]
- Sarkar, T.K.; Ji, Z.; Kim, K.; Medouri, A.; Salazar-Palma, M. A survey of various propagation models for mobile communication. IEEE Antennas Propag. Mag. 2003, 45, 51–82. [Google Scholar] [CrossRef]
- Wang, S.; Wiart, J. Sensor-aided EMF exposure assessments in an urban environment using artificial neural networks. Int. J. Environ. Res. Public Health 2020, 17, 3052. [Google Scholar] [CrossRef] [PubMed]
- Chikha, W.B.; Wang, S.; Wiart, J. An extrapolation approach for RF-EMF exposure prediction in an urban area using artificial neural networks. IEEE Access 2023, 11, 52686–52694. [Google Scholar] [CrossRef]
- Narda Safety Test Solutions. SRM-3006 Selective Radiation Meter Operating Manual; Narda Safety Test Solutions GmbH: Pfullingen, Germany, 2022. [Google Scholar]
- Karastergios, I.; Gialofas, A.; Karabetsos, E. National observatory of electromagnetic fields: National telemetric network for the measurement of high-frequency electromagnetic fields in Greece. Radiat. Prot. Dosim. 2020, 188, 413–423. [Google Scholar] [CrossRef] [PubMed]
- Antenna Construction Information Portal. Hellenic Telecommunications and Post Commission (EETT). Available online: https://keraies.eett.gr/ (accessed on 19 February 2025).
- Manassas, A.; Boursianis, A.; Samaras, T.; Sahalos, J.N. Continuous electromagnetic radiation monitoring in the environment: Analysis of the results in Greece. Radiat. Prot. Dosim. 2012, 151, 437–442. [Google Scholar] [CrossRef] [PubMed]
- Friis, H.T. A note on a simple transmission formula. Proc. IRE 1946, 34, 254–256. [Google Scholar] [CrossRef]
- Hata, M. Empirical formula for propagation loss in land mobile radio services. IEEE Trans. Veh. Technol. 1980, 29, 317–325. [Google Scholar] [CrossRef]
- Correia, L.M. A view of the COST 231-Bertoni-Ikegami model. In Proceedings of the 3rd European Conference on Antennas and Propagation, Berlin, Germany, 23–27 March 2009; IEEE: Piscataway, NJ, USA, 2009; pp. 1681–1685. [Google Scholar] [CrossRef]
- Sotiroudis, S.P.; Goudos, S.K.; Siakavara, K. Deep learning for radio propagation: Using image-driven regression to estimate path loss in urban areas. ICT Express 2020, 6, 160–165. [Google Scholar] [CrossRef]
- Hamiti, E.; Ibrani, M.; Ahma, L.; Shala, V.; Halili, R. Comparative analysis of electromagnetic field exposure levels and determination of the minimum safe distances from mobile-phone base stations in urban areas. Prog. Electromagn. Res. M 2016, 50, 117–128. [Google Scholar] [CrossRef]
- QGIS Development Team. QGIS Geographic Information System; Open Source Geospatial Foundation Project. 2024. Available online: https://www.taylorfrancis.com/chapters/mono/10.1201/b19044-18/geographic-information-system-introduction-qgis-samantha-lavender-andrew-lavender (accessed on 19 February 2025).
- De Winter, J.C.; Gosling, S.D.; Potter, J. Comparing the pearson and spearman correlation coefficients across distributions and sample sizes: A tutorial using simulations and empirical data. Psychol. Methods 2016, 21, 273. [Google Scholar] [CrossRef] [PubMed]
- International Commission on Non-Ionizing Radiation Protection. Guidelines for limiting exposure to electromagnetic fields (100 kHz to 300 GHz). Health Phys. 2020, 118, 483–524. [Google Scholar] [CrossRef] [PubMed]
- The Government Gazette. Law No. 4070/2012 Regulating matters on electronic communications, transport, public works, and other provisions. In Efimeris tis Kyverniseos; The Government Gazette: Athens, Greece, 2012; pp. 2131–2264.
- Aerts, S.; Deprez, K.; Colombi, D.; Van den Bossche, M.; Verloock, L.; Martens, L.; Törnevik, C.; Joseph, W. In situ assessment of 5G NR massive MIMO base station exposure in a commercial network in Bern, Switzerland. Appl. Sci. 2021, 11, 3592. [Google Scholar] [CrossRef]
- de l’Anses, A. Exposition aux Champs Électromagnétiques Liée au Déploiement de la Technologie «5G». 2021. Available online: https://www.anfr.fr (accessed on 27 February 2025).
- Veludo, A.F.; Stroobandt, B.; Van Bladel, H.; Sandoval-Diez, N.; Guxens, M.; Joseph, W.; Röösli, M. Exploring RF-EMF levels in Swiss microenvironments: An evaluation of environmental and auto-induced downlink and uplink exposure in the era of 5G. Environ. Res. 2025, 266, 120550. [Google Scholar] [CrossRef] [PubMed]
| Disclaimer/Publisher’s Note: The statements, opinions and data contained in all publications are solely those of the individual author(s) and contributor(s) and not of MDPI and/or the editor(s). MDPI and/or the editor(s) disclaim responsibility for any injury to people or property resulting from any ideas, methods, instructions or products referred to in the content. |
© 2025 by the authors. Licensee MDPI, Basel, Switzerland. This article is an open access article distributed under the terms and conditions of the Creative Commons Attribution (CC BY) license (https://creativecommons.org/licenses/by/4.0/).


 ,
, 


