Abstract
The electrocardiogram (ECG) is one of the vital physiological signals for human health. Lightweight neural network (NN) models integrated into a low-resource wearable device can benefit the user with a low-power, real-time edge computing system for continuous and daily monitoring. This work introduces a novel edge-computing wearable device for real-time beat-by-beat ECG arrhythmia classification. The proposed wearable integrates the light AI model into a 32-bit ARM® Cortex™-based custom printed circuit board (PCB). The work analyzes the performance of artificial neural network (ANN), convolutional neural network (CNN), and long short-term memory (LSTM) models for real-time wearable implementation. The wearable is capable of real-time QRS detection and feature extraction from raw ECG data. The QRS detection algorithm offers high reliability with a 99.5% F1 score and R-peak position error (RPE) of 6.3 ms for R-peak-to-R-peak intervals. The proposed method implements a combination of top time series, spectral, and signal-specific features for model development. Lightweight, pretrained models are deployed on the custom wearable and evaluated in real time using mock data from the MIT-BIH dataset. We propose an LSTM model that provides efficient performance over accuracy, inference latency, and memory consumption. The proposed model offers 98.1% accuracy, with 98.2% sensitivity and 99.5% specificity while testing in real time on the wearable. Real-time inferencing takes 20 ms, and the device consumes as low as 5.9 mA of power. The proposed method achieves efficient performance in real-time testing, which indicates the wearable can be effectively used for real-time continuous arrhythmia detection.
1. Introduction
Cardiac signals are vital indicators of the heart’s electrical activity and rhythm, aiding in the diagnosis of cardiovascular diseases (CVDs). An accurate electrocardiogram (ECG) analysis allows the early detection of arrhythmias, myocardial infarction, and other abnormalities, improving patient outcomes through timely intervention [1,2]. The importance of cardiac health monitoring has grown exponentially due to the rising global prevalence of cardiovascular conditions, which remain the leading cause of death worldwide. Recent statistics underline the gravity of CVDs, revealing that nearly 18 million individuals globally succumb annually to cardiac-related ailments, accounting for approximately 32% of all global deaths [3]. In the United States alone, CVDs continue to impose a substantial health and economic burden. The American Heart Association reports nearly 655,000 annual deaths attributed directly to heart disease, making it the leading cause of mortality nationwide [4]. Furthermore, the direct medical costs of CVDs in the U.S. are projected to escalate to over USD 749 billion annually by 2035, underscoring the urgent need for effective preventative and diagnostic strategies [5]. The severity of cardiac diseases is often exacerbated by a late diagnosis, significantly impacting patients’ quality of life and healthcare expenditure. Conditions such as congestive heart failure, arrhythmias, and coronary artery diseases typically require extensive and costly medical interventions, including hospitalization, surgical procedures, and long-term medication [6,7]. Early detection through daily cardiac monitoring can substantially mitigate these costs and improve survival rates. Continuous and remote monitoring technologies facilitate the early identification of abnormal cardiac patterns, enabling proactive treatment and potentially preventing acute cardiac events [8]. Therefore, innovations in wearable and home-based cardiac monitoring systems are becoming indispensable tools in reducing disease burden and healthcare costs associated with cardiovascular conditions.
Cardiac signals reveal the heart’s electrical patterns and rhythm, crucial for diagnosing CVDs. Precise ECG interpretation enables the early detection of arrhythmias, infarctions, and other issues, improving outcomes via prompt intervention [9]. Untreated arrhythmia can lead to certain long-lasting health conditions. Traditional clinical approaches to diagnosing and monitoring arrhythmias include 12-lead ECGs, ambulatory Holter monitoring, and implantable loop recorders [10,11]. Though clinically validated, their infrequent use misses brief, asymptomatic, or sudden arrhythmias, often delaying diagnosis by weeks or months [12,13]. Moreover, traditional clinical monitors rely on bulky equipment that limits mobility and require offline data analysis. In contrast, continuous real-time ECG monitoring can uncover hidden events and reduce the risk of worsening heart conditions [14,15,16].
ECG arrhythmia detection has greatly benefited from deep neural networks, including classical artificial neural networks (ANNs), convolutional neural networks (CNNs), and recurrent models like long short-term memory (LSTM) deployed on various platforms such as mobile devices, cloud servers, and edge hardware [17,18]. Smartphone-based applications can instantly detect abnormal heartbeats as they occur, alerting patients and doctors immediately, which is crucial for conditions that are episodic or asymptomatic [19,20]. This real-time inter-patient and intra-patient computation dramatically improves continuous long-term monitoring and the likelihood of capturing sporadic arrhythmias compared to a brief in-clinic ECG. Studies have validated that deep learning approaches can achieve high accuracy in detecting arrhythmias from single-lead wearables over large patient cohorts [21,22]. In general, deploying CNN/LSTM models on personal devices allows unobtrusive 24/7 monitoring, timely intervention, and improved management of cardiac conditions outside the hospital setting, which marks a significant advantage over intermittent clinical exams. However, most of the deep neural network (DNN) models are complex and require more computational resources. As a result, both mobile and cloud-based continuous ECG signal monitoring suffer from higher power consumption and latency [23,24]. Compared to lightweight models, these heavy models tend to run the processing unit for a longer period, resulting in increased power usage. Moreover, edge computing within wearables offers privacy, better synchronization, and reliability advantages as data are processed locally on the wearable, preserving confidentiality and reducing network dependency [25,26,27].
Deploying TinyML models directly on low-resource wearable SoCs enables the real-time detection of cardiac arrhythmias with several distinct advantages over smartphone or cloud-based AI. By performing inference on-device at the sensor source, network communication delays are eliminated. Unlike cloud systems that incur transmission latency, the TinyML model results in near-instant detection and prompt arrhythmia alerts [28,29]. With true edge computing, the system is no longer dependent on continuous connectivity, allowing continuous monitoring to continue offline without requiring a phone or wireless connection. Additionally, running the AI locally on an ultra-low-power MCU removes the need for constant Bluetooth/Wi-Fi data streaming to an external device, which significantly cuts down wireless energy overhead and preserves the wearable’s battery life [30,31]. These help the system keep sensitive health data on-device to safeguard patient privacy [32]. Achieving these benefits on a low-resource microcontroller (C) unit is challenging, so model optimization techniques such as pruning, quantization, and knowledge distillation have become vital to compress and accelerate deep learning models for ultra-constrained hardware. These techniques convert floating-point parameters to lower-precision integers and eliminate unnecessary parameters with minimal impact on performance. As a result, these can substantially reduce memory and computing requirements, thereby enabling complex arrhythmia detection networks to run within the few kilobytes of RAM available on devices like wearable SoCs [33,34,35]. These benefits are achieved with low inference time and reduced model size, often with only a negligible impact on model accuracy [35,36,37,38]. However, most of the implementations have integrated the AI models into high-performance chips such as the Raspberry Pi 3 Model B+ (Raspberry Pi Foundation, Cambridge, UK), Jetson Nano Developer Kit (Nvidia, Santa Clara, CA, USA), and a field programmable gate array (FPGA)-based chip for better accuracy. These consume greater power and provide reduced battery life for a wearable device [39,40,41]. Moreover, the wearable can be heavy, which often reduces the user’s flexibility. Therefore, a practical wearable made with a low-resource C unit of a few hundred kilobytes of memory can overcome these limitations.
In this study, three NN models, ANN, CNN, and LSTM, are integrated and tested on a custom wearable. The proposed wearable integrates the pretrained NN models with the device firmware to detect five different ECG beats: normal (N), supraventricular (SV), ventricular (V), fusion (F), and unknown (Q). The model is trained in Edge Impulse Studio® and deployed as a C++ library. The custom wearable uses a 32-bit 64 MHz ARM® Cortex™ CPU and 2.4 GHz Bluetooth. The firmware is designed to capture raw ECG data for real-time processing. The device firmware can detect the QRS complex, extract features, and classify the cardiac beats in real time. The system can reliably transmit the classification result and raw data to a mobile application. The MIT-BIH dataset is used for training and testing. The study shows that an LSTM-based model integrated into the wearable can infer the cardiac beats with 98.1% accuracy. The proposed model also shows improvement in SV and V beat detection. The proposed LSTM model offers a 20 ms inferencing latency, peak RAM usage of 6.7 kB, and low power consumption at 5.9 mA.
2. Related Work
ECG morphological features play an important role in detecting abnormal cardiac beats. Several methods have been utilized to detect the QRS complex of an ECG wave. A Pan–Tompkins-based QRS detection is widely popular for its real-time implementation. The method analyzes the amplitude and slope of the cardiac signal and updates the threshold periodically [42]. Felix et al. proposed a low-complexity QRS-analyzing model with 99.6% sensitivity using a least squares parabola [43]. The use of machine learning algorithms is also available for QRS analysis. Rizwan et al. provide a technique with a discrete wavelength transform (DWT)-based support vector machine (SVM) for QRS detection [44]. Nguyen et al. offer a low-noise approach with a triangle template to match with R-peak slopes [45]. Another efficient real-time R-peak detection is proposed by Bae et al., where a pair of derivative filters is integrated into the process [46]. The work reaches a sensitivity and positivity of 99.8%. An implementation of QRS detection is shown in the mobile application platform by Neri et al. [47]. The study uses a modified Pan–Tompkins approach to detect the R peaks. Most of the studies use the MIT-BIH Arrhythmia database for validation of R peak detection [48]. Habibi et al. propose another real-time QRS detection that provides 99.69% and 99.60% of sensitivity and positive predictivity, respectively, upon validation with the MIT-BIH dataset [49]. The real-time QRS detection integrated into low-resource wearables can be used for further cardiac beat classification and analysis [50,51,52].
Arrhythmia classification using machine learning (ML) models has been an effective method [53]. Acharya et al. developed a nine-layer CNN model to classify five arrhythmia beats [54]. The work offered an overall accuracy of 94.3% while tested offline on a PC. To overcome the issues with the MIT-BIH imbalance dataset, a dynamic class weighting can be implemented. Huang et al. proposed a dynamic weighting process that updated the loss weights within each training cycle [55]. The model improved the accuracy for minority classes, providing an overall accuracy of ~98%. Although offline methods can offer in-depth classification and enhanced accuracy, such models can be bulky and complex for low-resource C devices, limiting their ability to be integrated into real-time wearable devices. These indicate the importance of lightweight models that can easily fit within resource-constrained platforms.
Model quantization, pruning, and distillation techniques can offer an optimized model for low-resource C devices. Ribeiro et al. implement an eight-bit quantized CNN model that performs the arrhythmia classification on a mobile application platform [56]. The quantization process reduces model size to only 93 kB and inference latency to 7.65 ms. However, high-power chips from mobile devices also suffer from more energy consumption, which affects the long-term signal monitoring. Kim et al. propose a wearable device that incorporates a lightweight CNN model for real-time beat classification with an overall accuracy of 87.1% [57]. Sabor et al. propose another C-based compact CNN model that classifies 8 s chunks of ECG signals [52]. The model consumes ~50 kB of memory and feeds a raw ECG signal with the previous R-R interval as the input features. More complex models, e.g., recurrent LSTM models, are becoming popular in beat classification on resource-constrained chips. Katsaouni et al. propose a spiking neural network (SNN) architecture implemented on an ARM® A53 chip [58]. Another example of complex model integration into constraint environments is a transformer model run on a Gap9 processor for arrhythmia classification [59]. Falaschetti et al. show a recursive neural network (RNN)-based LSTM model deployed on an ARM® M4 chip for real-time classification [60]. Jeong et al. present a squeeze-and-excitation-block-based ResNet (SE-RESNET) adversarial learning on inter-patient ECG variability for arrhythmia classification [61]. Huang et al. propose an energy-aware neural architecture search (NAS) framework for arrhythmia classification by a distributed IoT [62]. The work offers an energy-efficient search and partitioning approach on ARM Cortex-M series chips for multiclass arrhythmia detection. Although complex models yield better accuracy, they often require more power or computational latency. Moreover, most of the works lack real-time morphological feature extraction and integration into the DNN input layer.
This work proposes a novel LSTM model integrated into a custom wearable for arrhythmia classification. The method incorporates a novel feature set combining time series, spectra, and morphological features of ECG. The wearable uses a combination of two mutex buffers, each storing 10 s of ECG chunk for feature extraction and classification. The wearable is capable of preprocessing and feature extraction in real time. Finally, the tiny LSTM model is run on-device to provide real-time classification. The hardware platform is analyzed for ANN, CNN, and LSTM-based DNN models. The system performance is measured in terms of latency, power, and memory consumption and compared with existing low-resource edge-computing-enabled wearables.
3. Materials and Methods
The wearable system incorporates an on-chip LSTM model for ECG beat classification. Figure 1 presents the overall system for the proposed method. The custom wearable contains an ECG analog front end (AFE) and is capable of classifying beats in real time. The firmware of the wearable includes preprocessing, feature extraction, and beat classification stages. In the preprocessing stage, each peak is detected for beat segmentation. The corresponding beats are further processed for feature extraction. Extracted features are fed into the NN model for beat-by-beat classification. The wearable can also transmit raw ECG and beat classification results via Bluetooth Low Energy (BLE) to a mobile application.
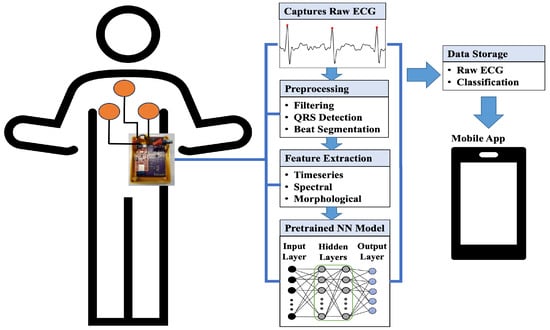
Figure 1.
Overall system for the proposed wearable device.
The hardware part contains an AFE circuit for ECG. The main component of the AFE is an AD8232-based (Analog Devices, Wilmington, MA, USA) instrumentation amplifier. The lead II ECG can be captured by placing electrodes around the chest area. The AFE circuit provides ECG filtering (0.5 Hz–41 Hz) and an amplification of 1100 (V/V) [63]. The wearable can capture cardiac data in practical scenarios from diverse participant groups [64]. The processing unit of the wearable contains a 32-bit 64 MHz ARM® Cortex™ M4 CPU and a 2.4 GHz Bluetooth radio. The system also contains a Lithium Polyimide (Lipo) rechargeable battery chip, MCP 73831 IC (Microchip Technology, Chandler, AZ, USA). The wearable is powered by a Lipo battery (Pkcell LP552530) of 350 mAhr and 3.7 V capacity. The BLE data speed is set to 1 Mbps for efficient and reliable data transmission.
Figure 2 depicts the overall framework of the proposed classification system. The dataset was divided into 60%/20%/20% for training, validation, and test sets, respectively. The model was trained under Edge Impulse Studio®. For training, each NN frame size was set to 0.5 s of ECG data, corresponding to 180 samples for a 360 Hz sampling rate. The features were extracted for each beat and then passed into the classifier network. Three types of DNN models, ANN, CNN, and LSTM models, were tested for the proposed framework. At the end of training, the model was deployed as a C++ library. The C++ library contained all the source code and headers for the classification model. The library was integrated into the BLE chip. Each model training consisted of 50 epochs of training, along with a batch size of 32 and a learning rate of 0.005. An Adam optimizer was used with a learning rate of 0.005 and 1st- and 2nd-moment decay rate of 0.9 and 0.999, respectively. For model testing, the MIT-BIH test dataset was fed as mock data into the wearable device and tested in real time. The pretrained model was evaluated on a set of 21,892 previously unseen heartbeats. The test dataset was partitioned into arrays of 600 beats. Each of the 600 beat arrays was stored in the firmware to test the model’s performance. In total, the test dataset was segmented into 37 arrays to complete the model testing. An ECG block of 10 s was taken for the R peak detection. Upon detecting R peaks, a beat segmentation window of 0.5 s was selected for feature extraction and classification. The 0.5 s window centered on the detected R peak point and traversed 0.25 s forward and backward from the R peak.
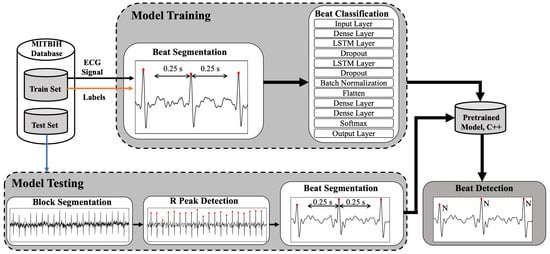
Figure 2.
Framework for the proposed arrhythmia classification.
3.1. Database
The MIT-BIH arrhythmia dataset was used to develop the pretrained classification models [48]. The dataset contains 48 records of ECG from 47 subjects. The dataset comes with beat-by-beat annotation for 15 types of arrhythmias.
Moreover, standard five-class labels are provided by the Association of the Advancement of Medical Instrumentation (AAMI). The dataset offers a substantial quantity of time series data that is suitable for DNN models. Our work incorporated the lead II ECG from the MIT-BIH dataset. The dataset was segmented into a total of 109,494 beats, and the data processing followed the 360 Hz sampling rate. Table 1 provides the mapping of the AAMI standard over the MIT-BIH dataset. The pretrained model classified the beats into one of the five classes: normal (N), supraventricular (SV), ventricular (V), fusion (F), and unknown (Q) beats.

Table 1.
Description of AAMI standard beat classes.
3.2. Firmware Processing
The firmware design mainly has three parts: preprocessing, feature extraction, and classification. The mutex buffer technique is implemented in the firmware to ensure continuous data storage in real time. Each buffer can hold 10 s of ECG data. Once the buffer is full, it moves forward to the data processing stages. In the meantime, the alternative buffer keeps storing the incoming data. A buffer becomes free once the corresponding BLE transmission finishes. Figure 3 provides the flowchart for the overall firmware processing.
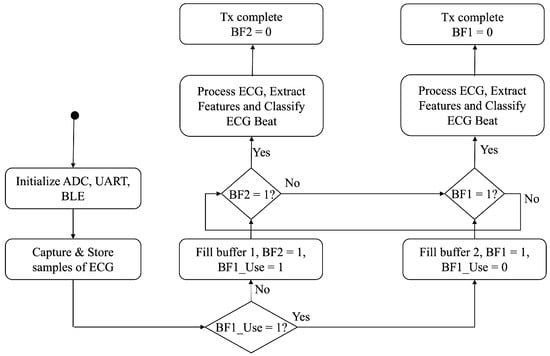
Figure 3.
Flow chart of the firmware processing.
3.2.1. Preprocessing
The data preprocessing stage starts with a band-pass filter applied to the raw ECG signal. The filter has a cutoff frequency range from 2 Hz to 26 Hz, as most of the ECG power lies within that spectrum. The band-pass-filtered signal is further smoothed by a moving window filter of window size 21. The cleaned ECG data are then processed for beat detection.
3.2.2. R-Peak Detection
An adaptive threshold-based R-peak detection algorithm is applied to the smoothed ECG signal. The method follows the Pan–Tompkins approach. Figure 4 shows the signal processing blocks for QRS complex detection. The process involves a differentiator filter, the square of the signal, and a moving integrator. The R-peak threshold changes adaptively as shown by (1)–(3).
where and are the running signal and noise peaks, respectively. is the kth candidate peak in the moving window integrated signal. Both and are updated by blending a fraction, (0.12), of the new peak. The threshold is updated by (3), based on the signal and noise levels and by using the factor (0.2), which controls how far above the noise floor we require a peak to be before calling it an R peak. Any peak is taken as an R peak if it is above the running threshold, followed by (4) and (5),
where is the moving-window-integrated signal. A refractory period of 200 ms is maintained while searching for the R peaks. The P and T peaks are captured in a similar manner. The P peak is searched a minimum of 60 ms before the R peak index. The T-wave peak is identified by searching for the maximum at least 350 ms after the R-wave. The corresponding equations for P and T-wave detection is given by (6) and (7), respectively:
where is the smoothed ECG signal, and and are only updated if there exists a peak greater than the mean value. Otherwise, there is no P and T peak detected. The process changes dynamically with respect to the changes in signal level.
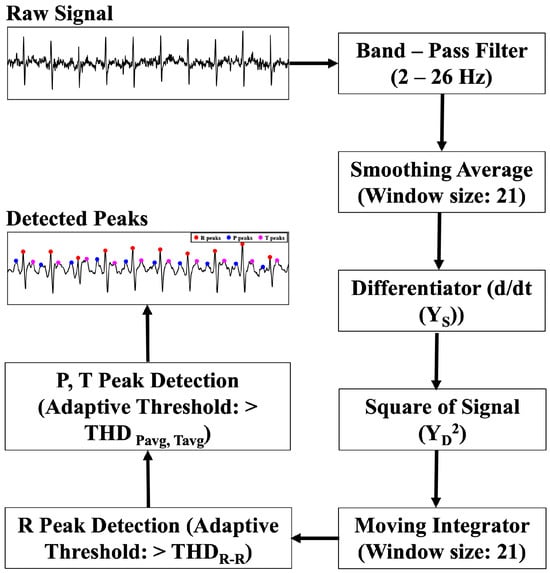
Figure 4.
Block diagram of the proposed QRS detection algorithm.
3.2.3. Feature Extraction
To extract morphological features, the R peak detection algorithm is utilized to capture the ECG signal-specific data. A list of feature sets is provided in Table 2.
Table 2.
List of extracted features.
Ten morphological features include the ECG peaks and corresponding intervals. These signal-specific features provide better knowledge to the deep learning models. In addition, five separate time series and spectral features are also fed into the models. The time series features include the mean, root mean square (RMS), standard deviation (SD), kurtosis, and skewness, given by (8)–(12).
The spectral features are calculated by taking a discrete Fourier transform (DFT) on the time series data as shown in (13). The corresponding spectral power (PS) is calculated for three different frequency bands: 2–4 Hz, 4–6 Hz, and 6–8 Hz. The spectral power in each band is calculated by utilizing Equations (14) and (15). Moreover, skewness and kurtosis are calculated in the frequency domain by (18) and (19).
Figure 5 presents the signal processing steps for time series and spectral feature extraction methods. The smoothed signal is decimated by a factor of 3 before applying the DFT. A 128-point DFT analysis is conducted over the decimated signal to calculate spectral powers for separate frequency bands. The process follows similar steps to those used in Edge Impulse Studio® during training.
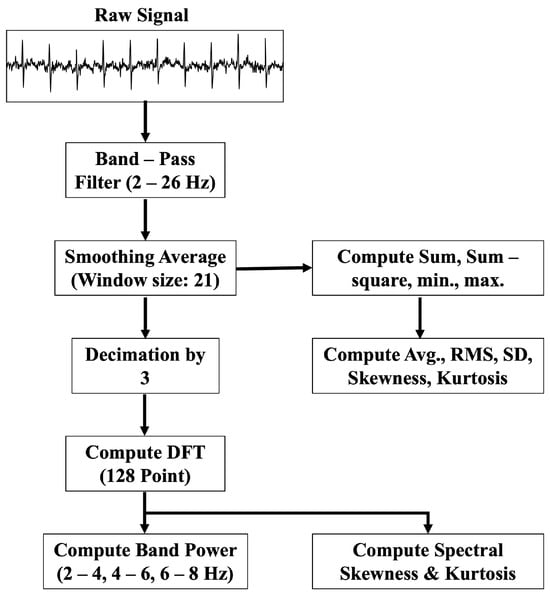
Figure 5.
Block diagram of the proposed time series and spectral feature extraction algorithm.
3.2.4. DNN Architecture
Three deep learning models were used for training and testing: ANN, CNN, and LSTM. Figure 6 shows the NN architecture for each model. The ANN model includes five successive fully connected dense layers (D), each with a ReLU activation, progressively learning higher-level combinations of the inputs. The input layer takes 20 features as input. The softmax layer transforms the network’s final activation values into a probability distribution across the target classes. The output layer provides the classification results into the five AAMI classes.
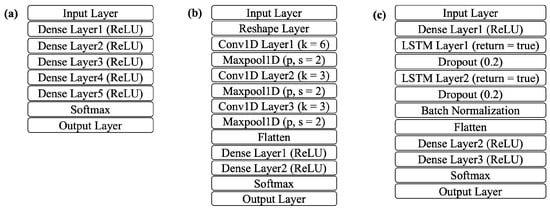
Figure 6.
NN architecture: (a) ANN, (b) CNN, (c) LSTM.
The CNN model adds three 1D convolutional layers (CL), each with a different filter size and width. The corresponding 1D maxpool layer downsamples by a factor of 2. A flatten layer follows to merge the pooled feature maps into a single vector. Two more dense layers are also added before the final classification. In the LSTM architecture, two stacked LSTM layers (LS) are employed, with dense layers placed both before and after them. LSTM layer 1 (LS1) captures forward dependencies and exposes the full sequence for the next layer. LSTM layer 2 (LS2) aggregates the sequence into a single vector. Both of the layers add a dropout layer for regularization. Table 3 presents how each model differs in layer depth and the number of units per layer. The abbreviation terms A, C, and L represent the different ANN, CNN, and LSTM model architectures, respectively.
Table 3.
ANN, CNN, and LSTM model architectures.
4. Results
The pretrained DNN models were integrated into the firmware of the wearable device. The processing of the QRS complex from raw ECG is shown in Figure 7. Raw ECG signals were band-pass-filtered (2–26 Hz) and smoothed. Figure 7e denotes the detected R, P, and T peaks from the cardiac signal. The band-pass filter removed the baseline wander and improved the signal-to-noise ratio (SNR).
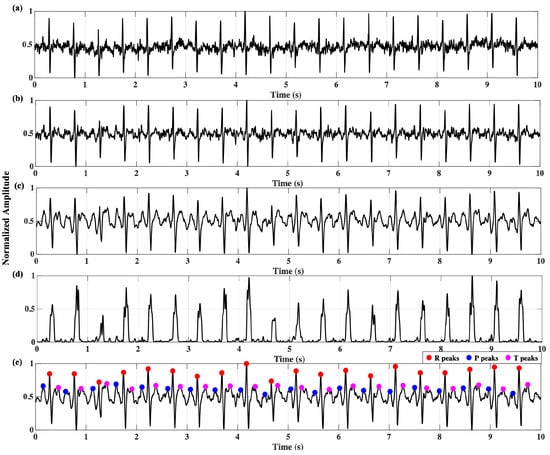
Figure 7.
ECG QRS processing: (a) raw signal, (b) band-pass-filtered signal, (c) smoothed signal, (d) moving window integration, (e) R-, P-, T-peak detection.
The performance of the R-peak detection process was validated by comparing the MIT-BIH dataset over 48 records. The MIT-BIH dataset provides the annotation for each R peak. For every record, the detected peaks are listed with true positive (TP), false positive (FP), and false negative (FN) values, respectively. Table 4 provides the F1 score, precision (Pr), and sensitivity (Sn) for each of the 48 records. To measure the overall timing performance, the R-peak position error (RPE) and the standard deviation of RR intervals (SDRR) were calculated for each record. As given by (20), the RPERMS denotes the root mean square of the RPE, calculated by the timing difference between the annotated peak (AP) and the detected peak (DP). The SDRR is the standard deviation of all RR intervals for each record, given by (21). As depicted in Table 4, the proposed QRS detection algorithm detected 109,123 R peaks correctly out of 109,494 total actual beats. The obtained sensitivity was 99.7%. To measure the timing performance, RPERMS and SDRR were determined, yielding 6.31 ms and 10.69 ms, respectively.
Table 4.
MIT-BIH QRS detection and timing performance for each record.
Figure 8 presents the performance of the real-time time series feature extraction block. The raw ECG data were preprocessed with the filtering stages and passed to the feature extraction block. To measure the effectiveness of the feature extraction performance, the extracted features from the proposed method were compared to the reference values. The reference values were the extracted features from Edge Impulse Studio®. The studio provided the beat-by-beat extracted feature data for both training and testing sets. In total, the feature sets were compared for 109,494 ECG beats. As shown in Figure 8, the proposed extracted time series features correlated strongly with the reference values. The correlation coefficient (R2) of the mean, root mean square (RMS), and standard deviation (SD) was 0.99, whereas the R2 value of 0.98 slightly differed for kurtosis and skewness. Overall, the time series feature extraction block showed effective and reliable performance and could be integrated into the input layer of the DNN model.
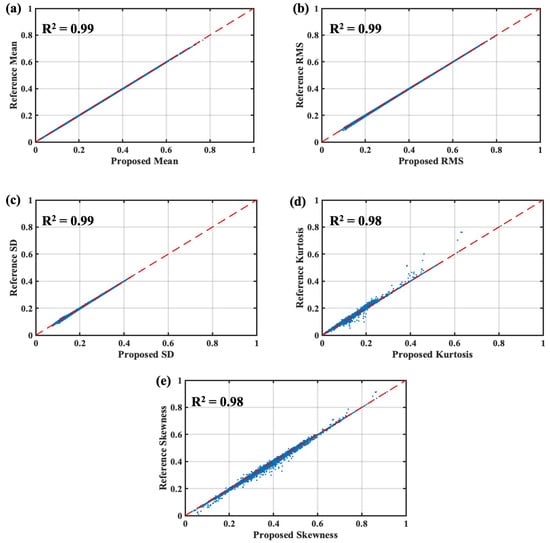
Figure 8.
Performance of the proposed real-time time series feature extraction algorithm: (a) mean, (b) RMS, (c) SD, (d) kurtosis, (e) skewness.
The spectral features were also extracted in real time, and the proposed method was validated against the reference values from Edge Impulse Studio®. The R2 values varied from 0.92 to 0.94 for spectral power values over 2–4 Hz, 4–6 Hz, and 6–8 Hz as presented in Figure 9. These frequency ranges were chosen as most of the ECG signal power lies within those ranges. The proposed algorithm offered good correlation with the power spectral features. The ECG spectral kurtosis provided the lowest correlation of 0.83. The lower correlation could be caused by the differences in the implementation of the filter functions.
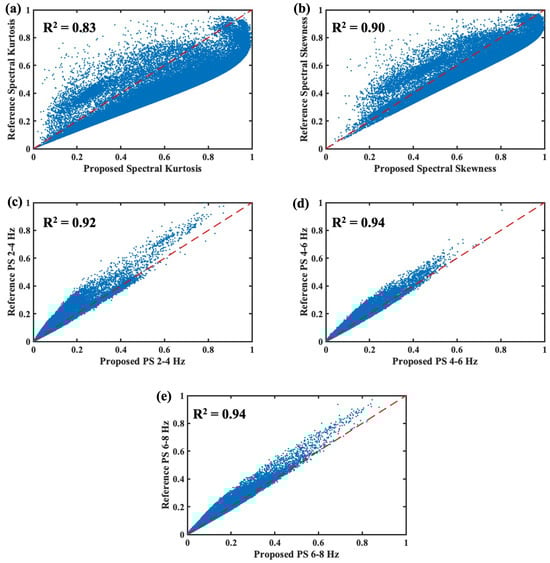
Figure 9.
Performance of the proposed real-time spectral feature extraction algorithm: (a) spectral kurtosis, (b) spectral skewness, (c) PS 2–4 Hz, (d) PS 4–6 Hz, (e) PS 6–8 Hz.
Figure 10 presents the performance comparison of the pretrained DNN models for the MIT-BIH test dataset. The test data were embedded as mock data into the wearable device for that performance analysis. The test performance values were analyzed for different feature combinations: time series, spectral, and combined features. Four performance metrics, F1 score, precision, sensitivity, and accuracy, were compared to determine the optimized model. The model numbers correspond to the description provided in Table 3. Figure 10a depicts the ANN performance for time series, spectral, and combined features. As the ANN model size increased, the model test performance improved for spectral feature sets compared to time series and combined feature sets. Similarly, for the CNN model, both spectral and combined feature sets tended to offer better performance over time-series-based features as shown in Figure 10b. The CNN model outperformed the ANN model in terms of classifying the ECG beats. Overall, the LSTM models gave the best performance as the model size increased. As shown in Figure 10c, the LSTM models with combined features provided the best performance metrics.
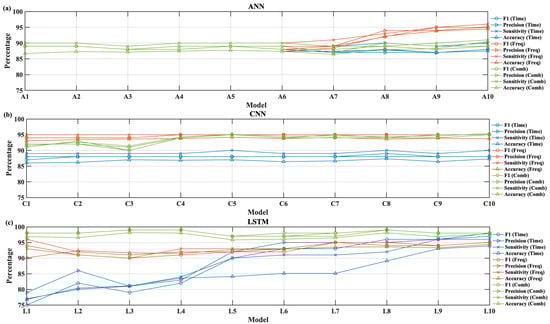
Figure 10.
Performance of accuracy, precision, sensitivity, and F1 score for different feature sets: (a) ANN, (b) CNN, (c) LSTM.
The performance of the real-time wearable system was also validated over two major metrics: latency and memory consumption. Figure 11 presents these performance metrics for different feature-based DNN models. The metrics were calculated using a real-time analysis of the mock test dataset from the firmware. Figure 11a depicts the ANN model performance for different feature sets. The ANN model offered an inference latency between 3 and 5 ms when tested. Among all three DNN models, the ANN offered the lowest memory consumption. Similarly, Figure 11b presents the CNN model performance. The CNN models offered a range of latencies between 3 and 10 ms for all types of feature sets. The CNN models tended to consume between 2 and 11 kB of memory as the model size increased. Figure 11c shows the LSTM model performance where the model’s inference latency varied in a range from 5 to 36 ms. The memory consumption was well within the range of 5 to 10 kB. Approximately 178 kB of RAM was dedicated to the complete real-time ECG processing stack, including peripheral drivers, data buffers, and the embedded TinyML model.
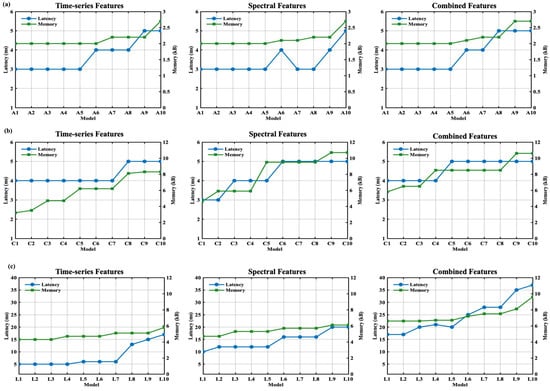
Figure 11.
Performance of the beat classification latency and memory consumption for time series, spectral, and combined features for (a) ANN, (b) CNN, (c) LSTM.
The optimized models were calculated by using a Pareto analysis over all models as depicted in Figure 12. To find the optimized models, three performance comparisons were carried out for all DNN models: accuracy vs. latency, accuracy vs. memory, and memory vs. latency. The cost function was set according to the resources available in the wearable device. For the accuracy cost function, a threshold of 96% accuracy was set. For latency, a threshold of 50 ms was set; beat-by-beat ECG detection could reliably wrap around that time constraint. The memory consumption threshold was set to 40 kB, considering that the consumption fit within the actual RAM size of 256 kB. As shown in Figure 12, the LSTM models were mostly common in all three Pareto sets. The LSTM model offered better accuracy compared to ANN and CNN models and fit well within the memory and time constraints. By capturing the intricate temporal dependencies in ECG signals over extended sequences, the LSTM could detect the subtle waveform variations critical for achieving more accurate beat identification. The LSTM model L3 was one of the best optimized models among all DNN models. The L3 model offered 98.09% accuracy with 20 ms of inferencing latency and 6.7 kB of memory consumption.
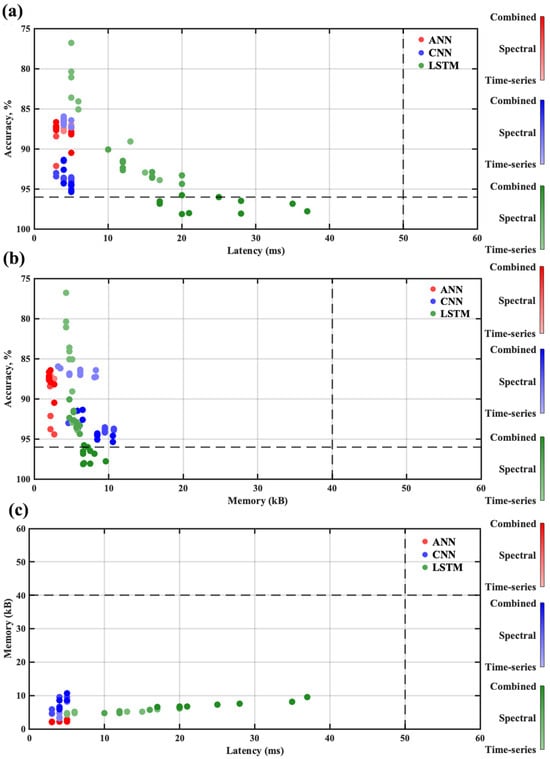
Figure 12.
Pareto optimization among 90 NN models: (a) accuracy vs. latency, (b) accuracy vs. memory, (c) memory vs. latency.
Table 5 provides the L3 model performance for the test dataset. The table provides the confusion matrix for the AAMI classes. Each row in the table represents the true classes, and the columns represent the predicted classes. For the test set, the overall accuracy of the L3 model was 98.09%. Overall, there were 21,892 ECG beats in the test dataset. The wearable could successfully detect 17,746, 516, 1410, 158, and 1594 beats, respectively, for the N, SV, V, F, and Q beat classes.
Table 5.
The performance metrics of the pretrained L3 model on the test dataset implemented on SoC firmware.
5. Discussion
Table 6 provides a comparison between the proposed QRS detection algorithm and existing work. As shown in the table, our proposed method obtains a 99.66% accuracy. The F1, precision, and sensitivity performance are in the range of 99%, which makes it a reliable approach. The proposed method offers an effective detection rate that is in close proximity with that of the existing literature. Furthermore, the proposed model provides superior timing performance in detecting the R peaks. The RPErms and SDRR results outperform the work by [42,50,52].
Table 6.
QRS detection and timing performance comparison.
Table 7 presents the performance of the hardware–firmware co-design for different wearable systems. The proposed method classifies into five AAMI classes, whereas four- and six-class classifications are also seen in [53,58,61]. Most of the existing work utilizes all 48 records from the MIT-BIH dataset for training and testing purposes. The quantized CNN (QCNN) models are commonly implemented in low-resource wearable devices. As shown in the table, a wide range of hardware (HW) platforms support edge computing. Different series of ARM® M4 chips are popular for lightweight model classification. An energy-efficient AI model using the NAS framework is exploited in the ARM® M4 80 MHz chip for low-power applications. The proposed wearable utilizes an ARM® M4 64 MHz chip. The achieved inferencing latency is 20 ms, which is superior to [57,60]. The low-resource chip offers an average of power consumption during active periods as low as 5.9 mA. With this power consumption, the device would last for approximately 59 h. Moreover, the overall accuracy of the system outperforms the inferencing performance by [55,56,57,58,59,60,61,62]. Because of the imbalanced dataset, certain arrhythmic beats like SV and F are less understood by the model, as fewer beats are available. In the future, we will focus on data augmentation so that the number of underrepresented arrhythmia beats increases during model training and testing.
Table 7.
Comparison of arrhythmia classification systems across hardware platforms.
6. Conclusions
A low-power QRS detection and arrhythmia classification algorithm using an LSTM model was proposed in this paper. The adaptive thresholding approach in the QRS detection algorithm offered reliable performance in detecting the R peaks. The proposed method could accurately detect 99.7% of R peaks when tested on the MIT-BIH dataset. The algorithm offered an efficient R-peak location estimation, providing an error of only 6.31 ms RPE. The work proposed a combination of time series, frequency domain, and ECG morphological features for classifying the cardiac beats into five different arrhythmia classes. A lightweight LSTM model was proposed that provided optimized performance over 90 different DNN models. The optimized model was determined by comparing the model’s accuracy, inference latency, and memory consumption over the test dataset. The proposed model offered an overall accuracy of 98.09% for beat-by-beat classification. Furthermore, the model enhanced the detection accuracy for SV and V beats that have a limited dataset. The lightweight model was integrated into a low-resource ARM® M4 chip. Because the model fit into a resource-constrained environment, it only used 17.7 mW of power and required 20 ms of inference time. These make the wearable suitable for real-time and long-term arrhythmia monitoring and classification. The current model inference takes 20 ms, which can be improved further. The footprint of the current model can be further reduced to facilitate the integration of additional external sensors into the system. The current work did not include testing on real patients. Future work will continue to integrate other cardiac datasets and more complex models with reduced latency in resource-constrained chips. We will also focus on model testing on clinical cardiac patients. Furthermore, we will work on adding multimodal sensor data to improve cardiac arrhythmia and other cardio-pulmonary disease detection.
Author Contributions
Conceptualization, M.R. and B.I.M.; methodology, M.R.; software, M.R.; validation, M.R.; formal analysis, M.R.; investigation, M.R., resources, M.R.; data curation, M.R.; writing—original draft preparation, M.R.; writing—review and editing, M.R. and B.I.M.; visualization, M.R.; supervision, B.I.M.; project administration, B.I.M.; funding acquisition, B.I.M. All authors have read and agreed to the published version of the manuscript.
Funding
This research was funded by the National Science Foundation under Grant No. 2105766.
Data Availability Statement
The data supporting the findings of this study are publicly available from the MIT-BIH Arrhythmia Database from on PhysioNet at https://www.physionet.org/content/mitdb/1.0.0/, accessed on 3 June 2025. No new data were generated during this study.
Acknowledgments
This material is based upon work supported by the National Science Foundation under Grant No. 2105766. The 3D packaging was designed by Robert Hewitt.
Conflicts of Interest
The authors declare no conflict of interest.
References
- Marrazzo, G.; Palermi, S.; Pastore, F.; Ragni, M.; Mauriello, A.; Zambrano, A.; Quaranta, G.; Manto, A.; D’Andrea, A. Enhancing st-elevation myocardial infarction diagnosis and management: The integral role of echocardiography in patients rushed to the cardiac catheterization laboratory. J. Clin. Med. 2024, 13, 1425. [Google Scholar] [CrossRef]
- Zhang, D.; Yang, S.; Yuan, X.; Zhang, P. Interpretable deep learning for automatic diagnosis of 12-lead electrocardiogram. Iscience 2021, 24, 102373. [Google Scholar] [CrossRef]
- World Health Organization. Cardiovascular diseases (CVDs). In WHO Fact Sheets; World Health Organization: Geneva, Switzerland, 2023. [Google Scholar]
- American Heart Association. Heart Disease and Stroke Statistics—2022 Update: A Report From the American Heart Association. Circulation 2022, 145, e153–e639. [Google Scholar]
- Heidenreich, P.A.; Albert, N.M.; Allen, L.A.; Bluemke, D.A.; Butler, J.; Fonarow, G.C.; Ikonomidis, J.S.; Khavjou, O.; Konstam, M.A.; Maddox, T.M.; et al. Forecasting the impact of heart failure in the united states. Circ. Heart Fail. 2013, 6, 606–619. [Google Scholar] [CrossRef]
- Virani, S.S.; Alonso, A.; Aparicio, H.J.; Benjamin, E.J.; Bittencourt, M.S.; Callaway, C.W.; Carson, A.P.; Chamberlain, A.M.; Cheng, S.; Delling, F.N.; et al. Heart disease and stroke statistics—2021 update. Circulation 2021, 143, 8. [Google Scholar] [CrossRef]
- Echouffo-Tcheugui, J.B.; Bishu, K.G.; Fonarow, G.C.; Egede, L.E. Trends in health care expenditure among us adults with heart failure: The medical expenditure panel survey 2002–2011. Am. Heart J. 2017, 186, 63–72. [Google Scholar] [CrossRef]
- Dias, D.; Cunha, J.P.S. Wearable health devices—vital sign monitoring, systems and technologies. Sensors 2018, 18, 2414. [Google Scholar] [CrossRef]
- January, C.T.; Wann, L.S.; Calkins, H.; Chen, L.Y.; Cigarroa, J.E.; Cleveland, J.C.; Ellinor, P.T.; Ezekowitz, M.D.; Field, M.E.; Furie, K.L.; et al. 2019 aha/acc/hrs focused update of the 2014 aha/acc/hrs guideline for the management of patients with atrial fibrillation. J. Am. Coll. Cardiol. 2019, 74, 104–132. [Google Scholar] [CrossRef]
- Bakker, A.; Mathijssen, H.; Huitema, M.; Kapteijns, L.; Grutters, J.; Veltkamp, M.; Keijsers, R.; Akdim, F.; van Es, H.; Peper, J.; et al. Holter monitoring and cardiac biomarkers in screening for cardiac sarcoidosis. Lung 2025, 203, 10. [Google Scholar] [CrossRef]
- Vuckovic-Filipovic, J.; Iric Cupic, V.; Davidovic, G.; Ignjatovic, V.; Ignjatovic, V.; Stankovic, I.; Simic, I.; Miloradovic, V.; Djordjevic, N. Implantable loop recorder in diagnostics of cardiac arrhythmias: The importance of drug treatment in predicting pacemaker requirement. medRxiv 2025. [Google Scholar] [CrossRef]
- Aljuaid, M.; Marashly, Q.; Al-Danaf, J.; Tawhari, I.; Barakat, M.; Barakat, R.; Zobell, B.; Cho, Y.; Chelu, M.; Marrouche, N. Smartphone ecg monitoring system helps lower emergency room and clinic visits in post–atrial fibrillation ablation patients. Clin. Med. Insights Cardiol. 2020, 14, 117954682090150. [Google Scholar] [CrossRef]
- Rothman, S.; Laughlin, J.; Seltzer, J.; Walia, J.; Baman, R.; Siouffi, S.; Sangrigoli, R.; Kowey, P. the diagnosis of cardiac arrhythmias: A prospective multi-center randomized study comparing mobile cardiac outpatient telemetry versus standard loop event monitoring. J. Cardiovasc. Electrophysiol. 2007, 18, 241–247. [Google Scholar] [CrossRef]
- Andersen, M.Ø.; Diederichsen, S.Z.; Svendsen, J.H.; Carlsen, J. Assessment of cardiac arrhythmias using long-term continuous monitoring in patients with pulmonary hypertension. Int. J. Cardiol. 2021, 334, 110–115. [Google Scholar] [CrossRef] [PubMed]
- Shang, H.; Yu, S.; Wu, Y.; Liu, X.; He, J.; Ma, M.; Zeng, X.; Jiang, N. A noninvasive hyperkalemia monitoring system for dialysis patients based on a 1D-CNN model and single-lead ECG from wearable devices. Sci. Rep. 2025, 15, 2950. [Google Scholar] [CrossRef]
- Poongodi, J.; Kavitha, K.; Sathish, S.; Lakshmana Kumar, R. Hybrid AI-Driven Bio-Inspired Wearable Sensors With Aquasense AI Technology for Multimodal Health Monitoring and Rehabilitation in Dynamic Environments. Trans. Emerg. Telecommun. Technol. 2025, 36, e70081. [Google Scholar] [CrossRef]
- Vu, T.; Petty, T.; Yakut, K.; Usman, M.; Xue, W.; Haas, F.M.; Hirsh, R.A.; Zhao, X. Real-time arrhythmia detection using convolutional neural networks. Front. Big Data 2023, 6, 1270756. [Google Scholar] [CrossRef]
- Shumba, A.T.; Montanaro, T.; Sergi, I.; Bramanti, A.; Ciccarelli, M.; Rispoli, A.; Carrizzo, A.; De Vittorio, M.; Patrono, L. Wearable Technologies and AI at the Far Edge for Chronic Heart Failure Prevention and Management: A Systematic Review and Prospects. Sensors 2023, 23, 6896. [Google Scholar] [CrossRef] [PubMed]
- Xia, Y.; Xie, Y. A Novel Wearable Electrocardiogram Classification System Using Convolutional Neural Networks and Active Learning. IEEE Access 2019, 7, 7989–8001. [Google Scholar] [CrossRef]
- Eleyan, A.; AlBoghbaish, E.; AlShatti, A.; AlSultan, A.; AlDarbi, D. RHYTHMI: A Deep Learning-Based Mobile ECG Device for Heart Disease Prediction. Appl. Syst. Innov. 2024, 7, 77. [Google Scholar] [CrossRef]
- Chen, J.; Zhang, X.; Xu, L.; de Albuquerque, V.H.C.; Wu, W. Implementing the Confidence Constraint Cloud-Edge Collaborative Computing Strategy for Ultra-Efficient Arrhythmia Monitoring. Appl. Soft Comput. 2024, 154, 111402. [Google Scholar] [CrossRef]
- Kim, E.; Kim, J.; Park, J.; Ko, H.; Kyung, Y. TinyML-Based Classification in an ECG Monitoring Embedded System. Comput. Mater. Contin. 2023, 75, 1751–1764. [Google Scholar] [CrossRef]
- Sakib, S.; Fouda, M.M.; Fadlullah, Z.M.; Nasser, N.; Alasmary, W. A proof-of-concept of ultra-edge smart iot sensor: A continuous and lightweight arrhythmia monitoring approach. IEEE Access 2021, 9, 26093–26106. [Google Scholar] [CrossRef]
- Ianculescu, M.; Constantin, V.Ș.; Gușatu, A.M.; Petrache, M.C.; Mihăescu, A.G.; Bica, O.; Alexandru, A. Enhancing Connected Health Ecosystems Through IoT-Enabled Monitoring Technologies: A Case Study of the Monit4Healthy System. Sensors 2025, 25, 2292. [Google Scholar] [CrossRef] [PubMed]
- Prajitha, C.; Sridhar, K.P.; Baskar, S. ECG diagnosis for arrhythmia detection with a cloud-based service and a wearable sensor network in a smart city environment. Front. Sustain. Cities 2022, 4, 1073486. [Google Scholar] [CrossRef]
- Choi, H.; Park, J.; Lee, J.; Sim, D. Review on spiking neural network-based ECG classification methods for low-power environments. Biomed. Eng. Lett. 2024, 14, 917–941. [Google Scholar] [CrossRef] [PubMed]
- Mone, V.; Shakhlo, F. Health data on the go: Navigating privacy concerns with wearable technologies. Leg. Inf. Manag. 2023, 23, 179–188. [Google Scholar] [CrossRef]
- Suwannaphong, T.; Jovan, F.; Craddock, I.; McConville, R. Optimising tinyml with quantization and distillation of transformer and mamba models for indoor localisation on edge devices. Sci. Rep. 2025, 15, 10081. [Google Scholar] [CrossRef]
- Hizem, M.; Bousbia, L.; Ben Dhiab, Y.; Aoueileyine, M.O.; Bouallegue, R. Reliable ecg anomaly detection on edge devices for internet of medical things applications. Sensors 2025, 25, 2496. [Google Scholar] [CrossRef]
- Saha, S.S.; Sandha, S.S.; Srivastava, M. Machine learning for microcontroller-class hardware: A review. IEEE Sens. J. 2022, 22, 21362–21390. [Google Scholar] [CrossRef]
- Sivapalan, G.; Nundy, K.; Dev, S.; Cardiff, B.; John, D. Annet: A lightweight neural network for ecg anomaly detection in iot edge sensors. IEEE Trans. Biomed. Circuits Syst. 2022, 16, 24–35. [Google Scholar] [CrossRef]
- Raje, E. Realtime anomaly detection in healthcare iot: A machine learning-driven security framework. J. Electr. Syst. 2024, 19, 192–202. [Google Scholar] [CrossRef]
- Krasteva, V.; Stoyanov, T.; Jekova, I. Implementing deep neural networks on arm-based microcontrollers: Application for ventricular fibrillation detection. Appl. Sci. 2025, 15, 1965. [Google Scholar] [CrossRef]
- Faraone, A.; Sigurthorsdottir, H.; Delgado-Gonzalo, R. Atrial fibrillation detection on low-power wearables using knowledge distillation. In Proceedings of the 2021 43rd Annual International Conference of the IEEE Engineering in Medicine & Biology Society (EMBC), Virtual, 1–5 November 2021. [Google Scholar] [CrossRef]
- Banerjee, R.; Ghose, A. A light-weight deep residual network for classification of abnormal heart rhythms on tiny devices. In Communications in Computer and Information Science; Springer Nature: Cham, Switzerland, 2023; pp. 317–331. [Google Scholar] [CrossRef]
- Farag, M. A self-contained stft cnn for ecg classification and arrhythmia detection at the edge. IEEE Access 2022, 10, 94469–94486. [Google Scholar] [CrossRef]
- Rizqyawan, M.I.; Munandar, A.; Amri, M.F.; Korio Utoro, R.; Pratondo, A. Quantized Convolutional Neural Network toward Real-time Arrhythmia Detection in Edge Device. In Proceedings of the 2020 International Conference on Radar, Antenna, Microwave, Electronics, and Telecommunications (ICRAMET), Tangerang, Indonesia, 18–20 November 2020; pp. 234–239. [Google Scholar] [CrossRef]
- Gonzalez-Carabarin, L.; Schmid, A.; Van Sloun, R.J. Hardware-oriented pruning and quantization of Deep Learning models to detect life-threatening arrhythmias. In Proceedings of the 2021 IEEE Biomedical Circuits and Systems Conference (BioCAS), Berlin, Germany, 7–9 October 2021; pp. 1–6. [Google Scholar] [CrossRef]
- Risso, M.; Burrello, A.; Conti, F.; Lamberti, L.; Chen, Y.; Benini, L.; Macii, E.; Poncino, M.; Pagliari, D. Lightweight neural architecture search for temporal convolutional networks at the edge. IEEE Trans. Comput. 2022, 72, 744–758. [Google Scholar] [CrossRef]
- Krishna, A.; Rohit Nudurupati, S.; Chandana, D.G.; Dwivedi, P.; van Schaik, A.; Mehendale, M.; Thakur, C.S. RAMAN: A Reconfigurable and Sparse tinyML Accelerator for Inference on Edge. IEEE Internet Things J. 2024, 11, 24831–24845. [Google Scholar] [CrossRef]
- Dere, M.D.; Jo, J.H.; Lee, B. Event-Driven Edge Deep Learning Decoder for Real-Time Gesture Classification and Neuro-Inspired Rehabilitation Device Control. IEEE Trans. Instrum. Meas. 2023, 72, 4011612. [Google Scholar] [CrossRef]
- Pan, J.; Tompkins, W.J. A real-time QRS detection algorithm. IEEE Trans. Biomed. Eng. 1985, BME-32, 230–236. [Google Scholar] [CrossRef]
- Félix, R.A.; Ochoa-Brust, A.; Mata-López, W.; Martínez-Peláez, R.; Mena, L.J.; Valdez-Velázquez, L.L. Fast Parabolic Fitting: An R-Peak Detection Algorithm for Wearable ECG Devices. Sensors 2023, 23, 8796. [Google Scholar] [CrossRef]
- Rizwan, A.; Priyanga, P.; Abualsauod, E.; Nasrullah, S.; Serbaya, S.; Halifa, A. A machine learning approach for the detection of qrs complexes in electrocardiogram (ecg) using discrete wavelet transform (dwt) algorithm. Comput. Intell. Neurosci. 2022, 2022, 1–8. [Google Scholar] [CrossRef]
- Nguyen, T.; Qin, X.; Dinh, A.; Bui, F. Low resource complexity R-peak detection based on triangle template matching and moving average filter. Sensors 2019, 19, 3997. [Google Scholar] [CrossRef]
- Bae, T.W.; Kwon, K.K. Efficient real-time R and QRS detection method using a pair of derivative filters and max filter for portable ECG device. Appl. Sci. 2019, 9, 4128. [Google Scholar] [CrossRef]
- Neri, L.; Oberdier, M.T.; Augello, A.; Suzuki, M.; Tumarkin, E.; Jaipalli, S.; Geminiani, G.A.; Halperin, H.R.; Borghi, C. Algorithm for mobile platform-based real-time qrs detection. Sensors 2023, 23, 1625. [Google Scholar] [CrossRef]
- Moody, G.B.; Mark, R.G. The impact of the MIT-BIH arrhythmia database. IEEE Eng. Med. Biol. Mag. 2001, 20, 45–50. [Google Scholar] [CrossRef]
- Habibi, Z.; Karimizadeh, K.; Nosratpour, A.; Alipourfard, I. Enhanced QRS detection and ECG compression using adaptive thresholding: A real-time approach for improved monitoring and diagnosis. Comput. Electr. Eng. 2024, 119, 109528. [Google Scholar] [CrossRef]
- Zhao, K.; Li, Y.; Wang, G.; Pu, Y.; Lian, Y. A robust QRS detection and accurate R-peak identification algorithm for wearable ECG sensors. Sci. China Inf. Sci. 2021, 64, 182401. [Google Scholar] [CrossRef]
- Reklewski, W.; Miśkowicz, M.; Augustyniak, P. QRS Detector Performance Evaluation Aware of Temporal Accuracy and Presence of Noise. Sensors 2024, 24, 1698. [Google Scholar] [CrossRef] [PubMed]
- Sabor, N.; Gendy, G.; Mohammed, H.; Wang, G.; Lian, Y. Robust arrhythmia classification based on QRS detection and a compact 1D-CNN for wearable ECG devices. IEEE J. Biomed. Health Inform. 2022, 26, 5918–5929. [Google Scholar] [CrossRef] [PubMed]
- Alqudah, A.M.; Albadarneh, A.; Abu-Qasmieh, I.; Alquran, H. Developing of robust and high accurate ECG beat classification by combining Gaussian mixtures and wavelets features. Australas. Phys. Eng. Sci. Med. 2019, 42, 149–157. [Google Scholar] [CrossRef]
- Acharya, U.R.; Oh, S.L.; Hagiwara, Y.; Tan, J.H.; Adam, M.; Gertych, A.; San Tan, R. A deep convolutional neural network model to classify heartbeats. Comput. Biol. Med. 2017, 89, 389–396. [Google Scholar] [CrossRef]
- Huang, J.S.; Chen, B.Q.; Zeng, N.Y.; Cao, X.C.; Li, Y. Accurate classification of ECG arrhythmia using MOWPT enhanced fast compression deep learning networks. J. Ambient. Intell. Humaniz. Comput. 2023, 14, 5703–5720. [Google Scholar] [CrossRef]
- Ribeiro, H.D.M.; Arnold, A.; Howard, J.P.; Shun-Shin, M.J.; Zhang, Y.; Francis, D.P.; Lim, P.B.; Whinnett, Z.; Zolgharni, M. ECG-based real-time arrhythmia monitoring using quantized deep neural networks: A feasibility study. Comput. Biol. Med. 2022, 143, 105249. [Google Scholar]
- Kim, N.; Lee, S.; Kim, S.; Park, S.M. Automated Arrhythmia Classification System: Proof-of-Concept with Lightweight Model on an Ultra-Edge Device. IEEE Access 2024, 12, 150546–150563. [Google Scholar] [CrossRef]
- Amirshahi, A.; Hashemi, M. ECG classification algorithm based on STDP and R-STDP neural networks for real-time monitoring on ultra low-power personal wearable devices. IEEE Trans. Biomed. Circuits Syst. 2019, 13, 1483–1493. [Google Scholar] [CrossRef]
- Busia, P.; Scrugli, M.A.; Jung, V.J.B.; Benini, L.; Meloni, P. A tiny transformer for low-power arrhythmia classification on microcontrollers. IEEE Trans. Biomed. Circuits Syst. 2024, 19, 142–152. [Google Scholar] [CrossRef] [PubMed]
- Falaschetti, L.; Alessandrini, M.; Biagetti, G.; Crippa, P.; Turchetti, C. ECG-based arrhythmia classification using recurrent neural networks in embedded systems. Procedia Comput. Sci. 2022, 207, 3479–3487. [Google Scholar] [CrossRef]
- Jeong, Y.; Lee, J.; Shin, M. Enhancing Inter-Patient Performance for Arrhythmia Classification with Adversarial Learning Using Beat-Score Maps. Appl. Sci. 2024, 14, 7227. [Google Scholar] [CrossRef]
- Huang, B.; Abtahi, A.; Aminifar, A. Energy-Aware Integrated Neural Architecture Search and Partitioning for Distributed Internet of Things (IoT). IEEE Trans. Circuits Syst. Artif. Intell. 2024, 1, 257–271. [Google Scholar] [CrossRef]
- Rahman, M.; Hewitt, R.; Morshed, B.I. Design and Packaging of a Custom Single-lead Electrocardiogram (ECG) Sensor Embedded with Wireless Transmission. In Proceedings of the 2023 IEEE 16th Dallas Circuits and Systems Conference (DCAS), Denton, TX, USA, 14–16 April 2023; pp. 1–4. [Google Scholar] [CrossRef]
- Utsha, U.T.; Morshed, B.I. A smartphone app for real-time heart rate computation from streaming ECG/EKG data. In Proceedings of the 2023 IEEE International Conference on Electro Information Technology (eIT), Romeoville, IL, USA, 18–20 May 2023; pp. 1–6. [Google Scholar]
Disclaimer/Publisher’s Note: The statements, opinions and data contained in all publications are solely those of the individual author(s) and contributor(s) and not of MDPI and/or the editor(s). MDPI and/or the editor(s) disclaim responsibility for any injury to people or property resulting from any ideas, methods, instructions or products referred to in the content. |
© 2025 by the authors. Licensee MDPI, Basel, Switzerland. This article is an open access article distributed under the terms and conditions of the Creative Commons Attribution (CC BY) license (https://creativecommons.org/licenses/by/4.0/).