1. Introduction
With the rapid acceleration of urbanization, urban transportation systems are experiencing mounting pressure, particularly during peak travel periods, when the imbalance between supply and demand for taxis becomes especially pronounced. In recent years, advancements in big data and artificial intelligence have led to the development of intelligent dispatch systems, which offer a promising solution to transportation scheduling challenges. However, achieving the efficient and adaptive dispatching and repositioning of taxis in dynamic and complex urban environments remains a critical issue in urban traffic management.
Currently, most taxi dispatch systems rely heavily on historical data or basic heuristics for supply and demand forecasting and dispatch decisions. These approaches typically use static models, which are unable to adapt to the evolving demand patterns in urban areas. Specifically, they lack the flexibility required for real-time decision-making and multi-dimensional optimization in high-dimensional, dynamic environments [
1,
2,
3,
4]. For example, traditional supply and demand forecasting methods struggle to accurately predict future travel demand in a dynamically changing environment, leading to a mismatch between taxi supply and demand [
5]. On the other hand, reducing the taxi idling rate remains challenging, as many taxis remain idle at the outskirts of the city, unable to reposition themselves promptly to high-demand areas [
6].
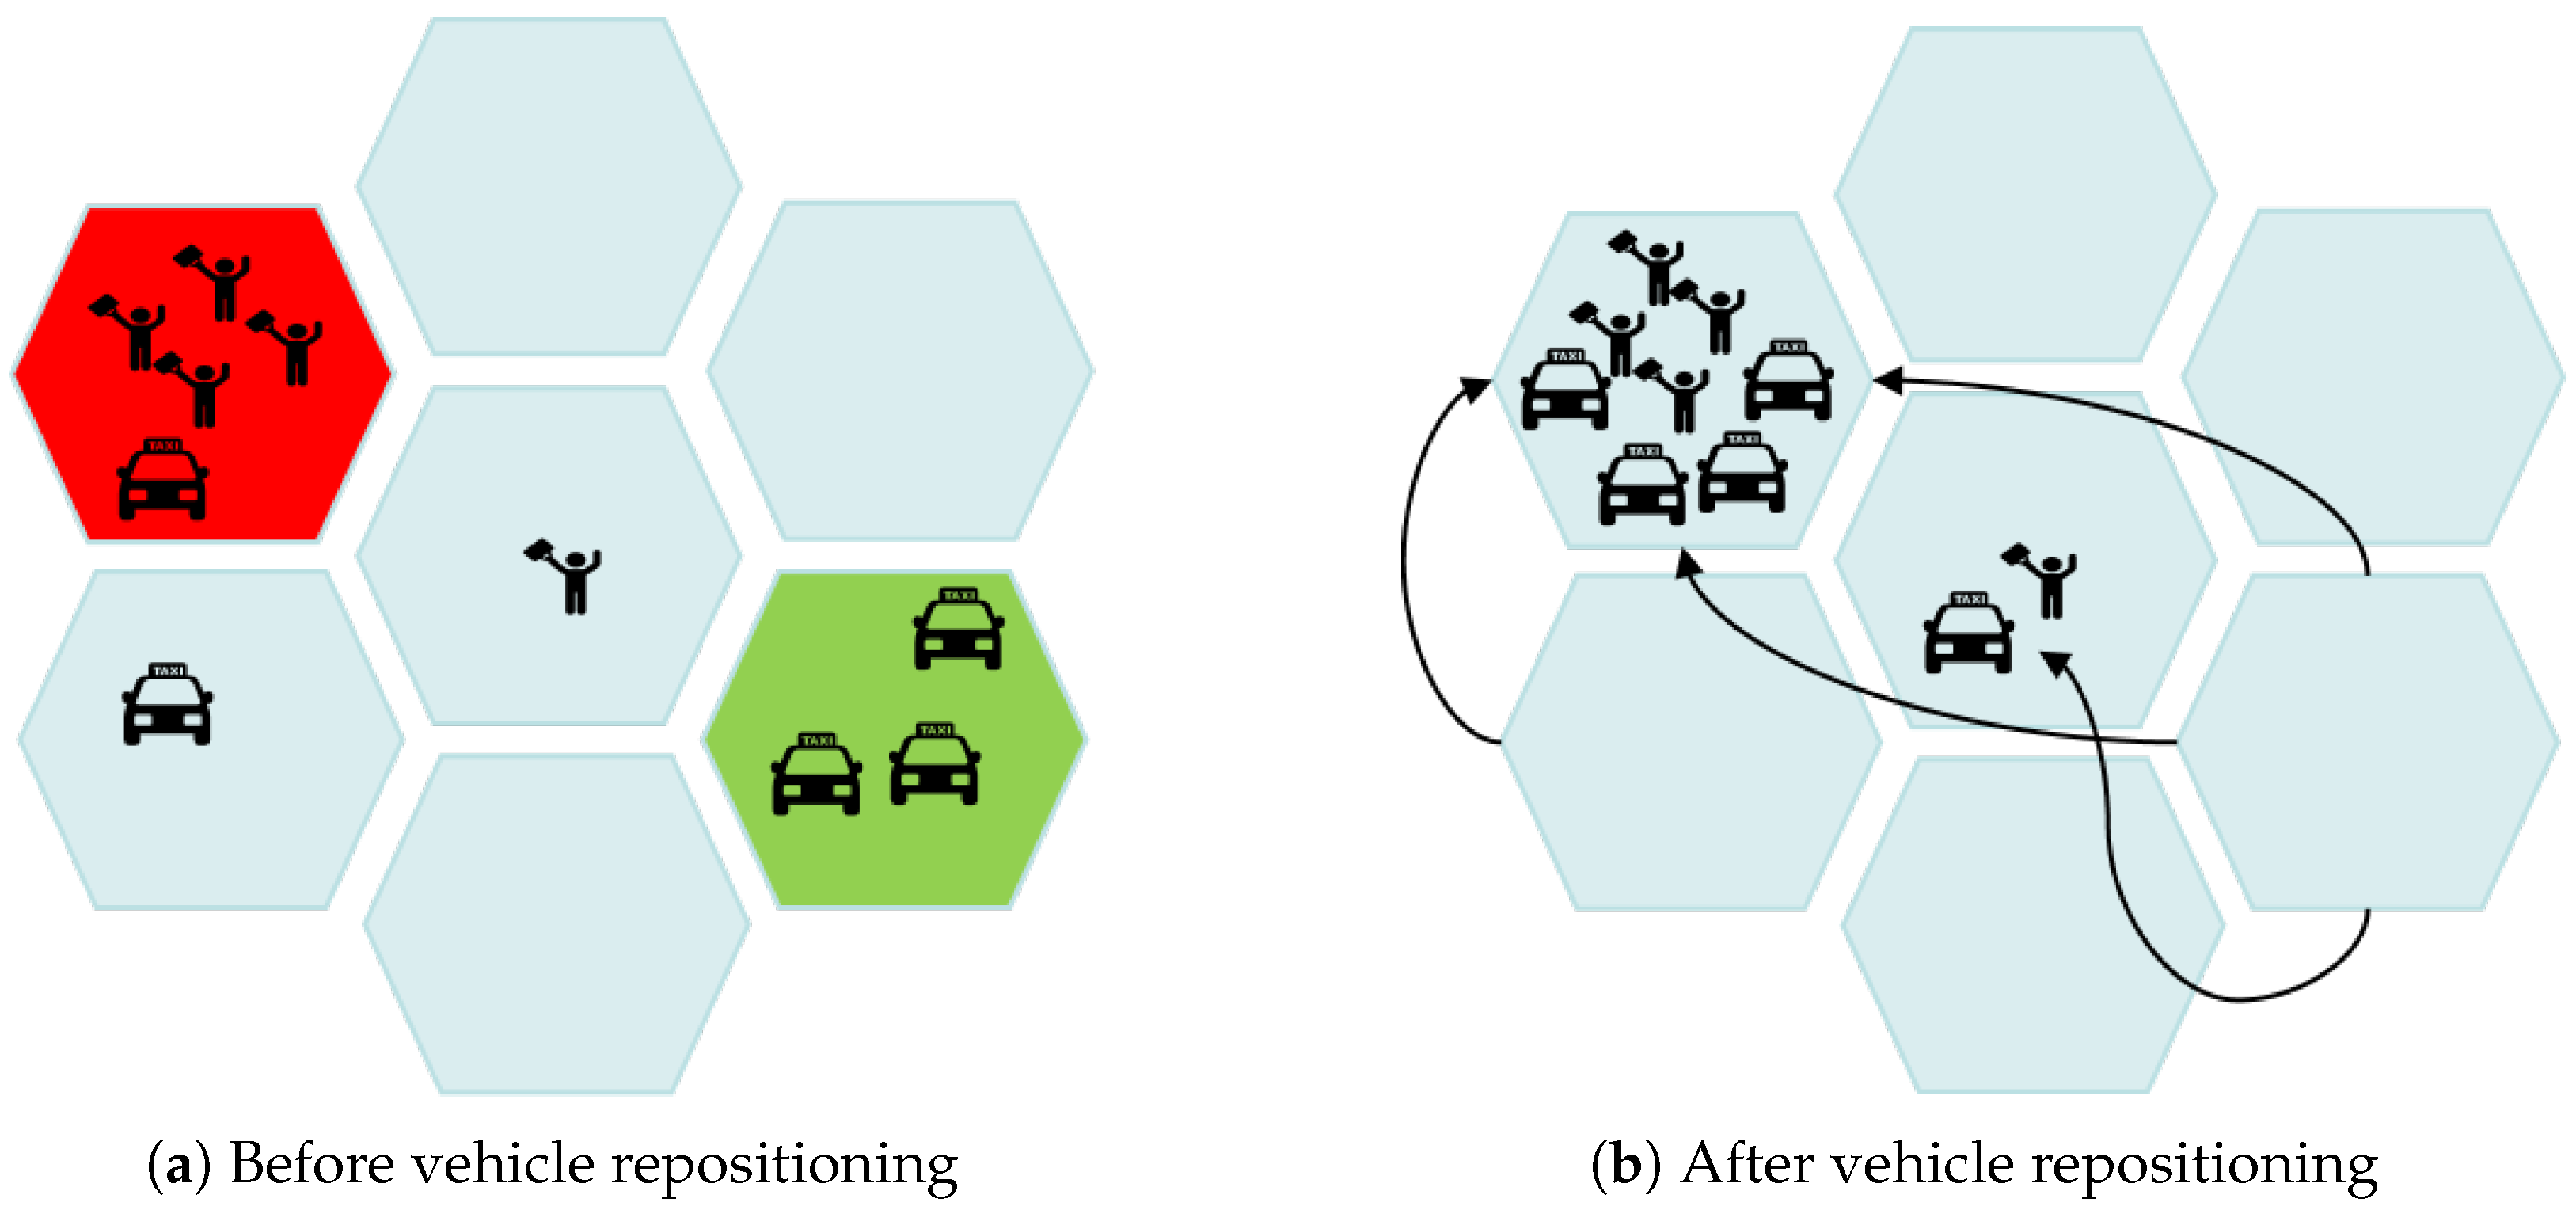
In
Figure 1a, the red hexagonal region represents a high-demand area for passengers, where four taxis are required to meet the demand but only one taxi is available, resulting in a shortfall of three taxis. The green hexagonal region, in contrast, represents a low-demand area, where many idle taxis are present but there are no service requests. To address this issue, a series of Vehicle Repositioning (VR) strategies are proposed to improve vehicle utilization and enhance passenger satisfaction by proactively dispatching idle vehicles to high-demand areas. Idle taxis in the green region are repositioned to the red region and other areas with high demand to ensure a balance between supply and demand in peak utilization zones. The repositioning results are shown in
Figure 1b.
To address the aforementioned challenges, Multi-Agent Reinforcement Learning (MARL) has been proposed as an effective solution. MARL enables multiple agents to interact and collaborate in complex, dynamic environments, making joint decisions based on both local and global information, thereby significantly improving the system’s scheduling efficiency [
7]. In recent years, significant advancements have been made in MARL-based models for taxi scheduling and repositioning [
8]. However, existing MARL models still face two main challenges. Firstly, the model has a high complexity and, due to information asymmetry and differences in local objectives, conflicts and coordination difficulties may arise among the agents [
9]. Secondly, balancing local supply and demand with global dispatch efficiency in a dynamic environment remains an unresolved challenge [
10].
In response to the challenges of multi-agent collaboration conflicts in complex urban traffic and the issue of balancing local supply–demand with global scheduling efficiency in dynamic environments, this paper proposes a novel TDEDR (Taxi Dispatch and Empty-vehicle Repositioning) framework, aimed at optimizing the taxi dispatch and repositioning process through a multi-agent reinforcement learning model. The main contributions of this framework are as follows:
The study introduces a dual-layer scheduling architecture, the TDEDR (Taxi Dispatch and Empty-vehicle Repositioning) framework that separates the decision-making layer from the execution layer. This separation allows for efficient strategic decision-making and operational coordination. The framework decomposes taxi dispatch and vehicle repositioning into independent problems, optimizing demand allocation and empty-vehicle movement by integrating both global and local information, thereby significantly improving scheduling efficiency and response rates.
To effectively integrate multi-dimensional information and enhance decision-making efficiency, the framework incorporates a dual-attention mechanism and proposes the MADARL (Multi-Agent Dual-Attention Reinforcement Learning) algorithm. This algorithm is designed to extract both global and local supply–demand information, guiding the dispatch behavior of the agents (taxis). The mechanism is capable of dynamically capturing changes in demand patterns across the city and adjusting the dispatch strategy in real time, thus reducing the supply–demand disparity across regions.
An advanced environmental simulator is developed and an extensive experimental validation of the proposed model is conducted using a real-world urban traffic dataset. The experimental results demonstrate that the TDEDR framework, combined with the MADARL algorithm, significantly outperforms existing scheduling methods in improving taxi order response rates and platform revenue.
The remainder of this paper is organized as follows.
Section 2 provides a review of the existing literature on taxi scheduling and vehicle repositioning.
Section 3 presents a comprehensive modeling formulation of the problem.
Section 4 outlines the overall architecture of the TDEVR framework in detail.
Section 5 elaborates on the key algorithms underlying the MADARL approach.
Section 6 validates the model through extensive experiments and conducts a comparative analysis with state-of-the-art methods.
Section 7 concludes the paper by summarizing the main contributions and discussing potential directions for future research.
3. Problem Statement
The supply–demand imbalance in urban transportation systems significantly impacts the order response rate of taxis, thereby diminishing the overall revenue of the platform. This paper proposes a strategy for learning an optimal vehicle scheduling policy through the coordination of all taxis within the system. The primary objective of this strategy is to maximize driver revenue while minimizing the supply–demand gap in each region, thereby improving the order response rate. Since the decision-making process for taxi scheduling can be decomposed across different regions and integrating both local and global observations effectively reduces the communication load during decision-making, we model this problem as a Partially Observable Markov Decision Process (POMDP). This approach allows for better adaptation to complex dynamic environments, enabling the achievement of both global supply–demand equilibrium and optimal scheduling for individual taxi agents within a Multi-Agent System (MAS). The urban environment, agents, action space, reward mechanism, and both local and global state definitions are presented in detail in the following sections.
3.1. Environment
The urban transportation environment is divided into a grid of hexagonal cells, where each cell represents a distinct region. The state of each region is characterized by the number of idle vehicles and the volume of passenger demand within that region. We represent the collection of these grid cells as , with signifying the j-th grid cell. At each time step t, the state of each region encompasses the number of idle and the demand for passengers . The state of the entire city can be encapsulated in a state vector , where k is the number of hexagonal regions.
3.2. Agent
In the model presented in this paper, each taxi is considered as an independent agent aimed at achieving a global supply–demand balance through learning and optimizing dispatch strategies. The objective of the taxi is to dynamically respond to passenger demands by learning and refining its dispatch strategy, ultimately realizing an equilibrium in supply and demand across the entire network.
We define the set of taxis as , where represents the i-th taxi (or agent). The state of each taxi is determined by the state of the region that it occupies. Specifically, each taxi can observe the number of idle vehicles and the demand for passengers in its current region. Armed with this state information, a taxi can opt to wait for new passenger requests in its current region or move to adjacent regions to meet potential demands.
3.3. Action Space
At each time step t, a taxi can perform an action defined as follows: : remain in the current region , and : move to an adjacent region (corresponding to one of the six neighboring grid cells). Thus, the action space A includes seven possible action choices. For vehicles entering the same cell, these actions are identical. The overall action space is the combination of all taxi actions, represented as .
3.4. Reward
To incentivize agents to achieve supply–demand balance, we have designed a reward mechanism that takes into account both local and global balance. The local reward
for each region
depends on the supply–demand balance within that region. We define a balance indicator
to reflect the degree of supply–demand balance as
where
represents the number of passenger demands in region
at time step
t and
denotes the number of idle vehicles in the same region at time step
t. This indicator measures the degree of imbalance between supply and demand, with a lower value indicating a more balanced state.
The local reward is defined as
The global reward
(joint reward) is the average of all local rewards,
Through this reward mechanism, we can achieve supply–demand balance in each region while also optimizing the distribution of vehicles across the entire city.
3.5. Local State and Global State
Taxi state information is a crucial component in the decision-making process. In order to perform effective vehicle scheduling in complex urban transportation environments, we define state information in two parts: the local state and global state.
Local State: The local state refers to the environmental information that is directly observable and relevant to each taxi at the current moment. For each taxi (agent) , the local state includes specific information within its grid cell, such as the number of idle taxis, the number of passenger demands, and information related to adjacent areas.
The local state
is defined as
where
denotes the number of idle taxis in region
at time step
t,
represents the number of passenger demands in the same region at time step
t,
indicates the set of neighboring regions to
, and
and
correspond to the number of idle taxis and passenger demands in the neighboring region
, respectively.
The local state encompasses not only the immediate information of the taxi’s location but also the surrounding context, aiding the taxi dispatch system in making informed decisions that account for the impact of adjacent areas.
Global State: The global state represents the overall status of the system at the current moment, integrating the status of all taxis and the supply–demand situation across all regions of the city. The global state includes comprehensive information on the number of idle taxis and passenger demands in each region, providing a holistic view of the urban transportation system.
The global state
is defined as follows:
where
signifies the state of region
at time step
t, which includes the number of idle taxis and passenger demands
, and
k is the total number of regions into which the city is divided.
3.6. Action Selection of the Taxi (Agent)
Within the framework of multi-agent reinforcement learning, the decision-making of each taxi
relies not only on its local state
but also on the global state
to access a broader range of environmental information. Specifically, during the decision-making process, taxis can integrate information from both local and global states to find a balance between local and global optimization. The process of action selection for a taxi can be represented as
where
denotes the policy function of the taxi and
is the action chosen by taxi
at time step
t.
With this design, taxis are capable of making decisions that take into account both their immediate surroundings and the overall traffic conditions of the city, thereby achieving more efficient and equitable vehicle dispatching and repositioning.
4. TDEVR Framework
To coordinate the dispatching of all taxis and learn an optimal vehicle dispatching strategy, we propose a novel TDEVR (Taxi Dispatch and Empty-Vehicle Repositioning) modeling framework for decision-making training in taxi dispatching and vehicle repositioning. The framework incorporates a Multi-Agent Reinforcement Learning (MARL) architecture and adopts the “centralized training and decentralized execution” strategy, aiming to optimize resource scheduling and spatial reallocation in multi-agent systems.
Figure 2 illustrates the overall structure of the TDEVR framework, which primarily consists of three modules: environment modeling, the decision-making layer, and the execution layer. A detailed description of the three modules is provided below.
4.1. Environment Modeling
To accurately simulate the supply–demand dynamics in urban transportation, the TDEVR model establishes an environment comprising both global and local states. In this modeling framework, the urban area is partitioned into multiple hexagonal grids, with each grid cell representing a distinct region of the city. Each region is characterized by specific information, such as the number of idle vehicles, the number of unfulfilled orders, and the status of neighboring regions. This information is updated in real-time by the environment simulator, which provides the necessary perceptual inputs for the decision-making process of the taxis.
Figure 2.
Framework of the TDEVR model.
Figure 2.
Framework of the TDEVR model.
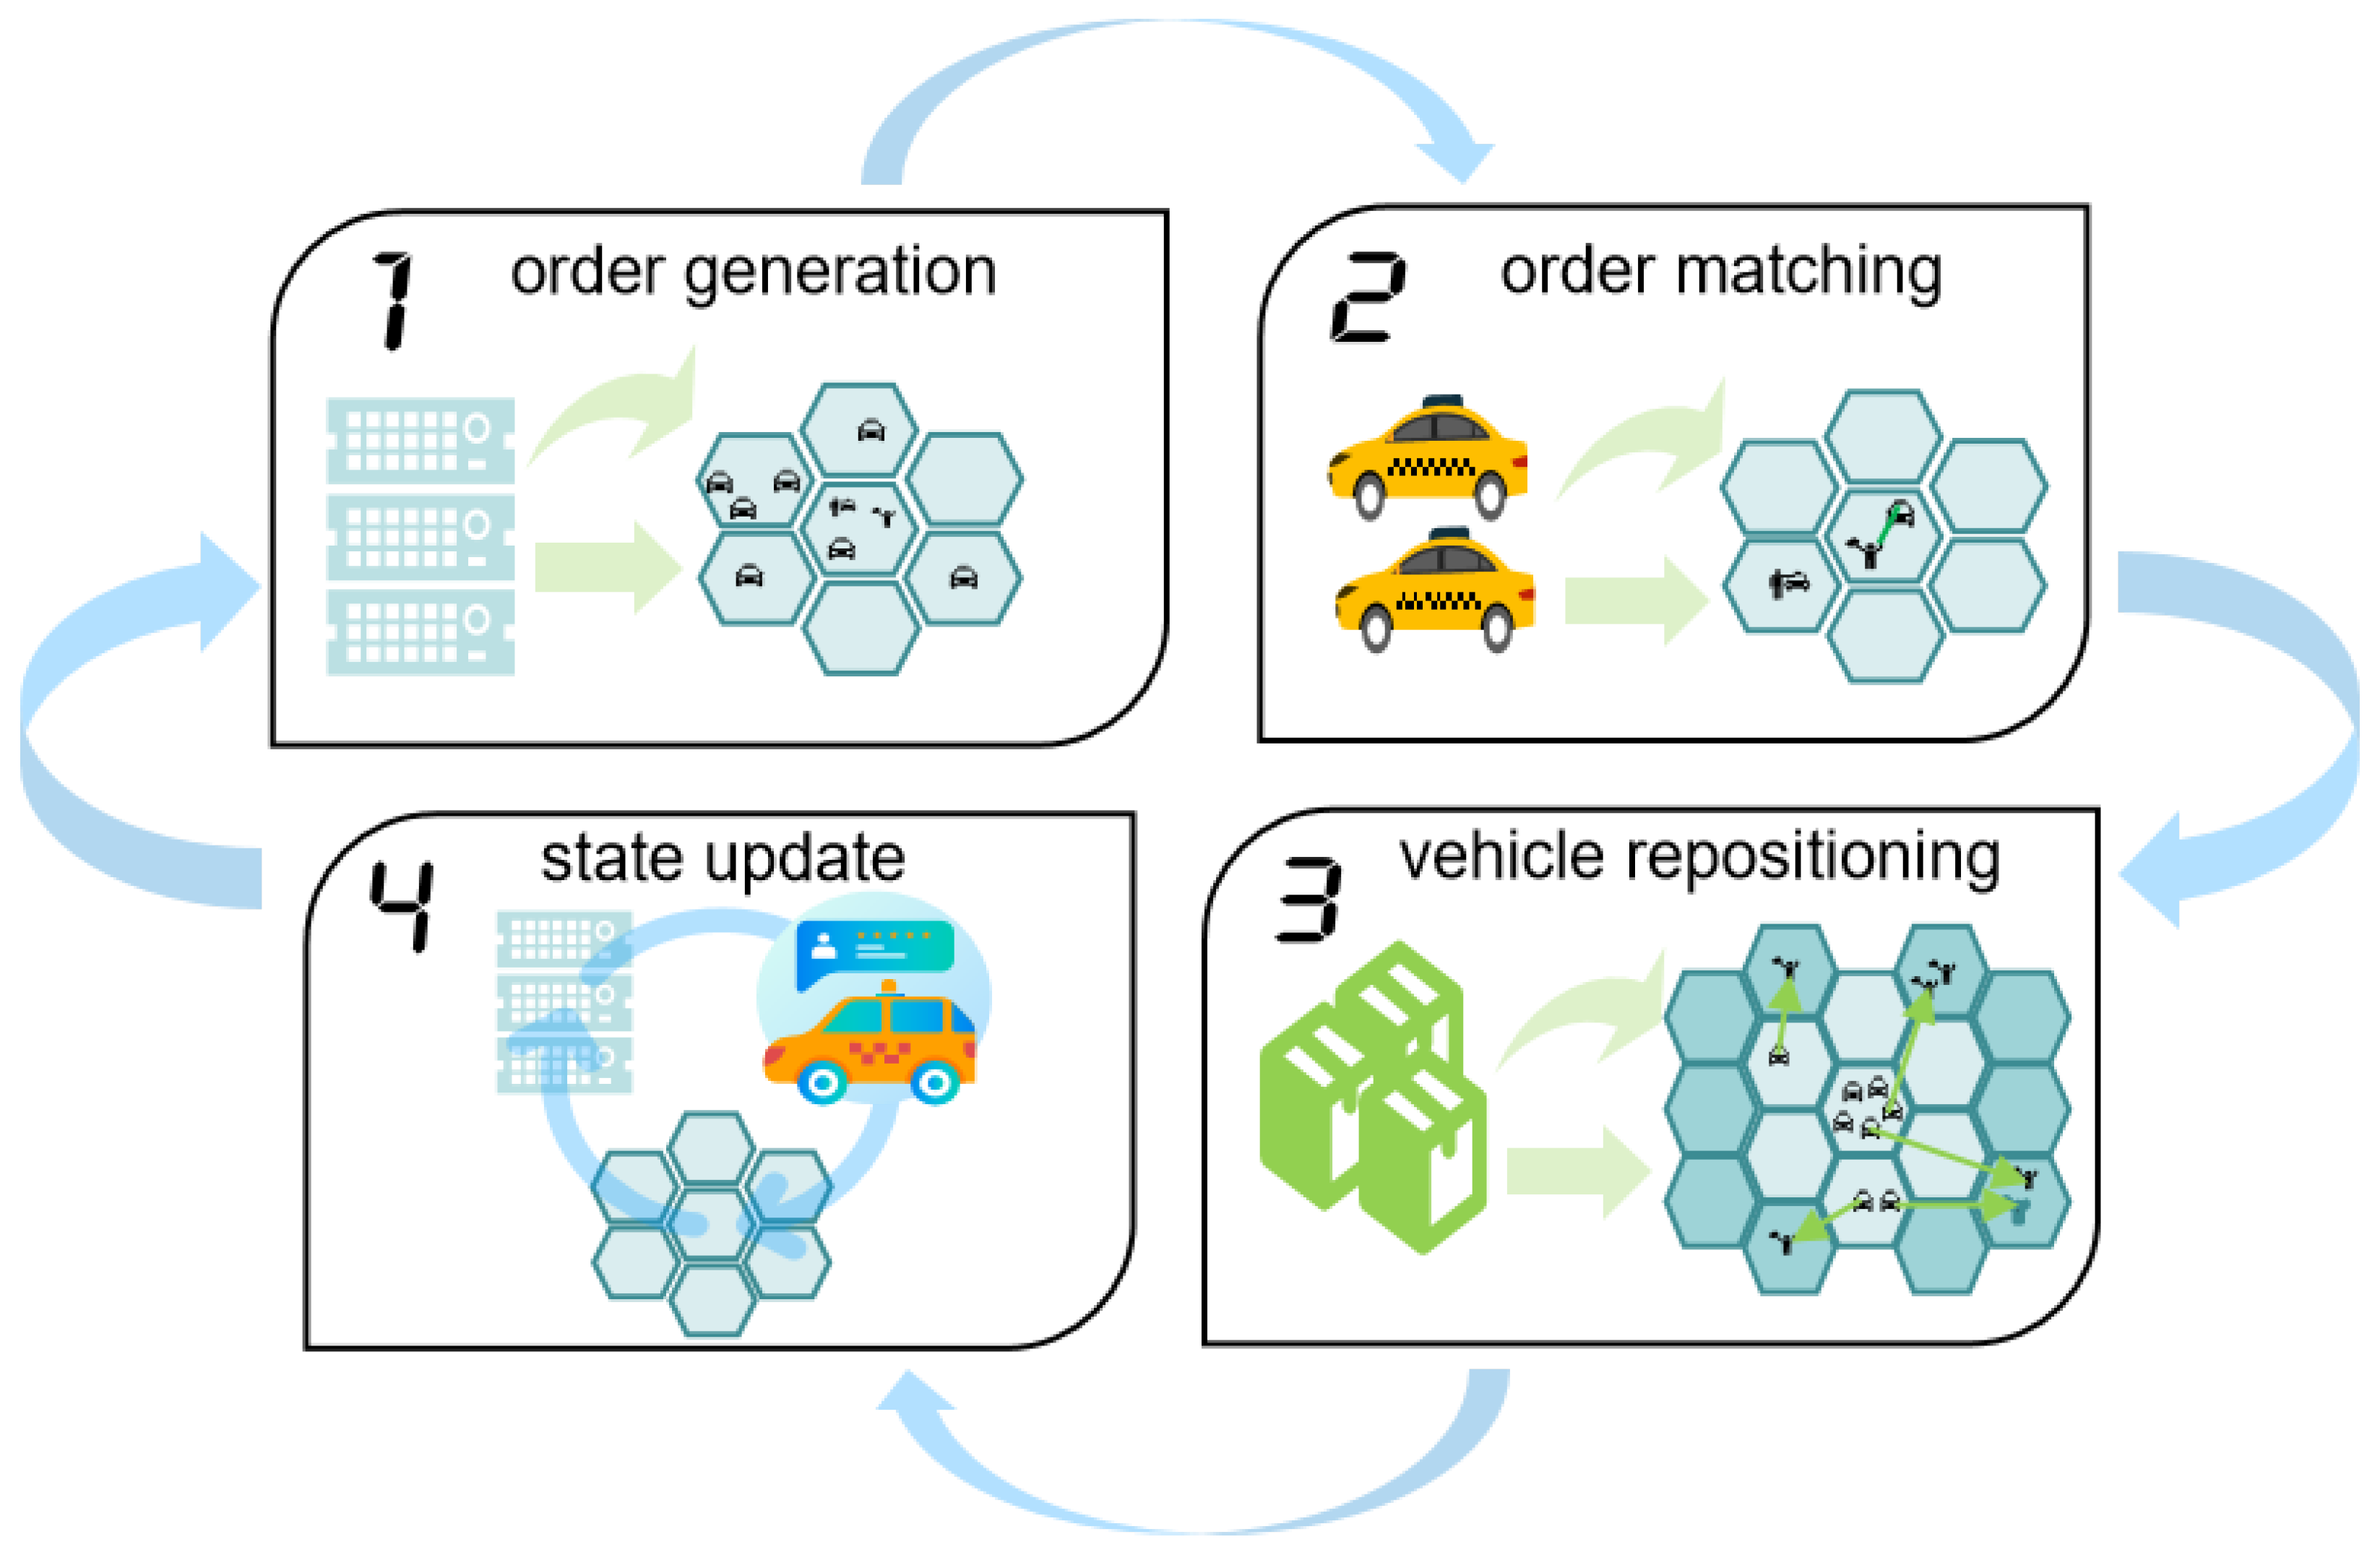
The environment simulator, illustrated in
Figure 3, is utilized for training the reinforcement learning algorithm involved in vehicle repositioning. The simulation process divides the day into 144 discrete time steps, each lasting 10 min, forming a complete cycle. At each time step, the simulator executes four critical operations: order generation, order matching, vehicle repositioning, and global state updating. These operations collectively capture the dynamic nature of urban transportation, enabling the model to effectively simulate and optimize real-time traffic management and vehicle dispatching in a highly dynamic urban environment.
The first step is order generation. At each time step t, the simulator retrieves order information from the historical dataset corresponding to that time period and allocates these orders to the appropriate hexagonal grid cells within the city. The order generation process is driven by the historical demand distribution specific to each region, while also taking into account the prevailing traffic conditions. This dual consideration ensures that the generated orders reflect real-world fluctuations in both supply and demand, thereby providing a more accurate simulation of urban transportation dynamics.
The second step is order matching. At each time step, the simulator conducts the order–vehicle matching process in each grid region, considering the demand for orders and the status of available vehicles. The matching process utilizes an optimized algorithm that factors in various criteria, such as the priority of the order, the current location of the vehicle, and the expected arrival time. The objective is to maximize matching efficiency and enhance passenger satisfaction by ensuring that the most appropriate vehicles are dispatched to fulfill the orders in the most timely and efficient manner.
The third step is vehicle repositioning. In the case of supply–demand imbalances within a region, the simulator reallocates idle vehicles to areas with higher demand, based on the learned scheduling strategy. This repositioning strategy takes into account not only the current demand within a region but also leverages global state information to anticipate future demand fluctuations. By doing so, it ensures a proactive and globally optimal scheduling approach that maximizes the efficiency of vehicle redistribution.
The fourth step is a global state update. At the conclusion of each time step, the simulator updates the distribution of vehicles and passenger demand across all regions based on the outcomes of order matching and vehicle repositioning. This update serves as the input for the subsequent time step, ensuring that the simulator accurately captures and reflects the dynamic temporal changes in transportation supply and demand.
Through the iterative cycle of these four steps, the simulator effectively emulates the fluctuations in supply and demand, as well as vehicle scheduling, in a real-world transportation system. This dynamic simulation provides a robust environment for training reinforcement learning algorithms, facilitating the optimization of decision-making strategies for taxi dispatch and vehicle repositioning.
Local Observation
: Local observation represents the current status of each grid cell at time step
t, including the number of idle vehicles within the cell, the number of pending orders, and the supply and demand information of adjacent grid cells. The local observation can be expressed as
where
denotes the number of idle vehicles in grid cell
j at time
t,
represents the number of pending orders, and
is the set of states for the neighboring grid cells.
Global Observation
: The global observation is the sum of all local observations, providing a comprehensive view of the entire system by integrating the current status of all grid cells. The global observation can be represented as
where
N signifies the total number of grid cells and
represents the local observation status of grid cell
j.
Based on historical data, the environment simulator constructs a comprehensive model capable of simulating both global and local environments. The global environment reflects the overall supply and demand dynamics of the entire transportation system while the local environment pertains to the specific supply and demand data within the current grid cell and its neighboring grids. By capturing the demand and supply relationship between taxis and orders, the environment simulator generates rich informational inputs for decision-making processes.
In practical terms, the simulator serves a dual purpose: it not only generates training data but also dynamically evaluates the system’s performance across various scenarios. At each time step, the environment simulator updates the state based on the current action taken by the taxi, subsequently providing this updated state as input for the next decision-making cycle. This continuous feedback loop allows for the real-time simulation of the complex interactions within the urban transportation system, enhancing the training of reinforcement learning algorithms.
4.2. Decision-Making Layer
In the TDEVR framework, the decision-making layer plays a critical role, primarily focused on generating optimal scheduling and vehicle repositioning strategies. Its goal is to maximize overall transportation efficiency and optimize the spatial distribution of urban taxis. By incorporating the Multi-Agent Deep Reinforcement Learning (MADARL) algorithm (discussed in
Section 5), the decision-making layer facilitates intelligent taxi scheduling and vehicle repositioning in complex, dynamic environments. This approach effectively addresses the limitations of traditional scheduling techniques, particularly in dealing with high-dimensional, dynamically evolving scenarios.
The decision-making layer in the TDEVR framework is central to the optimization process, aiming to enhance transportation efficiency and improve the spatial distribution of taxis, thus minimizing the gap between supply and demand. To tackle the complexities of urban transportation dynamics, the decision-making layer employs the Multi-Agent Reinforcement Learning (MADARL) algorithm. This algorithm efficiently manages the high-dimensional, fluctuating supply and demand conditions through the collaborative efforts of multiple intelligent agents. As a result, it overcomes the challenges faced by traditional scheduling methods, particularly in large-scale and rapidly changing environments.
The architecture of the decision layer is built upon a multi-intelligent Actor–Critic structure, which is divided into two components: global state processing and local state processing. This dual approach allows the system to effectively handle both the global traffic network state and the localized dynamics of individual grid cells within the urban environment.
(1) Global State Processing: The global state information encompasses key elements across the entire city, such as supply and demand conditions, vehicle distribution, and dynamic changes in passenger demand. This information is conveyed to the Critic network through the global state network. The Critic network assesses the impact of each taxi’s behavior on the overall system, thereby calculating the global value of the system. By evaluating the utility of each action on a global scale, the Critic network helps to ensure a balance between global supply and demand, reduces the system’s idling rate, and decreases the number of vehicles stranded in marginal areas. Specifically, the Critic network learns the optimal value function from a global perspective, which guides the behavior strategy of agents to maximize the overall benefits of the system.
(2) Local State Processing: The local state describes the supply–demand gap and the conditions of the surrounding area where the taxi is currently located. This information is transmitted to the Actor network through the local state network. The Actor network generates specific dispatching and repositioning strategies based on the local state. Through the Actor network, taxis can quickly respond to local demands, reducing passenger waiting times and vehicle idling times, thereby optimizing the supply–demand match within the area. This local state-based information processing ensures that taxis can allocate local resources with the best strategy, enhancing the system’s response efficiency.
(3) Actor–Critic Interaction: In the process of strategy generation, the Actor network uses the local state
to generate a specific action
while the Critic network evaluates the value of the action
generated by the Actor based on the global state
. The value function
calculated by the Critic network represents the expected future rewards for the taxi’s intelligent agent when taking action
in the current state. During the training process, the Actor network optimizes its strategy by maximizing the value function assessed by the Critic network, making its strategy closer to the global optimum. For each taxi
i, this strategy optimization can be expressed as
The Centralized Training, Decentralized Execution (CTDE) approach ensures that taxi agents are able to optimize their strategies based on global information during training while relying on local information for real-time decision-making during actual execution, thus reducing computational complexity and making them suitable for large-scale, dynamically changing urban traffic environments.
This structure effectively reduces the computational complexity while improving the overall efficiency of the system, which is particularly suitable for dealing with large-scale, dynamically changing urban transportation environments.
4.3. Execution Layer
The execution layer is a crucial component of the TDEVR framework, responsible for translating the scheduling and repositioning strategies devised by the decision layer into actual operational actions. This layer oversees taxi scheduling and order matching, continuously acquiring and updating real-time dynamic information regarding both taxis and passengers within the urban environment. By interacting with the environment model in real time, the execution layer ensures the accurate implementation of policies and provides timely feedback, thus facilitating the effective operation of the system in a complex and ever-changing transportation environment.
(1) Action Sampling and Decision-Making: In the execution layer, the action selection process for each taxi is based on the action probability distribution output by the policy network. Specifically, the available actions for a taxi include staying in the current area or moving to an adjacent area to adapt to the supply and demand changes in different regions. At each time step
t, based on the current local observation
, a specific action
is sampled from the action distribution
of the policy network,
where
is the specific action randomly sampled from the action probability distribution of the policy network. This process ensures that the action decisions of taxis have a degree of randomness, which allows them to better adapt to the dynamic changes in the environment and avoid becoming trapped in local optima due to overly rigid strategies.
(2) Environmental Feedback and State Update: After executing an action, the status and location of the taxi are immediately updated within the environment. The environmental simulator generates a new state and a corresponding reward based on the action taken. The state update reflects the new position of the taxi and the associated local and global state changes following its movement. The reward signifies the contribution of the current action to the overall objectives of the system, such as maximizing driver revenue and enhancing passenger response rates.
(3) Policy Update and Feedback Mechanism: Upon receiving feedback from the environment, the Critic network within the decision layer utilizes global state information to assess the long-term value of actions. The Critic network calculates the value function
to evaluate the potential value of the current policy and feeds this assessment back to the Actor network. The Actor network then adjusts its strategy based on the feedback from the Critic, selecting actions that are more optimal. Specifically, the process of policy update is implemented through the following formula:
where
is the learning rate and
represents the gradient update based on the reward. This gradient-based update mechanism allows the Actor network to continuously adjust the policy parameters
, enabling it to learn an optimized policy and optimized reposition strategies.
(4) Action Execution and Intelligent Agent Coordination: Each intelligent agent (taxi) in the execution layer selects the optimal action based on the current local state, implementing coordination and repositioning actions in real operations. The executor carries out the chosen action within the environment, which may involve moving the taxi to a new area or staying in the current area to meet demand. Following this action, the environmental simulator generates a new state and provides reward feedback to the system for further strategy optimization. This feedback mechanism ensures that taxis can respond in real-time to dynamic traffic conditions, enhancing system efficiency and adaptability.
Ultimately, the execution layer empowers each taxi to autonomously respond to fluctuating demand by making real-time decisions based on local observations and policy networks. This autonomous decision-making mechanism, driven by the collaboration of multiple intelligent agents, enables the system to rapidly adapt to demand fluctuations in the dynamic urban transportation environment, thereby enhancing overall response efficiency and service quality.
5. MADARL Algorithm
In the TDEVR model, a Multi-Agent Dual-Attention Reinforcement Learning (MADARL) algorithm serves as the core framework for decision-making, whose detailed network architecture is shown in
Figure 4. This network design incorporates both local and global attention mechanisms, thereby enhancing the model’s capacity to effectively perceive and interpret environmental information. Additionally, the algorithm integrates Multi-Layer Perceptron (MLP) and self-attention mechanisms to further improve its ability to learn complex multi-agent interaction behaviors.
Section 5.1 presents a detailed overview of the MADARL algorithm’s structure, while
Section 5.2 provides an in-depth analysis of the attention mechanisms employed within the algorithm.
Section 5.3 outlines the model’s training process and decision optimization techniques.
5.1. Framework of MADARL Algorithm
The MADARL algorithm is composed of multiple Actor–Critic networks, as illustrated in
Figure 4. The system optimizes scheduling and vehicle relocation strategies to maximize the overall efficiency of the transportation network through centralized training and decentralized execution. It integrates both global and local state information to process dynamic environmental inputs.
The global state represents the city-wide supply and demand data for taxis. This information is first processed by a Multi-Layer Perceptron (MLP), which is combined with a global attention mechanism to highlight relevant features. The refined information is then passed to the Critic network for global strategy evaluation.
Figure 4.
Architecture of the MADARL-based decision-making framework.
Figure 4.
Architecture of the MADARL-based decision-making framework.
Conversely, the local state concerns the supply and demand conditions specific to individual taxis and their surrounding neighborhoods. This local data undergoes processing by an MLP, enhanced with a local attention mechanism, and is subsequently input into the Actor network to generate specific scheduling and vehicle relocation decisions.
By combining both global and local information, the MADARL framework enables the system to make more effective and optimal decisions at both the global and individual levels, thereby enhancing overall transportation efficiency in complex, dynamic urban environments.
Critic Network: The Critic network is tasked with assessing the value of the collective actions of each intelligent agent based on global supply and demand information. Utilizing a global attention mechanism, the Critic network focuses on the most critical information within the global state, thereby enhancing its understanding of the overall supply–demand balance. Each Critic network estimates the value function
for a given state, reflecting the expected long-term returns of executing a specific policy in the current state. The value function of the Critic network is calculated using the following formula:
where
represents the parameters of the Critic network and
is the discount factor, which accounts for the present value of future rewards.
The Critic network receives the global state
and the reward information
from the intelligent agents’ actions, and it refines the network parameters to improve prediction accuracy by optimizing the loss function. The Mean Squared Error (MSE) is used as the loss function, with the following formulation:
Actor Network: Each taxi is equipped with a dedicated Actor network that makes dispatch decisions based on local state information, such as accepting rides, repositioning, or waiting. Through a local attention mechanism, the Actor network can process local state information more efficiently. The Actor network receives feedback from the Critic network and outputs actions according to the policy
. Each taxi relies on its corresponding independent policy network (Actor), which generates an action distribution based on local observations
,
where
represents the parameters of the policy network and
is the forward propagation function of the policy network. Each Actor network can leverage a local attention mechanism (self-attention) to enhance its understanding of local features and optimize decisions in conjunction with the global feedback from the Critic network.
During the training process, taxis interact with the environment and gradually adjust their strategies to maximize long-term cumulative rewards. The policy network is updated using policy gradient methods, optimizing the objective function
by calculating the advantage function
,
The advantage function
is calculated based on the current state value and the actual reward received,
The calculation of the advantage function is enhanced through the Generalized Advantage Estimation (GAE) method,
5.2. Attention Mechanism
To enhance the model’s adaptability in complex urban transportation environments, this paper proposes a dual-attention model that integrates both global and local attention mechanisms for optimizing a two-tier scheduling framework. This approach significantly improves the flexibility and stability of resource scheduling by effectively capturing the supply and demand characteristics at both the local and global scales. By doing so, it ensures the rational allocation of resources, thereby optimizing the efficiency and performance of urban transportation systems.
In the MADARL algorithm, the state space of the intelligent agent (taxi) is expanded to incorporate the supply and demand context of neighboring grid cells. These Supply and Demand (SD) features, such as the number of active orders and the availability of drivers, enable the model to more accurately capture the fluctuations in supply and demand within the current grid as well as its surrounding areas. Specifically, the SD features of each hexagonal grid, along with those of its six neighboring grid cells, are included in the state calculation. This ensures that each taxi has a comprehensive understanding of the supply and demand conditions in both the local region and its adjacent grids.
To enhance real-time dispatching decisions, these SD features are aggregated using a 10 min sliding window, allowing the model to capture short-term fluctuations in supply and demand. Additionally, local and global features are integrated through a dynamic weight adjustment mechanism to refine real-time scheduling decisions. This mechanism introduces both local and global weight factors, enabling the system to dynamically adjust the relative importance of local versus global information. By modulating the local and global attention ratios based on the sensitivity to the evolving supply–demand gap, the algorithm optimizes the balance between local responsiveness and global coordination, thereby improving the overall efficiency of the scheduling strategy.
This design is particularly significant in complex urban transportation environments, especially when scheduling involves multiple neighboring grids. By leveraging the local attention mechanism, the model can capture the supply and demand fluctuations within neighboring grids, allowing for a more localized and adaptive response. Simultaneously, the global attention mechanism ensures coordination across the entire city, capturing the broader supply–demand dynamics to guarantee the global optimality of the scheduling decision. This dual-attention approach effectively balances local responsiveness with global coordination, enhancing the overall efficiency and effectiveness of the scheduling strategy in dynamic, large-scale urban systems.
5.2.1. Local Attention Mechanism
The local attention mechanism is employed to capture the supply–demand interaction between the current grid cell and its adjacent grid cells. This mechanism determines the influence of each neighboring grid cell on the decision-making of the current grid cell by calculating the attention weights for each adjacent grid cell. The specific formula is as follows:
where
represents the trainable weight matrix within the local attention layer,
and
denote the supply–demand feature vectors of the current and neighboring grid cells, respectively, and
signifies the attention weight of the
i-th neighboring grid cell. The softmax function ensures the non-negativity and normalization of the weights, thereby effectively measuring the impact of neighboring grid cells on the current grid cell.
[
33] is the local weight factor, which dynamically adjusts the supply–demand weights of the area. During peak travel periods, the local weight factor
increases to enhance the focus on surrounding grid cells, prioritizing the supply–demand variations in neighboring areas to optimize local scheduling decisions. The introduction of this local attention mechanism aims to enable the model to more accurately capture the supply–demand characteristics of neighboring areas. By assigning higher weights to neighboring grid cells with greater similarity, the model can more agilely adapt to the dynamic changes in local supply and demand.
5.2.2. Global Attention Mechanism
Building upon the capture of local supply–demand relationships, the global attention mechanism is utilized to capture the supply–demand relationships among all grid cells within the urban area. The global attention mechanism calculates the importance weights of each grid cell in the overall supply–demand balance, ensuring that the model can optimize dispatch strategies from a global perspective. The computational formula is as follows:
where
is the trainable weight matrix within the global attention layer,
and
represent the supply–demand feature vectors of the
i-th and
j-th grid cells, respectively, and
N is the total number of grid cells in the city. The softmax normalization in this formula ensures a rational distribution of global weights, reflecting the significance of each grid cell in the overall supply–demand balance.
[
33] is the global weight factor, and the core of the global attention mechanism lies in ensuring supply–demand balance across the entire area. During peak periods, increasing the global weight helps to coordinate resource allocation across different regions, preventing over-concentration in certain areas and optimizing global scheduling. By weightedly calculating the supply–demand characteristics of all grid cells, the model can coordinate the allocation of global resources and prevent the occurrence of local optimization at the expense of global balance.
The integration of local and global attention mechanisms allows the model to make more efficient scheduling decisions in complex urban transportation environments. The local attention mechanism enables the model to rapidly detect supply and demand fluctuations in neighboring grids, ensuring the accuracy of local scheduling decisions. Meanwhile, the global attention mechanism ensures a balanced allocation of resources across the entire city. The synergistic effect of these two attention mechanisms allows for quick adjustments to local supply and demand, while maintaining an optimal resource distribution at the global level. This mechanism is particularly effective in responding to unexpected events or short-term supply–demand fluctuations, offering greater flexibility and robustness in resource scheduling.
5.3. Model Training and Optimization
To ensure that the model performs effectively in complex urban transportation environments, this paper proposes a comprehensive training framework. The framework iteratively refines the strategy network and the evaluator network through repeated interactions with the environment, aiming to achieve the global optimality of the model.
Loss Function Design: During the training process, the loss function of the Critic network employs either the Mean Squared Error (MSE) or Huber loss to minimize the discrepancy between predicted values and actual rewards. Meanwhile, the Actor network stabilizes policy updates by optimizing a clipped objective function,
:
where
denotes the importance sampling weight and
represents the clipping hyperparameter.
Policy Optimization: The Actor network’s optimization is guided by policy gradient methods, which adjust the network parameters based on the calculated advantage function
. Ultimately, the parameters of the Actor network are updated via gradient ascent as follows:
where
denotes the learning rate.
Throughout the training process, the Actor and Critic networks optimize alternately, generating improved dispatch strategies while simultaneously performing global value assessments. At each training step, each taxi agent interacts with the environment, executing actions and receiving corresponding feedback. Through this iterative process, agents continuously refine their strategies to enhance the efficiency of supply and demand matching. This ultimately leads to optimal scheduling and improved service quality across the entire transportation system.
6. Experiments
This section outlines the experimental design and validation process conducted for this study. Using a real-world New York City taxi dataset and a custom simulation environment, the proposed TDEVR framework and MADARL algorithm were thoroughly evaluated. The experiments were designed to measure the model’s scheduling efficiency, supply–demand balancing capability, and adaptability in large-scale dynamic environments. Specifically,
Section 6.1 details the preprocessing of experimental data,
Section 6.2 describes the configuration of experimental parameters,
Section 6.3 defines the evaluation metrics,
Section 6.4 discusses the selection of algorithms for comparative analysis,
Section 6.5 presents and analyzes the experimental results,
Section 6.6 introduces the ablation experiments, and
Section 6.7 provides an in-depth analysis of the ablation experiment results.
6.1. Data Processing
This study utilizes the New York City Yellow Taxi dataset for the period from 1 January 2016 to 31 January 2016. The dataset contains detailed records of taxi trips, including geographic coordinates of pickup and drop-off locations, timestamps, fare, and distance traveled. In this study, the geographic coordinates of each trip record were mapped to predefined hexagonal grid cells. To ensure the accurate mapping of each record, a geocoding-based coordinate transformation technique was employed, utilizing high-precision geographic boundary data.
During the data cleaning phase, trip records with identical pickup and drop-off locations or exceptionally short distances were excluded.
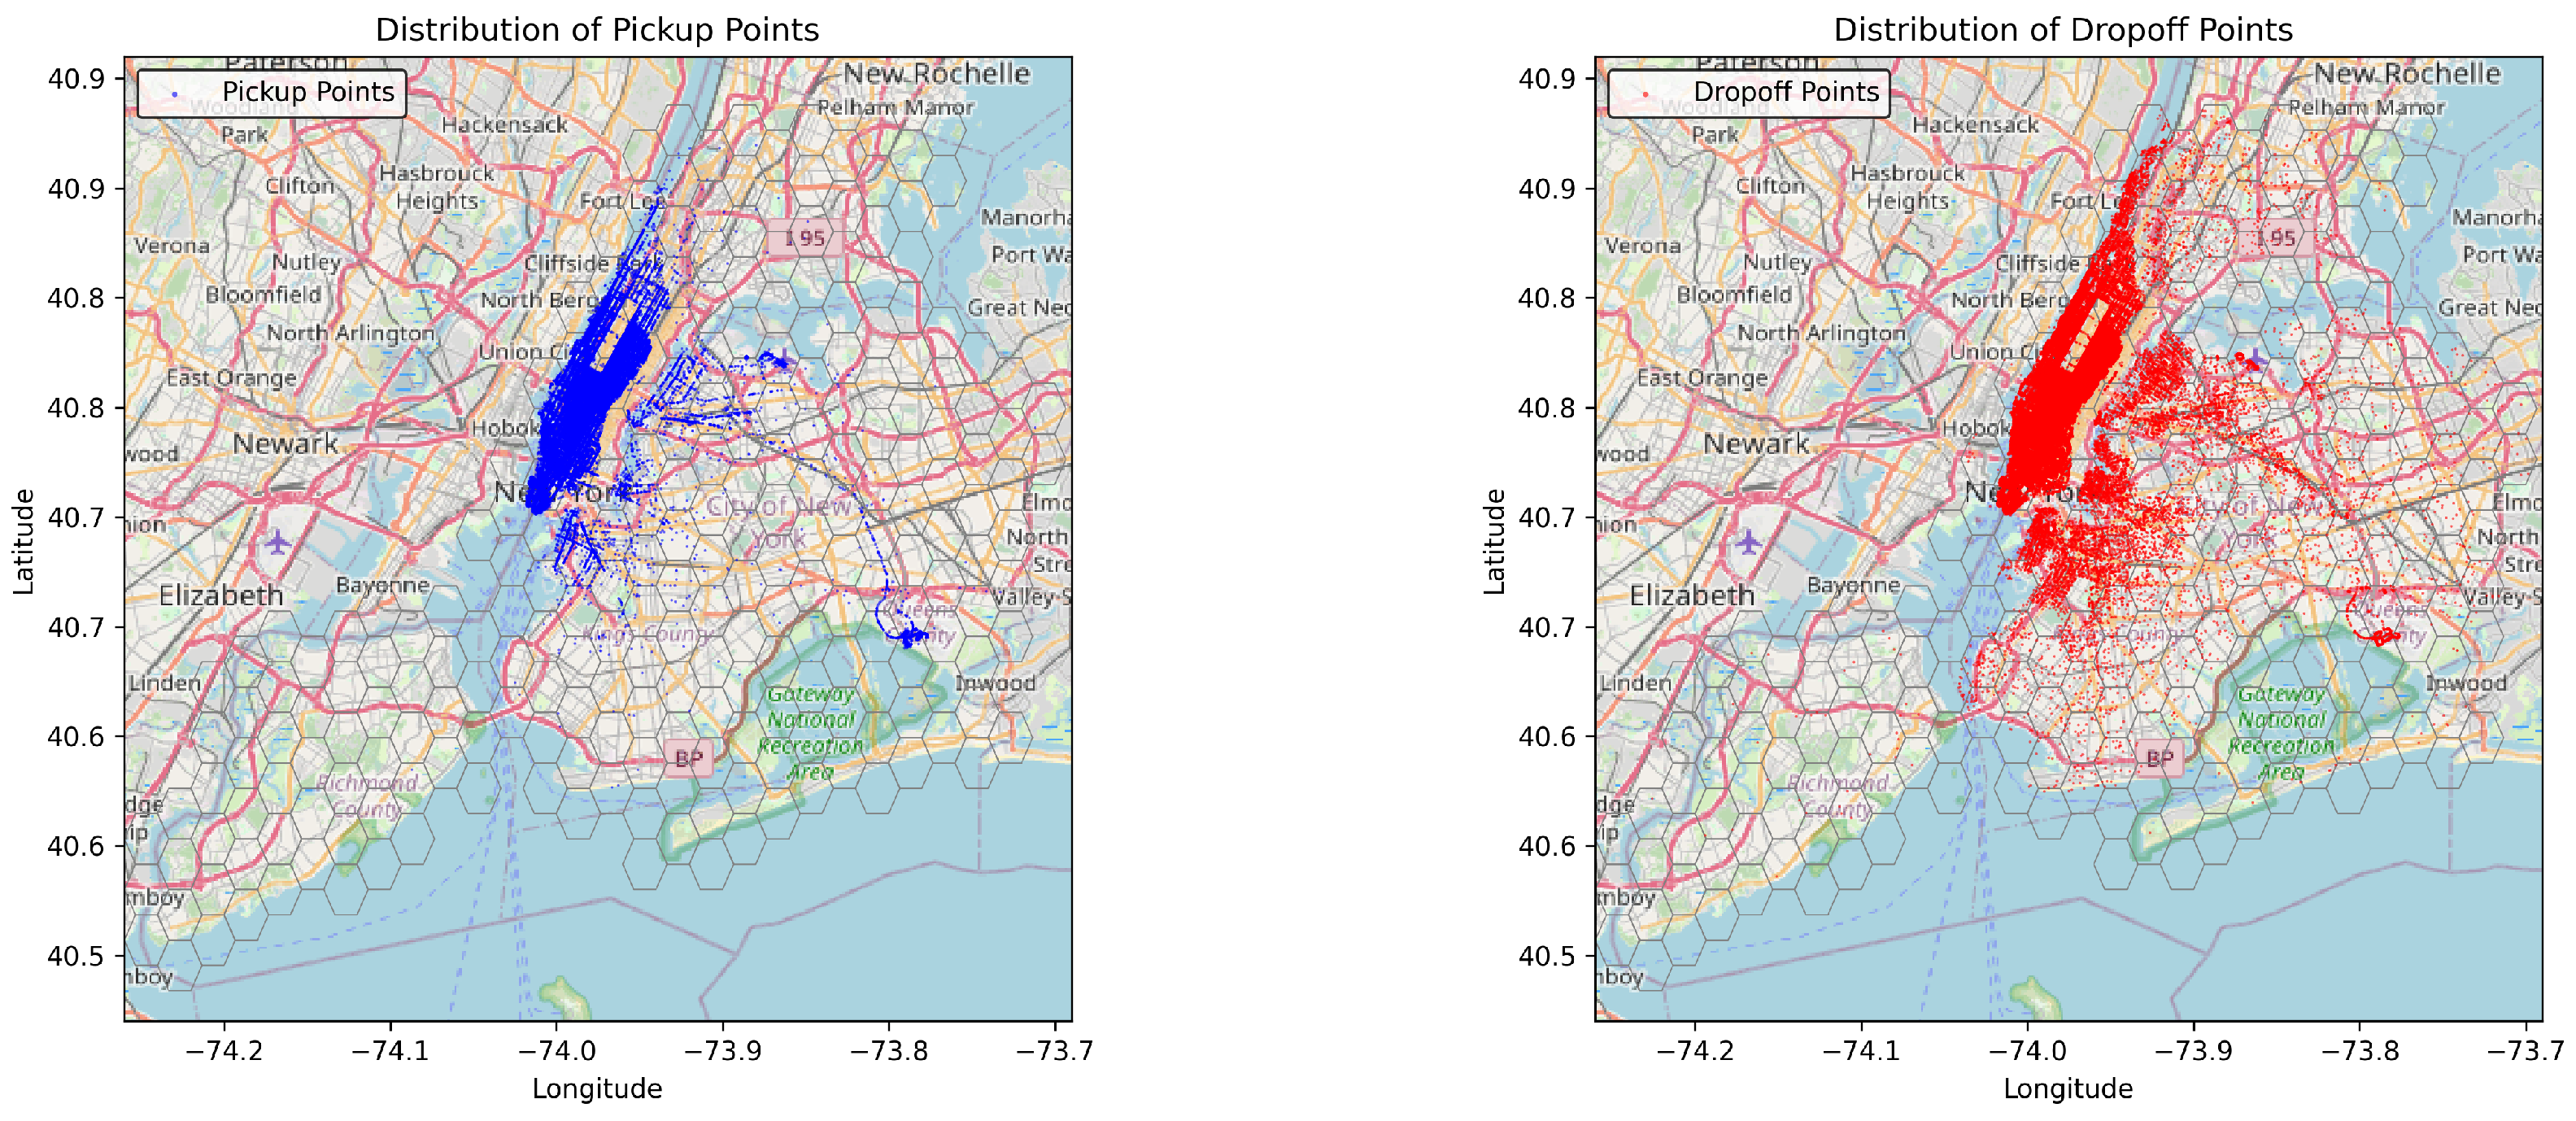
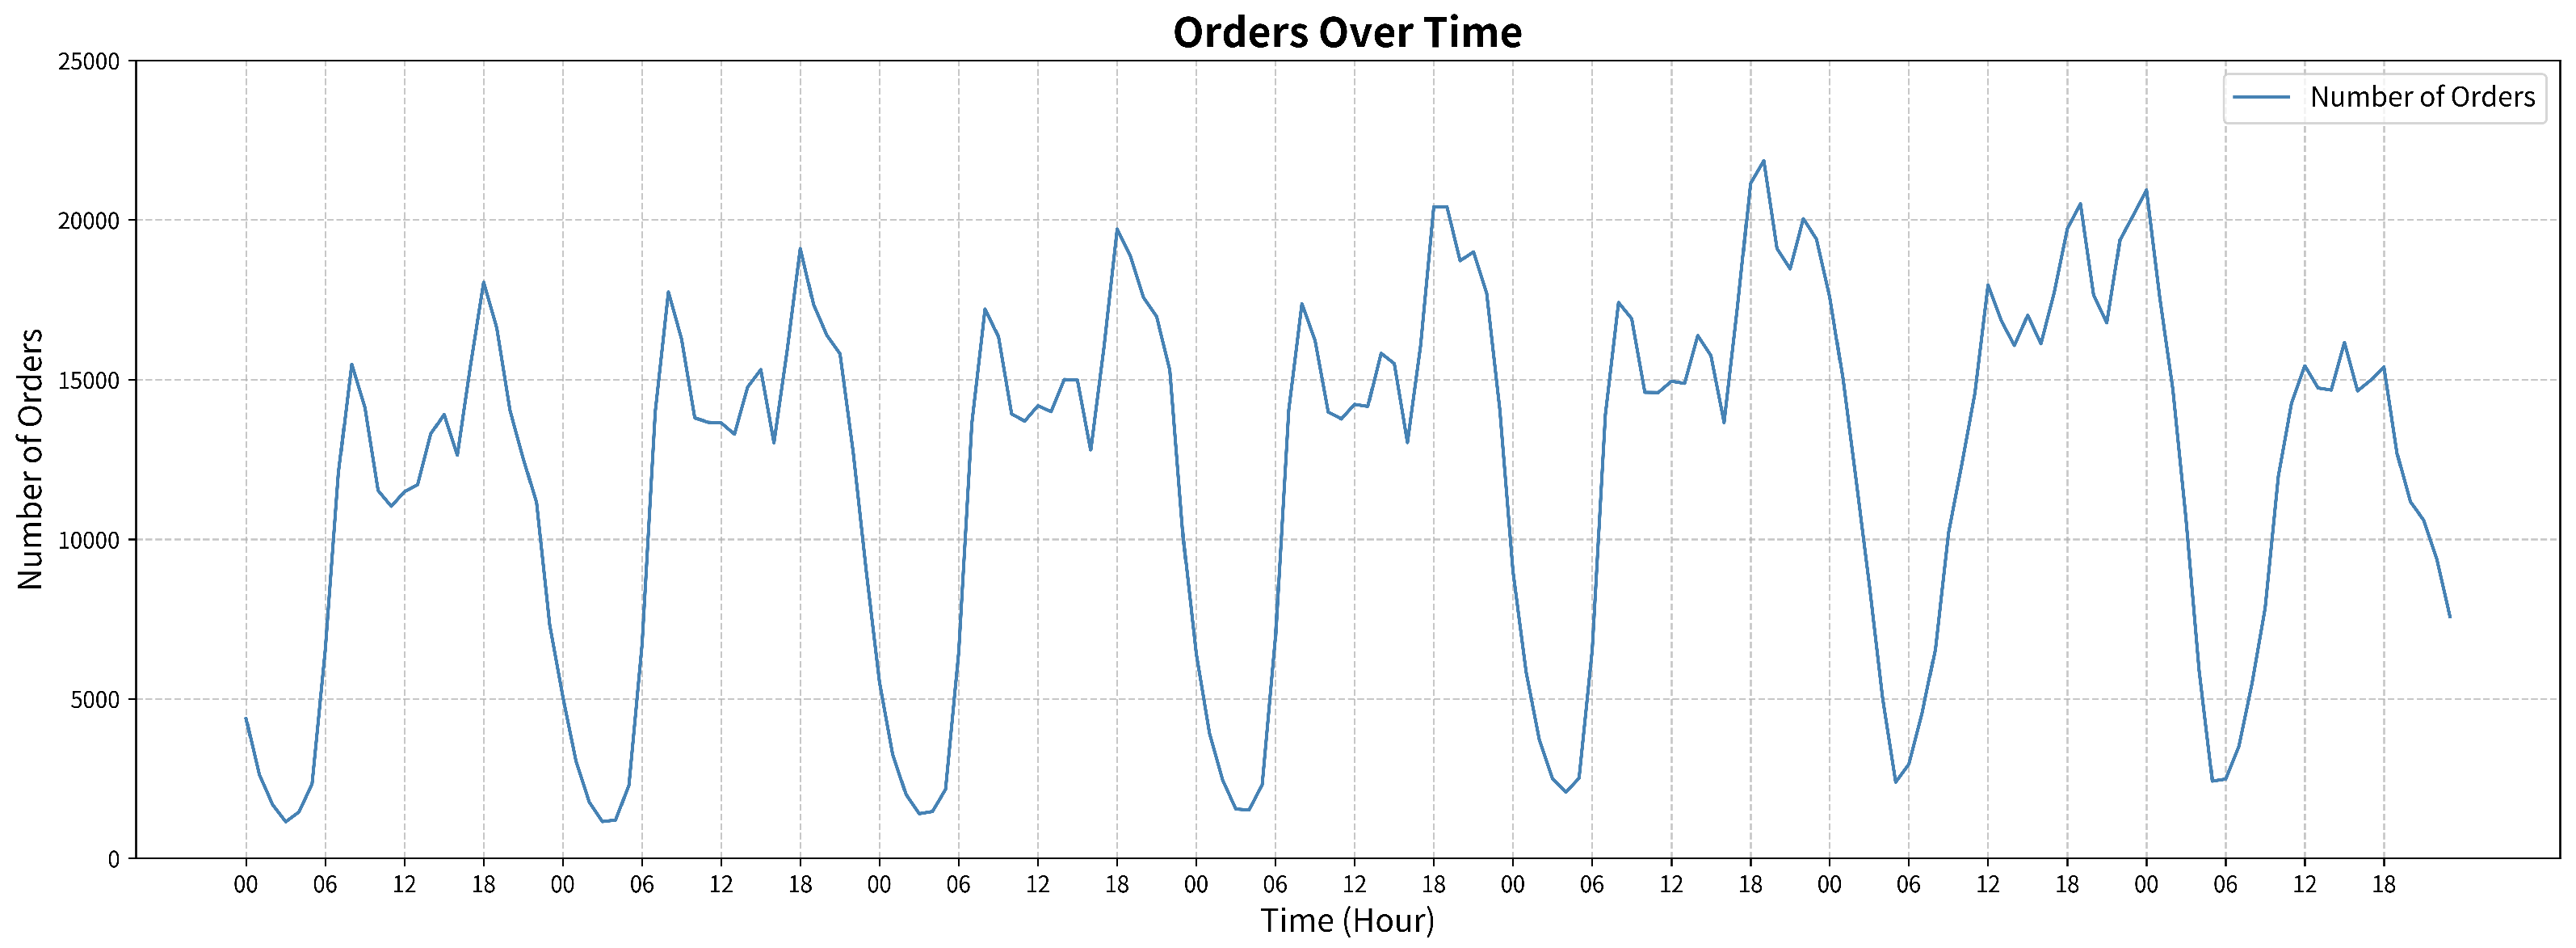
Figure 5 shows the spatial distribution of pickup and dropoff points from the cleaned dataset, representing the processed trip order data. The resulting cleaned dataset comprises 8,878,518 taxi orders, reflecting the distribution of trip demands across various time intervals, as illustrated in
Figure 6. These anomalous records were likely erroneous or extreme cases that could negatively impact the model’s training and evaluation processes. To enhance the model’s performance, feature engineering techniques were applied to the raw data. Specifically, the timestamp of each record was transformed into multiple time-related features, and the average demand and peak hours for each region were calculated using historical data.
To ensure effective generalization, the first 24 days of data were utilized as the training set, while the last 7 days were allocated to the test set. The training set was used for model learning and parameter tuning whereas the test set was employed to evaluate the model’s generalization capability. To accurately simulate the taxi dispatch system in an urban environment, New York City was divided into 250 non-overlapping hexagonal grid cells using a hexagonal tessellation method. This partitioning approach effectively captures the supply–demand relationships across the city, with the equal-length edges of the hexagonal grids facilitating balanced dispatch strategies between adjacent regions.
6.2. Experimental Setup
All experiments were performed on a high-performance Linux server equipped with a 20-core Intel Xeon Gold 5218R CPU (Intel, Santa Clara, CA, USA) and an NVIDIA GeForce RTX 3090Ti GPU (NVIDIA, Santa Clara, CA, USA). The experimental parameter settings, summarized in
Table 1, were determined through iterative tuning and optimization. To enable the model to effectively learn the scheduling strategy at each time step, 21 training rounds were conducted, with each round comprising multiple state–action–feedback loops. This configuration allowed the model to progressively refine and optimize the scheduling strategy.
The model’s generalization performance was evaluated during the testing phase. A batch size of 1024 was employed, with the learning rate set to , and the Adam optimizer was utilized for parameter optimization. Through extensive experimentation, these settings effectively ensured model convergence while maintaining efficient training speed. Each training round involved 1000 parameter updates using the Proximal Policy Optimization (PPO) algorithm. Recognized for its robust convergence properties and stability, PPO is particularly suitable for tackling complex decision-making challenges in multi-agent environments.
To comprehensively assess the model’s performance across varying scales of transportation systems, dispatch scenarios with 6000, 8000, and 10,000 taxis were simulated. This multi-scale experimental design enabled the evaluation of the model’s effectiveness in handling different problem sizes while validating its robustness and adaptability to both small- and large-scale scheduling challenges.
6.3. Evaluation Metrics
To comprehensively evaluate the scheduling effectiveness and relocation performance of the model, this study utilizes several key metrics, each designed to assess a specific aspect of the model’s performance.
(1) Order Response Rate (ORR): Refs. [
18,
28] ORR (Order Response Rate) measures the proportion of orders that were responded to in a timely manner during the test period, providing a direct reflection of how well the model meets passenger demand. The ORR is calculated using the following formula:
where
and
denote the number of orders that are responded to and the total number of orders within a day, respectively.
(2) Platform Cumulative Revenue (PCR): Ref. [
28] PCR (Platform Contribution Revenue) measures the total revenue generated by the platform during the test period. This metric reflects not only the number of orders but also considers the distance traveled and the fare associated with each order. The PCR is calculated using the following formula:
where
represents the total income generated by taxi
k over the course of a day,
denotes the number of taxis in operation, and
is a scaling factor.
(3) Comprehensive Index (CI): Ref. [
28] CI (Composite Index) is a comprehensive metric that balances the Order Response Rate (ORR) and the Cumulative Platform Revenue (PCR) to evaluate the effectiveness of the vehicle repositioning strategy. The CI formula is expressed as follows:
where
is the coefficient.
These evaluation metrics are interrelated to some extent. For instance, higher order response rates are typically associated with higher cumulative platform revenues, as a more responsive dispatch system can fulfill more customer demands. Moreover, effective vehicle repositioning strategies tend to improve both order response rates and cumulative platform revenues by optimizing the distribution of vehicles across the city, thus enhancing overall system performance.
6.4. Comparative Algorithms Example
To evaluate the effectiveness of the MADARL algorithm, this study selects several baseline algorithms for comparative analysis. Each baseline algorithm employs a distinct strategy tailored to the application scenarios designed in this study and offers solutions to the large-scale taxi fleet repositioning problem from different perspectives. These comparisons aim to highlight the advantages of the MADARL algorithm in terms of scheduling efficiency, adaptability, and resource optimization.
Random: The random algorithm reallocates idle vehicles to neighboring grids. As the simplest baseline, it serves as a benchmark for evaluating the performance enhancement of the MADARL algorithm compared to a random strategy. While the random algorithm is computationally efficient and does not require complex calculations, its inherent randomness limits its effectiveness in scenarios characterized by dynamic supply and demand fluctuations.
cDQN: The Contextual Deep Q-Network (cDQN) approach [
34] is well-suited for large-scale vehicle relocation tasks. This algorithm excels in handling complex decision-making environments, particularly due to its sensitivity to varying contextual factors. This ability allows cDQN to effectively adapt to dynamic traffic conditions and complex supply–demand fluctuations, making it a strong contender for vehicle relocation in real-time urban transportation systems.
DDPG: The Deep Deterministic Policy Gradient (DDPG) algorithm [
35] utilizes an Actor–Critic framework to address reinforcement learning problems in continuous action spaces. DDPG is particularly advantageous in modeling continuous action decisions, which is essential for dynamic systems. However, its performance heavily relies on the accurate modeling of states and actions, and it may encounter significant uncertainties in multi-agent environments due to the complexity of interactions between agents and decisions.
MADDPG: The Multi-Agent Deep Deterministic Policy Gradient (MADDPG) framework [
36], which adopts a centralized training and decentralized execution policy framework, is designed to handle the collaborative and competitive relationships between multiple agents. MADDPG is particularly well-suited for dynamic and complex traffic scheduling environments as it enables agents to interact and learn cooperatively, thereby improving overall scheduling performance. By allowing each agent to independently execute actions while learning from the shared environment, MADDPG effectively addresses the challenges posed by multi-agent systems in real-world traffic scenarios.
MASAC: The Multi-Agent Soft Actor–Critic (MASAC) algorithm [
37] is an Actor–Critic-based deep reinforcement learning approach for multi-agent systems. MASAC adopts a centralized training and independent execution policy framework, where the value function of each agent not only relies on its own observations and actions but also incorporates the observations and actions of other agents. This design allows MASAC to perform effectively in complex, multi-agent environments, making it particularly suitable for handling intricate collaborative tasks. By leveraging both individual and collective information, MASAC enhances the decision-making process, ensuring optimal performance in dynamic, large-scale scenarios.
MAPPO: The Multi-Agent Proximal Policy Optimization (MAPPO) algorithm [
38] is an extension of the Proximal Policy Optimization (PPO) algorithm for multi-agent reinforcement learning, making it well-suited for environments involving both collaboration and competition among multiple agents. MAPPO employs a “centralized training, decentralized execution” policy architecture, allowing agents to learn collaboratively using shared information during the training phase. In the execution phase, however, each agent makes decisions independently based on its own local observations. This architecture balances the benefits of centralized learning for coordination with the flexibility of decentralized decision-making, thereby enabling effective performance in complex, dynamic environments involving multiple agents.
The selection of these baseline algorithms not only serves to validate the superior performance of the MADARL algorithm but also provides a foundation for exploring the applicability of various scheduling strategies in complex transportation environments. Comparative experiments with these baseline methods offer a clearer understanding of the MADARL’s performance in handling scenarios of varying sizes, complexities, and dynamics, while also highlighting the strengths and limitations of each algorithm under different conditions.
6.5. Analysis of Experimental Results
The selection of these baseline algorithms not only serves to validate the superior performance of the MADARL algorithm but also provides a foundation for exploring the applicability of various scheduling strategies in complex transportation environments. Comparative experiments with these baseline methods offer a more intuitive understanding of MADARL’s performance across different scenarios in terms of size, complexity, and dynamics. Additionally, these experiments highlight the strengths and weaknesses of each algorithm under varying conditions, thus offering valuable insights into their relative effectiveness and practical feasibility in large-scale, dynamic transportation systems.
As shown in
Table 2, in the 6000-vehicle task, MADARL achieved an Order Response Rate (ORR) of 87.95%, a Platform Cumulative Revenue (PCR) of 130.31, and a Composite Index (CI) of 10.81. Compared to DDPG (ORR: 77.5%, CI: 5.63) and MAPPO (ORR: 48.67%, CI: 2.37), MADARL demonstrated significantly superior performance, with higher resource scheduling efficiency and a stronger focus on global optimization, effectively reducing resource waste. As the vehicle fleet size increased, MADARL’s performance improved further. In the 8000-vehicle task, MADARL achieved a CI of 37.05, representing a 64.89% improvement over MASAC (CI: 22.47) and a 235% increase over MAPPO (CI: 11.06). In this scenario, MADARL also attained an ORR of 96.13% and a PCR of 143.4, significantly outperforming the other algorithms. These results demonstrate MADARL’s ability to efficiently handle complex supply–demand imbalances and optimize platform revenue.
In the 10,000-vehicle task, MADARL maintained its leading performance, with a Composite Index (CI) of 53.81, which is 73.74% higher than MASAC’s CI of 30.97 and 36.29% higher than MAPPO’s CI of 39.5. Furthermore, MADARL achieved an Order Response Rate (ORR) of 97.29%, surpassing MASAC’s 95.4% and MAPPO’s 96.34%. Additionally, MADARL recorded a Platform Cumulative Revenue (PCR) of 145.83, slightly exceeding MASAC’s 142.49 and MAPPO’s 144.56. These results indicate that MADARL not only excels in order response but also significantly enhances the platform’s overall revenue generation capacity, further demonstrating its effectiveness in large-scale scheduling scenarios.
The MADARL algorithm demonstrates exceptional performance in taxi scheduling tasks across various scales, leveraging its dual-attention mechanism and multi-agent collaboration strategy. It consistently outperforms other algorithms in key performance metrics, including Order Response Rate (ORR), Platform Cumulative Revenue (PCR), and Composite Index (CI), particularly excelling in large-scale scheduling scenarios. These results underscore MADARL’s robust optimization capabilities and its significant potential for wide-ranging applications. Furthermore, MADARL’s adaptability and distinct advantage in supply–demand optimization and resource scheduling efficiency highlight its effectiveness in addressing challenges within complex transportation environments.
Figure 7 illustrates the original supply–demand gap at 13:00 and the repositioned supply–demand gap for the same region. The region is divided into hexagonal grid cells, with each cell representing a spatial unit. The varying supply–demand gaps are represented by color gradients, with red indicating high demand and low supply, blue indicating low demand and high supply, and yellow representing a balanced supply–demand state. The black numbers in the figure indicate the specific supply–demand gap for each hexagonal cell.
Figure 7a shows the raw supply–demand gap without any repositioning measures. It is evident that demand significantly exceeds supply in several hexagonal regions in the lower left corner (colored red), while the rest of the region is predominantly blue, indicating that supply is higher than demand. In contrast,
Figure 7b illustrates the demand–supply gap after repositioning. The differences for each cell are also labeled by black numbers. The repositioning strategy, which reallocates idle vehicles from low-demand areas to high-demand areas, results in a more balanced overall supply–demand situation.
The values and color transitions in both figures clearly demonstrate the effective optimization effect of the MADARL algorithm on balancing supply and demand. Compared to the original supply–demand distribution, the repositioned plots show a significant reduction in the supply–demand gap in regions with high demand (e.g., the lower left corner), further validating the effectiveness of the repositioning strategy.
6.6. Ablation Experiments
The purpose of this ablation experiment is to verify the independent contributions of the local and global attention mechanisms in the MADARL algorithm. To achieve this, four experimental groups have been established to compare the effects of different attention mechanisms, providing insights into how each mechanism enhances the model’s performance in large-scale taxi fleet relocation tasks.
The four experimental groups are as follows:
(1) Control Group: This group serves as the baseline algorithm, without the implementation of any attention mechanism. It represents the standard model that does not incorporate attention mechanisms, providing a reference for evaluating the impact of the different experimental strategies.
(2) Experimental Group 1 (SA): In this group, the MADARL algorithm is improved by adding only the local attention mechanism to the baseline algorithm. This group allows us to observe the effect of focusing attention on local regions of the supply–demand space, which may improve the algorithm’s ability to respond to local variations in demand and supply.
(3) Experimental Group 2 (GC): This group incorporates only the global attention mechanism into the MADARL algorithm. The global attention mechanism allows the model to account for the overall distribution of supply and demand across the entire region, potentially optimizing the global scheduling strategy. This experiment helps to assess the impact of global attention on the model’s performance.
(4) Experimental Group 3 (SA-GC): This group represents the MADARL algorithm, which combines both the local and global attention mechanisms. It uses a hybrid dual-attention approach, which aims to optimize both local scheduling decisions and global supply–demand balance, reflecting the full capacity of the proposed MADARL algorithm.
The results of these experimental groups, as shown in
Table 3, provide a detailed comparison of the performance of the algorithm on different scales of the taxi fleet (6000, 8000, and 10,000 vehicles). By comparing the ORR, PCR, and CI for each group, we can visualize the relative performance of the MADARL algorithm with different attention mechanisms and determine the contributions of each attention mechanism to the overall scheduling effectiveness.
6.7. Analysis of Ablation Experiment Results
The experimental results for the baseline group indicate that both the Order Response Rate (ORR) and Platform Cumulative Revenue (PCR) increase as the system size grows. For instance, at a scale of 10,000 taxis, the ORR improves from 48.67% at 6000 vehicles to 96.34%, while the PCR rises from 121.94 to 144.56. However, the increase in the Composite Index (CI) is relatively modest, only rising from 2.37 to 39.5. This suggests that, although the baseline algorithm shows some improvement in handling a larger volume of orders, it does not lead to significant enhancements in overall scheduling efficiency and strategy optimization. Consequently, there remains considerable room for improvement in optimizing the scheduling process.
Experimental Group 1 (SA), which integrated the local attention mechanism, demonstrated substantial improvements across all evaluation metrics. In the 6000-vehicle task, the Order Response Rate (ORR) for SA increased from 48.67% in the baseline group to 83.82%, while the Platform Cumulative Revenue (PCR) rose from 121.94 to 122.26 and the Composite Index (CI) improved from 2.37 to 7.55. In the 10,000-vehicle task, SA achieved an ORR of 96.56%, a PCR of 144.42, and a CI of 41.98, all of which were significantly higher than the baseline group. These findings underscore the effectiveness of the local attention mechanism in enhancing the local supply–demand equilibrium and optimizing response efficiency, particularly in large-scale scheduling tasks.
Experimental Group 2 (GC), which incorporates the global attention mechanism, demonstrates a significant enhancement in scheduling performance across tasks of varying sizes. For instance, in the 8000-vehicle task, the Order Response Rate (ORR) improved from 87.35% in the baseline group to 94.37%, while the Platform Cumulative Revenue (PCR) increased from 140.03 to 142.17, and the Composite Index (CI) rose from 11.06 to 25.25. In the 10,000-vehicle task, the ORR further increased to 96.94%, the PCR reached 144.66, and the CI surged to 47.27. These results demonstrate that the global attention mechanism effectively optimizes the global supply–demand balance and enhances resource allocation efficiency, leading to improved overall scheduling performance.
Experimental Group 3 (SA-GC), which integrates both local and global attention mechanisms, demonstrated superior overall performance across all key metrics. Notably, in the 10,000-vehicle task, the Order Response Rate (ORR) reached 97.29%, and the Platform Cumulative Revenue (PCR) was 145.83, both of which surpass the performance of the other experimental groups. The Composite Index (CI) showed a substantial increase, rising from 39.5 in the baseline group to 53.81, reflecting an improvement of approximately 36.29%. These results underscore the efficacy of the dual-attention mechanism in synergistically combining local and global information, thereby enhancing response speed and resource allocation efficiency. This improvement is particularly pronounced in large-scale scheduling tasks, where the dual mechanism significantly boosts the overall system performance.
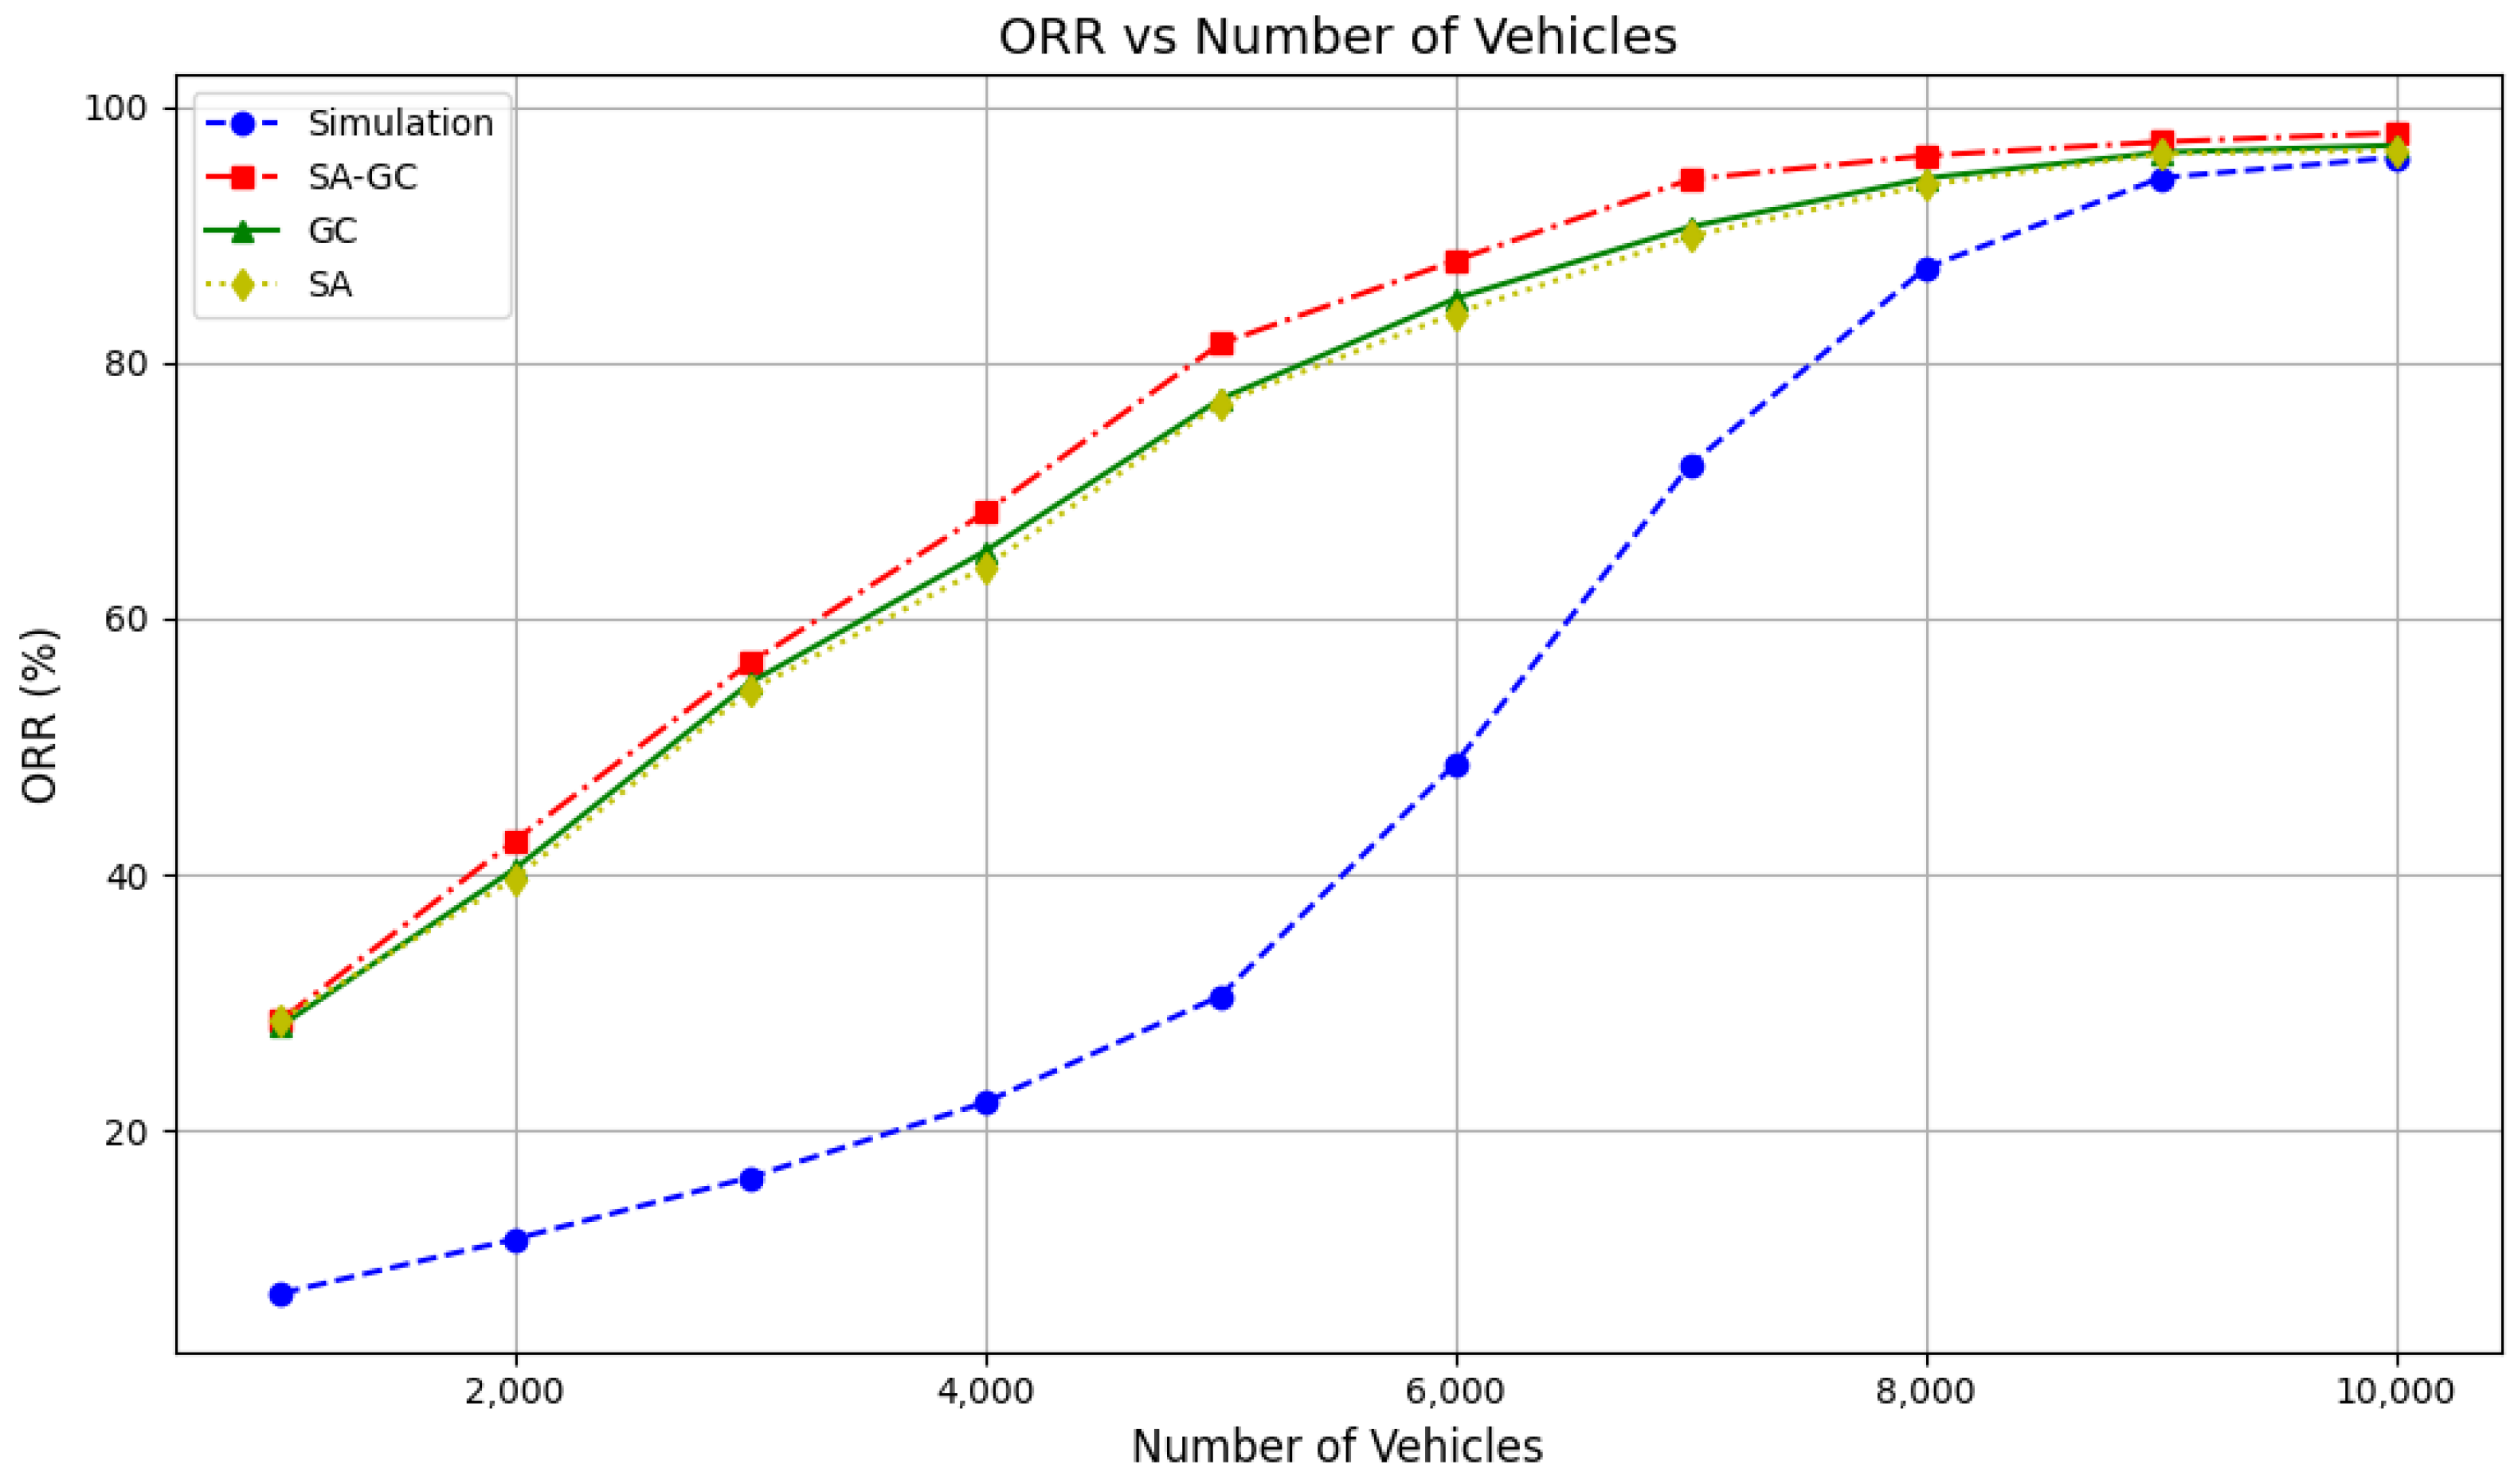
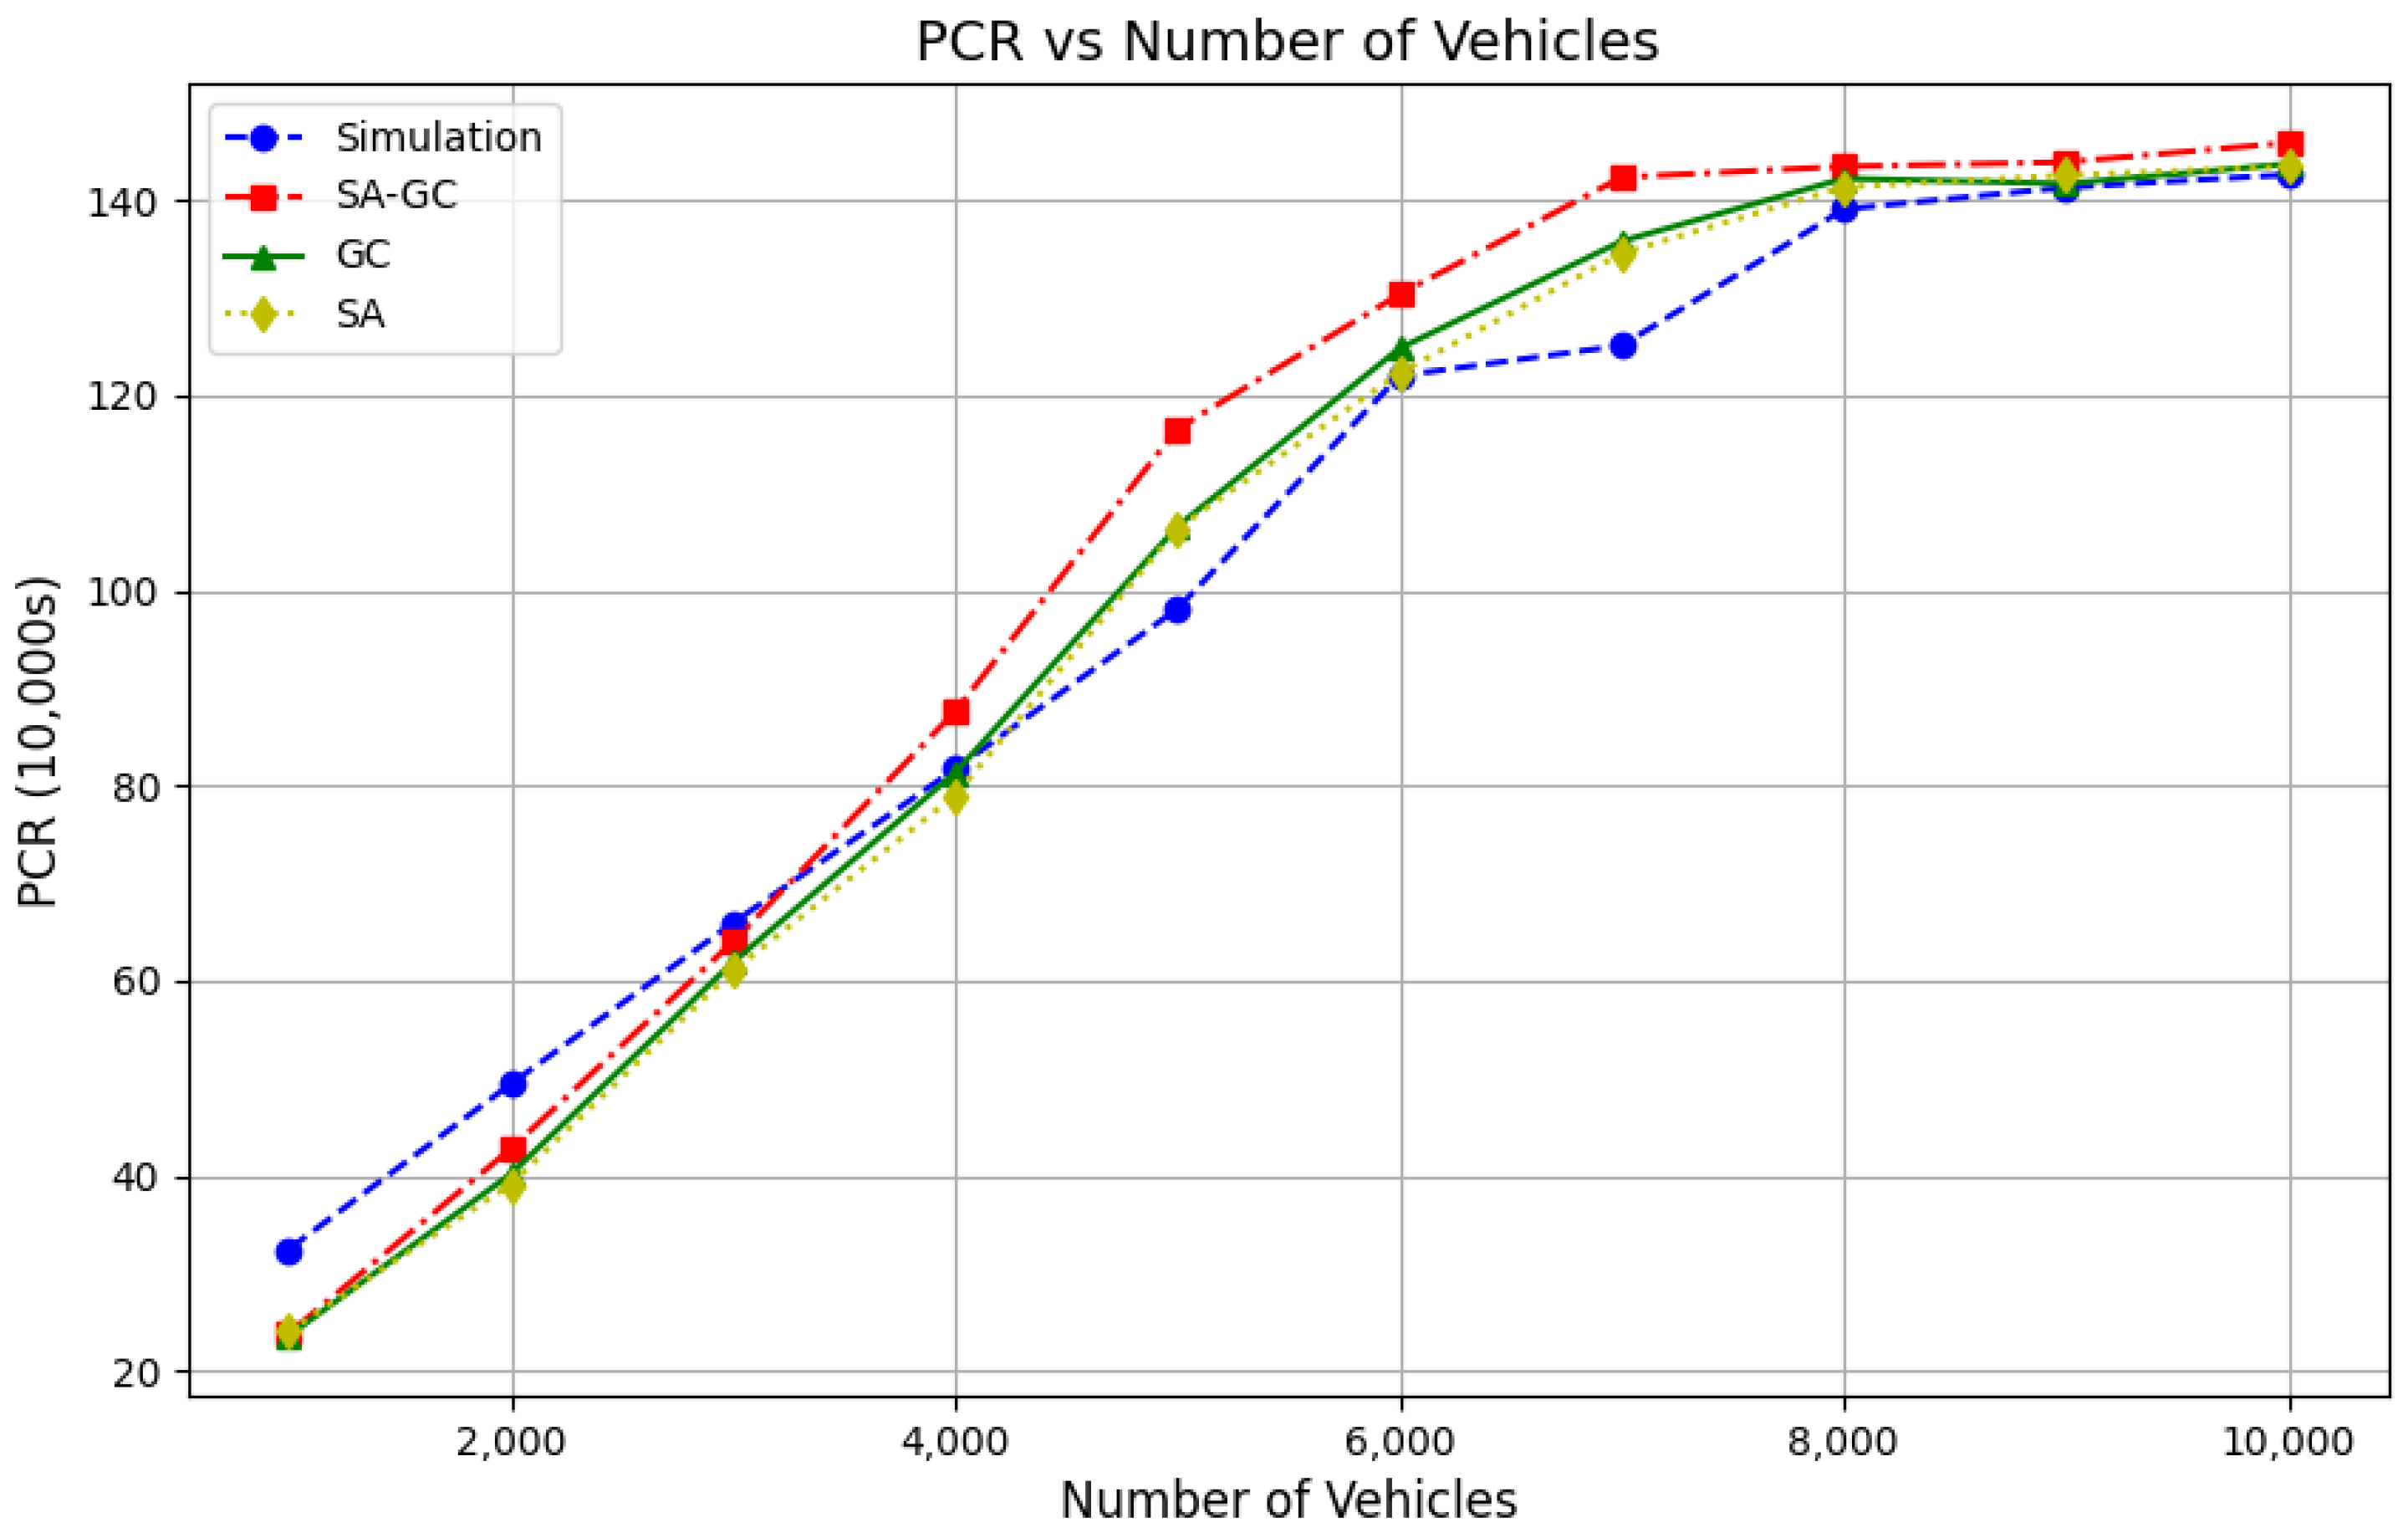
Figure 8 and
Figure 9 visually present the performance comparisons of the ablation experiments across different taxi fleet sizes, focusing on Order Response Rate (ORR) and Passenger Completion Rate (PCR), respectively.
Figure 8 highlights that the hybrid dual-attention mechanism (SA-GC), which integrates local and global attention mechanisms, achieves consistently higher ORR values compared to other configurations, especially in large-scale systems. This demonstrates the superior responsiveness and real-time adaptability of SA-GC in handling dynamic demands. On the other hand,
Figure 9 illustrates the Passenger Completion Rate (PCR), where SA-GC also outperforms other setups significantly, particularly as the number of taxis increases. This result validates the effectiveness of the dual-attention mechanism in balancing local and global information flows, optimizing resource allocation, and enhancing collaborative decision-making among agents. Together, these results confirm the robustness and efficacy of the MADARL algorithm in managing complex multi-agent transportation tasks.
7. Conclusions
Due to the increasingly severe issue of uneven traffic resource allocation, this paper proposed an innovative Taxi Dispatch and Empty-Vehicle Repositioning (TDEVR) framework to address the supply–demand imbalance in urban taxi systems. The framework adopted a dual-layer architecture, separating taxi matching from repositioning tasks through collaboration between the decision-making and execution layers. This design enabled dynamic perception and real-time response to complex supply–demand changes. Additionally, a Multi-Agent Dual-Attention Reinforcement Learning (MADARL) algorithm was proposed, which integrated local and global supply–demand information to optimize dispatch strategies, significantly improving scheduling efficiency and system performance.
Experiments on a large-scale taxi dataset from New York City showed that the MADARL algorithm achieved superior performance in order response rate, platform revenue, and composite indices, with high stability and efficiency in large-scale multi-agent tasks. Ablation studies further demonstrated the importance of local and global attention mechanisms in balancing information, enhancing scheduling accuracy, and improving system robustness.
In spite of the progress achieved in this study, there remains significant scope for further investigation. Model optimizations and multi-level attention mechanisms could be explored for more complex environments, and large-scale field testing could be carried out to validate generalizability and support intelligent transportation system development.


