Article

Thermal–Flow Coupling Simulation and Performance Analysis for Self-Starting Permanent Magnet Motors

1
School of Electrical and Electronic Engineering, Harbin University of Science and Technology, Harbin 150080, China
2
Instrument Science and Technology Postdoctoral Research Station, Harbin University of Science and Technology, Harbin 150080, China
3
National Engineering Research Center of Large Electric Machines and Heat Transfer Technique, Harbin University of Science and Technology, Harbin 150080, China
4
Shandong Lijiu Electrical Machinery Co., Ltd., Rushan 264500, China
5
Ulanqab Power Supply Branch of Inner Mongolia Electric Power (GROUP) Co., Ltd., Ulanqab 012000, China
*
Author to whom correspondence should be addressed.
Electronics 2025, 14(12), 2487; https://doi.org/10.3390/electronics14122487
Submission received: 17 May 2025 / Revised: 15 June 2025 / Accepted: 17 June 2025 / Published: 19 June 2025

Abstract

:
In practical applications, the fully enclosed structure is always required by self-starting permanent magnet synchronous motors for safety. However, internal heat dissipation can be obstructed as a result, which affects operational reliability. To resolve the issue, this study takes a 3 kW self-starting permanent magnet synchronous motor as the research object. Based on fluid dynamics and fluid solid coupling heat transfer theory, the model is reasonably simplified according to the characteristics of the structure of motor cooling, and basic assumptions and boundary conditions are given to establish a three-dimensional, whole machine solution domain model. The finite element method is used to numerically analyze and calculate under rated conditions. The fluid flow characteristics, heat transfer characteristics, motion trajectories of the cooling medium on the surface of the external casing, fan, and internal stator and rotor domains, and winding ends are analyzed. Therefore, the internal rheological characteristics and temperature rise distribution law of the self-starting permanent magnet synchronous motor can be revealed. Based on the aforementioned research, a novel method to design the wind spur structure on the surface of the rotor end is proposed. By comparing the simulation results of the fluid field and temperature field of the motor under wind spur structures with different lengths and equidistant distributions in the circumferential direction of the rotor end, the influence of the convective heat characteristics can be systematically studied. Lastly, the accuracy of the calculation results and the rationality of the solution method are verified through experiments of temperature rise, and the flow temperature distribution characteristics of the motor can be optimized by the wind spur structure, which can be used in practical applications.

1. Introduction

Self-starting permanent magnet synchronous motors are extensively utilized in intelligent manufacturing industries such as automotive processing, petrochemical industry, and coal mining due to their stability and reliable power. Compared with conventional permanent magnet motors, it does not require additional starting devices and has a high starting torque, so it is able to withstand complex working conditions such as frequent start–stop operations. However, the rotor integrates the starting cage and permanent magnet, resulting in a complex distribution of magnetic field. The compact design of mechanical structure inevitably increases the difficulty of heat dissipation, thus threatening its operational stability. Higher requirements for the motor performance is necessary, and it increases the difficulty of the optimization approaches. With the development of permanent magnet synchronous motors towards high power density, the rising temperature has become the main element limiting the progress in motor performance. Hence, accurately predicting the distribution of temperature rise is crucial for the optimization design of the cooling structure, and thus the safe and stable operation of the motor can be guaranteed [1,2,3].
At present, the most widely used research methods for temperature fields include the lumped parameter thermal network method, the numerical calculation-based finite element method, and the finite volume method. The former sets up a temperature field model for the motor by drawing an analogy between the thermal circuit and the electrical circuit, thus enabling the quick calculation of temperatures at key nodes. However, its calculation accuracy is limited by the number of nodes taken, and the overall temperature distribution of the motor cannot be obtained [4,5,6,7,8]. The finite element method can be applied in a broad variety of fields and can analyze various situations such as complex structures and large field gradient changes [9,10,11]. References [12,13,14,15,16] established a temperature field model of permanent magnet motors based on the thermal network method, achieving fast and accurate solution of the temperature field. Meanwhile, it analyzes the influence of the motor structure on temperature and optimizes it. However, the calculation results of the thermal network are average temperatures. For complex heat dissipation structures, the grid density needs to be increased to ensure accuracy, resulting in a decrease in calculation efficiency. References [15,16,17,18,19,20] established a fluid–thermal coupling field of permanent magnet synchronous motors based on the finite volume method for calculation, and analyzes the influence of motor structure on temperature rise. Three papers focus on temperature estimation methods for permanent magnet synchronous motors in different ways [21,22,23]. References [24,25,26] saw the establishment of Motor Model Based on Subdomain Method and Analysis–Optimization of Motor Performance.
Given the frequent start–stop operations of self-starting permanent magnet synchronous motors and the heat dissipation challenges posed by their fully enclosed designs, it is imperative to develop a comprehensive global thermal–flow coupling model. This study focuses on a 3 kW self-starting permanent magnet motor specifically designed for industrial robots. Leveraging the loss data and stator–rotor structural parameters, a three-dimensional global thermal–flow coupling model is constructed. With appropriate assumptions and well-defined boundary conditions, the finite volume method is utilized to numerically simulate and analyze the characteristics of both the internal and external fluid flow fields and temperature distributions of the motor under rated operating conditions.
To further enhance the internal heat dissipation efficiency, a novel circumferentially equidistant wind-finger structure is proposed and integrated onto the rotor surface. Using the established modeling and computational approach, the impact of varying wind-finger lengths on the internal fluid dynamics and overall temperature profile is systematically investigated. The contributions of this study can supply valuable theoretical references and practical guidance for optimizing the heat dissipation design of self-starting permanent magnet synchronous motors.

2. Materials and Methods

The self-starting permanent magnet synchronous motor adopts a fully enclosed structure design, and there is a complex coupling relationship between the internal and external fluid flow and temperature distribution.
According to the law of conservation of momentum, the rate of change in fluid momentum is equal to the resultant external force acting on the fluid. It can be expressed as follows:
F x p x + τ x x x + τ y x y + τ z x z = u ( ρ u ) x + ν ( ρ u ) y + w ( ρ u ) z + ( ρ u ) t F y p y + τ x y x + τ y y y + τ z y z = u ( ρ v ) x + ν ( ρ v ) y + w ( ρ v ) z + ( ρ v ) t F z p z + τ x z x + τ y z y + τ z z z = u ( ρ w ) x + ν ( ρ w ) y + w ( ρ w ) z + ( ρ w ) t
where F x , F y , and F z are the volume force components of the micro-element in the x , y , and z directions, with the unit of Pa; u , v , and w are the components of the velocity vector in the x and z directions; τ x x , τ x y , and τ x z are the components of the viscous force of τ x n directions of 4, 5, and 6, respectively. Similar variables follow the same rule, and the unit is Pa.
According to the law of conservation of energy, during the fluid flow process, the total energy including internal energy, kinetic energy, and potential energy remains unchanged in the absence of external energy exchange, which can be formulated as follows:
( ρ T ) t + div ( ρ u T ) = div ( k c P grad T ) + S T
where k is the thermal conductivity, with the unit of W / ( m K ) ; c p is the specific heat capacity, with the unit of J / ( kg K ) ; T is the temperature, with the unit of K ; S T is the mechanical energy converted into total heat energy by the internal heat source in the fluid due to viscous action.
x i ( ρ k u i ) = x j [ ( μ + μ t σ k ) k x j ] + G k Y k x i ( ρ ω u i ) = x j [ ( μ + μ i σ ω ) ω x j ] + G ω Y ω + D ω
where k is the turbulent kinetic energy, σ k is the Prandtl number corresponding to the turbulent kinetic energy, μ and μ t are the dynamic and turbulent viscosities, respectively, G k is the generation term of the turbulent kinetic energy caused by the average velocity gradient, ω is the dissipation rate, σ ω is the Prandtl number corresponding to the dissipation rate, G ω is the generation term of the specific dissipation rate, Y ω is the dissipation term of the specific dissipation rate, and D ω is the orthogonal divergence term.
According to the basic principles of heat transfer, when solving the steady-state temperature field of a self-starting permanent magnet synchronous motor in the Cartesian coordinate system, the three-dimensional heat conduction equation can be expressed as follows:
x ( λ x T x ) + y ( λ y T y ) + z ( λ z T z ) = q T n | S 1 = 0 λ n T n | S 2 = α ( T T l )
where λ x , λ y , and λ z are the heat transfer coefficients of various materials along the x , y , and z directions, respectively, with the unit of W / m K ; λ n is the heat transfer coefficient in the direction of n , with the unit of W / m K ; T is the temperature of the motor, with the unit of °C; q is the sum of all heat sources, with the unit of W / m 3 ; T l is the temperature of the surrounding fluid, with the unit of K ; α is the convective heat transfer coefficient, with the unit of W / ( m 2 K ) ; S 1 and S 2 are the adiabatic boundary and the convective heat transfer boundary.

3. Determination of the Solution Model

3.1. Basic Motor Parameters

A 3 kW self-starting permanent magnet motor for industrial robots is studied in this paper, and its parameters are shown in Table 1. In addition, this paper defines the material parameters based on the references and past empirical data. The type of silicon steel sheet used is DW350, and the parameters of various materials selected in this paper are displayed in Table 2. The motor structure is illustrated in Figure 1.

3.2. Ventilation and Heat Dissipation Structure

The motor interior is designed with a closed structure. The rotation of the iron web located between the rotor core and the bearing induces air movement within the motor, thereby enhancing convective heat transfer performance. Owing to the structural particularities of the casing, junction box, and fan in the self-starting permanent magnet synchronous motor, it is not feasible to simplify the three-dimensional modeling through symmetric and periodic boundary conditions. For precisely analyzing the flow–heat characteristics and underlying laws of the prototype while ensuring no impact on the calculation results, the following reasonable assumptions are proposed during the motor modeling process.
(1)
The fluid flow in the gap between the stator core and the casing is ignored, and it is assumed that the heat is only transferred through the casing by heat conduction.
(2)
Simplifying the windings, insulation, and their ends: Equivalent copper wires in the stator slots are used as solid conductors with the end coils straightened. After which, the insulation materials are incorporated into an integrated structure that tightly wraps the equivalent solid copper conductors.
(3)
The minor components of the motor are ignored, such as fixing holes, which have a weak impact on fluid heat transfer.
Based on the above assumptions and the basic structure parameters in Table 1, a three-dimensional, whole-domain model of the self-starting permanent magnet synchronous motor can be established. As shown in Figure 2, which includes the stator and rotor cores, permanent magnets, starting cages, windings and their insulation, fans, and casings.
As illustrated in Figure 3a, it is the fluid flow path of the prototype. Figure 3b shows the rotating fluid domain of the external centrifugal fan and the rotating fluid domain of the permanent magnet gap. It can be seen from Figure 3 that the motor cooling is mainly accomplished through the combined action of internal heat conduction and external forced convection. The internal ventilation is that the rotor drives the internal fluid to move circumferentially during the rotation process. However, due to the small axial pressure difference, the vast majority of the heat is conducted to the surface through solid paths such as the stator core and the casing. Externally, a forced air duct is formed by relying on the centrifugal fan to drive the air to flow through the heat dissipation fins on the casing, thereby further taking away the heat of the motor.

3.3. Basic Assumptions and Boundary Conditions

In accordance with the structural features and heat transfer characteristics, the following assumptions are proposed for the calculation of the motor flow and heat field by means of the finite volume method:
(1)
The effects of gravity and buoyancy on the internal and external fluid flow are neglected;
(2)
The flow velocities of the internal and external fluids of the prototype are much lower than the speed of sound, and the internal enclosed fluid and external fluid are regarded as incompressible fluids;
(3)
After the motor reaches a stable state, the fluid flow state is regarded as a steady flow;
(4)
The internal and external fluids are affected by the motor structure, and the Reynolds number is large, so a turbulent flow solution model is selected.
The temperature field of the prototype is solved by global flow and heat coupling for simulation calculation, and the boundary conditions set for the solution are:
(1)
The inlet and outlet of the external fluid field adopt pressure boundary conditions, and the pressure is one standard atmosphere;
(2)
The fluid–solid contact surfaces within the solution domain are all no-slip boundaries;
(3)
The multiple reference frame model is used to calculate the rotating fluid domain.

3.4. Mesh Generation

Mesh quality directly affects computational efficiency and solution accuracy. Figure 4 shows the mesh generation of the prototype’s full-scale physical model, based on the established assumptions and boundary conditions. This strategy keeps the total mesh count at 6.54 million with a maximum skewness of 0.62, reducing computational resource usage and providing a solid basis for accurate simulations. The hybrid mesh strategy is shown in Table 3.

3.5. Heat Generation Rate

The heat generation rate refers to the heat generated per unit volume per unit time. The heat generation rate of the motor can be calculated from the loss values and volume of each structure. Based on the time-step finite element method, this paper conducts a two-dimensional electromagnetic field simulation analysis of the motor under rated operating conditions. The losses of each structure of the motor obtained are illustrated in Table 4.

4. Thermal–Flow Coupled Field Calculation and Analysis

Based on the established 3D prototype model, and under the basic assumptions and boundary conditions, Fluent is utilized to calculate the full-domain fluid and temperature distribution of the motor under rated operating conditions by means of the finite volume method.

4.1. Analysis of Fluid Field Characteristics

4.1.1. Analysis of Internal Fluid Flow Characteristics

Figure 5 illustrates the streamline of the three-dimensional fluid field within the self-starting permanent magnet synchronous motor. It can be observed that the closed structure renders the flow field with axial symmetry characteristics. The maximum velocity of the internal fluid is about 8 m/s, concentrating at the end of the air gap. As the distance between the fluid and the rotating wall increases, the flow velocity quickly decreases to zero. From the enlarged view of the end part, eddy currents emerge at the end of the air gap, which will result in an increase in additional windage and friction losses.
Figure 6 shows the velocity distribution contour plot and streamline plot of the circumferential cross-section of the motor. The air velocity on the surface of the rotor basically coincides with the linear velocity of the rotor rotation. As the radial distance increases, the fluid velocity shows a characteristic of gradient attenuation. This is mainly due to the mechanical energy loss caused by the fluid viscous dissipation effect. In addition, the air velocity at the ends of the air gap between the permanent magnets and the air gap between the stator and the rotor will change significantly. The primary reason for this phenomenon is that when the air flow passes through the corner positions inside the motor, due to the influence of the structural shape, additional lateral flow will occur. This secondary flow is like the vortex generated when water flow encounters a reef, driving more air to pass through the edge area quickly.
Figure 7 shows the fluid streamline and contour map of the winding end. It can be observed from the figure that the rotation of the motor rotor drives the internal air flow, giving the fluid in the winding end gap a certain flow velocity. However, the overall flow velocity is small and the distribution is uneven. The main reason for this unevenness is that the tangential velocity of the rotating fluid exceeds the radial velocity. When the fluid impacts the winding end, under the influence of the Coanda effect, most of the fluid changes its flow direction along the surface of the winding, forming a spiral trajectory with an expanded outer diameter.
Based on the above comprehensive analysis, the flow characteristics of the fluid field inside the prototype are complex. Turbulence and vortices are generated at the ends on both sides of the air gap due to the sudden structural change, which not only wastes energy but also increases additional frictional losses. The enclosed housing design restricts the axial flow of air, resulting in a relatively low overall wind speed in the end region. At the same time, the ends of the winding coils are driven by the rotation of the rotor, and their velocity distribution is non-uniform. These factors overlap with each other, making it difficult for the heat to be effectively carried away by the air flow, thus affecting the heat dissipation effect.

4.1.2. Analysis of External Fluid Flow Characteristics

Due to the enclosed structure of the self-starting permanent magnet motor, its heat dissipation capacity is more dependent on the external fluid flow. The prototype mainly relies on the rotation of the external fan to make the external fluid flow axially through the cooling fins and carry away the heat. In order to specifically analyze the distribution of the external fluid, Figure 8 shows the velocity streamline diagram of the entire external fluid.
On Figure 8, the external fluid flow can be divided into three stages: When the fan rotates at a high speed, a local low-pressure area is formed in the central area of the blades due to the centrifugal force, causing the nearby fluid to flow axially into the fan. Subsequently, under the acceleration of the fan, the fluid is quickly thrown out and collides with the inner wall of the wind cover, and the flow direction changes to axial. Under the guiding effect of the wind cover, a uniform and stable fluid flow is formed towards the wind grooves between the heat dissipation fins. Finally, most of the fluid flows along the direction of the heat dissipation fins, and a small amount of fluid flows away radially from the motor after leaving the fan cover. Thus, the speed at the end of the heat dissipation fins has dropped to less than 2 m/s.
Figure 9 shows the fluid velocity vector diagram of the centrifugal fan and the ventilation grooves on the surface of the casing. From Figure 9a, it can be seen that after the fluid enters the ventilation grooves of the heat dissipation fins, due to the reduction in the duct space and the tangential velocity provided by the fan, the flow velocity increases rapidly, reaching a maximum of 8.5 m/s and close to one side of the heat dissipation fins. After entering the ventilation grooves, the flow velocity progressively decreases as the axial length increases. The junction box blocks the air flow, resulting in a wake flow nearby, and there is basically no flow velocity on its leeward side. From Figure 9b, it can be seen that under the push of the fan blades, the fluid is continuously accelerated, gradually overcoming the centrifugal force and flying away from the fan, forming a spiral trajectory that diffuses outwards, and reaches the maximum linear velocity of 12 m/s at the outer edge of the blades.
To deeply study the axial distribution law of the fluid parameters in the ventilation grooves of the heat dissipation fins, considering the symmetry of the casing, the ventilation groove corresponding to the center position of the junction box is selected, and an axial through-type sampling line is set at the center 1.5 mm away from the casing. Then, 8 ventilation grooves are sequentially selected along the circumferential direction, and in the same way, a sampling line is set in each ventilation groove, forming a total of 8 sampling lines. Among them, the first sampling line is marked as Line B, and the subsequent ones are marked as Line C, Line D, Line E, Line F, Line G, Line H, and Line I in sequence. The positions of the 8 sampling lines and their axial velocities are shown in Figure 10.
As can be seen from Figure 10, the sampling lines can be divided into sampling lines B, C, and D that pass through the junction box, and sampling lines E, F, G, H, and I that do not pass through the junction box. When all sampling lines enter the ventilation duct, due to the reduction in their tangential velocity components and flow area, the flow velocity increases, gradually decreases after stabilization, and then rises slightly. When the sampling lines passing through the junction box encounter the obstruction of the junction box, the flow velocity drops rapidly. The sampling lines that do not pass through the junction box also gradually decrease in flow velocity due to frictional losses. This is because the position of the symmetry center causes the fluid to encounter greater resistance here. The flow velocities of sampling lines C, D, H, and I in the first half are higher than those of the other sampling lines. Sampling lines C and D are not on the symmetry line where the junction box is located, so they are less affected by the fluid pressure on both sides. Sampling lines H and I are out of the influence of the junction box on the entire fluid field and return to the flow velocity of other normal ventilation ducts.
Through the analysis of the fluid field outside the motor mentioned above, the external structure of the motor makes the distribution of the entire fluid field more complex. The combined effect of the fan structure and the convex structure on the motor surface leads to changes in the fluid trace lines and energy dissipation. These factors significantly influence the temperature distribution of the motor.

4.2. Analysis of Temperature Field Characteristics

According to the rated loss data of the prototype shown in Table 3, convert it into the internal heat source per unit volume. Use Fluent to solve the steady-state temperature of the fluid–heat coupling model of the prototype, and finally obtain the temperature distribution of the entire prototype. The specific results are illustrated in Figure 11.
In Figure 11, the temperature of the motor casing is distributed in a gradient along the axial direction. The temperature is the highest, about 74.0 °C, at the contact point between the air outlet side and the stator core, while the temperature at the air inlet side is the lowest, about 42.0 °C. This indicates that the motor reduces the casing temperature through axial air cooling. However, due to the limited axial movement of the fluid, heat accumulates near the stator core. The overall maximum temperature of the motor is about 91.0 °C, which occurs in the armature winding area, indicating that the winding end becomes the main heat source due to high copper loss. In addition, according to the fluid field analysis of the winding end in Figure 7, this area is affected by the Coanda effect, resulting in low flow velocity and poor heat dissipation.

4.2.1. Analysis of the Temperature Distribution Characteristics in the Stator Area

Figure 12 shows the temperature distribution of the stator core and winding of the prototype. In Figure 12a, the temperature of the stator core first increases significantly and then decreases slightly along the axial direction from the fan side to the air outlet side, with a maximum temperature difference of about 20 °C at both ends. Due to the obstruction of the junction box to the air duct, the temperature at the direct contact between the stator core in the dashed box position and the casing is higher than that in the surrounding area. The temperature of the stator core gradually increases inward along the radial direction. The position with the highest temperature is the tooth of the core corresponding to the junction box in the radial direction, about 77.0 °C, and the position with the lowest temperature is the outer side of the stator core near the fan side, about 56.2 °C. This shows that compared with the heat transfer in the radial direction of the core, the heat dissipation effect of the fluid at both ends inside the motor is relatively small.
In Figure 12b, the temperature change law of the stator winding in the axial direction is roughly opposite to that of the stator core. The temperature of the stator winding decreases first and then increases in the axial direction. The temperature of the winding at the end is higher than that of the winding in the stator core section. The highest temperature occurs at the end of the winding corresponding to the junction box in the radial direction, about 91.0 °C, and the lowest temperature of the winding is at the middle position of the winding in the stator core section, about 85.2 °C. This further indicates that the heat exchange capacity of the air at the winding end is much lower than that of the stator core.
For a further analysis of the temperature distribution in the stator area of the prototype, 2 radial and 11 axial sampling lines are set in the stator core and winding areas, respectively. The teeth and windings at the middle radial corresponding position of the terminal box are marked as the initial counting positions. The centers of 11 windings are selected in a clockwise order as the 11 axial sampling lines (T1–T11), with the 2 radial sampling lines as the core (Z1, Z2). The specific sampling positions and results are illustrated in Figure 13 and Figure 14.
In Figure 13, for all windings, the temperature along the axial direction first decreases slightly and then gradually increases from the air inlet side to the air outlet side, forming a significant saddle-shaped distribution curve. The temperature of the windings on the air inlet side is about 1.8 °C lower than that on the air outlet side as a whole, further indicating that the heat dissipation capacity of the end air gap is limited. As the winding moves away from the position corresponding to the radial direction of the terminal box, the winding temperature gradually decreases, and the cooling range first increases and then decreases. Until the windings correspond to sampling lines T10 and T11, the temperature difference between adjacent windings approaches zero. This indicates that this area has been out of the influence range of the terminal box on the winding temperature.
In Figure 14, the temperature change in the stator core is uniform, and the overall trend of its temperature gradually decreases along the radial direction. This is because the contact area between the winding and the stator teeth is large, and most of its heat is transferred radially through the teeth. The radial temperature inside the winding is basically unchanged, while the temperature change at the insulation part is relatively large. The reason is that the thermal conductivity of the insulating material is extremely low and cannot transfer the heat out in time.

4.2.2. Analysis of the Temperature Distribution Characteristics in the Rotor Region

Figure 15 illustrates the temperature distribution nephogram of the prototype rotor core. From the figure, the rotor temperature increases axially from the air inlet side to the air outlet side. The highest temperature is located at the contact between the air outlet side and the starting cage, approximately 72.4 °C, and the lowest temperature is located at the contact between the air inlet side and the rotating shaft, approximately 66.9 °C. This is mainly because most of the heat generated by the rotor is transferred through the fluid. At the end of the air inlet side, the heat exchange between the air and the casing can effectively dissipate the heat. However, as the axial length increases, the air velocity on the surface of the casing decreases, and the heat dissipation capacity of the air at the end of the air outlet side weakens, resulting in a higher rotor temperature at the air outlet side. In the radial direction, the rotor temperature shows an increasing trend from the center of the rotating shaft outwards, with a maximum radial temperature difference of approximately 2 °C. This is mainly because the rotating shaft takes away part of the heat, making the temperature in the area close to the center of the rotating shaft relatively low.
On Figure 16, the temperature distributions of the prototype permanent magnet and the starting cage. From the figure, the temperature change trends of the permanent magnet and the starting cage are basically the same. The temperature gradually increases along the axial direction, and the temperature difference is about 3 °C. This is consistent with the reason for the axial change in the rotor core temperature. The heat dissipation capacity of the casing on the air inlet side is higher than that on the air outlet side. On the air inlet side, the temperature of the starting cage is slightly higher than that of the permanent magnet, while on the air outlet side, they are basically the same. This is because the permanent magnet is close to the shaft area, and its heat dissipation capacity is relatively stronger.
For a more in-depth analysis of the temperature distribution within the rotor, one axial sampling line is set in the permanent magnet and the starting cage, respectively, and four axial sampling lines are set on the rotor core. The positions of the sampling lines and the sampling results are shown in Figure 17.
In Figure 17, the overall temperature gradient of the rotor core is 4.5 °C. The highest temperature point is on the rotor outer surface, which is the air outlet side area, at approximately 72.3 °C. The lowest temperature point is distributed at the interface between the rotor on the air inlet side and the shaft, approximately 67.8 °C. When at the axial central cross-section of the rotor, the temperature difference between all sampling lines is the smallest, about 0.5 °C. The closer to the two ends of the rotor, the greater the temperature difference, and the temperature difference range on the air inlet side is larger than that on the air outlet side. This is because forced convective heat transfer occurs in the air at the ends on both sides of the rotor, and the shaft and the casing can conduct heat dissipation, with the heat dissipation capacity on the air inlet side greater than that on the air outlet side. The temperatures of sampling lines L1 and L2 decreased at a position 25 mm away from the air outlet side. The decrease amplitude of sampling line L1 is slightly larger than that of sampling line L2, while the other sampling lines continue to increase axially. This is because sampling line L1 is closer to the shaft than L2, and the contact heat transfer coefficient between the shaft and the casing is significantly higher than the convective heat transfer coefficient of the end air, making the heat dissipation capacity in the near-shaft area relatively stronger. It can be seen from the enlarged view that the temperatures on sampling lines L5 and L6 are basically the same, indicating that the cast aluminum conducting bars have a large heat dissipation capacity, making their temperature distribution more uniform.
To effectively improve the operating efficiency and reliability of the motor, it is necessary to conduct an in-depth analysis of the heat dissipation performance of its different structural regions. Through systematic monitoring and data analysis, the thermal distribution characteristics of each key part of the motor are obtained. The average temperatures of different structural regions of the specific motor are shown in Table 5

5. Analysis of the Cooling Performance of Different Air Cooling Schemes

From the analysis results of the fluid–thermal coupled field of the self-starting permanent magnet synchronous motor mentioned above, it can be seen that the fluid flow ability in the internal end cavity is weak, and the fluid velocity in the air domains on both sides of the stator and rotor cores is basically zero. Most of the heat generated by the motor is transferred through convective heat transfer between the stator core and the housing. In particular, the heat concentration of the armature winding at the position corresponding to the radial direction of the junction box is relatively obvious, indicating that the air heat dissipation capacity at its end is poor.
From the analysis of the fluid field inside the motor mentioned above, due to the flat side of the rotor, a boundary layer is formed by the fluid near the surface during rotation, and there is a certain flow velocity. However, as the distance from the rotating surface increases, the flow velocity quickly drops to zero. This is because the fluid lacks disturbance, resulting in a rapid attenuation of the flow velocity and the inability to form turbulence. According to the classical fluid mechanics theory, a common method to increase the air flow at both ends of the rotor is to install a fan inside. For a forced-air-cooled motor with a closed structure, an axial or centrifugal fan can be installed on the rotating shaft to increase the wind pressure or change the internal air flow direction and improve the internal cooling effect. However, for the self-starting permanent magnet synchronous motor studied in this paper, due to the compact axial structure and limited end space, the method of installing a fan is not applicable.

5.1. Scheme Overview

For the closed-type motor structure studied in this paper, under the premise of taking into account the compact internal space and without changing other structures, by setting up wind-finger structures at both ends of the rotor, the intensity of internal air turbulence can be enhanced, thereby improving the heat dissipation capacity of the end cavity area. The rotor structure after adding the wind thorns is shown in Figure 18.
The structural parameters of the air spikes not only affect the distribution characteristics of the internal flow field and temperature field of the motor, but they may also have an impact on the operational stability of the motor. When the number of air spikes is too large, the wakes of adjacent air spikes will interfere with each other, resulting in an increase in windage and friction losses as well as an intensification of vibration and noise. When the length of the air spikes is too long, in addition to the above problems, there may also be a risk of fracture due to insufficient structural strength. Conversely, if the number or length of the air spikes is insufficient, the heat dissipation effect cannot be effectively enhanced, and it may even lead to an abnormally large mechanical loss.
Considering the interference of the air flow between the air spikes, the structural strength of the rotor, as well as the size of the motor rotor and the length of the end cavity, based on the installation of 12 air spikes on each side of the rotor, the effects of air spike lengths of 0 mm, 5 mm, 10 mm, 15 mm, and 20 mm on the fluid field and temperature field inside the motor are studied.

5.2. Comparison of Simulation Results on Different Schemes

(1)
Influences of the heat dissipation structure on the motor fluid field:
Under the rated operation condition of the motor, the fluid fields inside the motor corresponding to the above five fin lengths can be solved. Due to the closed structure, the internal fluid field has symmetry, and one-quarter of the end cavity part is taken for analysis. The results are shown in Figure 19.
In Figure 19, during the operation of the motor, the length of the air burr has a significant impact on the fluid flow in the motor end cavity. As the length of the air burr increases, the position of the vortex in the end cavity moves towards the two ends, the area of the vortex continues to increase, and the center of the vortex is always at the end of the air burr. It is because the increase in the length of the air burr leads to an increase in the radial distance between the end of the air burr and the winding end, weakening the obstruction of the winding to the rotating air flow, and more fluid is driven to rotate, thus expanding the area of the vortex.
In order to analyze the influence law of the air scoop on the air flow velocity in the end cavity more intuitively, Table 6 lists the data of the average air flow velocity and the maximum air flow velocity in the end cavity under different air scoop lengths. It can be seen from the data in the table that as the air scoop length increases, the average air flow velocity in the end cavity significantly increases from 0.2 m/s to 0.83 m/s, with an increase rate of 4.15 times; the maximum air flow velocity also jumps from 7.51 m/s to 8.12 m/s, an increase of approximately 8.12%. Among them, with the increase in the air scoop length, the increase rates of both the average air flow velocity and the maximum air flow velocity in the end cavity first increase and then decrease. This indicates that although extending the air scoop length can effectively increase the air flow velocity in the end cavity as the air scoop length increases, when the radial distance between the end of the air scoop and the winding increases to a certain extent, the resistance encountered by the air flow gradually decreases, resulting in a gradual saturation of the velocity increase.
(2)
Influences of Heat Dissipation Structure on the temperature field of the motor:
Figure 20 illustrates the temperature distribution of the axial cross-section of the motor under five kinds of fin lengths.
As can be seen from Figure 20, the length of the air burr has a considerable influence on the area of the high-temperature region at the end of the winding. When the length of the air burr increases from 0 mm to 10 mm, the maximum temperature drops from 88.18 °C to 87.06 °C, and the area of the high-temperature region is significantly reduced. When the length of the air burr is further increased, the reduction range of the area of the high-temperature region gradually decreases. When the length of the air burr is 5 mm or less, the area of the high-temperature region does not change much, and the temperature gradient difference between the inlet and outlet end chambers becomes obvious. As the length of the air burr increases, the temperature gradient of the two end chambers gradually decreases, and the temperature distribution becomes more uniform, but the average temperature of the outlet end chamber is always higher than that of the inlet end chamber. This phenomenon is consistent with the upward trend of the average flow velocity in the end chamber in Table 6, indicating that the air burr effectively enhances the convective heat transfer capacity of the winding end by strengthening the air flow disturbance in the end chamber. However, when the length of the air burr exceeds a certain length, the temperature improvement effect also tends to saturate.
In order to further explore the influence of the length of the air burr on the temperature of the winding end, starting from the winding end corresponding to the center of the junction box in the radial direction, 12 winding ends are selected in a clockwise direction to record their average temperature. The positions of the sampling points are shown in Figure 13, and the sampling results are shown in Figure 21.
As can be seen from Figure 21, the length of the air spines has a relatively weak impact on the temperature of the winding end at the air outlet side near the junction box, but it has a significant effect on the heat dissipation of the winding end in the area far from the junction box. When the length of the air spines is 5 mm, the temperature of the winding end is recorded to be approximately 0.6 °C lower than that without air spines. As the length further increases, the cooling amplitude gradually weakens. Especially when the length of the air spines reaches 20 mm, the temperatures of all recorded winding ends rise to some extent. This is consistent with the previous conclusion that the cooling effect of the rear cavity tends to saturate when the length of the air spines exceeds the critical value, indicating that an appropriate length of the air spines is more conducive to the heat dissipation of the motor.
Table 7 shows the average temperature of the motor structural components under different wind-finger lengths. As can be seen from the table, with the increase in the wind-finger lengths, the temperature gradually decreases, but the rate of temperature decrease also gradually shrinks. On the other hand, this also confirms the results of the above analysis. Therefore, it is not the case that the longer the wind-finger lengths, the more conducive it is to the reduction in motor temperature. An appropriate wind–finger length plays an important role in the temperature reduction in the motor structural components.

5.3. Experimental Verification

To verify the correctness of the above fluid–thermal coupling model of the self-starting permanent magnet synchronous motor, experiments are carried out on a 3 kW self-starting permanent magnet motor for industrial robots. The temperature sensor Pt100 thermistor was embedded at a specific temperature measuring position, the prototype was operated under the rated load condition, and the temperature data was recorded synchronously. The experimental platform and the positions of the sampling points are shown in Figure 22. Among them, the temperature measuring points E1 and F1 are located at the winding end and the stator slot opening corresponding to the closest radial direction of the junction box, while the temperature measuring points E2 and F2 are located at the winding end and the stator slot opening corresponding to the farthest radial direction of the junction box. The temperature measurement results are shown in Table 8. It can be seen from the table that the experimental temperature results are about 2–3 °C lower than the model calculation results. This is due to the errors caused by the assumed conditions in the modeling process, and it meets the requirements of engineering practice. It proves the correctness of the fluid–thermal coupling solution model and solution method established in this paper.

6. Conclusions

This study takes a 3 kW-self-starting permanent magnet motor for industrial robots as an example. The global thermal–flow coupling model is established, and the internal and external fluid fields of the motor and the temperature distribution of the stator and rotor structure are analyzed. Rotor air baffles with different lengths and circumferentially equidistant distribution are designed, and the effects on the internal fluid field and the temperature distribution of the motor are studied. The following conclusions can be drawn:
(1)
The enclosed design restricts the axial flow of air, resulting in a generally low wind speed in the two end cavity regions inside the motor. This makes the heat conduction ability between the stator core and the casing stronger than the convective heat transfer ability between the end cavity fluid and the casing, thus causing the temperature of the winding end to be higher than that of the winding in the stator core section.
(2)
The junction box structure on the surface of the motor casing can change the flow direction of part of the external fluid, making the temperatures of the winding end and the stator core at the radial corresponding position of the junction box higher than those at other positions with the same structure.
(3)
The heat transfer coefficient between the rotating shaft and the casing is much higher than the convective heat transfer coefficient between the internal end cavity and the casing, making the temperature of the rotor core near the rotating shaft lower.
(4)
The air baffles effectively enhance the convective heat transfer ability of the winding end by strengthening the air flow disturbance in the end cavity. On the contrary, when the length of the air baffle exceeds a certain length, the increase rate in the air flow velocity in the end cavity will slow down, and the temperature improvement effect will also tend to saturate.

Author Contributions

Methodology: J.L.; validation: J.L. and Y.Z.; software: Y.S.; writing—review and editing: Y.S. and M.W. All authors have read and agreed to the published version of the manuscript.

Funding

This work was supported by the Fundamental Research Foundation for Universities of Heilongjiang Province (2021-KYYWF-0749 and 2021-KYYWF-0746).

Data Availability Statement

Data are contained within the article.

Conflicts of Interest

Author Jinhui Liu was employed by the company Shandong Lijiu Electrical Machinery. Author Yang Zheng was employed by the company Ulanqab Power Supply Branch of Inner Mongolia Electric Power (GROUP). The remaining authors declare that the research was conducted in the absence of any commercial or financial relationships that could be construed as a potential conflict of interest.

References

  1. Liang, D.; Zhu, Z.Q.; Shao, B.; Feng, J.; Guo, S.; Li, Y.; Zhao, A. Tracking of Winding and Magnet Hotspots in SPMSMs Based on Synergized Lumped-parameter and Sub-domain Thermal Models. IEEE Trans. Energy Convers. 2022, 37, 2147–2161. [Google Scholar] [CrossRef]
  2. Tovar-Barranco, A.; Lopez-De-Heredia, A.; Villar, I.; Briz, F. Modeling of End-Space Convection Heat-Transfer for Internal and External Rotor PMSMs with Fractional-Slot Concentrated Windings. IEEE Trans. Ind. Electron. 2021, 68, 1928–1937. [Google Scholar] [CrossRef]
  3. Bo, W.; Jun, H.; Zha, C. Thermal Analysis of Multiple 3-Phase Fractional Slot Concentrated Winding Fault Tolerant Machine with Turn Fault. Trans. China Electrotech. Soc. 2023, 38, 5101–5111. [Google Scholar]
  4. Guo, Y.; Xu, R.; Jin, P. A real-time temperature rise prediction method for PM motor varying working conditions based on the reduced thermal model. Case Stud. Therm. Eng. 2023, 47, 103098. [Google Scholar] [CrossRef]
  5. Shi, Y.; Wang, J.; Wang, B. EM-Thermal Coupled Simulation Under Various Fault Conditions of a Triple Redundant 9-Phase PMASynRM. In Proceedings of the 2018 IEEE Energy Conversion Congress and Exposition, Portland, OR, USA, 23–27 September 2018; pp. 23–27. [Google Scholar]
  6. Li, J.; Li, H.; Zhang, Z.; Li, L.; Wang, Y.; Liao, C. Research on Fluid-Solid Coupling Heat Transfer and Optimization of Heat Dissipation in the Aircraft Oil-Cooled Wound Rotor Synchronous Generator. Trans. China Electrotech. Soc. 2024, 39, 7030–7044. [Google Scholar]
  7. Yu, Z.; Hu, X.; Li, Y.; Jing, Y.; Wang, J. Application Analysis of Novel Forced Air-Cooled in Outer Rotor Surface-mounted PMSM with High Power Denisity. Trans. China Electrotech. Soc. 2023, 38, 6668–6678. [Google Scholar]
  8. Cavazzuti, M.; Gaspari, G.; Pasquale, S.; Stalio, E. Thermal management of a Formula E electric Motor: Analysis and Optimization. Appl. Therm. Eng. 2019, 157, 113733. [Google Scholar] [CrossRef]
  9. Nasiri-Zarandi, R.; Farahzadi, M.; Sedigh Toulabi, M. Thermal Modeling of an Outer Rotor PM Assisted SynRM for the Electric Bike Applications Using a New 3-D LPTN. IEEE Trans. Transp. Electrif. 2025, 11, 6060–6073. [Google Scholar] [CrossRef]
  10. Shi, W.; Luo, K.; Zhang, Z. On-Line Temperature Estimation of Permanent Magnet Motor Based on Lumped Parameter Thermal Network Method. Trans. China Electrotech. Soc. 2023, 38, 2686–2697. [Google Scholar]
  11. Han, J.; Bian, X.; Guo, D.; Qi, H.; Ge, B. Coupled Magneto-Thermal Analysis of Spoke-Type Interior Permanent Magnet Synchronous Motor Under the Overload Condition Considering PM Demagnetization. IEEE Trans. Transp. Electrif. 2025, 11, 53–62. [Google Scholar] [CrossRef]
  12. Han, B.; Liu, X.; Huang, Z.; Zhang, X.; Zhou, Y. Loss Calculation, Thermal Analysis, and Measurement of Magnetically Suspended PM Machine. IEEE Trans. Ind. Electron. 2018, 65, 4514–4523. [Google Scholar] [CrossRef]
  13. Du, Y.; Peng, F.; Guo, B.; Djelloul-Khedda, Z.; Huang, Y. Two-dimensional Semi-Analytical Steady-State Thermal Model of Permanent Magnet Machines with Water-Cooled Structure. IEEE Trans. Transp. Electrif. 2024, 10, 9226–9235. [Google Scholar] [CrossRef]
  14. Nategh, S.; Wallmark, O.; Leksell, M.; Zhao, S. Thermal Analysis of a PMaSRM Using Partial FEA and Lumped Parameter Modeling. IEEE Trans. Energy Convers. 2012, 27, 477–488. [Google Scholar] [CrossRef]
  15. Ma, S.; Li, Y.; Hao, X.; Zhang, B.; Feng, W. Fast Temperature Calculation Method for Spindle Servo Permanent Magnet Motors Under Full Operating Conditions Based on the Thermal Network Method. Electronics 2025, 14, 815. [Google Scholar] [CrossRef]
  16. Li, X.; Zhang, X. Electromagnetic Design and Analysis of a Stator–Magnet Transverse Flux Linear Oscillatory Machine with Yokeless Mover Core. Electronics 2024, 13, 2495. [Google Scholar] [CrossRef]
  17. Zhou, H.; Wang, X.; Zhao, W.; Liu, J.; Xing, Z.; Peng, Y. Rapid Prediction of Magnetic and Temperature Field Based on Hybrid Subdomain Method and Finite-Difference Method for the Interior Permanent Magnet Synchronous Motor. IEEE Trans. Transp. Electrif. 2024, 10, 6634–6651. [Google Scholar] [CrossRef]
  18. Xie, Y.; Qi, G.; Cai, W.; Zhao, X.; Zhang, Y.; Wang, Z.; Yang, Y. Simulation and Experimental Study of Oil Injection Cooling for PMSM with Hairpin Winding. IEEE Trans. Transp. Electrif. 2024, 10, 6652–6662. [Google Scholar] [CrossRef]
  19. Li, Y.; Li, Q.; Fan, T.; Wen, X.; Xiong, J. Design and Experiment on Heat Dissipation Structures of Ducted Fan Motor for Flying Electric Vehicle. World Electr. Veh. J. 2024, 15, 274. [Google Scholar] [CrossRef]
  20. Wang, Y.; Zhu, T.; Geng, W.; Guo, J.; Sun, Y. Cooling System Analysis of an Enclosed Yokeless Stator for High-Power Axial Flux PM Motor with Distributed Winding. IEEE Trans. Ind. Electron. 2024, 71, 2789–2799. [Google Scholar] [CrossRef]
  21. Zhu, L.; Zhu, L.; Wang, S.; Chen, H. A fast real-time motor temperature estimation method taking less than 0.2 s. Therm. Sci. Eng. Prog. 2025, 57, 103103. [Google Scholar] [CrossRef]
  22. Gao, L.; Liu, X.; Liu, H. Analytical Calculation of Magnetic Field and Temperature Field of Surface Mounted Permanent Magnet Synchronous Motor. J. Electr. Eng. Technol. 2025, 20, 2249–2262. [Google Scholar] [CrossRef]
  23. Wang, P.; Wang, X.; Wang, Y. End-to-End Differentiable Physics Temperature Estimation for Permanent Magnet Synchronous Motor. World Electr. Veh. J. 2024, 15, 174. [Google Scholar] [CrossRef]
  24. Kou, S.; Kou, Z.; Wu, J.; Wang, Y. Novel Magnetic Field Modeling Method for a Low-Speed, High-Torque External-Rotor Permanent-Magnet Synchronous Motor. Electronics 2023, 12, 5025. [Google Scholar] [CrossRef]
  25. Wei, Y.; Ma, C.; Wang, J.; Zhou, S.; Sun, R.; Feng, J.; Zhou, Z.; Luo, L.; Shi, H. An Analytical Model for Stray Magnetic Field of External Rotor Permanent Magnet Motor Considering Unsaturated Magnetic Permeability. IEEE Trans. Transp. Electrif. 2025, 11, 8584–8593. [Google Scholar] [CrossRef]
  26. Diao, C.; Zhao, W.; Li, L.; Wang, X.; Kwon, B.-i. Optimal Design of Surface-Mounted Permanent Magnet Motor with Multi-Level Magnet Combination Using Analytical Method. IEEE Trans. Magn. 2024, 60, 8206405. [Google Scholar] [CrossRef]
Figure 1. Structural diagram of the self-starting permanent magnet synchronous motor.
Electronics 14 02487 g001
Figure 2. 3D structure diagram of the studied self-starting permanent magnet synchronous motor.
Electronics 14 02487 g002
Figure 3. Fluid flow direction and rotating fluid domain. (a) The direction of fluid flow; (b) rotating fluid domain.
Electronics 14 02487 g003
Figure 4. Mesh section of self-starting permanent magnet synchronous motor.
Electronics 14 02487 g004
Figure 5. Flow velocity distribution of fluid inside the motor.
Electronics 14 02487 g005
Figure 6. Air velocity distribution of motor end cavity and air gap.
Electronics 14 02487 g006
Figure 7. Flow velocity distribution of fluid at the end of motor winding.
Electronics 14 02487 g007
Figure 8. Flow velocity distribution of external fluid in the self-starting permanent magnet synchronous motor.
Electronics 14 02487 g008
Figure 9. Air velocity distribution on the surface of the motor casing and fan surface. (a) Velocity diagram of the outer surface of the casing; (b) velocity diagram of the fan.
Electronics 14 02487 g009
Figure 10. Sampling line position and velocity distribution of the ventilation ditch.
Electronics 14 02487 g010
Figure 11. Temperature distribution of self-starting permanent magnet synchronous motor.
Electronics 14 02487 g011
Figure 12. Temperature distribution of stator and winding. (a) Stator temperature; (b) winding temperature.
Electronics 14 02487 g012
Figure 13. Position and temperature distribution of winding axial sampling line.
Electronics 14 02487 g013
Figure 14. Radial sampling line position and temperature distribution at the end of the iron core.
Electronics 14 02487 g014
Figure 15. Temperature distribution of rotor. (a) Outlet side rotor temperature; (b) inlet air side rotor temperature.
Electronics 14 02487 g015
Figure 16. Temperature distribution of the permanent magnet and starter cage. (a) Permanent magnet temperature; (b) starting cage temperature.
Electronics 14 02487 g016
Figure 17. Position and temperature distribution of the axial sampling line on the rotor.
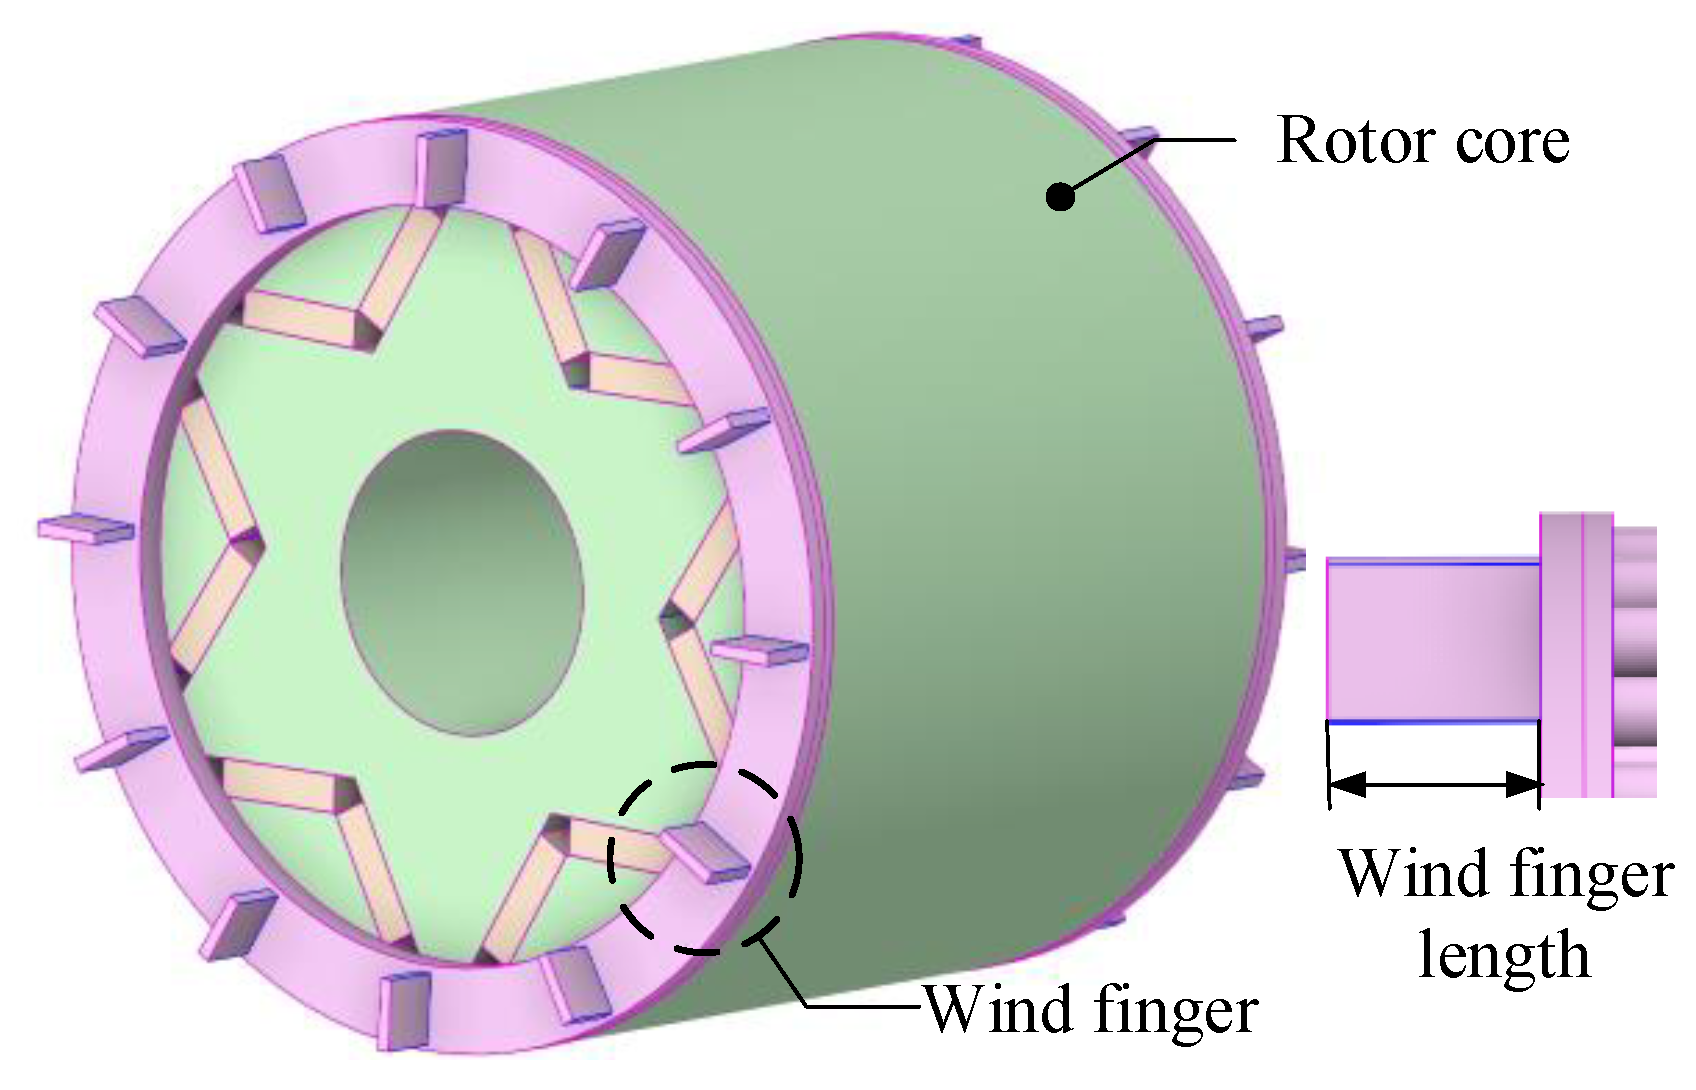
Electronics 14 02487 g017
Figure 18. Schematic diagram of rotor wind-finger structure.
Electronics 14 02487 g018
Figure 19. Distribution of air velocity in end chambers with different lengths of the wind-finger structure. (a) 0 mm wind-finger lengths; (b) 5 mm wind-finger lengths; (c) 10 mm wind-finger lengths; (d) 15 mm wind-finger lengths; (e) 20 mm wind-finger lengths.
Electronics 14 02487 g019
Figure 20. Temperature distribution of motor cross-sections with different wind-finger lengths. (a) 0 mm wind-finger lengths; (b) 5 mm wind-finger lengths; (c) 10 mm wind-finger lengths; (d) 15 mm wind-finger lengths; (e) 20 mm wind-finger lengths.
Electronics 14 02487 g020
Figure 21. Average temperature at the end of the winding on the outlet side of motors with different wind-finger lengths.
Electronics 14 02487 g021
Figure 22. Measurement experimental platform and temperature measurement location. (a) Experimental platform; (b) sensor burial location.
Electronics 14 02487 g022
Table 1. Parameter table of the studied self-starting permanent magnet synchronous motor.
Name/SymbolValue/UnitName/SymbolValue/Unit
Rated Power/ P 3/kWCore Length/ L 95/mm
Number of Pole Pairs/ p 3Stator Inner Diameter/ R 3 74.0/mm
Number of Stator Slot/ N s 36Stator Slot Bottom Inner Diameter/ R 1 92.5/mm
Stator Slot Opening Outer Diameter/ R 2 74.5/mmNumber of Rotor Slots/ N r 42.0/mm
Width of Permanent Magnet/ l w 22.5/mmRotor Inner Diameter/ R 4 73.5/mm
Rotational Speed/ n 0 1000/rpmThickness of Permanent Magnet/ l h 6.0/mm
Table 2. The material characteristic parameter of motor.
Motor ComponentsThermal Conductivity Coefficient/ W / m K Density/ kg / m 3 Specific Heat Capacity/ J / ( kg ° C )
Silicon steel sheet407600500
Insulation0.21250950
Winding4008800385
Chassis407950495
Guide bar21025781050
Table 3. A hybrid mesh strategy.
Application AreaGrid TypeSpecific Settings/Functions
Stator slots, permanent magnets, starting cagesHexahedral gridAccurately calculate flow and thermal gradients
Permanent magnet gap, heat sink fin areaPolyhedron meshApplied to the meshing of the corresponding area
Air gap, insulation layerThree-layer polyhedron meshSimulate the boundary layer effect
Table 4. Rated losses of various structural components of the motor.
Location
Distribution
Stator Iron LossWinding Copper LossRotor LossPermanent Magnet LossesStarting Cage Loss
value (W)37.11234.11.31.9
Table 5. Average temperature of each structure of the motor.
Rotor/°CWinding/°CStator/°CStator/°C
71.0287.2168.971.05
Table 6. The average and maximum flow velocity of air in end chambers with different lengths of wind-finger.
Wind Stab Length/mm05101520
Average air velocity in the end cavity/(m/s)0.20.240.630.750.83
Maximum air flow velocity in the end cavity/(m/s)7.517.957.988.18.12
Table 7. Average temperature of the motor structure with wind-fingers of different lengths.
Wind-Finger Lengths0 mm5 mm10 mm15 mm20 mm
stator/°C68.9068.167.2166.7266.43
winding/°C87.2186.585.6384.8884.35
magnet/°C71.0571.0870.5569.9669.65
rotor/°C71.0271.0570.4869.9369.66
Table 8. Comparison of testing points on temperature.
Temperature Measurement LocationExperimental Value/°CCalculating Value/°CError
E188.691.02.7%
E286.888.82.3%
F174.577.33.7%
F272.775.03.1%
Disclaimer/Publisher’s Note: The statements, opinions and data contained in all publications are solely those of the individual author(s) and contributor(s) and not of MDPI and/or the editor(s). MDPI and/or the editor(s) disclaim responsibility for any injury to people or property resulting from any ideas, methods, instructions or products referred to in the content.

