1. Introduction
With the rapid development of digitalization and automation technologies, intelligent systems have become the foundation of innovation in fields such as autonomous driving [
1], rehabilitation healthcare [
2], and aerospace [
3,
4]. Among the core characteristics of these systems, intelligence evaluation plays a critical role in both theoretical research and practical engineering applications [
5].
To provide standardized intelligence classification and ensure consistent development benchmarks, multiple industry and governmental bodies have introduced widely recognized grading systems. For instance, the Society of Automotive Engineers (SAE) established the SAE J3016 standard for autonomous vehicle classification [
6]; the U.S. National Institute of Standards and Technology (NIST) developed the Autonomy Levels for Unmanned Systems (ALFUS) framework [
7]; and NASA proposed a hierarchy for grading autonomy in spacecraft and exploratory probes [
8]. These frameworks typically employ qualitative definitions, assigning intelligence levels based on descriptions of system functionalities and task responsibilities.
Meanwhile, researchers across various domains continue to pursue quantitative assessment approaches to support more objective and repeatable intelligence evaluations for unmanned systems. In intelligent transportation, multiple works have developed classification models for autonomous vehicles [
9,
10], alongside scenario-specific safety assessments [
11] and risk evaluations under complex environments [
12]. In the aerospace sector, military-focused assessments are common: Liu [
13] utilized the analytic hierarchy process (AHP) to assess UAV swarm effectiveness, while Han [
14] introduced fuzzy comprehensive evaluation to enrich the decision model. Other methods, such as index system construction based on target detection [
15], aim to reduce subjectivity. Industrial applications of intelligence evaluation typically emphasize risk control and predictive maintenance; for example, Kong [
16] proposed a weight correction mechanism based on key operational indicators, and He [
17] employed FDEMATEL combined with Analytic Network Process (ANP) to evaluate intelligent coal mine development.
Despite their contributions, most existing evaluation methods rely heavily on multi-indicator scoring and weight-based aggregation, making them inherently quantitative in nature. This scoring-centric orientation limits their ability to directly align with qualitative grading systems like ALFUS. As a result, evaluation outcomes across different domains or platforms lack interpretability, consistency, and cross-scenario comparability.
To bridge this gap, this paper proposes a hierarchical parameter partition-based equivalent mapping (HPP-EM) method that connects quantitative evaluation outputs with qualitative intelligence grades. Without altering existing evaluation frameworks, the method establishes a unified and interpretable mapping path, enhancing standardization and adaptability. The proposed approach incorporates the following: (1) a structured mapping framework for aligning scores with qualitative levels to ensure standardized intelligence expression; (2) a nonlinear score interval division to reflect diminishing marginal improvement in system intelligence; and (3) a dynamic threshold allocation mechanism that adapts to different indicator weights, improving flexibility and contextual fit.
The remainder of this paper is organized as follows:
Section 2 introduces related research on qualitative and quantitative intelligence evaluation;
Section 3 details the proposed HPP-EM framework and its core modules;
Section 4 presents experimental validation and analysis; and
Section 5 concludes with key findings and outlines directions for future research.
3. Proposed Framework
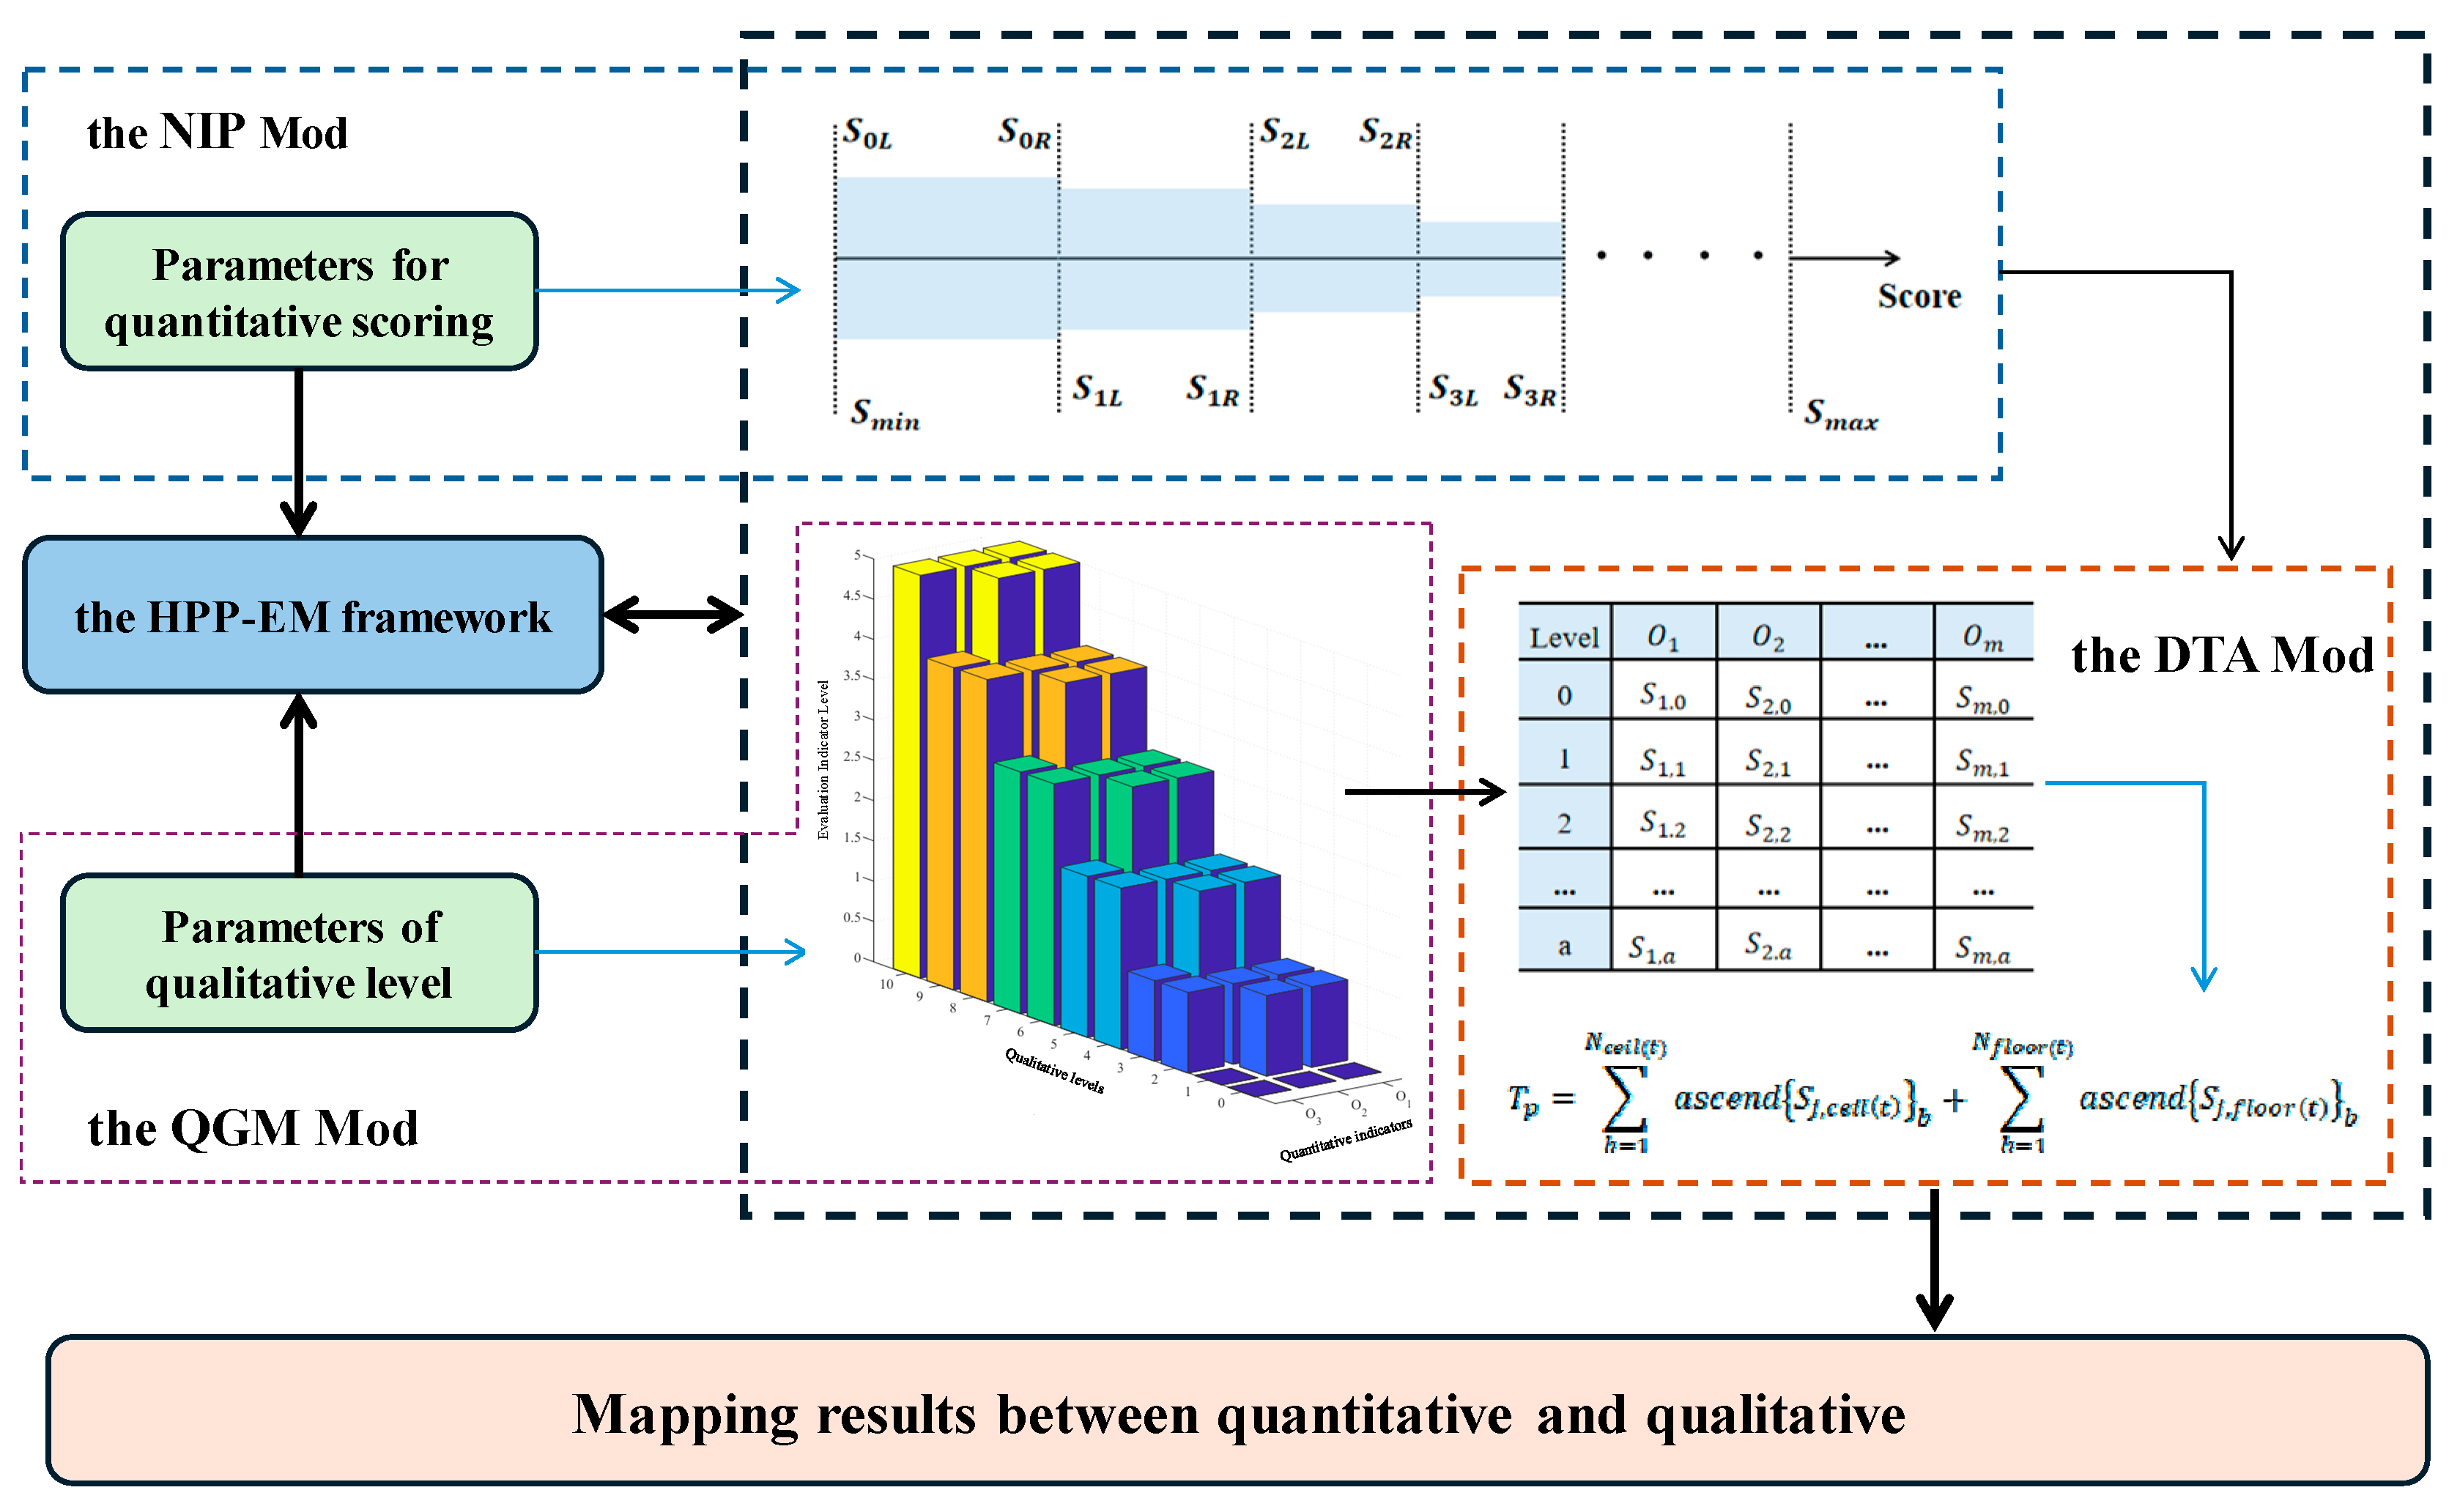
While quantitative methods provide objective, data-driven scores and qualitative methods offer interpretability through structured grading schemes, their independent application often results in disconnected outcomes. For example, numerical evaluation scores may suggest high system performance, yet without a corresponding qualitative interpretation, it is difficult to determine the autonomy level under frameworks such as ALFUS or NASA SMART. This lack of linkage hinders the ability to compare systems across domains or to support certification processes that require standardized grading expressions. To address this issue and build a unified evaluation bridge, this study proposes the HPP-EM framework. As shown in
Figure 3, the framework consists of three core modules: the Nonlinear Interval-Partitioned Module (NIP Mod), the Quantitative–Qualitative Grade Mapping Module (QGM Mod), and the Dynamic Threshold Allocation Module (DTA Mod). Together, they form a complete process for transforming quantitative scores into interpretable qualitative intelligence grades.
In the NIP Mod, the overall scoring space of quantitative evaluation is divided into multiple non-uniform levels. This nonlinear partitioning reflects the diminishing marginal improvements typically seen in intelligent systems, ensuring that higher intelligence levels receive finer granularity. The partitioned levels serve as the initial basis for establishing grade boundaries.
The QGM Mod builds the core mapping mechanism between the score intervals and qualitative intelligence grades. By determining whether each indicator meets its level-specific requirements, and by quantifying the minimum number of qualified indicators for a level transition, this module enables structured grade assignment based on quantitative results. This overcomes the ambiguity of direct score-to-grade conversion in existing evaluation frameworks.
To ensure that the mapping process remains adaptive and sensitive to indicator importance, the DTA Mod dynamically generates threshold values for both individual indicators and overall scores. These thresholds are computed based on indicator weights, and an adaptive matrix is used to adjust grade boundaries. This ensures that the system’s final intelligence grade reflects not only score magnitudes but also structural balance across performance dimensions.
Through the coordinated operation of these three modules, the HPP-EM framework establishes a transparent, interpretable, and generalizable pathway for bridging quantitative evaluation results and qualitative intelligence classifications.
3.1. The Nonlinear Interval-Partitioned Module
To support the transformation from quantitative scores to qualitative grades, the NIP Module partitions the scoring space into structured sub-intervals. This operation provides the foundational grading tiers for subsequent qualitative mapping.
Assume a hierarchical quantitative evaluation system consisting of
primary evaluation indicators. Let
and
represent the weight and score of the
-th indicator, respectively. The evaluation inputs must satisfy the following constraints:
In Equation (1), denotes the total number of first-layer evaluation indicators; represents the weight value of the -th indicator, and denotes its corresponding score. The terms and define the global lower and upper bounds of the evaluation score range, respectively. All indicator weights are normalized such that their sum equals 1.
To reflect nonlinear growth in system intelligence, the full scoring interval is divided into continuous and progressively shrinking sub-intervals. Let the -th sub-interval be denoted as , where and and .
The boundaries are subject to
In Equation (2), and represent left and right boundaries of the -th scoring sub-interval, respectively. The first condition ensures that the length of each subsequent interval is less than or equal to that of the previous one, capturing the nonlinear nature of intelligent capability improvement. The second condition guarantees the continuity of the scoring space by aligning the right boundary of one interval with the left boundary of the next.
This partitioning structure is designed to reflect the principle of diminishing marginal gains in intelligent capability. As systems advance, improvements become more difficult and performance gaps narrow. The NIP Mod thus establishes a nonlinear, fine-grained scoring space that serves as the basis for level differentiation in the qualitative grade mapping process.
3.2. The Quantitative–Qualitative Grade Mapping Module
The Quantitative–Qualitative Grade Mapping Module (QGM Mod) establishes the core logic for converting numerical evaluation results into qualitative intelligence levels. Based on the sub-interval structure defined in the NIP Module, this module determines the required proportion of indicators that must meet each score interval to satisfy a specific qualitative level.
Assume that the qualitative evaluation framework defines
discrete intelligence levels. For any target qualitative level
, the QGM Mod first calculates a proportional baseline to identify the expected average sub-level of quantitative scores that corresponds to level
. This is given by
In Equation (3), represents the target qualitative intelligence level; denotes the total number of qualitative levels; represents the number of score sub-intervals from the NIP Module; and denotes the expected sub-level index representing the grading requirement for level .
This continuous index serves as an anchor to translate qualitative levels into proportional quantitative score expectations, which is crucial in achieving consistent and explainable mapping across heterogeneous systems.
Since
is generally a non-integer, the QGM Mod constructs a requirement set
consisting of two adjacent integer sub-levels,
and
, which together define the distribution of evaluation indicators needed to meet level
. Given that there are
first-layer indicators, the number of indicators that must meet each sub-level is calculated by
In Equation (4), represents the ceiling operation on , represents the floor operation on , and represents the rounding operation on . This allocation ensures that each grade level not only reflects aggregate performance but also enforces granular control over the distribution of sub-level compliance.
The constructed set reflects the minimum sub-levels required across indicators to qualify for a given qualitative grade. If the actual scores of the evaluation indicators satisfy the thresholds defined by , then the system is mapped to level ; otherwise, the grade is reduced accordingly.
Compared to traditional methods that rely solely on weighted sums, this threshold-based approach enhances interpretability by aligning with task-specific or domain-required capability structures.
This mapping process provides flexible yet structured intelligence grading while avoiding score averaging biases.
3.3. The Dynamic Threshold Allocation Module
The DTA Mod determines the specific minimum score thresholds that each evaluation indicator must achieve to support the mapping to a given qualitative intelligence level. This process complements the grade structure generated by the QGM Mod by calculating score boundaries at both the individual indicator level and the overall system level. The objective is to achieve fine-grained score control that is consistent with both the nonlinearity of intelligent system growth and the weighted importance of evaluation metrics.
Let the
-th scoring interval (as defined in the NIP Mod) correspond to the quantitative sub-level
. The minimum required score for the
-th evaluation indicator to be classified at level
is calculated by
In Equation (5), denotes the minimum score for indicator at level ; and represent left and right boundaries of the -th scoring sub-interval, respectively. denotes the weight of indicator , and represents the median of all indicator weights. and represent maximum and minimum weights across all indicators, and is the level adjustment coefficient to control score sensitivity.
The coefficient
is used to prevent scoring overflow and fine-tune sensitivity across levels. It is constrained by the range
This dynamic design accommodates system-specific heterogeneity by adjusting minimum requirements based on both structural priorities (via weights) and evaluation resolution (via scoring intervals). A higher-weighted indicator will demand a relatively higher score at the same grade level, while lower-weighted ones require less. As a result, the system can distinguish between critical and secondary metrics during grade qualification.
Based on Equation (5), the complete threshold matrix for all
indicators across
sub-levels is expressed as
This matrix defines the scoring constraints for level assignment with full granularity.
Furthermore, the DTA Mod calculates the minimum total score threshold
required to qualify the system for qualitative level
, based on the mapping structure
generated in the QGM Mod. This ensures that not only individual indicators but also the overall performance meet the grade standard. The computation is defined as
In Equation (8), is the total score lower limit for qualitative level , and and are the number of indicators required at each sub-level (from QGM). is the -th smallest value of in ascending order.
This two-stage filtering mechanism—first at the individual level, then at the total score level—ensures both local (indicator-level) and global (system-level) compliance, thereby enhancing robustness in varied application contexts.
Together, these mechanisms provide not only technical precision but also conceptual transparency in mapping quantitative evaluations to interpretable and certifiable intelligence levels.
4. Experimental Validation
4.1. The Classical Mapping Case
Due to its multidimensional evaluation indicators, the AFLUS framework is well-suited for complex systems. Therefore, selecting ALFUS as the qualitative mapping reference is of practical significance. The following sections introduce the specific grading framework of ALFUS and the chosen quantitative methods.
This choice also allows the validation of the proposed HPP-EM model against an internationally recognized autonomy grading system, enhancing comparability and interpretability.
4.1.1. Qualitative Method
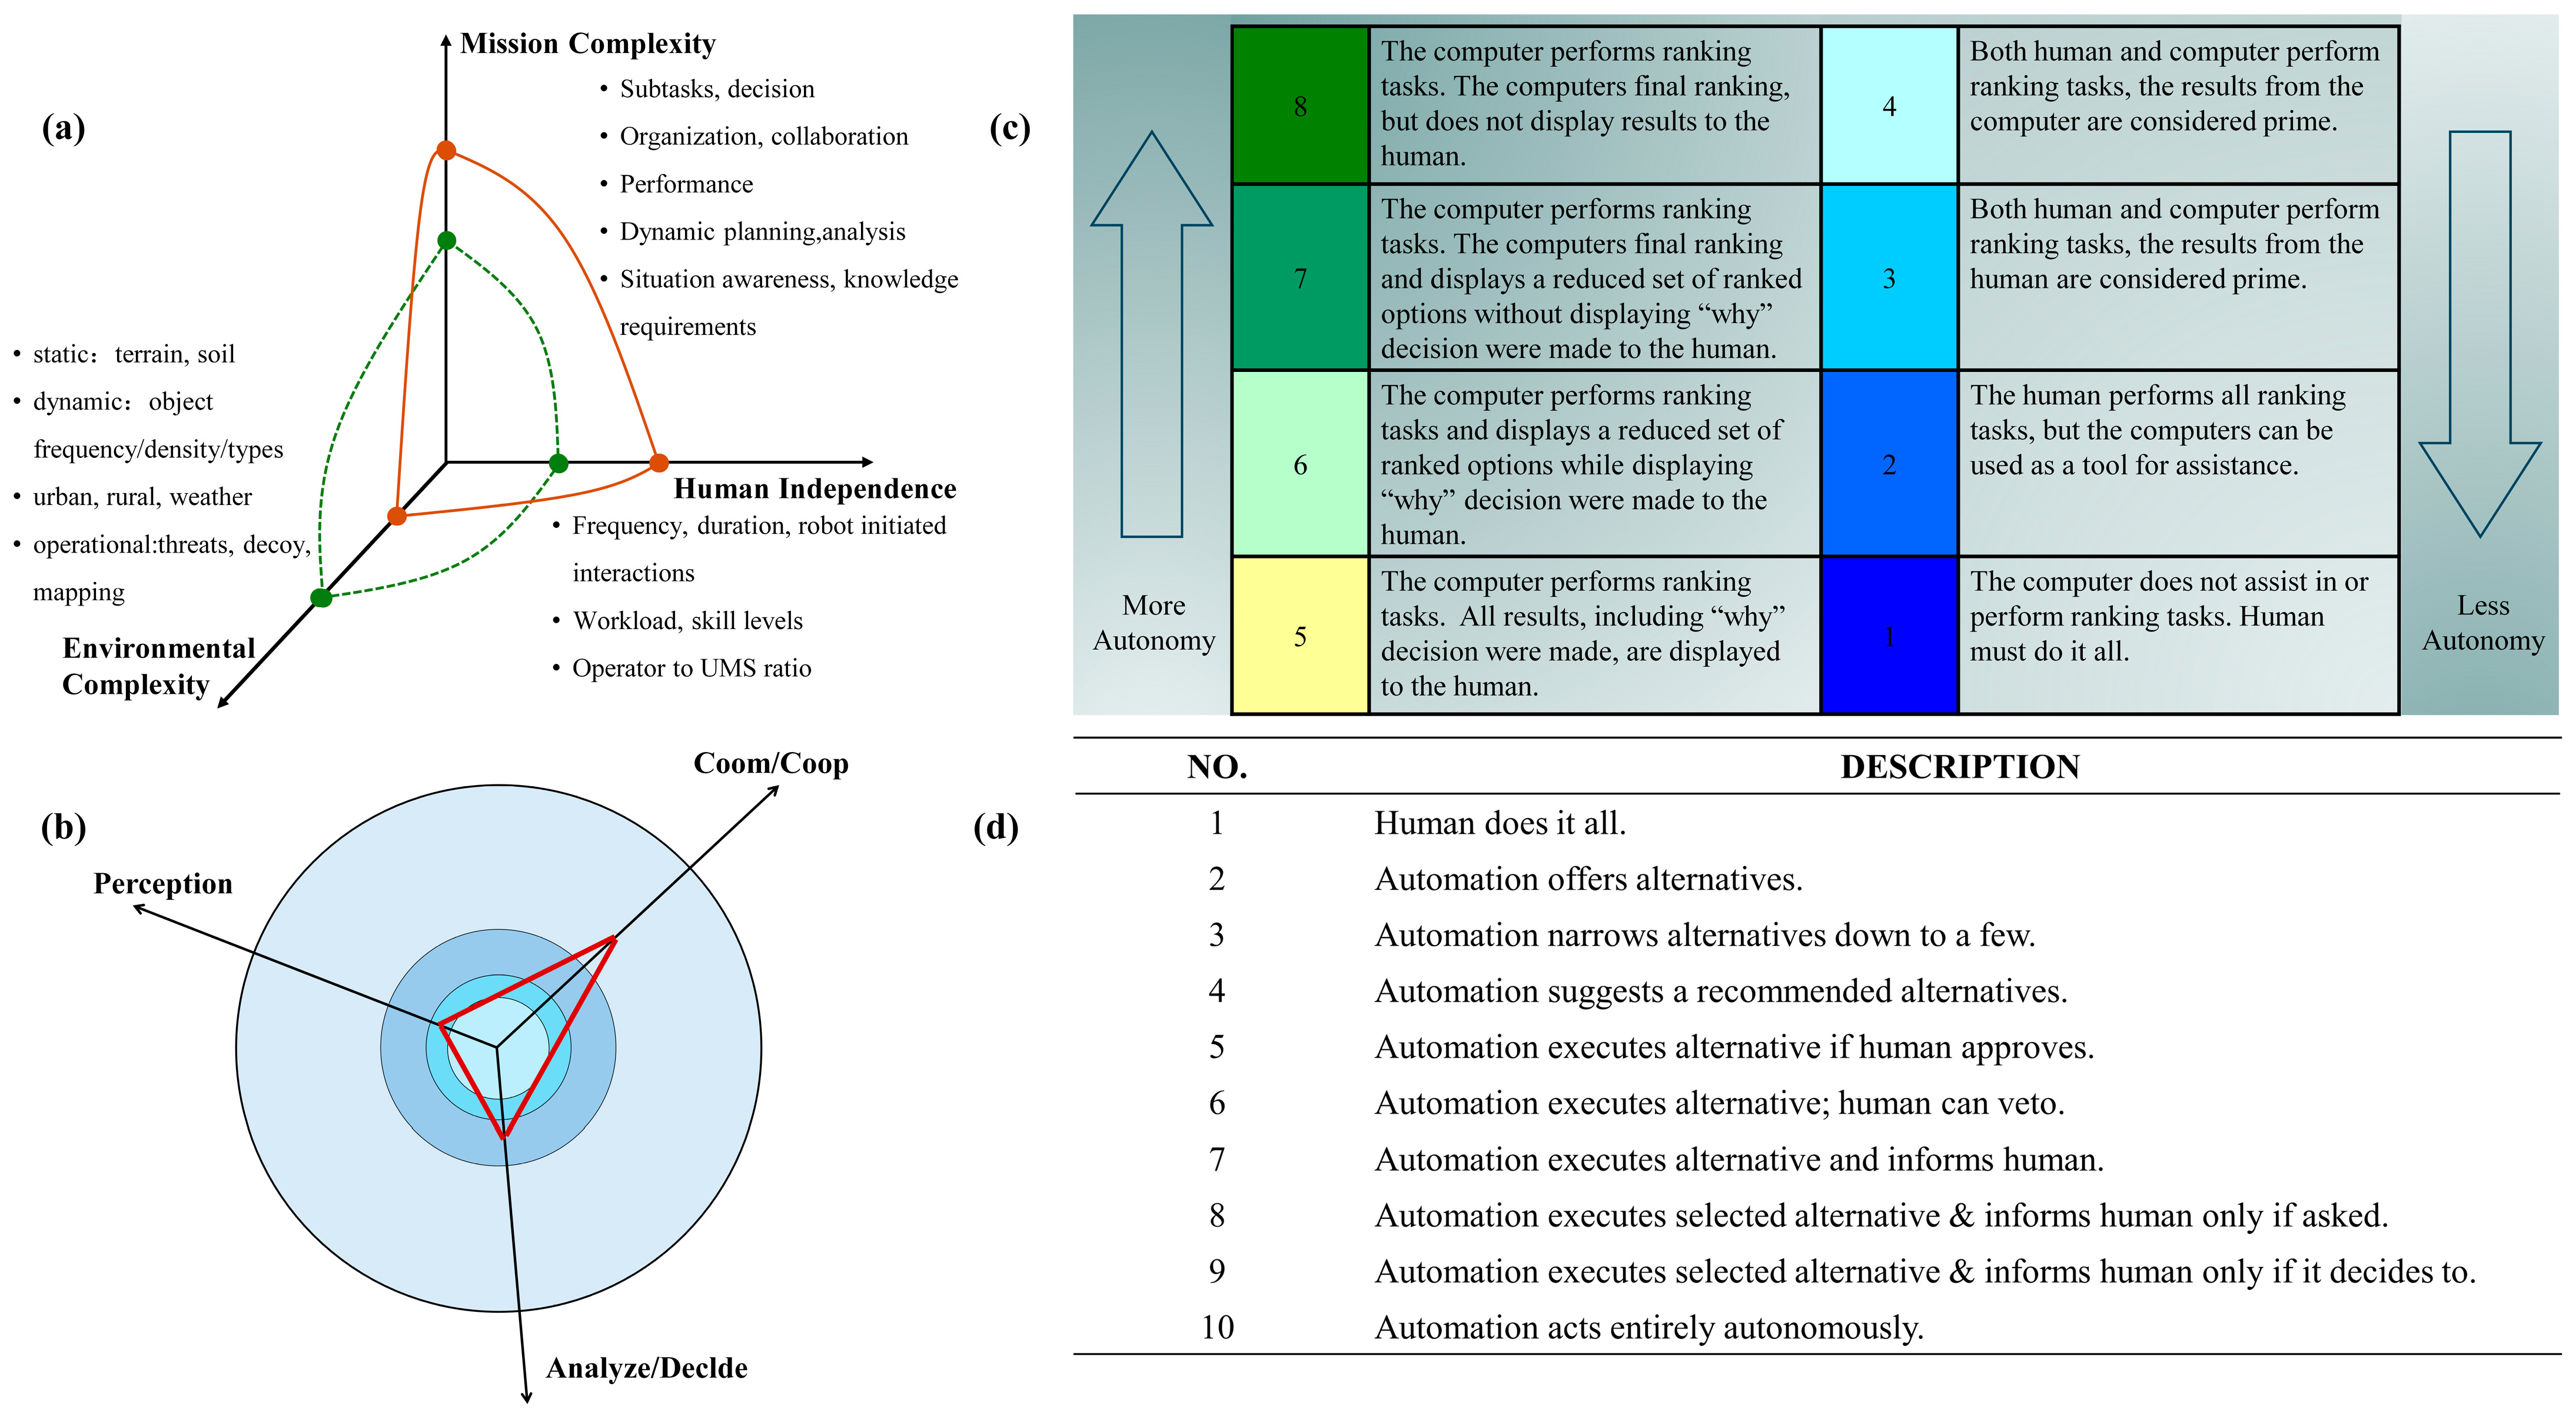
The ALFUS framework, as a general qualitative evaluation standard for unmanned systems, establishes standard terminology and definitions for describing the autonomy levels of intelligent systems. This framework enables a hierarchical description of functional autonomy from basic remote control to human-equivalent autonomous behavior, making it an ideal benchmark for qualitative classification in this study, as shown in
Table 1. It is applicable to various intelligent systems, including ground autonomous robotic systems and unmanned ground vehicles. Therefore, this study adopts the ALFUS classification method to qualitatively evaluate the intelligence level of the experimental system. The classification of intelligence levels in the ALFUS system are shown in
Table 2.
4.1.2. Quantitative Method
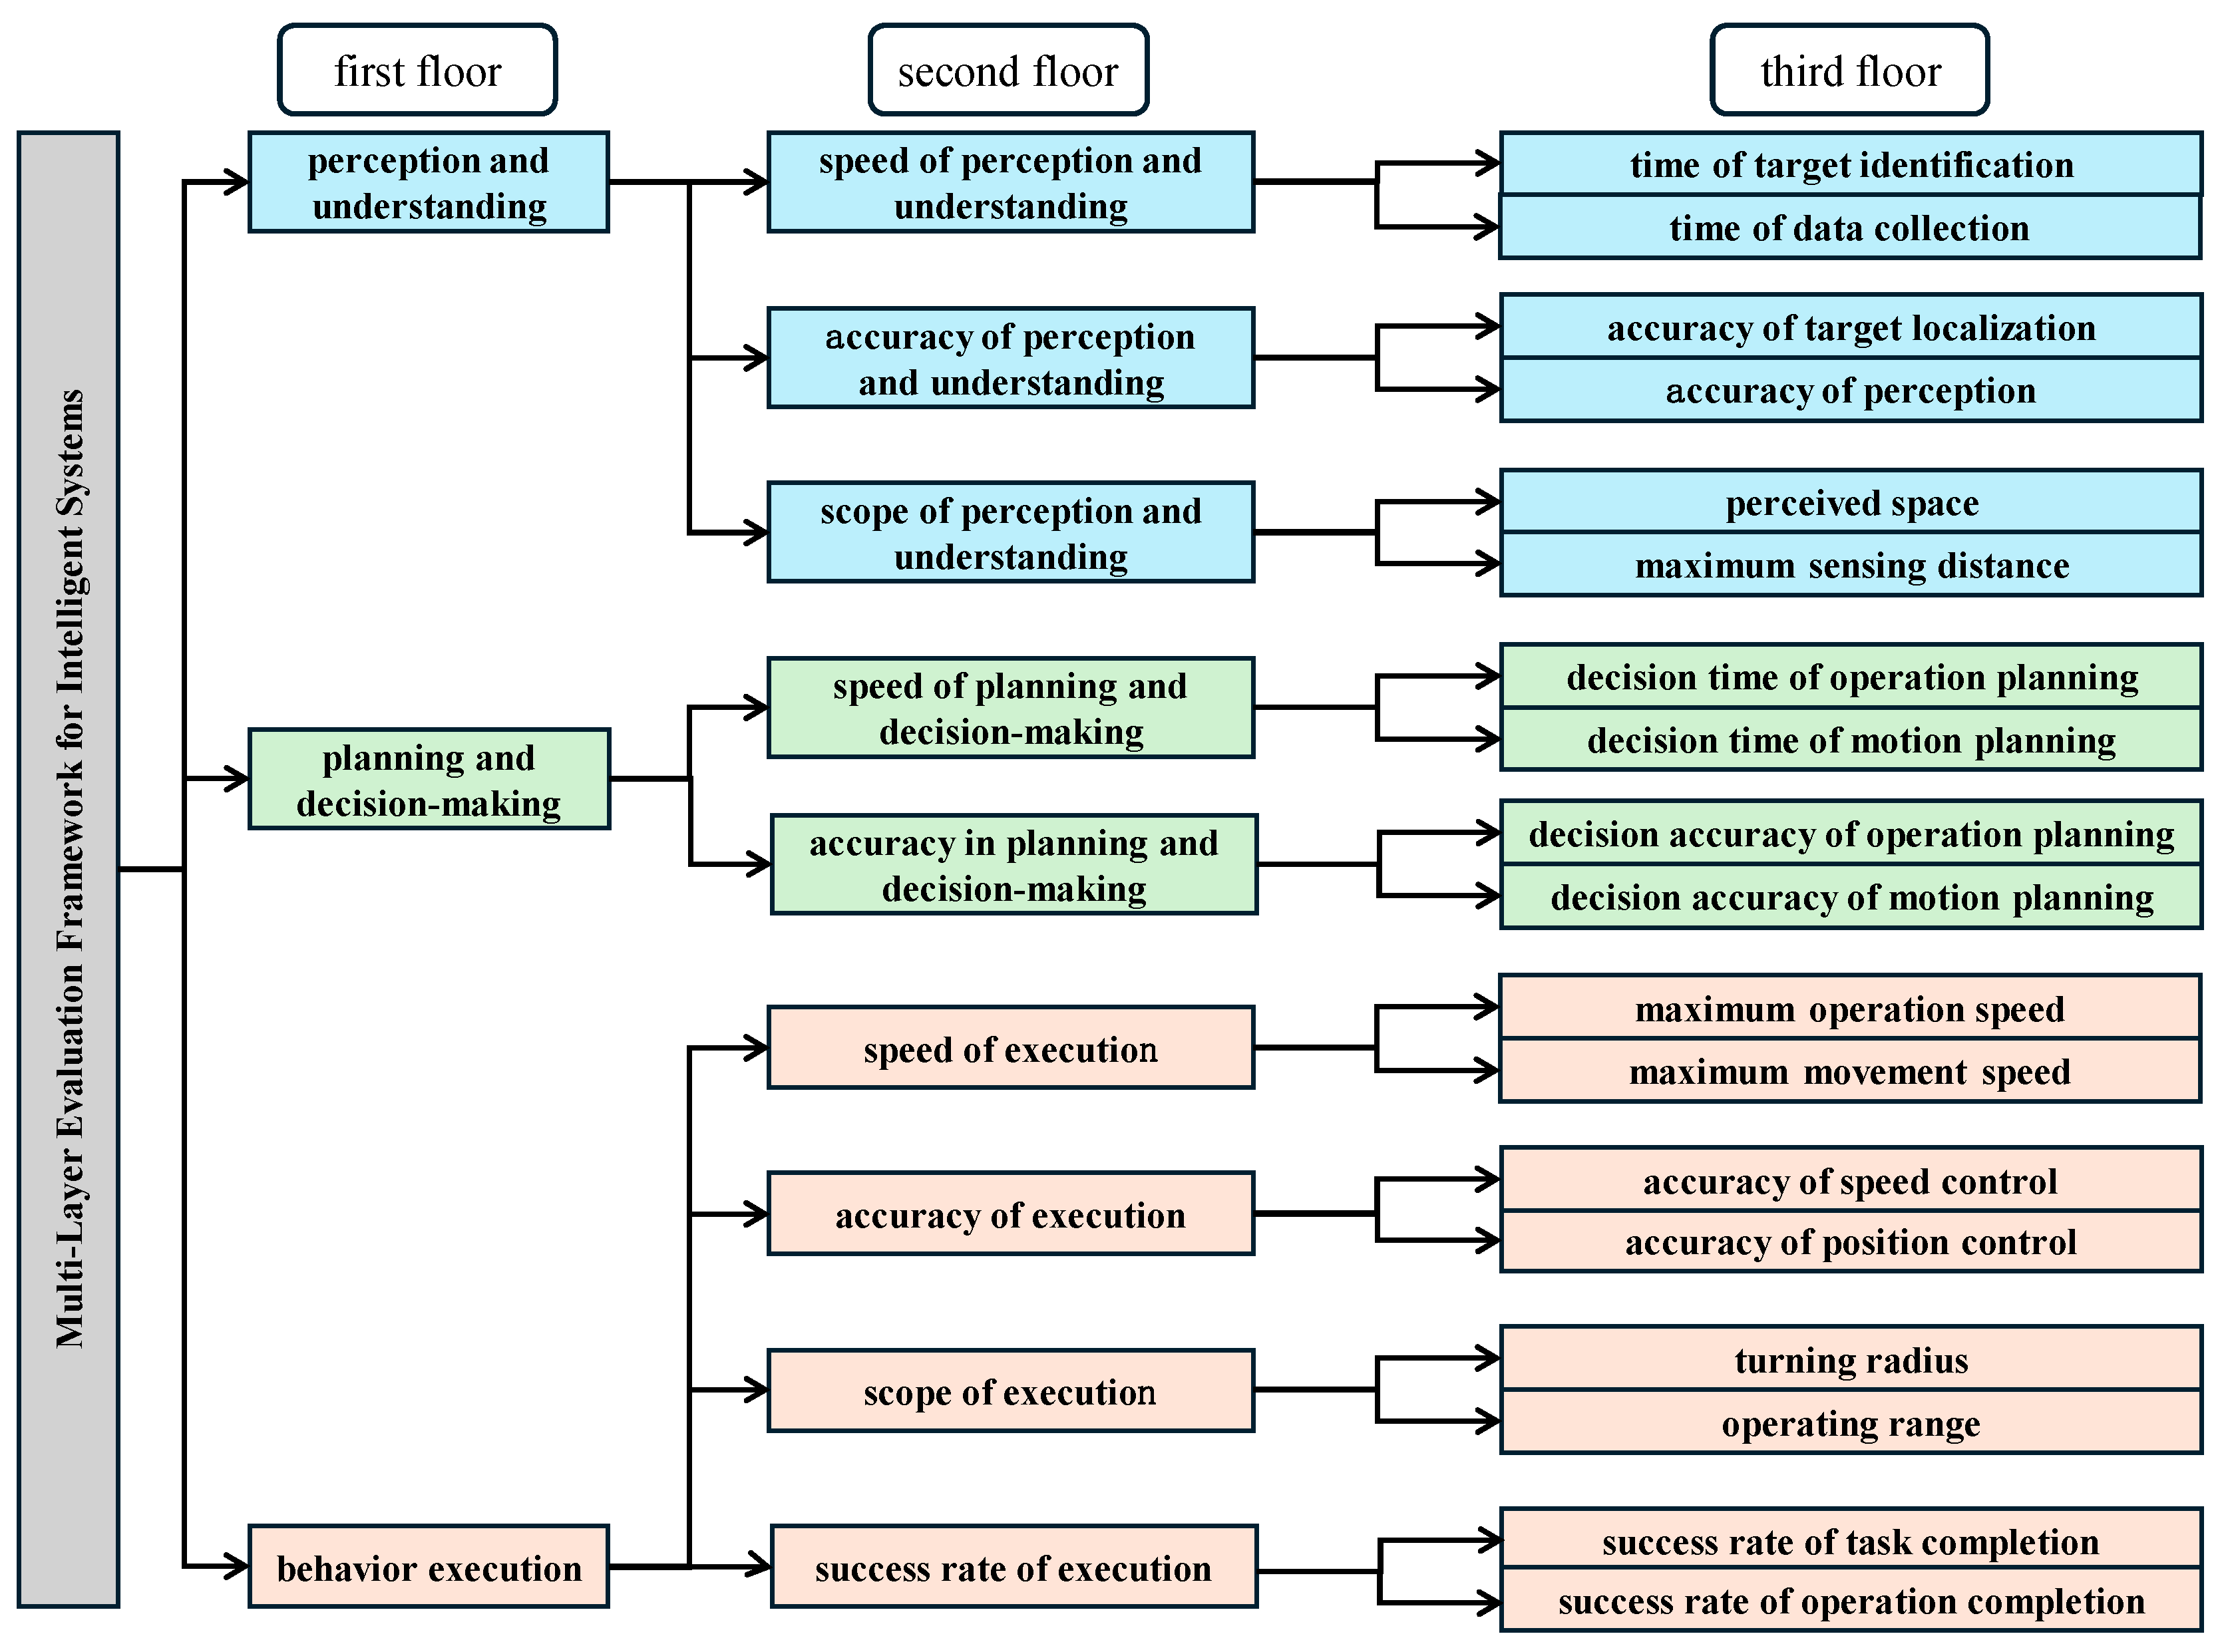
This study selects the detection and execution tasks of a specific extraterrestrial unmanned system as the experimental scenario, and establishes a general quantitative evaluation method for assessing the intelligence level of such systems based on previous research. The evaluation system consists of three layers with a total of 18 evaluation indicators, shown in
Figure 4, and is based on capabilities such as perception and understanding, planning and decision-making, and behavior execution. The evaluation framework draws from prior validated models while adapting to task-specific requirements in extraterrestrial terrain exploration.
4.2. Experiment Setup
To validate the proposed HPP-EM framework, an experimental setup was constructed based on a real-world unmanned system scenario. The system’s intelligence was evaluated across three primary functional dimensions: Perception and Understanding, Planning and Decision-Making, and Behavioral Execution. Each dimension corresponds to a first-level evaluation indicator with an associated score and comprehensive weight, as summarized below:
The comprehensive weight for “Perception and Understanding” is 0.32, with a score of 77.32.
The comprehensive weight for “Planning and Decision-Making” is 0.17, with a score of 64.00.
The comprehensive weight for “Behavioral Execution” is 0.51, with a score of 87.25.
The values of each parameter are as follows:
These parameters serve as inputs to the HPP-EM framework and are used to calculate threshold scores for each qualitative level. The goal is to demonstrate how the framework can effectively map real quantitative distributions to meaningful qualitative intelligence grades.
The weights were derived using a hybrid weighting strategy that integrates both subjective and objective methods to ensure a balance between expert insight and data-driven consistency. Specifically, the Analytic Hierarchy Process (AHP) was used to capture expert judgment from a panel of five domain specialists. The resulting pairwise comparison matrix achieved a consistency ratio (CR) of 0.04, indicating a high level of logical coherence. These initial subjective weights were subsequently adjusted using the entropy weight method, which accounts for the dispersion and information entropy of the underlying data. The final comprehensive weights thus reflect both expert priorities and statistical variability across evaluation indicators.
4.3. Test 1: Score Threshold-Based Grading Test
The decision to use six nonlinear intervals aligns with the ten-level structure of ALFUS, ensuring mapping resolution. The intervals are non-uniform to reflect diminishing marginal gains in intelligence progression. The parameter serves as a tunable factor to adjust threshold steepness.
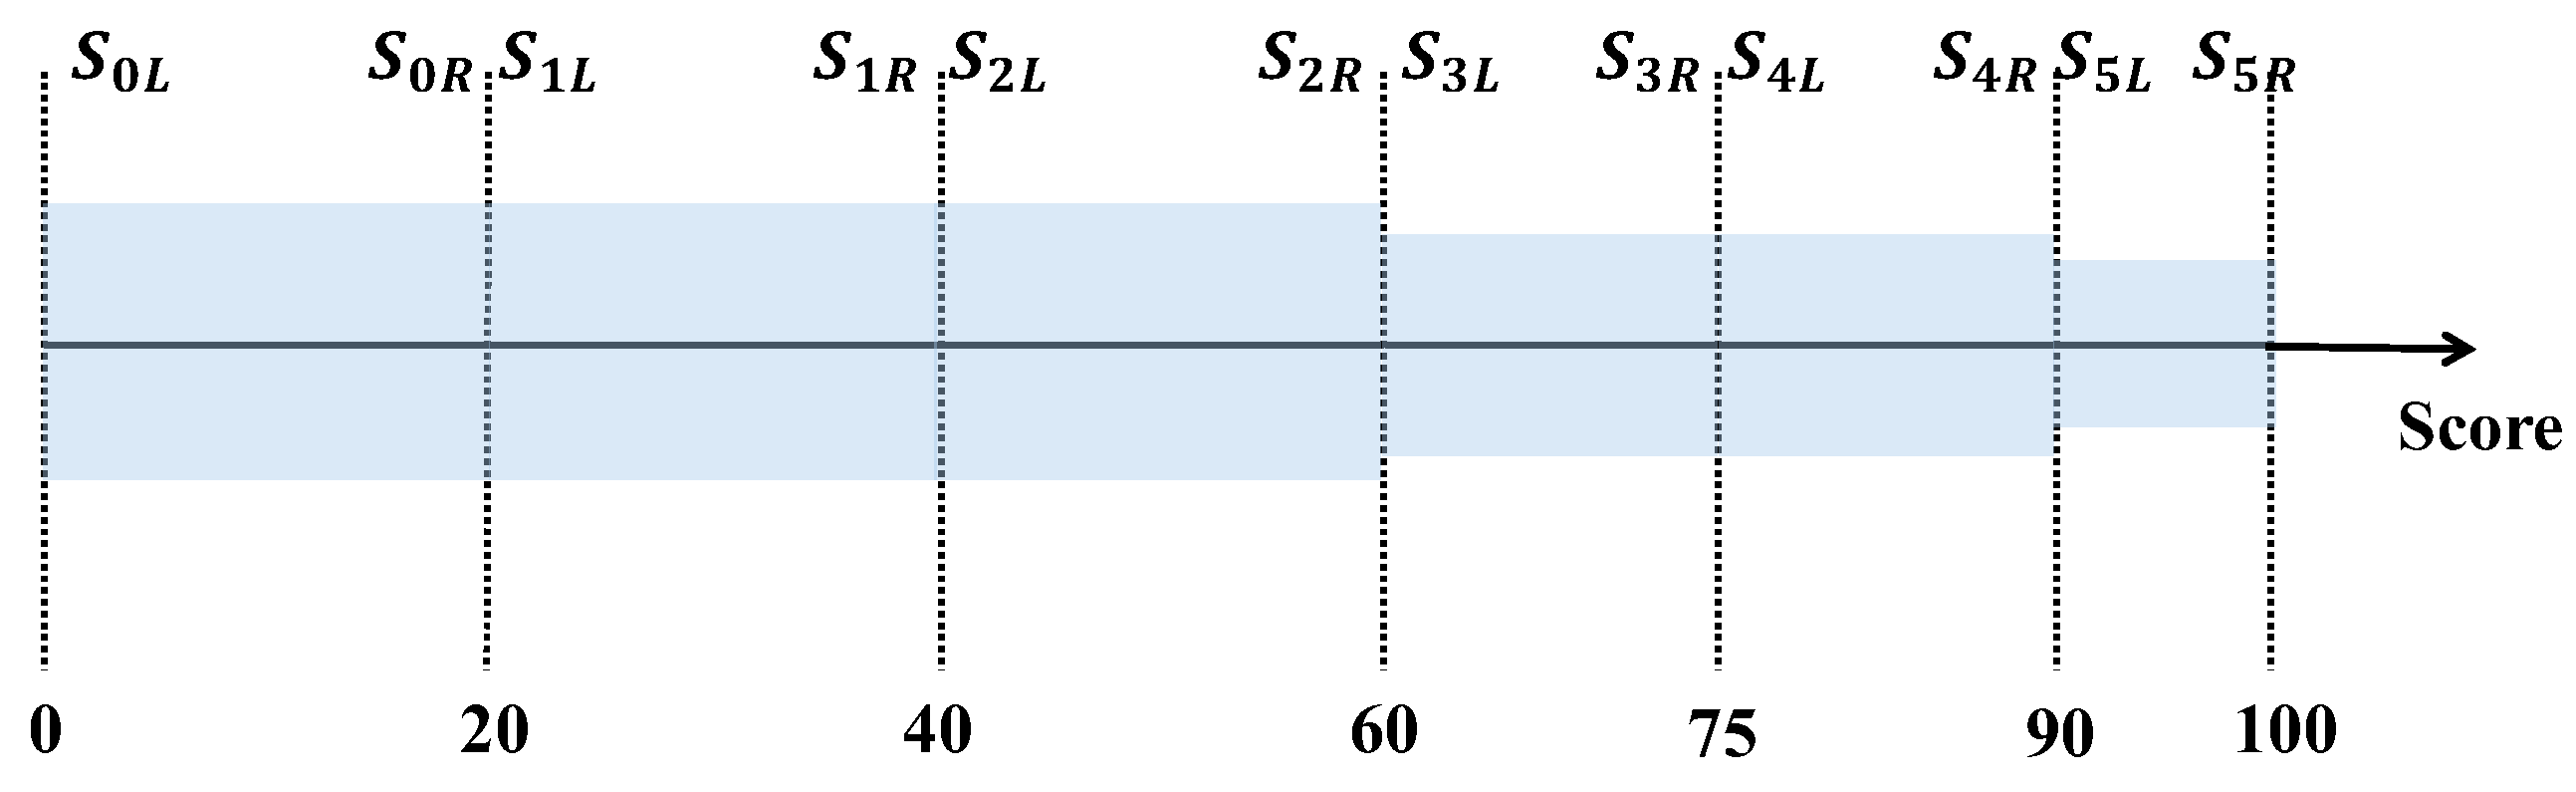
Based on the quantitative scores and weights of the first-level evaluation indicators, the nonlinear scoring intervals are divided as shown in
Figure 5. This test aims to validate whether the DTA module correctly reflects the effect of indicator weights on score thresholds. This study selects
as the scoring range, which is divided into six continuous nonlinear intervals, i.e.,
. The range of the level coefficient
can be calculated as
, and by setting
, the minimum score matrix is obtained as follows:
The saturation treatment of
results in the quantitative scoring and grading threshold table for the indicators, as shown in
Table 3. It can be observed that the score for each level of the Perception and Understanding indicator is the same as the scoring interval, while the score for the Planning and Decision-Making indicator is slightly lower, and the score for the Behavioral Execution indicator is slightly higher. This is determined by the weight of each indicator, which indicates that the mapping method proposed in this paper has successfully quantified the impact of weight on the grade levels.
This outcome demonstrates how the proposed HPP-EM framework explicitly quantifies and adjusts the influence of indicator weights on the mapping between quantitative scores and qualitative grades. Specifically, the Dynamic Threshold Allocation (DTA) module incorporates the indicator weights into the calculation of both individual and overall threshold scores, rather than allowing them to merely influence aggregated results.
In the quantification phase, Equation (5) integrates each indicator’s weight into the computation of its minimum required score under a given grade level. The formula includes a weight deviation factor, constructed using the indicator’s weight, the median of all weights, and the maximum and minimum weights in the system. This ensures that indicators with greater importance (higher weights) require proportionally higher performance for a given grade, while less critical indicators are assigned lower thresholds.
In the adjustment phase, the model calculates an adaptive threshold matrix across all indicators and grades (Equation (7)), and applies a tunable level sensitivity coefficient (λ) to control the steepness and granularity of grade transitions. In addition, Equation (8) determines the minimum total score threshold needed to qualify for each grade, thereby enforcing structural balance between local (indicator-level) and global (system-level) compliance.
Compared with traditional weighted average models, which embed weight effects only in the final score computation, this method introduces a modular and interpretable mechanism that directly shapes grade boundaries through weight-aware thresholding. This approach improves transparency, adaptability, and robustness—particularly in evaluation contexts involving heterogeneous weight distributions or hierarchical indicator structures.
4.4. Test 2: Grade Mapping Results Test
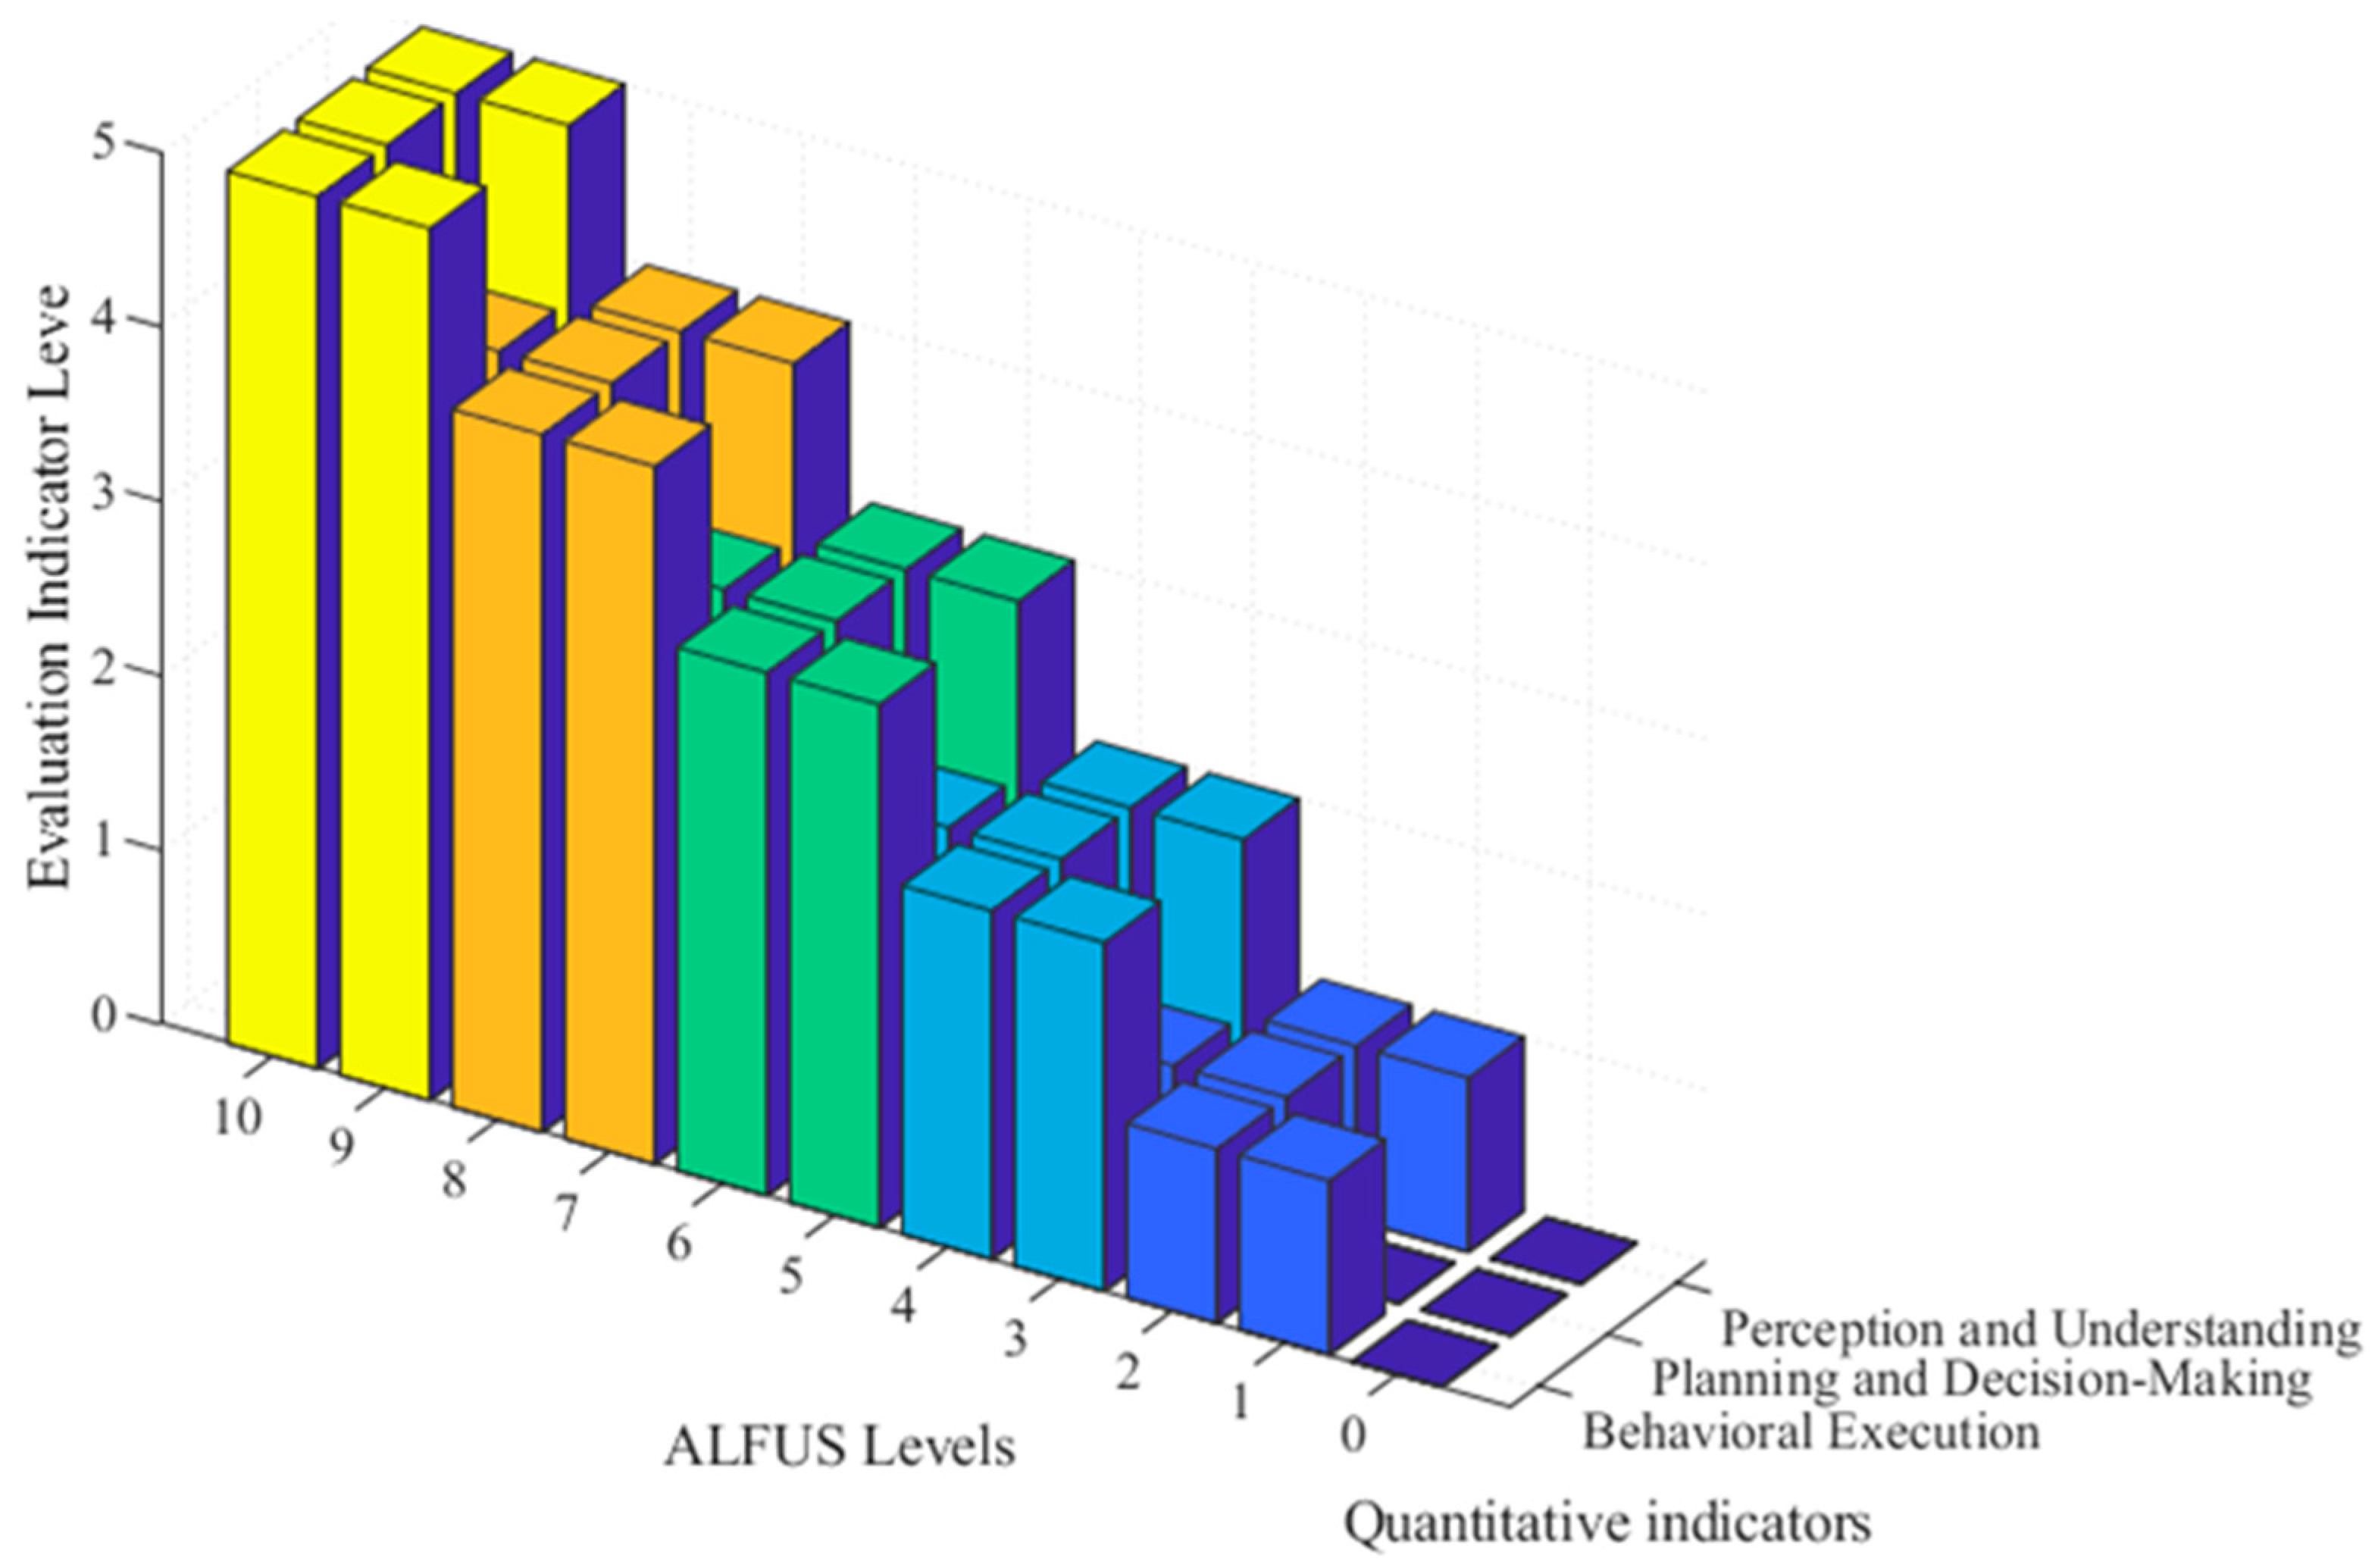
The corresponding quantitative grading of each indicator for the qualitative level p is determined, as shown in
Figure 6. As shown in the figure, Level 10 in the qualitative ALFUS framework corresponds to three Level 5 quantitative indicators. The qualitative description of Level 9 corresponds to Level 5 in Perception and Understanding and Behavioral Execution, as well as Level 4 in Planning and Decision-Making. Meanwhile, the qualitative description of Level 0 corresponds to three Level 0 quantitative indicators.
This test illustrates how the HPP-EM model supports non-uniform indicator qualification, enabling flexible yet structured grade transitions without hard aggregation.
In
Figure 6, different colors are used to distinguish the quantitative score levels corresponding to each qualitative grade. Higher quantitative levels are marked with deeper color shades, highlighting their relative contribution to the overall qualitative intelligence level.
4.5. Test 3: Final Mapping Results Test
Based on the previous test results, the mapping relationship between quantitative scores and qualitative levels is established as shown in
Table 4. The experimental system achieved scores of 73.32, 64.00, and 87.25 in Perception and Understanding, Planning and Decision-Making, and Behavior Execution, respectively, with a total score of 224.57. Based on these results, the system’s intelligence level corresponds to ALFUS Level 7. Expert evaluation further confirms that the system’s capabilities align with Level 7 requirements, demonstrating proficiency in “mobile target detection, autonomous driving on roads or off-road environments.” However, it has not yet reached Level 8, which requires more advanced capabilities such as “collaborative operations, convoy escort, intersection navigation, and transport following.”
In preliminary comparisons with traditional linear mapping and entropy-only methods, HPP-EM showed superior alignment with expert-level classifications, particularly under uneven indicator weight scenarios, as shown in
Table 5. Detailed comparative experiments are planned for future work.
This final test verifies the full mapping flow from raw data to qualitative classification, demonstrating model consistency and alignment with domain expectations. In practical terms, this also shows how the HPP-EM model can support certification-like assessment by linking test results to standardized descriptions.
Though validated in an extraterrestrial system, the HPP-EM framework is modular and adaptable to various unmanned domains (e.g., autonomous driving, industrial robotics), provided appropriate indicators and qualitative standards are defined.
5. Conclusions
This study proposes an HPP-EM method to address the existing gap between quantitative evaluation scores and qualitative grading levels in unmanned intelligent system assessments. By integrating a nonlinear score partitioning mechanism with a level-aware threshold allocation model, the framework enables a structured and interpretable transformation from multi-indicator numerical results to standardized qualitative levels. This mapping strategy not only enhances the consistency and comparability of assessment outcomes but also provides a generalizable approach suitable for various evaluation frameworks such as ALFUS.
The proposed method was validated through a case study involving an extraterrestrial unmanned system with three primary functional dimensions. The experimental results confirmed that the system’s mapped qualitative level—ALFUS Level 7—accurately corresponded to its observed capabilities, and the result was further verified by expert judgment. The mapping logic showed strong robustness when faced with skewed weight distributions and nonlinear score structures, indicating that the model is adaptable to diverse evaluation settings. These results support the feasibility and reliability of the HPP-EM method in real-world intelligent system assessments.
In future work, the framework will be extended toward a dynamic “evaluation–mapping–optimization” loop, where classification thresholds are iteratively updated based on newly acquired assessment data. To enhance adaptability while preserving interpretability, we will explore rule-guided neural network structures for flexible threshold tuning. Furthermore, comparative studies with conventional evaluation approaches such as entropy-only and AHP-only methods will be conducted to quantify the performance advantages of the HPP-EM framework. Ultimately, this research aims to establish a scalable and certifiable evaluation model applicable across multiple domains including aerospace, autonomous driving, and industrial robotics.


 ,
, 
