Article

Cognitive Cardiac Assessment Using Low-Cost Electrocardiogram Acquisition System

by
Milan Milivojević
1,2,* and
Ana Gavrovska
1
1
School of Electrical Engineering, University of Belgrade, Bulevar kralja Aleksandra 73, 11120 Belgrade, Serbia
2
Department School of Information and Communication Technologies, Academy of Technical and Art Applied Studies Belgrade, Zdravka Celara 16, 11000 Belgrade, Serbia
*
Author to whom correspondence should be addressed.
Electronics 2025, 14(12), 2468; https://doi.org/10.3390/electronics14122468
Submission received: 13 May 2025 / Revised: 14 June 2025 / Accepted: 16 June 2025 / Published: 18 June 2025
(This article belongs to the Special Issue Emerging Biomedical Electronics)

Abstract

Information and communication technologies are revolutionizing cardiac monitoring. Particularly, different Internet of Things (IoT) devices are gaining popularity, although basic cognitive tools that rely on electrocardiograms (ECGs) are still uncommon. Here, an ECG acquisition system for cognitive load analysis has been developed based on an Arduino-based, low-cost device for signal processing, recording, analysis, and classification. The system used network components such a cloud server for storage and related functions. By comparing the recorded signals to the reference professional medical device, the quality of the signals was confirmed. The Stroop test was used in the experiment to measure cognitive load in healthy subjects. The cognitive test caused, in most cases, characteristic changes in the structure of a large deviation multifractal spectrum. Thus, a new classification model based on multifractal total variations was presented for cognitive load assessment based on an ECG. The proposed cosine kNN (k nearest neighbors) approach yielded high accuracy results of above 90% using five-fold cross-validation, which were compared to other methods. It applied a relatively small number of features, including the Shannon entropy and the total variations.

1. Introduction

In recent years the development of the Internet of Things (IoT) has experienced rapid growth, significantly shaping our daily lives. The application of IoT systems in the field of medicine leads to the creation of the IoMT, or the Internet of Medical Things. These technologies encompass a wide range of connected sensors and devices that enable a personalized approach to healthcare for each individual. The possibilities offered by these systems include various telemedicine services, such as monitoring elderly individuals, tracking vital and other parameters, remote consultations, and computer-assisted rehabilitation [1,2]. Electrocardiogram (ECG) acquisition is performed primarily for medical and healthcare purposes. For monitoring and computer-aided diagnosis, it is necessary to record ECG signals of sufficient quality with minimal waveform distortions that may arise due to the presence of various interference and noise. For remote monitoring and diagnosis, numerous IoT devices have been created to work together with remote data processing and storage [3,4]. Therefore, for such devices, it is very important to collect various types of ECG signals. Moreover, device development includes ECG analysis and involves extracting a wide range of features for the detection of different conditions or states that are not directly related to the diagnosis, such as activity monitoring for athletes or individuals [5,6,7]. Over time, the creation of ECG acquisition devices has significantly advanced in both hardware and related software capabilities. In particular, ECG recording times were lengthened to enable computer-based analysis [8,9,10,11]. With the help of computer-aided analysis, quicker diagnoses are made with significant accuracy and efficiency improvement of clinical work [12,13]. The ECG acquisition system based on the IoT concept contains sensors, a gateway that collects data using wired or wireless connection. The signal is usually further forwarded using the network protocols to remote servers where some kind of analysis and decision making is performed [14,15,16].
Various systems, mostly relying on IoT, are available for monitoring health conditions as presented in [17,18,19]. In addition to ECG signals, monitoring systems usually gather other physiological signals, like respiratory signals, blood oxygen saturation, and more. Most of such models involve simple R peak detection and analysis of heart rate variability (HRV) [20,21,22,23,24,25,26]. Few systems explore the wider and non-medical implications, such as monitoring physiological signals under conditions of increased cognitive load. The detection of cognitive influence requires more complex models and methods for analysis and feature extraction [27,28,29]. Generally, this is not an easy task to perform. ECG signals can be recorded simultaneously with other physiological signals, like the PPG (photoplethysmography) signal in [30] or as a part of a larger multimodal set of signals, including breathing, electrodermal signals, and similar, as in [31]. Mostly, HRV is analyzed, and features are extracted in the time and frequency domains [30,31,32]. An ECG can also be recorded with EEG (electroencephalography) under induced cognitive load conditions [33].
There are also cognitive load detection systems using just ECG signals [34,35,36], but they are rare and include simple monomodal approaches for monitoring. For emotional state assessment, only the ECG signal was used in [37], where morphological ECG characteristics were analyzed. Moreover, there are studies of mental fatigue and attention analyzed in [38,39,40]. Cognitive load assessment can be made when considering various stimuli such as audio, video, odors, etc. [41,42]. The Stroop test is especially useful for evaluating cognitive load with PPG, as highlighted in [43].
In this paper, cognitive load analysis using an ECG monitoring acquisition system and Stroop test is performed. The goal is to develop an ECG-only-based acquisition system for cognitive load assessment using low-cost components suitable for the Internet of Things domain. Data from healthy volunteers undergoing a cognitive test provide the experimental results, where a new classification approach for Stroop-related cognitive load is proposed. These findings have the potential to aid in identifying cognitive load in a broader population and IoT environment. The contributions of this paper are as follow:
-
An ECG acquisition system for cognitive load analysis is developed based on a low-cost device and graphical interface, in order to control and store the recorded data on cloud storage.
-
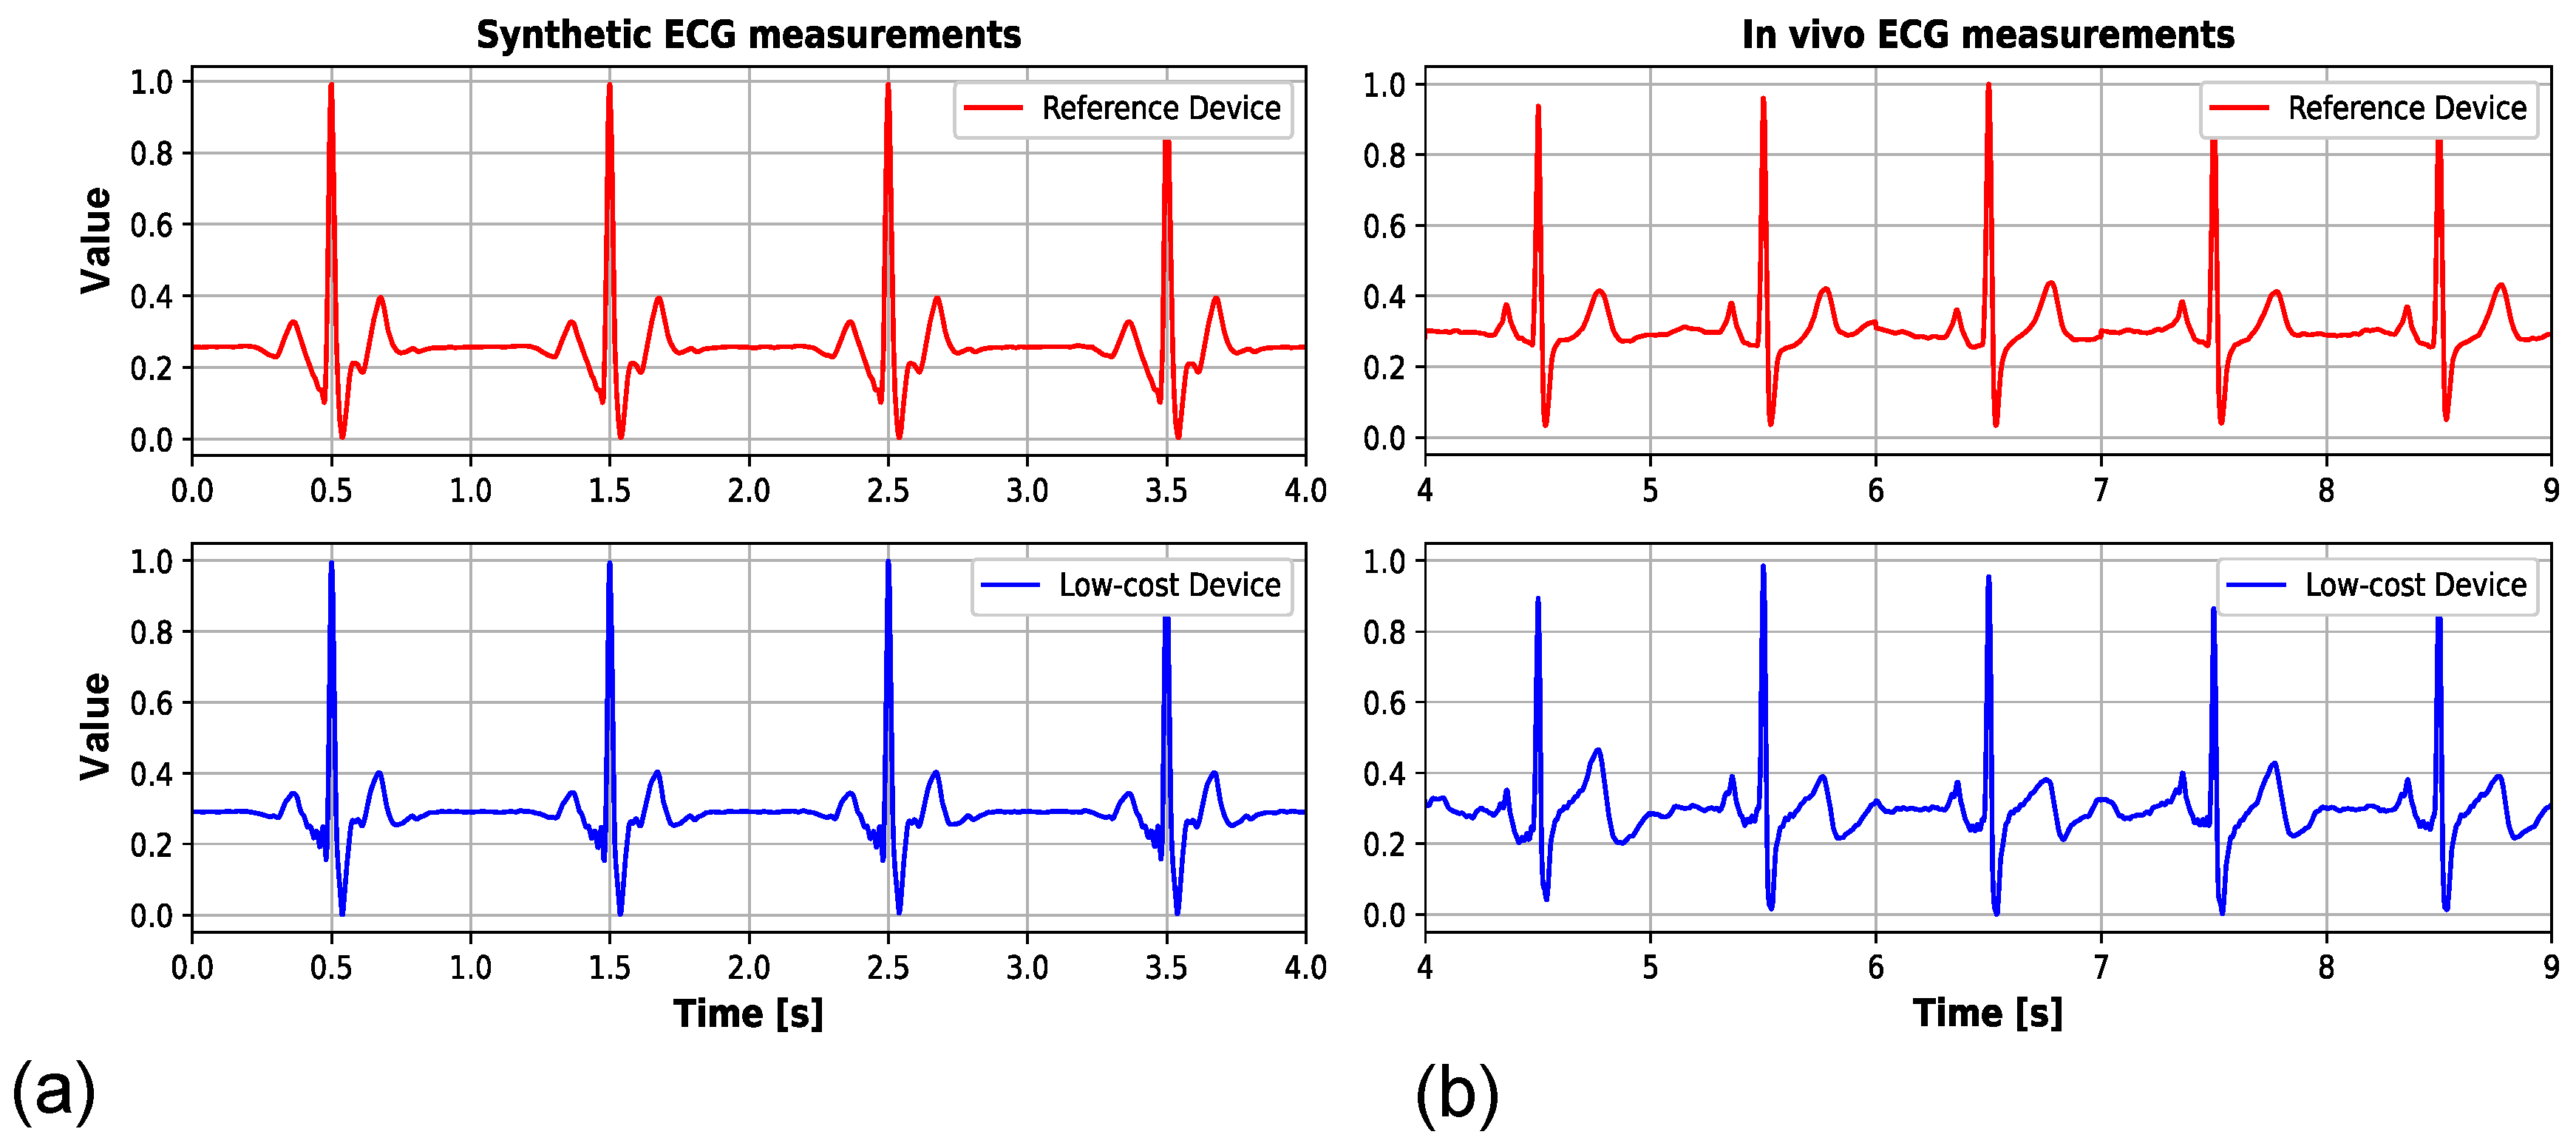
The signal acquisition is analyzed using the low-budget device synchronously with the reference professional acquisition medical device, where signals originate from both the ECG signal generator and healthy volunteers.
-
The novel ECG-only cognitive load examination is performed using the device and the Stroop test.
-
The new classification method for the ECG-based cognitive load presence via Shannon entropy and multifractal total variation features is proposed.
-
The proposed classification model applies a relatively small number of features.
The rest of this paper is organized as follows. In Section 2, related works are presented, such as the works on various ECG monitoring devices highlighting cognitive load examination using cardiac-based analysis. Section 3 is dedicated to materials and methods, where the data acquisition system and the experimental setup are explained. The included components are described, and the Stroop effect detection approach is introduced. In Section 4, the experimental results are presented and followed by discussion in Section 5. Finally, Section 6 concludes the paper.

2. Related Works

There are several directions for the application of ECG and heart rate signals, including hardware development for acquisition, data gathering, and increasing the accuracy of diagnosis [3]. Creating ECG acquisition hardware and software is crucial, with the aim of recording good-quality ECG signals affordably and easily. In this regard, the popularity of various wearable devices that can be worn in combination with compatible devices is understandable. This offers opportunities for real-time monitoring, self-diagnosis, and remote diagnosis [4]. A substantial amount of recorded ECG data has led to the creation of numerous publicly available databases, widely regarded as gold standards for scientific research [5]. Examples of these databases include the MIT-BIH Arrhythmia Database, the AHA (American Heart Association) ECG Arrhythmia Database, the European Society of Cardiology Database, and the European ST-T ECG Database. These and similar databases often include, in addition to ECG data, other physiological signals recorded simultaneously. In this context, ECG signals can be analyzed through the lens of the big data phenomenon [6]. Extensive research efforts focus on identifying new features that can improve the accuracy and speed of medical diagnosis. To achieve this, the development of innovative tools for and application of machine learning techniques to ECG data is essential. The ultimate objective is to deliver accurate diagnoses in the shortest possible time [7]. The development of electrocardiography over the past 100 years has made it a cornerstone of cardiology for screening, evaluating, and diagnosing heart conditions. Its widespread use has led to a massive number of various recordings and datasets. Einthoven, a Dutch physician and physiologist, thought to use a string galvanometer, in which the presence of a current deflects a filament positioned between magnets, to invent the first practical ECG in 1903, for which he was later awarded the Nobel Prize. He recognized signal features and assigned them the names still used today: P wave, QRS complex, and T wave [8]. An ECG precisely records the heart’s electrical activity over time using electrodes, capturing the electrical changes from depolarization and repolarization of the heart muscles during each heartbeat [9]. The P-wave represents atrial depolarization where the right atrium pumps blood into the right ventricle. The QRS complex follows, showing ventricular depolarization as blood is pumped through the aorta. The T-wave indicates ventricular repolarization, as the heart chambers refill with blood during diastole [10]. The ECG is essential for monitoring cardiovascular and pulmonary conditions, including arrhythmias and pericardial and myocardial diseases. The ECG has evolved with advances in computer technology and machine learning. This has enabled longer-duration recordings and real-time ECG monitoring for computer-assisted analysis [11].
In clinical practice, ECG application is essential and is not limited to the detection of acute and chronic myocardial injuries, cardiac arrhythmias, structural heart diseases, and inflammatory conditions such as pericarditis. It is utilized across various medical fields, including cardiology, emergency medicine, and internal medicine [12]. Over the past century, remarkable technological and procedural advancements have been seen in medicine, and ECG interpretation has evolved alongside these developments. Also, over 50 years ago, computer-based analysis of ECGs was introduced, enabling automated extraction, analysis, and interpretation. The primary goals were to enhance accuracy and efficiency and streamline clinical workflows [13]. Acquisition of ECG records is one of the simplest ways to evaluate the state of an individual. Routine cardiac monitoring using a common three-channel acquisition system is illustrated in Figure 1. Einthoven’s triangle represents a standard geometric arrangement of three electrodes, where the positions are denoted as RA (right arm), LA (left arm), and LL (left leg).

2.1. Related Works on ECG-Based Cardiac Monitoring Devices

Numerous ECG-based devices with various applications have been developed, primarily oriented towards healthcare and cardiac monitoring [14,15,16,17,18,19,20,21,22,23,24,25,26,27,28,29].
In [14], a monitoring device for long-term ECG examination has been proposed. The design of the IoT device included the analog front-end integrated circuit from the MAX3000x series with sensors. In the system, the gateway and the cloud application are included. Dry textile electrodes are implemented in the device instead of standard gel electrodes for the acquisition of longer recordings. Statistical analysis is performed using the device, where heart rate values as minimum, maximum, and median are acquired and where ECG morphology is analyzed through ST segment changes, heart rate changes, pauses, and blocks. The authors of [15] introduce ZeroEcg, a battery-free, wireless, lightweight tag integrated with the commodity of RFIDs. ECG-sensing devices may fail to detect abnormalities in a timely manner due to some activities, so the electronic-skin-like device is applied to track the ECG during activities. For mobile and smart ECG devices, integrating automation is needed, so in [16], an artificial intelligence (AI)-based framework is considered in order to provide remote cardiac health monitoring. The system includes wearable sensors in the perception layer and an AI model in the cloud application layer. So, a multi-level ECG feature detector is applied for health monitoring. Three transforms are tested and analyzed, namely discrete wavelet, dual-tree complex wavelet, and maximal overlap discrete wavelet transform. In [17], wearable devices are analyzed as a promising solution for continuous monitoring of health metrics. Smart watches, fitness trackers, and other devices usually acquire vital signs, where these devices have sensors for PPG, electromyography (EMG), EEG, ECG, blood oxygenation, etc. Machine learning (ML) is considered an important part of healthcare devices, to detect or predict conditions, while recharging and limitations of low-power devices are typical challenges. An IoT ECG monitoring system for healthcare is proposed in [18]. ECG data are gathered and transmitted directly to the cloud using a Wi-Fi network. The focus is on collecting ECG data that are helpful in the primary diagnosis, where Hypertext Transfer Protocol (HTTP) and Message Queuing Telemetry Transport (MQTT) protocol are employed. Another system for monitoring the user’s health condition is proposed in [19]. The authors propose the Remote Mobile Health Monitoring (RMHM) system, where the Zephyr BioHarness TM sensor is applied. This system captures comprehensive physiological input, such as the ECG, breathing, RR interval, heart rate, respiration rate, posture, activity level, and similar data.
The cost-effective strategy in ECG cardiac monitoring devices is described as the current trend in [20]. The hardware sensing system in [20] is designed using four ESP32 microcontroller boards integrated with Wi-Fi and Bluetooth connectivity, where the 14 different sensors are tested. In [21], low-power, high-fidelity HR monitoring is performed using an IoT device for improving monitoring robustness and accuracy compared to PPG. A continuous recording device for monitoring ECG and EMG is proposed in [22]. It offers support for early disease screening, diagnosis, and health warning. An ambulatory device prototype is designed in [23] in order to improve access to cardiac monitoring and enable quicker and more accurate diagnoses. ECG devices are the mainstream technology in cardiac monitoring. For example, in [24], silver-coated fiber/silicone (AgCF-S) electrodes are used to gather ECG data. The ECG watch device acquisition presented in [25] is compared to simultaneous 12-lead ECG recording. Typical ECG morphology characteristics, like QT and RR intervals, are measured and compared. The hot watch system proposed in [26] employs Arduino technology and Bluetooth connectivity to transmit data. The Pan–Tompkins algorithm (PTA) is applied to determine the heart rate. The device includes an MLX90614 temperature sensor, AD8232 ECG sensor, and MAX30100 oximeter sensor to gather data. The monitoring devices are developed using wired and wireless sensors [26,27].
Nevertheless, there are not so many cognitive-related ECG cardiac monitoring devices [27]. The authors in [27] developed an embedded system based on Arduino MEGA2560 microcontroller with the cognitive assessment through choice reaction time (CRT) analysis, having in mind pulse rate, oxygen saturation, and temperature. The cognitive approach was even considered within an ECG cardiovascular diseases monitoring system in [28], where ARM Cortex-M4 32-bit low-power microcontroller was applied. A SensorTile device developed by STMicroelectronics was applied in [28]. Cognitive load has been assessed using the Adafruit QTPY ESP32 dev board in [29], with the possible usage of heart rate, galvanic skin response, and temperature, where it is stated that the ECG and PPG are usually applied to track HRV, which is useful for cognitive or stress research.
It is evident that there is a lack of ECG-only-based, low-cost devices for different cognitive assessments, since in most cases this is not an easy task to perform.

2.2. Related Works on Cognitive Load Examination Using Cardiac Data

Cognitive workload estimation has been a part of various research, including cardiac monitoring [30,31,32,33,34,35,36,37,38,39,40,41,42,43]. In [30], the authors test pupillometry and ECG for 86 human subjects, where ECG electrodes are put on the left wrist. The participants listen to or memorize five, nine, or thirteen-digit sequences that were delivered audibly every 2 s. In this way, working memory and digital span are analyzed, where their manipulation over short periods of time is performed after the initial stimuli have vanished. The average HR extracted from both channels was nearly the same in the ECG and PPG data, and it was within the normal range for the tasks, meaning the cognitive workload can be accessed from each of the inputs. Another work where stress is investigated is [31], where multimodal data is collected. Measures are divided into cardiac, neurophysiological, breathing, electrodermal, and thermal, where ECG is acquired as a cardiac measure. A video survival game is selected as a stressor with specific physical activity, and a questionnaire based on fear is included as additional metadata for 48 participants. Besides HR calculated as average of RR (or NN) intervals, which are also known as interbeat intervals (IBI), standard deviation of IBI (noted as SDNN), power corresponding to low-frequency (LF) and high-frequency (HF), as well as their ratio LF/HF, are found as typical cardiac measures. For HR and IBI calculation, typically, the Pan–Tompkins algorithm is applied [32]. ECGs and EEGs are used for detection and multilevel classification of stress for different genders in [33]. SVM (Support Vector Machine) and kNN (k-means Nearest Neighborhood) models lead to the highest average classification accuracy results. A maximum classification accuracy of 94.58% was achieved using a kNN classifier trained with HF/(LF + HF) skewness, LF/(LF + HF) power, LF/HF mean, HF and LF power, mean heart rate, NN50 feature, RMSSD, and Triangular index [34]. The ECG signals are high-pass filtered at 1 Hz and examined for heart rates to exclude possibilities of cardiac arrhythmias—bradycardia, tachycardia, and premature contraction.
Besides multimodal approaches, there is also ECG-only-based cognitive load or stress assessment research. Since stress is generally emphasized as important to detect, in [35] ECG-only-based deep learning detection is performed for further management. Only an ECG acquisition system of a smart T-shirt is proposed by [36] for stress detection. The ECG collector acquires data from 20 male subjects. Since the autonomic nerve system connects the heart and brain, only an ECG has been used in various articles, as shown in [37], for emotion recognition. Features such as wave amplitudes, mean, median, standard deviation, interquartile deviation, minimum, maximum, and difference between the maximum and minimum of specific waves are usually applied. The morphology features are considered to be qrsWBR (width between R peaks and the following Q), qrsWRE (width between S and R peaks), qrsABR (difference between R peak amplitude and the next Q), qrsARE (difference between amplitude of R peaks and the consequential S), and qrsMOR (the QRS interval shape). There are also IBI-related time features, as well as frequency-based features like LF, HF, LF/HF, normalized LF or HF, spectral centroids, kurtosis, skewness, slope, total energy, corresponding variations, etc. Moreover, in their daily lives or at work, many people experience mental fatigue when executing tasks that require sustained mental efficiency. The phenomenon of exhaustion is analyzed in [38] for healthy subjects around 30 years old. Even though mental fatigue lacks a universally accepted description, mental states in the morning without fatigue and in the evening with fatigue are compared. Feature extraction of an ECG based on 9 parameters is applied: Q, R, S, and T amplitudes; QT, ST, RR, and QRS intervals; and T-wave intervals. This is followed by PCA (Principal Component Analysis) and a Random Forest machine learning technique with an accuracy of around 95%. Driver cognitive load detection is the main focus in [39]. Mean IBI, pNN50, SDNN, and RMSSD (root mean squared difference of successive IBIs) are among the tested features. Higher LF values and HF/LF ratios are also found. Among the tested methods, the one reported in [40] gives 98% accuracy, where input for ML is an ECG scalogram image.
Various cognitive effects may be produced for differentiation. In [41], it is shown that entropy is a valuable measure of the variability of both ECG and EEG, revealing a significant correlation between the records for various states. Heart functioning is similarly affected by different odors. In [42], the entropy feature accompanied with HR shows potential for cognitive load finding. Finally, the CogWear data represent a pilot study that includes physiological signals measured by three devices, including an Empatica E4 watch [43]. Recordings are performed in two phases: baseline and after a cognitive test. In this case, the Stroop test is applied to measure the cognitive effect. Thus, the Stroop test is chosen here, as well as an appropriate test. In Table 1, a brief insight is provided into the Arduino-based, consumer-grade and medical-grade components of the acquisition systems.

3. Materials and Methods

The acquisition is based on the Arduino platform and the Olimex Shield ECG/EMG expansion module. The Arduino platform, which is commonly used for health monitoring [26,27], was chosen to be a foundation of low-cost device prototype that can measure changes in heart rate and cognitive effects. Figure 2 shows a system for ECG signal acquisition and cognitive assessment. The user applies this IoT monitoring device as noted in Figure 2. The module is connected to the torso of the volunteer with a suitable three-conductor cable and a self-adhesive gel electrode. During the acquisition, a volunteer is either subjected to cognitive load (Stroop test) or not subjected to cognitive load (baseline state). The Arduino device is connected to a PC computer (gateway) via a universal serial bus (USB) cable, where the gateway is used for managing the acquisition process, as well as for communication with the cloud server for the cognitive movement detection process. Application with an appropriate graphical user interface is implemented to manage the acquisition (recording button), basic preprocessing (processing button), and detection (detection button) processes. During recording, parameters such as recording time can be set. Basic preprocessing involves filtering the ECG signal (Filter) to suppress unwanted interference and noise (50 Hz noise, etc.). There is an Internet connection via Ethernet cable so that the filtered ECG signals can be transferred to the cloud server by activating the detection options. ECG signals are transferred to the cloud using the MQTT protocol [44]. MQTT is a robust protocol for transmitting biomedical signals in an IoT environment where simplicity and energy efficiency are imperative. It is based on the publish–subscribe model and uses APIs such as publish, connect, disconnect, subscribe, and unsubscribe in server–client interaction [45].
Additional processing such as multifractal spectrum calculation and analysis is performed on the cloud. Then, features are extracted for the purpose of the detection of cognitive load using the proposed machine learning (ML) model. Information about the detected state (Response) is transmitted back to the gateway and displayed in the corresponding part of the graphical interface. Phase 0 (baseline mode) and Phase 1 (post-phase) are represented in the interface via blue and red, respectively. The recorded signals, as well as the calculated spectra, features, and parameters of the model used to detect the condition, are stored within the data cloud storage.
The recording was performed in a room with minimal level of noise and sudden impact. The air-conditioned room was maintained at normal temperature (20–22 °C) and humidity. Before recording, volunteers were asked to spend 15 min in a seated position to eliminate the effects of previous physical activity. All participants gave their consent to participate in the study. For data collection, interpretation of data, or any other similar reasons, generative artificial intelligence was not used. The acquisition part can also be used when, instead of in vivo measurements on volunteers, a synthetic ECG signal source in the form of an ECG generator is employed. These are standard reference devices with autonomous power supply. As a control parameter, the target number of beats per minute (HR) was given. The detection option was then not available in this operating mode.

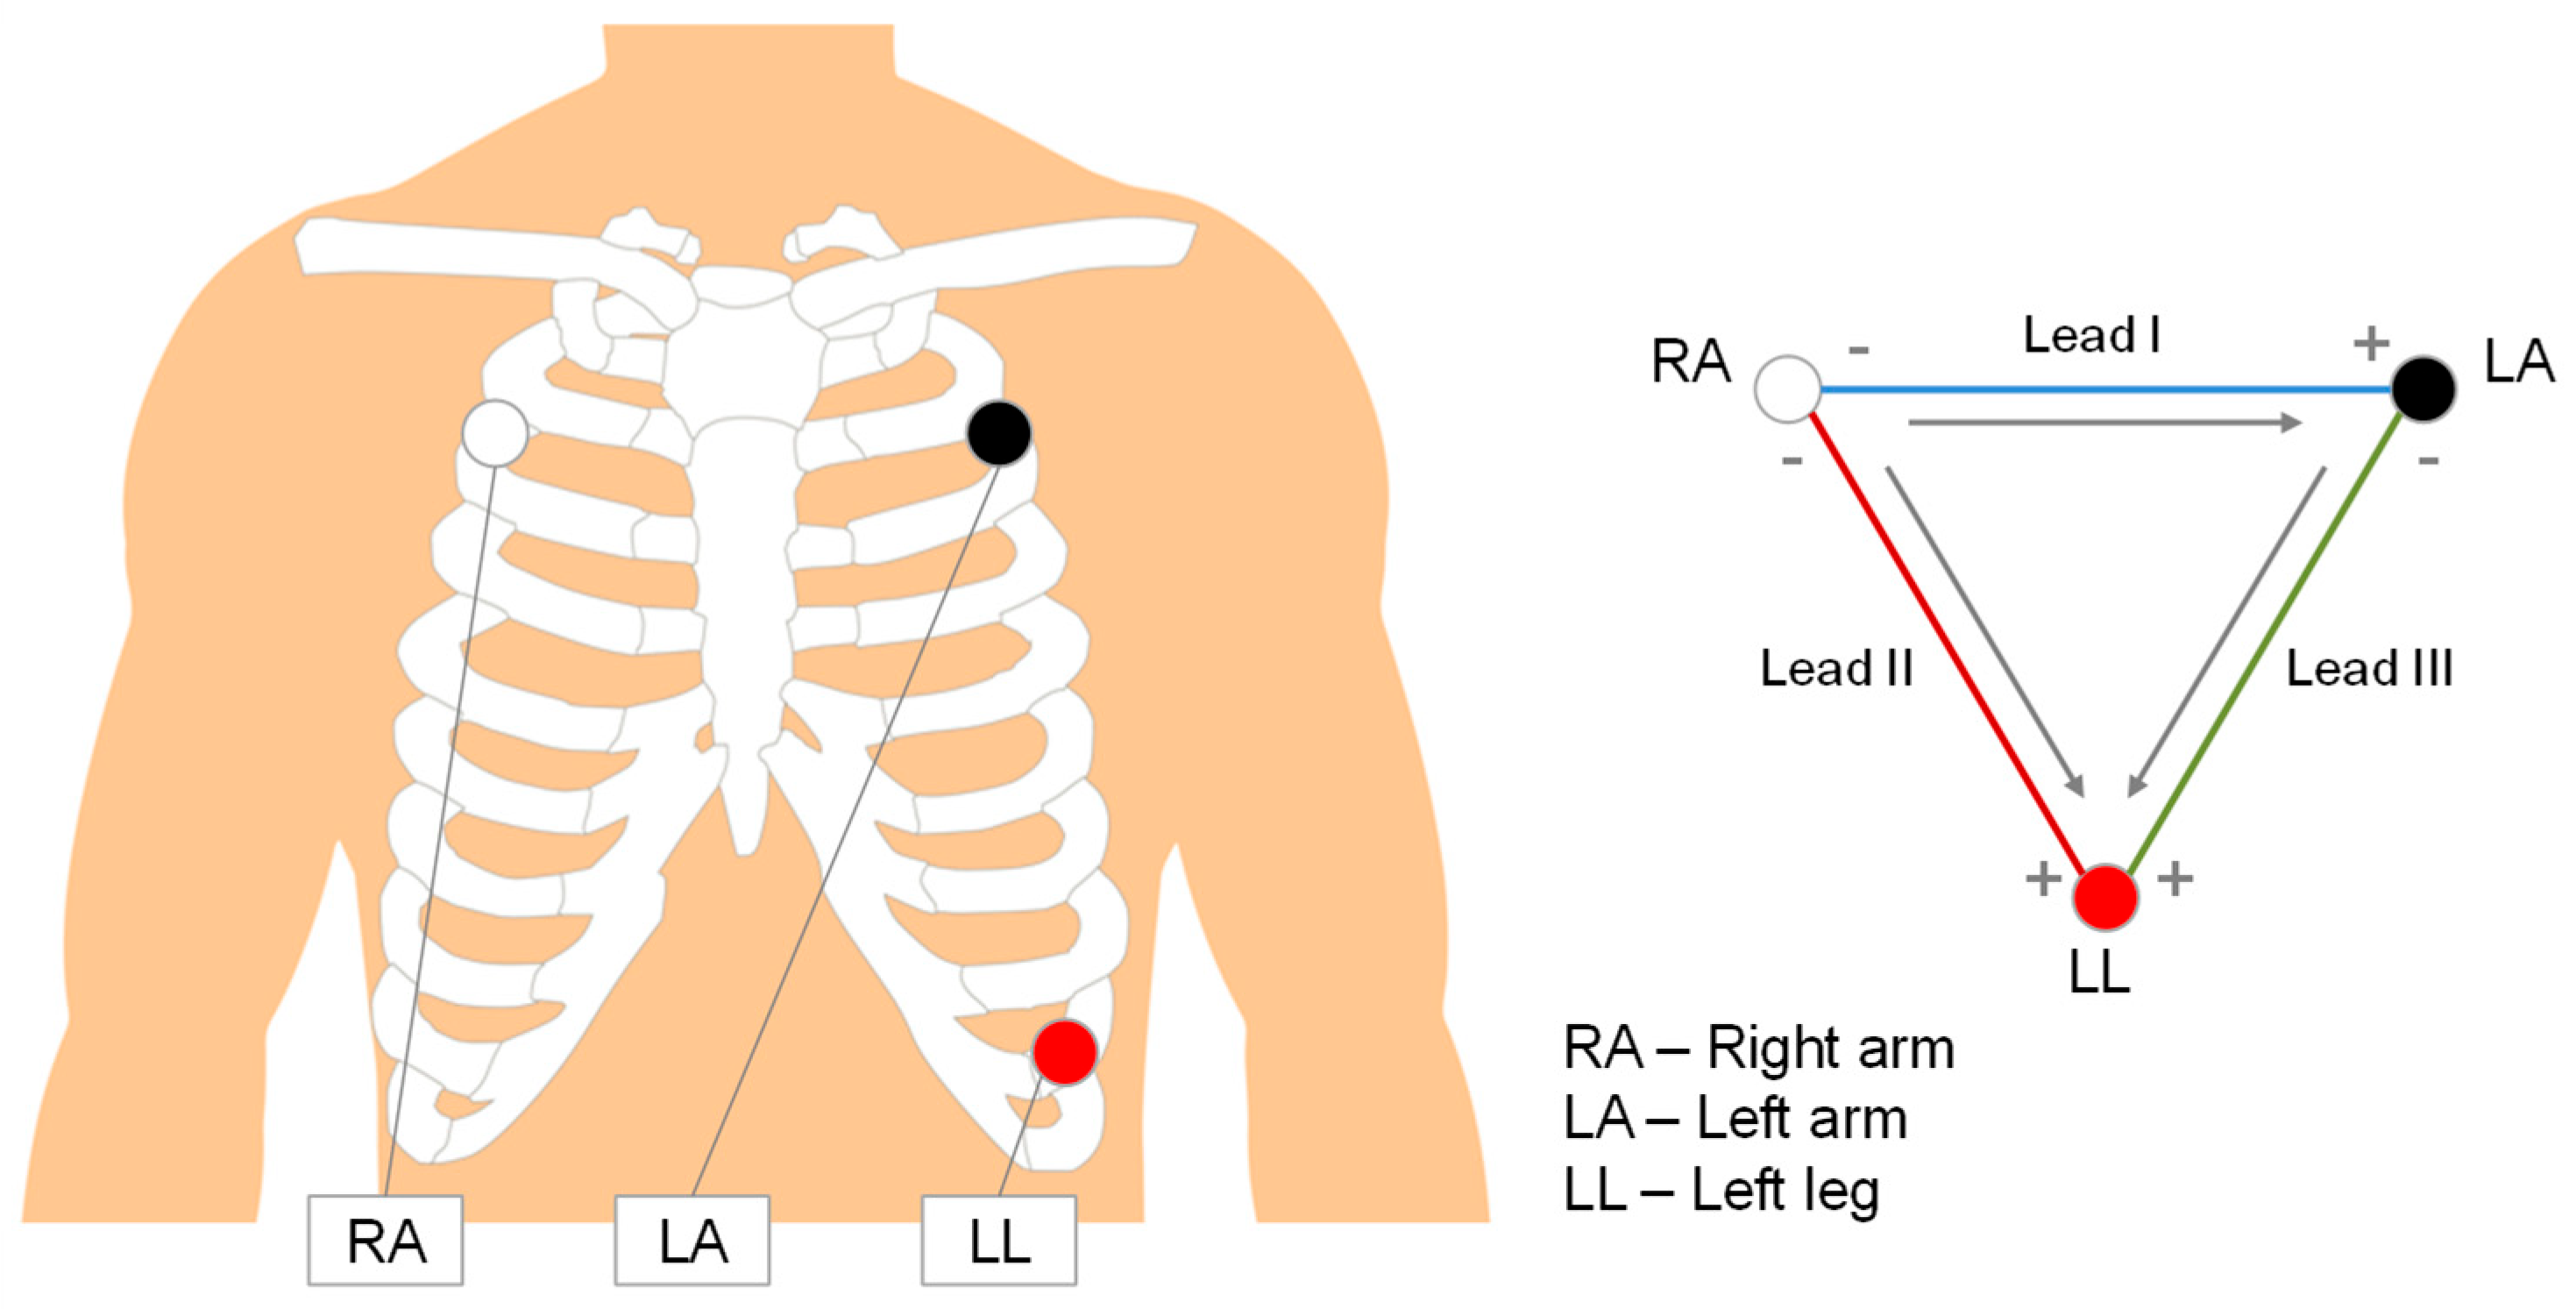
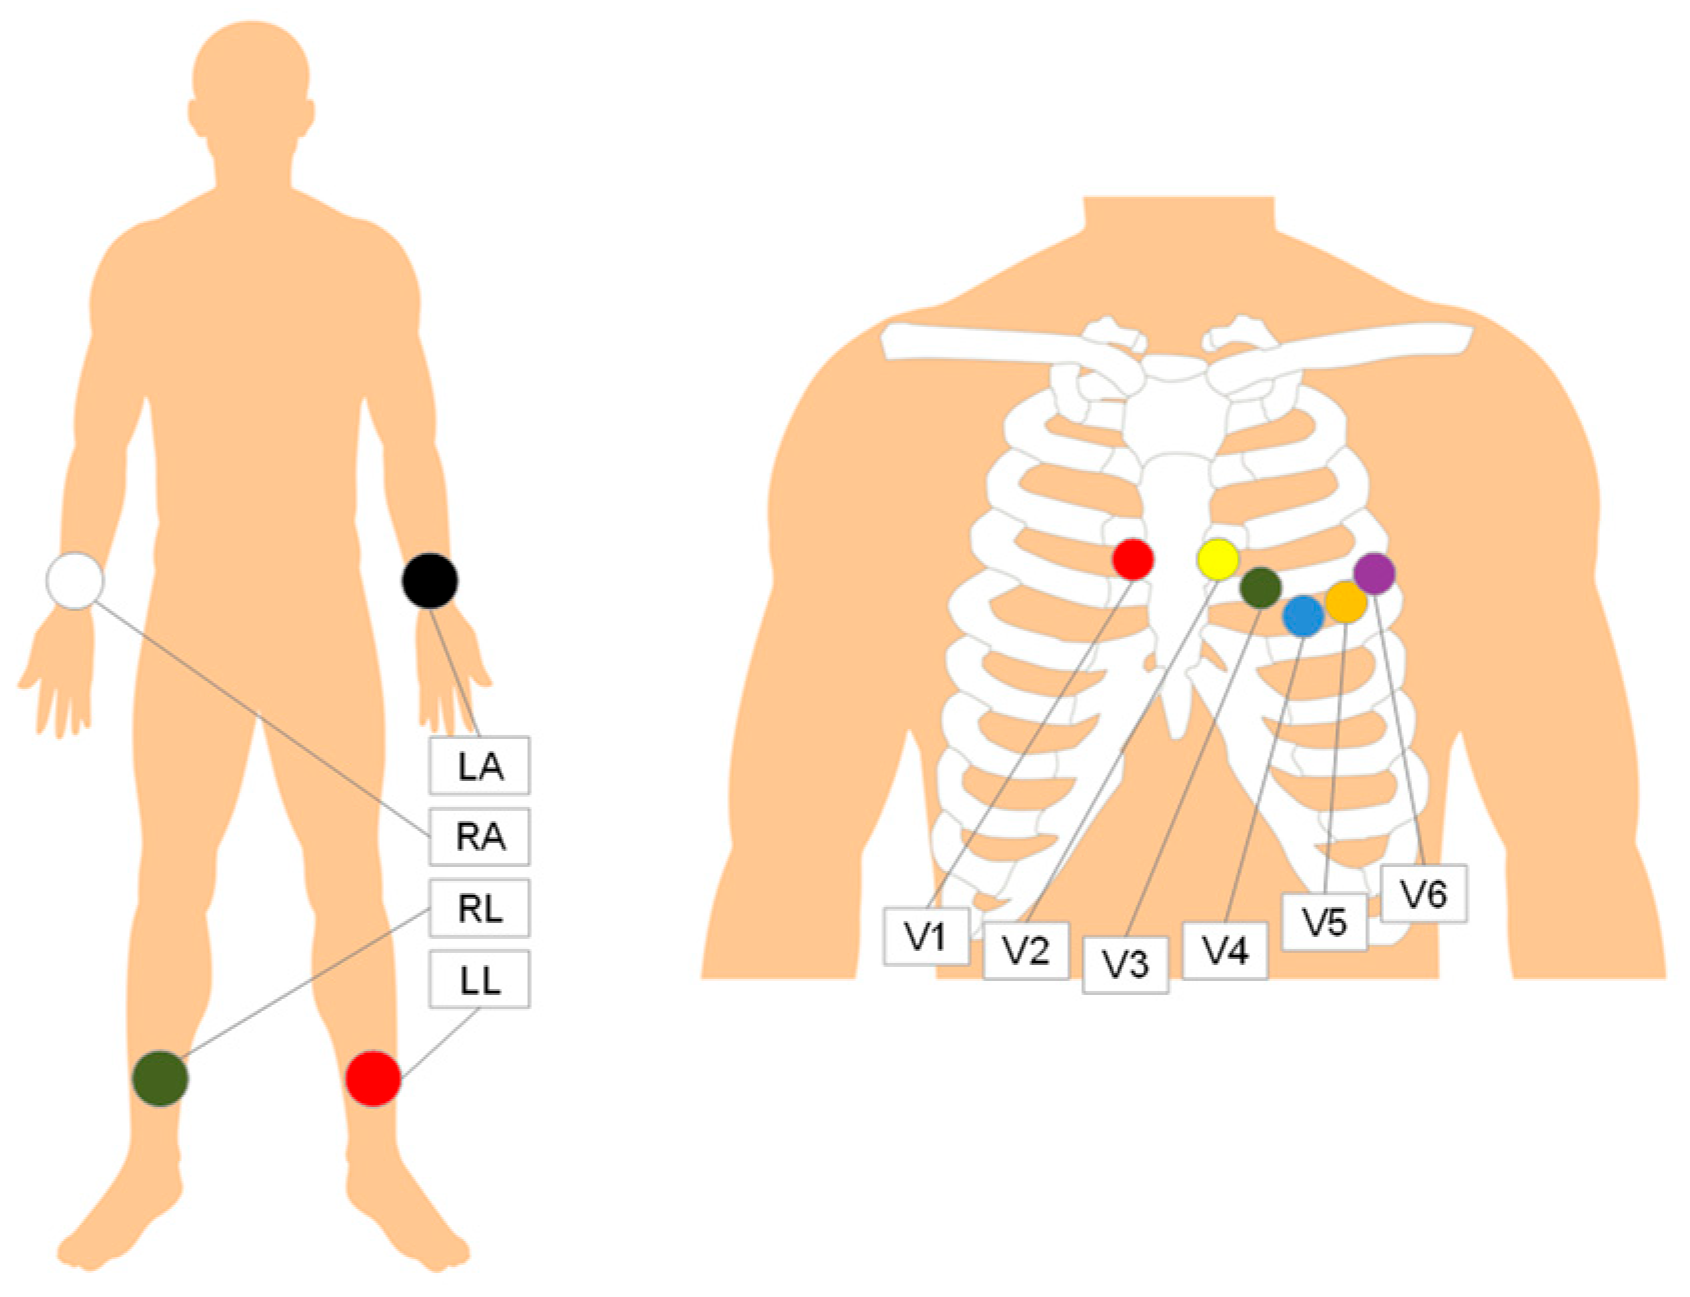
3.1. Description of Low-Cost Monitoring Device and Synthetic Data Acquisition

The low-cost device components for the in vivo measurements are presented in Figure 3. Moreover, ECG generator Cardiosim I is applied for comparison, and synthetic ECG signals are generated instead of in vivo measurements. This is also shown in Figure 3.
An Arduino UNO board and an ECG/EMG module are coupled to create the low-cost device, which can be used to capture ECG signals and collect heart rate changes. With the aid of extension modules, the well-known low-cost Arduino UNO microcontroller board offers a wide range of functions. An analog-to-digital converter (ADC) is located on the microcontroller board. A sampling frequency of 256 Hz, 10 bits of resolution, and an operating voltage of 3 V represent the typical specifications of analog-to-digital conversion. ECG signals are acquired using open-source hardware like the ECG/EMG module (Olimex Shield ECG/EMG, Olimex Ltd., Plovdiv, Bulgaria) that was utilized. The module is connected to the Arduino board via its own pin system, which enables power supply to the module, as well as data transfer during acquisition. The code that is inserted into the main microcontroller board’s memory controls the digitizing and data-transfer processes. Moreover, developed software provides an appropriate graphical interface implemented on the computer’s side for the data acceptance. It deals with the acquisition process control, meaning the start and duration of each recording and local storage capacity.
The Arduino board is connected using a USB connection. A professional cable is connected to the module via a standard 3.5 mm connector. It has three ends that are used for ECG electrodes. Ag/AgCl electrodes encased in conductive gel represent standard ECG electrodes [46]. Left arm (LA), right arm (RA), and left leg (LL) are the three electrodes, i.e., the electrode locations suitable for a three-lead or three-channel device. In this manner, an ECG signal that corresponds to channel II is obtained. After being converted by ADC, it is further transferred.

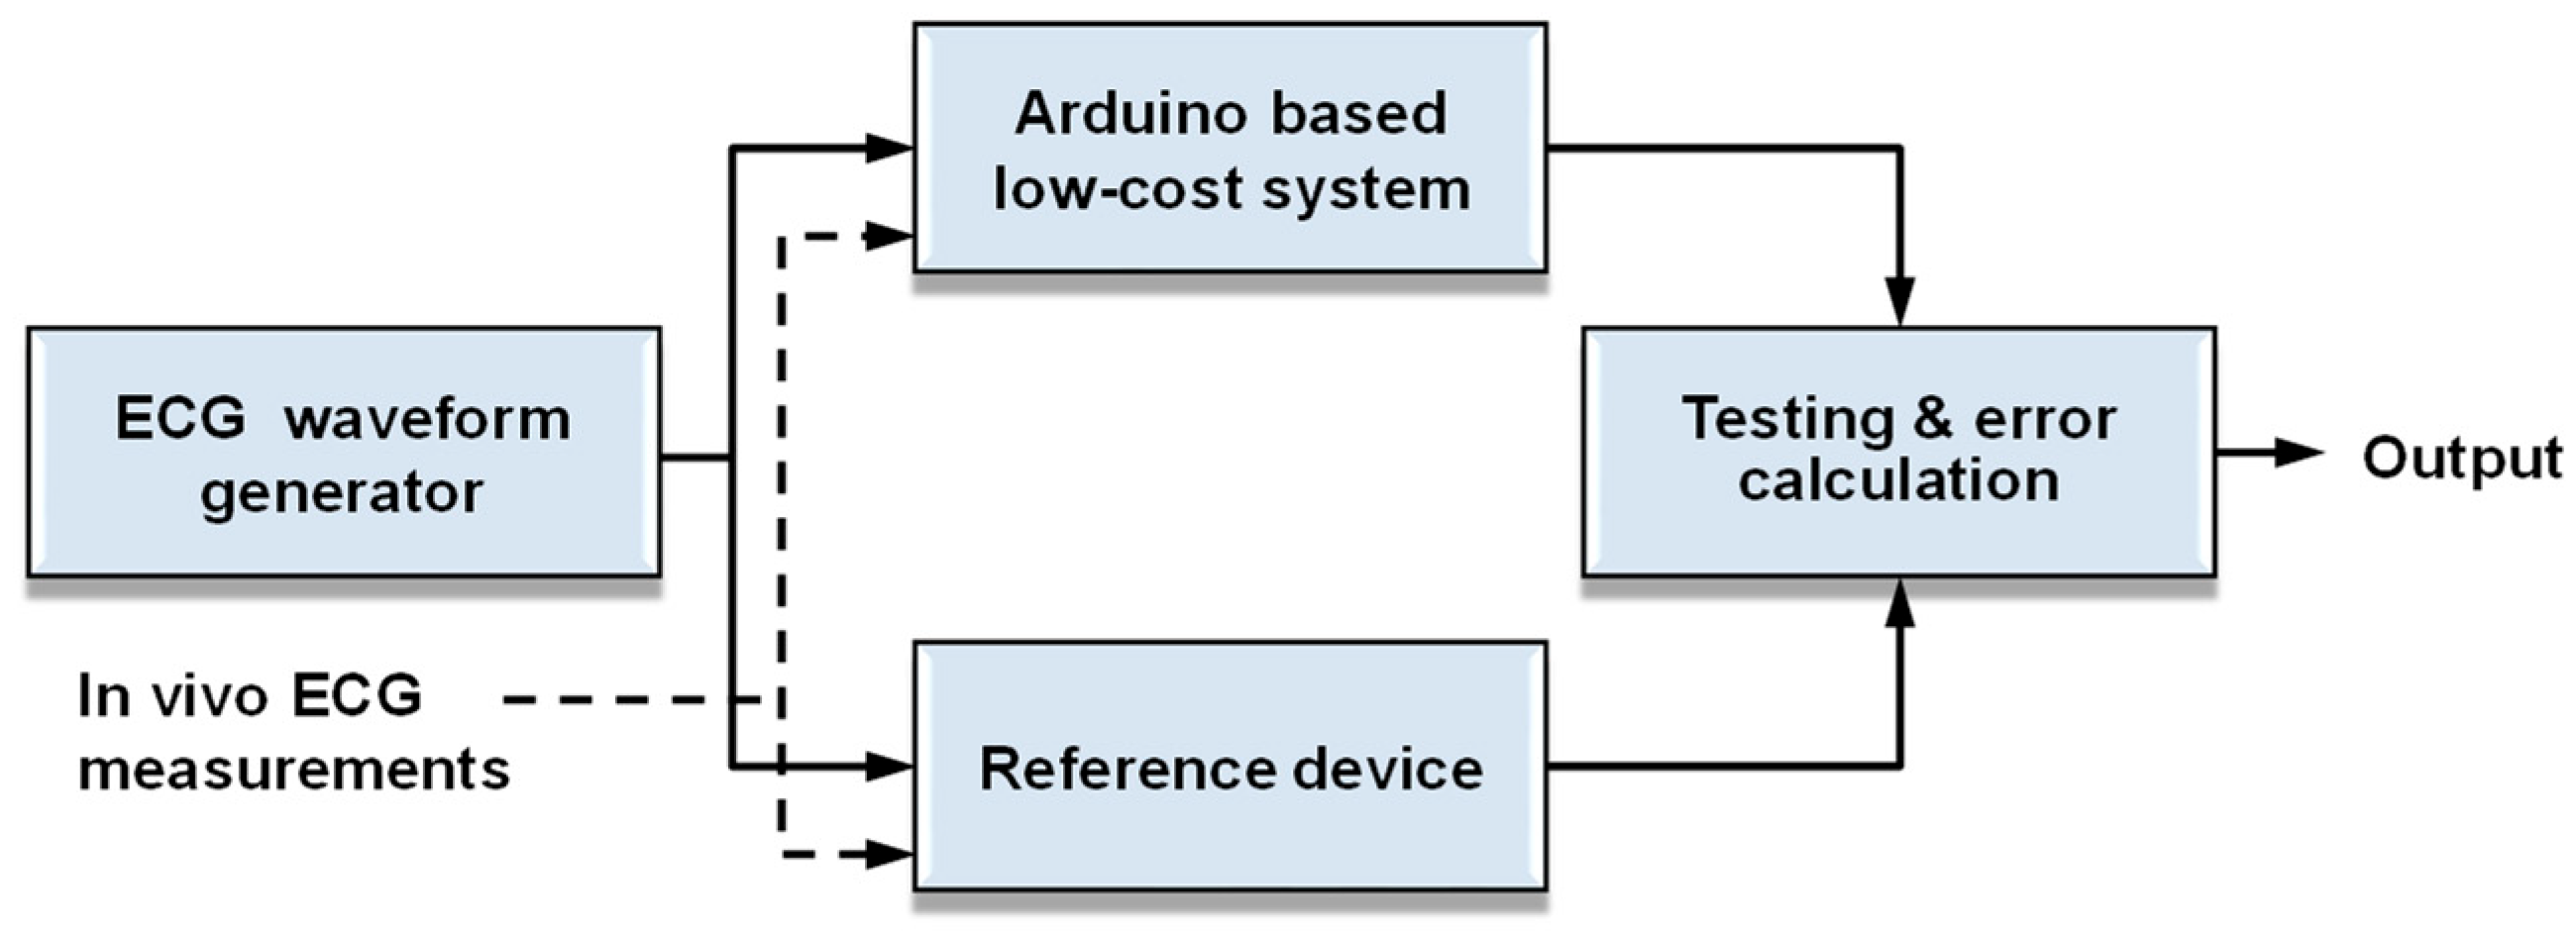
3.2. Reference Device-Based Performance Assessment

For the performance assessment, a professional reference device is applied. The reference device is based on the 12-lead Wilson system. The potential values from the unipolar electrodes determine the three basic bipolar leads, such as channels I, II, and III:
I = LARA, II = LLRA, III = LLLA.
In a system with relatively inexpensive components, this also depicts the signals acquired in the three-lead experimental setup. The potential value of Wilson’s central terminal VW is further defined by the potential values obtained from the unipolar limb electrodes:
V W = 1 3 R A + L A + L L
Electrocardiography uses a man-made reference, the potential value of which is nearly zero, throughout the cardiac cycle. Averaging the potential values from the unipolar limb leads, which are determined by Einthoven’s triangle, yields the value of this potential. The electrical center of a heart muscle is thought to be electrically equal to this point. The augmented limb leads are considered stronger signals than in the Einthoven case. The precordial leads V1–6 are measured as the potential difference between the exploring chest electrode and the central terminal, as follows:
Vi = ViVW, i = 1,…, 6.
The positions of the Wilson system leads for the assessment are presented in Figure 4.
The Medset PADSI 12 Channel ECG Heart Monitor [47] is used as the reference recording device—it is atypical part of professional medical equipment for clinical use. The device allows simultaneous recording of up to 12 ECG channels while a stress test is being performed or an individual is at rest. It has an ECG amplifier with appropriate electrodes and uses the sampling frequency of 500 Hz. This device is connected to a computer using Bluetooth protocol. The Padsi ECG software v7.6f [48] sets the parameters and manages the recording process while using the HES (Hannover ECG System) algorithm for ECG signal acquisition. Over the previous 40 years, these algorithms have undergone constant optimization [49]. Each ECG recorded during the reference device experiment is stored in HES format. Here, channel II is of interest. For the assessment, both waveform generator input and in vivo measurements are used, as shown in Figure 5. In the waveform generator case with no abnormal alterations, the signal is quasi-periodic and possesses traits similar to the traditional ECG normal sinus rhythm. Data transfer is performed using a serial COM virtual port with a throughput of 57,600 symbols per second. The generator has the ability to connect the acquisition device electrodes without changing the generated HR value. HR represents the number of beats per minute corresponding to the generated signal, here meaning 60 bpm. The tests are also performed for the in vivo case. For comparison between the Arduino-based device and the reference device, the mean absolute percentage error (MAPE) is calculated as in [50].

3.3. Cognitive Load

It is known that cognitive load can be manifested during cardiac monitoring. For the cognitive load in experimental conditions, the standardized Stroop test is the most common choice; the original work was published by J. R. Stroop in 1935, and it refers to the research of the phenomenon of attention, interference, and inhibition of cognitive processes [51]. The Stroop test is characterized by its simple structure and use, as well as the comparison of results in different conditions. In general, the test shows a high sensitivity to the presence of interfering factors that affect response inhibition. The standard Stroop test, also known as the Color-Word Interference Test, was used by Stroop in another experiment. The task involved participants naming the color in which the words were printed. There are two types of stimuli: (1) congruent (control) stimuli, in which the semantic meaning of the word matches the color of the letters, and (2) incongruent stimuli, in which there is a discrepancy between the meaning of the word and the color in which it is written [52].
Cognitive interference is manifested through the difference in reaction time between congruent and incongruent stimuli. This difference indicates the presence of a cognitive load that arises due to the need to inhibit the automatic tendency to read the meaning of words in order to focus attention exclusively on the color of the letters [53]. In this context, the Stroop test is used as a measure of the ability of selective attention and executive functions. At the same time, it represents a reliable method for measuring resistance to distraction and information processing capacity under load conditions [54]. Here, a variant of the Stroop test that uses colors and words as stimuli were applied. Eight different colors were used in the test: red, orange, cyan, yellow, black, green, violet, and blue. The number of colors in this test exceeds the number used in the original version, and this was done with the aim of inducing a more pronounced cognitive load in the examinees. Volunteers were presented with a word that either matched the color of the letters in which it was written or was not consistent with it. Stimuli were generated randomly according to a uniform distribution, so that combinations of colors and words were formed without a systematic order. In this way, cards were used that were successively shown to the participants during the experiment. The subject’s task was to name the color of the word in a normal tone while ignoring its meaning. Each stimulus was presented 5 s apart. For the purposes of stimulus generation and presentation, the Python v13.2.5 programming language was used, with the application of the corresponding PsychoPy library [55]. The baseline or Phase 0 meant the cognitive load was not introduced by the Stroop test, while the post-phase or Phase 1 meant that the test was performed. Nevertheless, the introduced effect could possibly be detected by machine learning without any prior knowledge. Thus, the low-cost system was used for data collecting and detection.

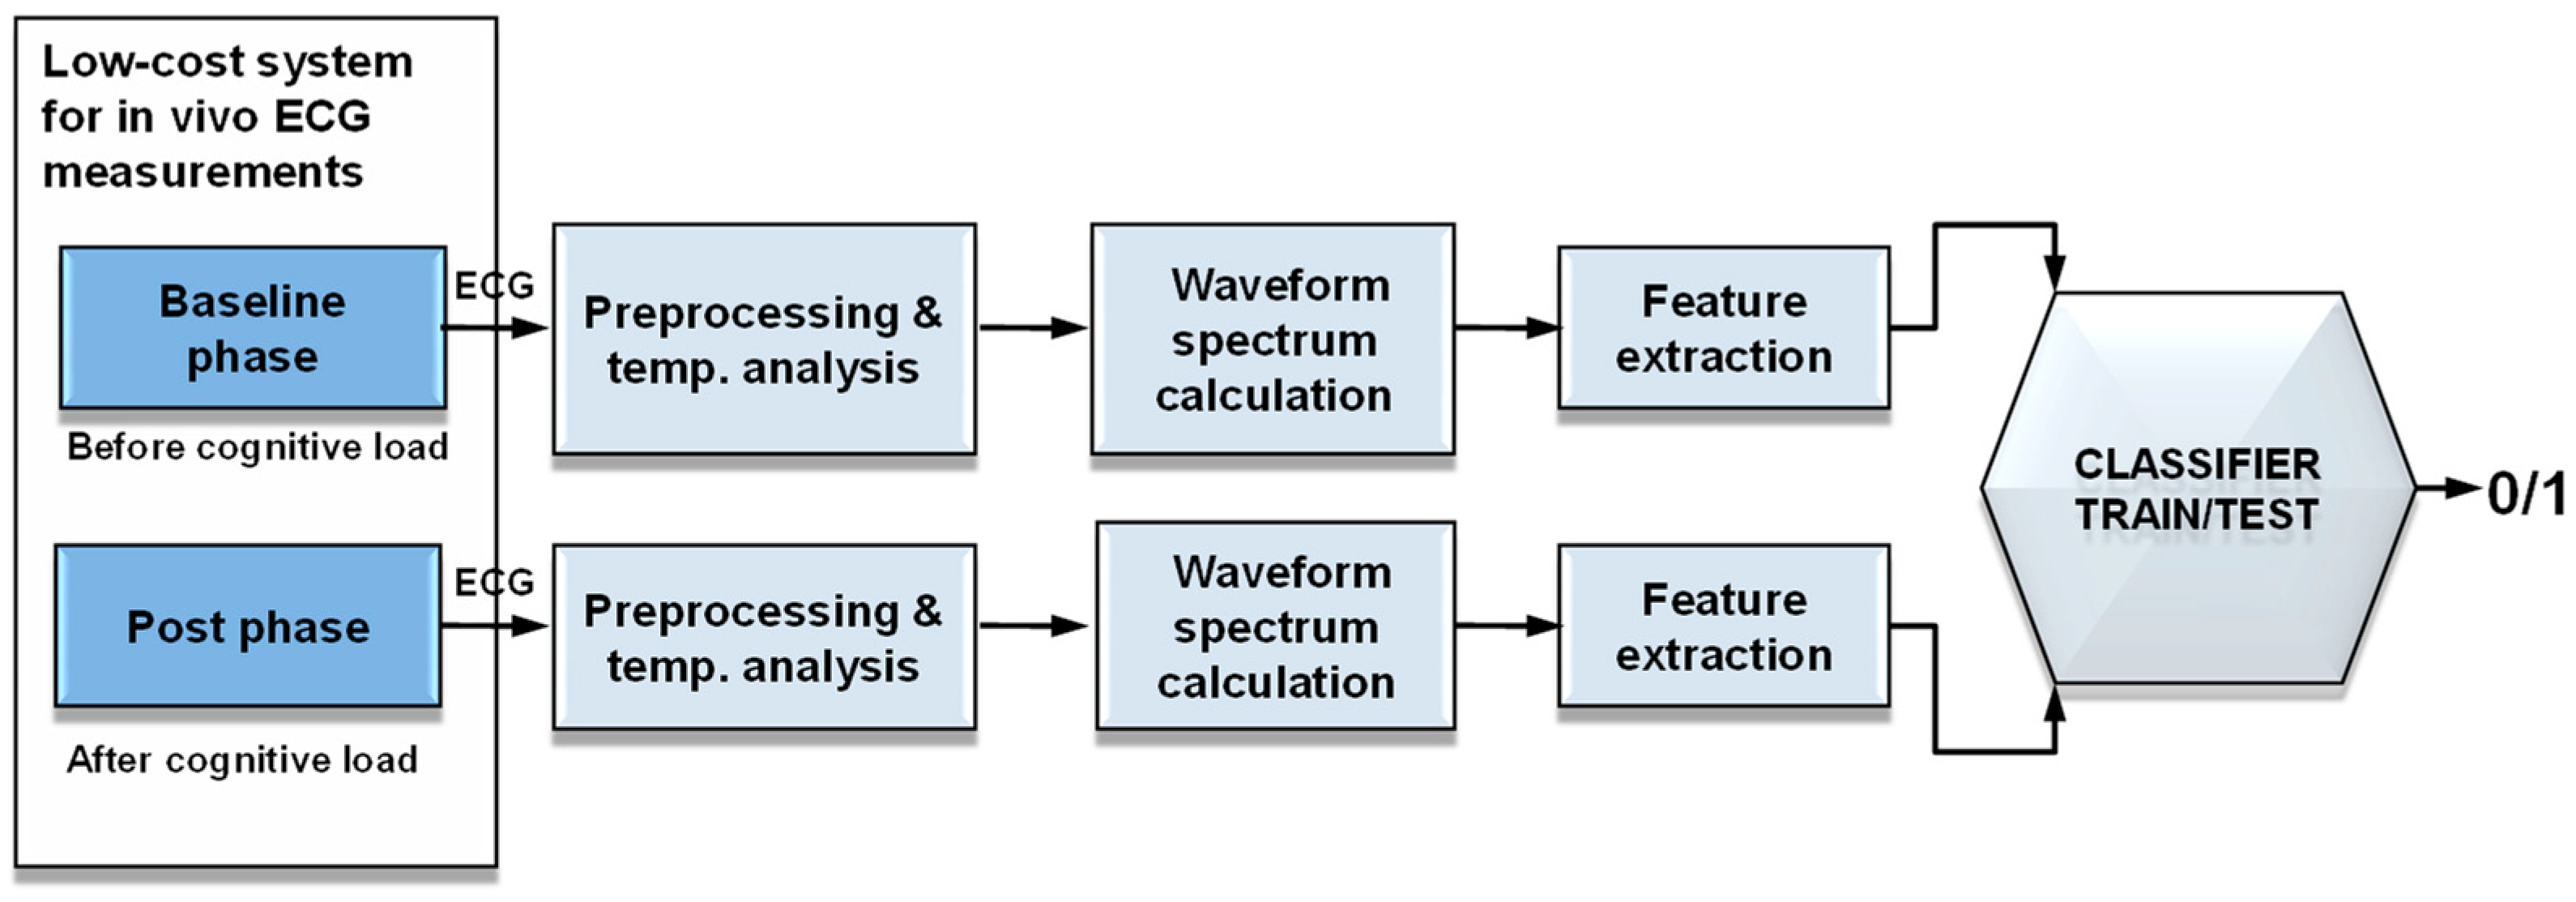
3.4. Cognitive Load Detection Using Multifractal Features and Machine Learning

The cognitive load manifested as effect after performing the Stroop test can be detected. The proposed ML approach is shown in Figure 6. The stages of the preprocessing, waveform analysis, spectrum calculation, and feature extraction for the purpose of signal classification, i.e., their belonging to a certain phase, are presented.
Considering that individuals have different responses to the cognitive load, different characteristics of ECG signals are expected. Namely, despite the fact that the procedure was carried out in a controlled environment, it may happen that an individual already has a certain level of cognitive load. The controlled environment here means that, during the recording, a volunteer stayed under normal temperature and other laboratory conditions (acoustically isolated, with the usual level of temperature and air humidity, without the presence of unpleasant odors, etc.). After the initial analysis, for the feature extraction in addition to temporal and entropy measures, multifractal characteristics were calculated. As potential changes are of a subtle nature and can be of different intensity, multifractals were used as a concept that could provide insight into the ECG structure. The analyzed characteristics are shown in Table 2. The four feature groups were formed as presented in Table 3.
Fractals can be described geometrically as shapes that have parts similar to the whole. This property is called self-similarity, and it is present in a large number of processes in nature, including physiological signals. Each fractal can be described by a quantity called the fractal dimension, which does not have to be an integer. Hurst introduced the method of rescaled ranges to estimate the fractal dimension D in an indirect way via the Hurst index using the H = 2 − D relation. The H value of 0.5 represents the case when there is no correlation. When the H value is greater than 0.5, it signifies a process exhibiting persistent memory, meaning that distant data points are correlated. This property is termed as long-term dependency (LRD). An H value of less than 0.5 indicates anti-persistence and short-term dependency (SRD) [56,57,58]. The nature of the process is more complex, and, therefore, the term multifractal was introduced as the fractal behavior of fractals themselves. Multifractal analysis was first introduced in turbulence studies, after which the mathematical theory was developed for describing deterministic and random measures. The measure is a generalization of the concept of standard measures, such as length, area, and volume. Instead of using one size or measure, a set of measures is introduced that describes a certain process on all scales [59,60].
There are several ways to describe the multifractal formalism leading to various definitions of the multifractal spectrum. In this regard, there are Haussdorff, Legendre, and the large deviation multifractal spectrum [61,62]. The theory of large deviations considers the exponentially decreasing probability of the occurrence of large deviations in a certain process. In particular, the concept of large deviations can be applied for the purpose of such analysis because the concepts of large deviations and multifractals are closely related. Large-deviation multifractal spectrum f(α) is defined as:
f α = lim ε lim n sup log N n ε α log n
where
N n ε α = C a r d k 0 , , n 1 : α ε α n k α + ε
while value αnk is denoted as a coarse-grained exponent that coresponds to the interval
I n k = k n , k + 1 n , α n k = log X k + 1 / n X k / n log n
The size in the numerator of the coarse-grained exponent αnk corresponds to the logarithm of the absolute value of the variations X in the interval Ink [62]. In alternative calculations, the large deviation can be replaced by the difference between the supremum and the infimum on the interval. In a large number of time moments, the change occurs, that is, the appearance of singular points. Each singularity is described by a singularity exponent α and a corresponding non-zero dimension. A signal is said to exhibit multifractal properties if there are fluctuations of this exponent around some mean value leading to the term of spectrum f(α). The advantage of the large deviation multifractal spectrum concept is in the fine monitoring of structural changes [63]. In Figure 7, the multifractal spectrum is presented for the ECG waveform.
Namely, in Figure 7a, the spectrum is shown for a baseline phase. Each physiological signal shows changes in the time domain independent of the scale on which it is observed. A typical spectrum f = f(α) is a concave function of the exponent α. There is one pronounced maximum in the spectrum, or there may be other local maxima and minima, which are reached for the value of the exponent equal to α0. The spectrum value for the maximum case is f(α0). The spectrum is limited and has finite values in the interval [αmin, αmax]. Segment boundaries represent the minimum and maximum values of the exponent for which the spectrum is finite. The difference between the maximum and minimum exponent values is called the width of the spectrum w and is one of the relevant spectrum features [63]:
w = α max α min
where it can be divided into two widths (the left and right sides of a spectrum):
w l = α 0 α min , w r = α max α 0
Namely, the exponent value at which it reaches its maximum divides the spectrum into two parts, the left and right sides. Each of these parts has its own characterization, such as the widths. Some of the other similar feature explanations can be found in [64].
Figure 7b shows an example of multifractal spectra corresponding to the baseline and the post-phase. The spectra are centered and normalized for the representation purposes according to the maximum value equal to f(α0) = 1. Differences in the shapes of spectra can be observed. The baseline phase gives a smooth curve for the spectrum with an approximately parabolic shape. After applying the cognitive test, changes are observed mostly in the left part of the spectrum, manifested by the appearance of local extremes. There is a noticeable deviation on the left side of the spectrum, which did not exist before the test and represents a dominant phenomenon in the phase discrimination. Also, there is a narrowing in the right part of the spectrum.
Here, the total variations are introduced for the multifractal spectrum characterization. The total variation in the case of the continuous function x(t) in the interval [a,b] is defined as the sum of absolute differences corresponding to each part of the interval’s division P = {t0 = a,…, tn,…, tm = b} [65]:
T V ( x ) = sup P n = 1 m x t n x t n 1
For a multifractal spectrum, the total variations corresponding to the left and the right sides are calculated. The variation for the left side is found as
T V l e f t = k = 1 M 2 f k + 1 f k α k + 1 α k α M α 1
where α[k] and f[k] represent series of discrete exponent values and spectrum values for k = 1…M. The value of α[1] is equal to αmin, while α[M] is equal to α0. The total variation for the right side of a multifractal spectrum is calculated similarly:
T V r i g h t = k = M N 1 f k f k + 1 α k α k + 1 α M + 1 α N
where value α[N] equals αmax and N equals the number of points for which the spectrum was calculated. If there are local maxima and minima in parts of a multifractal spectrum, this will be reflected in higher total variation values. In this respect, the total variation is a measure of the oscillatory nature of a spectrum. The total variation (TV) is the sum of the absolute values of the total variations for the left and right sides. In this paper, multifractal spectra are centered and normalized just for the representation reasons according to the maximum value equal to f(α0) = 1, which does not affect the classification results in any manner. This only enables a better insight into the subtle changes that are introduced by the cognitive load.
The novel proposed approach applies a cosine kNN classifier, where 10 different types are tested using the four feature groups, similar to [64,66]. In the case of kNN classifiers, the selection of the nearest neighbors is done by calculating the appropriate distances, such as Euclidean, cosine, cubic, and weighted, as described in [67]. Thus, belonging to a certain class is determined by taking into account the k nearest neighbors. When determining the class, it applies the majority decision making among neighbors. There are a number of different metrics applied that determine different types of kNN classifiers. A cosine metric can be defined between two vectors, F1 and F2, of length M:
Cos F 1 , F 2 = F 1 F 2 F 1 F 2 = i = 1 M F 1 i F 2 i i = 1 M F 1 2 i i = 1 M F 2 2 i
where the expression represents the cosine of the angle between the two feature vectors. In general, the kNN models can provide better results than others, like in [67,68]. Cosine kNN is a variant of the kNN that applies the cosine similarity as the distance metric. The cosine similarity is a measure of similarity between two non-zero vectors and considers the angle between them [68]. Like standard KNN, it is a non-parametric supervised learning approach that operates by finding the k nearest neighbors based on the proximity between data points [67,68]; here, a hyperparameter k is iteratively adjusted until an acceptable level of performance is achieved, in this case with a value of 10. The cosine distance metric applied in kNN seems to be an appropriate choice for high-dimensional features and more effective than Euclidean distance [68]. It represents a suitable metric that calculates directional similarity by focusing on the orientation of the vectors, making it less sensitive to feature scaling compared to the Euclidean distance metric that measures the absolute straight-line distance.
The training and test steps during the machine learning process are performed using the five-fold crossvalidation. The representatives of both phases are present in each iteration in the training set. Signals from the training phase do not participate in the test phase, and this also applies to the individuals to whom those signals belong. The performance is measured using accuracy (Acc), true positive rate (TPR), and false positive rate (FPR):
A c c = ( T P + T N ) / ( T P + T N + F P + F N ) ,
T P R = T P / ( T P + F N ) ,   F P R = F P / ( F P + T N ) ,
where TP, TN, FP, and FN represent true positives, true negatives, false positives, and false negatives, respectively.

4. Experimental Results

4.1. Initial Performance Assessment of Low-Cost Monitoring Device

Primarily, synthetic ECG signals were acquired using the proposed and the reference acquisition devices. The initial time instant was recorded for both devices and used to align the time axis in subsequent analysis. After the completion of each iteration (five in total), a visual inspection of the recorded signals was performed using the implemented software. For in vivo measurements, six volunteers (three male and thee female) participated. The mean age was µ = 33, and the standard deviation of the age of the volunteers was σ = 5.
Before the recording, the participants were asked to spend 15 min in a seated position in order to eliminate the effects of previous physical activity (walking, running, etc.). All participants consented to participate in the trial and stated they had no major illnesses. They were asked to be in the required position with their head slightly elevated. A participant’s torso was covered with electrodes with a 3-electrode system for the low-cost device and a 12-electrode system for the reference device. Each volunteer was asked to breathe normally and was not subjected to any cognitive or physical task initially. Each recording itself lasts 360 s, and for each volunteer it was repeated in five iterations. In parallel, recording was carried out using the reference equipment and the Arduino-based device. In Figure 8, ECG waveform examples for the reference and the proposed device are shown for both synthetic and in vivo measurements.
In both cases, there is agreement of the signals regarding the position of the R maximum and morphological significant points. There are minimal deviations in the signal amplitude. In order to compare the signals recorded by the low-budget and reference device, the MAPE is evaluated, as in [50]. Taking into account the cases when the synthetic signal from the generator is measured or in vivo recordings are made, the value of the MAPE error does not exceed the 7% expected as a limit for the in vivo case.

4.2. Cognitive Load-Dependant Usage of the Low-Cost Device

The Stroop test was applied for the experimental analysis of cognitive load. Similar to the comparison with the reference device, every requirement for the recording to begin was carefully met. Totally, thirty records corresponding to different phases were recorded. Fifteen volunteers of similar age participated in the collection as in the reference signal comparison phase. All volunteers gave their consent to participate in the study and denied any significant illnesses. Before the beginning of the recording, all volunteers spent a time interval of 15 min in a seated position in order to eliminate the influence of previous usual physical activities. All participants had abstained from major physical activities for a period of 24 h. Only the low-cost device was used for recording this time. So, each participant had a three-electrode system applied to their torso. In the first phase, each volunteer was asked to breathe normally and was not subjected to any form of cognitive or physical task. In the second phase, recording was performed immediately after the cognitive task in the form of the Stroop test.
An example of ECG waveforms for the two phases is illustrated in Figure 9. Several cycles are shown, where Phase 0 represents the state before the cognitive test and Phase 1 marks the state after the test.
The proposed classifier was cosine kNN and was able to distinguish the abovementioned phases. The five-fold cross-validation was performed and the misclassified data for feature group 4, consisting of the total variations, are illustrated in Figure 10. The figure shows values of the total variation features. The points corresponding to the baseline state are denoted with blue while the red points belong to the post-phase. It is evident that in the post-phase case there is an increase in the values of the features. Also, it is noticeable that the values enable the phase discrimination. The misclassified samples are circled in the figure. Figure 11 shows the multifractal spectrum data that correspond to the points displayed in Figure 10. In Figure 11a, all spectra are shown regardless of the state, while in the Figure 11b part, only correctly marked spectra are presented, including both the training and test steps. The post-phase spectra are marked in red. This is done in order to point out the oscillatory appearance, especially on the left side of the post-phase spectra. Table 4 gives the results for tested classifiers when the total variation features are applied. For each tested classifier, FPR, TPR, and accuracy values are shown.
The proposed cosine kNN model shows 90% accuracy for the fourth feature group and 93.3% when taking into account the entropy data. The best two classifiers in terms of TPR and accuracy are obtained by cosine kNN and the ensemble bagged tree. The improvement of the classification results is achieved by expanding the set of features where Shannon entropy is associated with the multifractal total variations (four features in total). Table 5 shows the accuracy results obtained using the total variation features without and with associated entropy, where the proposed cosine kNN classifier gives 93.3% accuracy. For the classifiers, five-fold cross-validation is applied, ensuring that all samples from a single volunteer are exclusively assigned to either the training or testing set. Also, the cross-validation is performed repeatedly and in a random manner to ensure the robustness of the results. The results do not change more than 1.5% for accuracy for both the ensemble bagged tree and cosine kNN in the proposed methodology using entropy.

5. Discussion

The developed ECG acquisition system provides possibilities for simple recording, while the low-cost device on the gateway has all the functionalities, including control of the recording process, signal preprocessing, and cloud-based storage. Furthermore, there is a monitoring area that displays a histogram of RR intervals, the detection of R peaks, and a temporal representation of an ECG that is now being recorded throughout the recording process. In this way, initial visual inspection is made possible. It is necessary in further development to include new options for reviewing the recorded signal in order to eliminate signals with unacceptable quality and artifacts. Also, it is important to develop applications for smart mobile devices that would provide identical capabilities. The implemented system was used to record signals that may originate from synthetic signals or volunteers.
The main purpose of the system in this work is the ECG acquisition and cognitive load assessment using the Stroop test. The Stroop test activates the sympathetic nervous system, leading to changes in ventricular repolarization dynamics and heart rate variability. This highlights how the cognitive load test affects the heart’s electrical activity and influences characteristics of ECG waveforms [69]. The Stroop test creates a cognitive conflict through the interference between automatic word reading and the task-relevant color naming. This test serves as a psychological stressor, inducing a sympathetic nervous system arousal, making it suitable for capturing ECG features in contrast to other cognitive tasks such as the n-back task, which primarily emphasize working memory load and activation in the prefrontal cortex [70]. All the volunteers declared that they do not have chronic diseases, and the experiment was performed in a controlled environment. The response to the stimulus of the Stroop cognitive test with colors and words was different for different individuals. In that sense, they could be divided into certain groups. The first group, which was dominant, showed dominant characteristic behavior in the left half of the spectra, which is described as the appearance of oscillatory processes in the phase after the cognitive test. Nevertheless, there were also changes in other parameters. This is an obvious strong influence of cognitive load on the ECG structure. In addition to this dominant behavior, the misclassified data was further analyzed. It seems that there are cases that can produce misdetection in terms of the proposed approach. These cases are shown in Figure 12. In Figure 12a, the presented behavior is complementary to the dominant one, and the test has a calming effect on the volunteer. Here, the oscillatory nature of the left side of the spectrum is present in the baseline phase. In Figure 12b, there are subtle differences between the spectra corresponding to the phases. This phenomenon can correspond to a volunteer that has already been cognitively burdened by certain tasks (taking exams, reading, solving problems, etc.). Therefore, it is important to introduce a requirement that volunteers refrain from complex cognitive tasks on the day of the test. Another way is to expose each participant to other stimuli, such as audio or images with a relaxing effect, in order to reduce the effect of cognitive tension.
The experimental analysis, utilizing feature groups, employed ten classifiers, with cosine kNN and the ensemble bagged tree demonstrating high accuracy results, as depicted in Figure 13. The bar plot per classifier and the heatmap including accuracy values are presented in Figure 13a,b, respectively. In Figure 13c, the test results are given in the form of a box diagram. When looking at the first group, which includes a larger number of features, a lower accuracy is noticeable. The combination of Shannon entropy with classic multifractal features (spectrum width, slopes) results in an increase in classification accuracy. Therefore, retaining entropy in the feature set is justified. Feature group 3 excludes entropy and includes all multifractal features, which leads to slightly worse results. Group 4, meaning the total variation features, has high accuracy results and represents a relatively small number of features. The total variation features are chosen, since other traditional multifractal features, such as spectrum extrema, widths, and slopes, might not efficiently capture the oscillatory phenomenon found in the post-phase multifractal curves [64,65]. Therefore, the total variation features reveal subtle changes due to cognitive load compared to the other characterization. The proposed cosine kNN approach based on four features in total gave 93.3% accuracy. Traditional HRV primarily measures the temporal changes in the RR intervals, i.e., the time between consecutive R peaks. Even though the HRV provides valuable insights into the physiological dynamics, it mainly focuses on temporal dynamics. However, multifractal representation of ECG waveforms and corresponding features such as total variation-based ones provide a more comprehensive ECG waveform characterization by quantifying not only the temporal structure but also the local singularities and the dependencies within an ECG waveform [63,65]. This allows the detection of subtle changes that might not be apparent in the temporal domain. Figure 13d shows the feature plane where the entropy and the total variation are included with the display of incorrectly detected states. This implies that the selection of other classifiers and entropies may possibly further improve the classification results. The future work will be oriented towards collecting additional recordings and expanding the signal dataset.
The reference-based assessment was performed using the professional reference recording device, which is a typical part of professional medical equipment for clinical use (the Medset PADSI 12 Channel ECG Heart Monitor). All the experiments in this paper were performed under controlled conditions, meaning standard laboratory conditions were maintained (normal temperature, humidity, acoustic isolation, the absence of unpleasant odors). Six volunteers participated in the initial performance assessment using the reference professional medical device, while fifteen volunteers in total participated in the cognitive load-dependent usage of the low-cost device. The response of the proposed system was not tested with volunteers under any atypical condition, and this will be a part of our future work. While multifractal analysis is used in arrhythmia detection and P300 analysis [71], the scope of this paper does not include arrhythmia and similar medical conditions.
In each experiment, before the recording, the participants were asked to spend 15 min resting in a seated position in order to eliminate the effects of possible previous physical activity. All participants had abstained from major physical activities for a period of 24 h. The acquisition was carried out so that it did not negatively affect the volunteers’ well-being in any way. The research was conducted in phases within fixed timeframes, with a 5 min break between phases. In case of any inconsistency or sudden movement during the phases, a volunteer was asked to repeat the process on a different day. This process ensured data fidelity by preventing compromised data, such as that containing muscle or other artifacts, from being included in the analysis.
The system proposed in this work represents a prototype ECG-only acquisition model for Stroop-related cognitive load analysis. Determining the commercial viability of the proposed model was not part of this study and requires a multifaceted evaluation (e.g., size and accessibility of the target market, sales strategies, scalability of production). The prototype includes the Arduino platform and the Olimex Shield ECG/EMG expansion module as components that can be considered as low-cost. The model proposed in this paper is not intended for commercialization but for research purposes only. The possible cost for some similar future commercialized system is difficult to predict and depends on technology, production, market sensitivity, pricing strategies, etc., where mass production could lower prices. Regardless, this paper does not aim for cost optimization. Additionally, the acquisition system in this paper was not developed with the intention of being a medical-grade one. The applied Olimex Shield ECG/EMG expansion module connected to the Arduino Uno platform is working at a 256 Hz sampling rate with a 10-bit ADC to detect and corresponding high values of input impedance and a common-mode rejection ratio, as in [72,73,74]. The focus of this research was on the cognitive load experimental analysis, rather than achieving medical-grade low noise performance. While other solutions like STM32 may offer higher performance because of their advanced components, our focus was on using relatively affordable and easy-to-implement components. Acquisition under controlled conditions enables sufficient characterization, where the acquired signals are adequate for the purpose of the experimental analysis performed in this paper.
This paper presents the results of the study, which is, to the authors’ knowledge, the first extended multifractal analysis of the cognitive load scenario combined with low-cost hardware and an IoT environment.

6. Conclusions

This paper presents an ECG acquisition system for assessing cognitive load. With the cognitive burden generated by the Stroop test, the system contains all the features required for successful acquisition and enables experimental analysis. The system was validated by synchronous recording with the professional medical device for the ECG acquisition. The recordings showed a satisfactory quality of the ECG signal where both synthetic ECG and in vivo measurements are made. The Stroop test using words and colors was then utilized to examine the system’s ability to induce cognitive stress. Prior to and after the Stroop test, there were two recording phases. The analysis was performed using the formalism of large deviations, and the multifractal spectra revealed the phenomenon of an oscillatory character that appeared in the post-phase. The proposed machine learning approach was implemented by training and testing different classifier models. Four groups of features were used for the experimental analysis. The cosine kNN classifier and a combination of features that includes total variation multifractal features stood out as the best solution. An additional improvement of the classification results was obtained by joining the Shannon entropy to this set. In this way, the model detected the state before and after the application of the cognitive test. The proposed approach gave high accuracy results of above 90% for the ECG cognitive assessment using cosine kNN and a relatively small number of features.
The characteristics of each volunteer, as well as the fact that they have already been subjected to situations that resulted in an increased cognitive load, may influence the occurrence of falsely detected conditions. Response in a complementary manner to the dominant behavior may occur where the Stroop test induces a calming effect. In future work, we will further explore entropy-related feature engineering to potentially influence the results of less common cases. Moreover, improvements to the acquisition system are planned, including new options for monitoring, access, and interoperability.

Author Contributions

Conceptualization, M.M. and A.G.; methodology, M.M. and A.G.; software, M.M.; validation, M.M. and A.G.; formal analysis, M.M.; investigation, M.M. and A.G.; resources, M.M. and A.G.; data curation, M.M.; writing—original draft preparation, M.M. and A.G.; writing—review and editing, M.M. and A.G.; visualization, M.M. and A.G.; supervision, A.G.; project administration, A.G. All authors have read and agreed to the published version of the manuscript.

Funding

This work was partially supported by the Ministry of Science, Technological Development and Innovation of the Republic of Serbia, no. 451-03-137/2025-03/200103 and by the Department School of Information and Communication Technologies, Academy of Technical and Art Applied Studies Belgrade, no. 01-1/174-1.

Institutional Review Board Statement

All subjects gave their informed consent for inclusion before they participated in the study. The study was granted by the Department School of Information and Communication Technologies, Academy of Technical and Art Applied Studies Belgrade, no. 01-1/174-1 (02-1605).

Informed Consent Statement

Informed consent was obtained from all subjects involved in the study.

Data Availability Statement

Recorded samples can be downloaded at https://github.com/msmilance/ECG-cognitive-load-detection.git (accessed on 13 June 2025). Additional data can be made available upon reasonable request, due to privacy and ethical restrictions.

Acknowledgments

We appreciate all the volunteers who took part in the study and gave written consent for the participation.

Conflicts of Interest

The authors declare no conflicts of interest.

References

  1. Alahi, M.E.E.; Sukkuea, A.; Tina, F.W.; Nag, A.; Kurdthongmee, W.; Suwannarat, K.; Mukhopadhyay, S.C. Integration of IoT-Enabled Technologies and Artificial Intelligence (AI) for Smart City Scenario: Recent Advancements and Future Trends. Sensors 2023, 23, 5206. [Google Scholar] [CrossRef] [PubMed]
  2. Gatouillat, A.; Badr, Y.; Massot, B.; Sejdic, E. Internet of Medical Things: A Review of Recent Contributions Dealing with Cyber-Physical Systems in Medicine. IEEE Internet Things J. 2018, 5, 3810–3822. [Google Scholar] [CrossRef]
  3. Yang, X.-L.; Liu, G.-Z.; Tong, Y.-H.; Yan, H.; Xu, Z.; Chen, Q.; Liu, X.; Zhang, H.-H.; Wang, H.-B.; Tan, S.-H. The History, Hotspots, and Trends of Electrocardiogram. PubMed 2015, 12, 448–456. [Google Scholar] [CrossRef]
  4. Jeon, B.; Lee, J.; Choi, J. Design and implementation of a wearable ECG system. Int. J. Smart Home 2013, 7, 61–70. [Google Scholar]
  5. Goldberger, A.L.; Amaral, L.A.N.; Glass, L.; Hausdorff, J.M.; Ivanov, P.C.; Mark, R.G.; Mietus, J.E.; Moody, G.B.; Peng, C.-K.; Stanley, H.E. PhysioBank, PhysioToolkit, and PhysioNet. Circulation 2000, 101, E215–E220. [Google Scholar] [CrossRef]
  6. Sahoo, S.S.; Jayapandian, C.; Garg, G.; Kaffashi, F.; Chung, S.; Bozorgi, A.; Chen, C.-H.; Loparo, K.; Lhatoo, S.D.; Zhang, G.-Q. Heart Beats in the Cloud: Distributed Analysis of Electrophysiological ‘Big Data’ Using Cloud Computing for Epilepsy Clinical Research. J. Am. Med. Inform. Assoc. 2013, 21, 263–271. [Google Scholar] [CrossRef]
  7. Sun, J.-Y.; Shen, H.; Qu, Q.; Sun, W.; Kong, X.-Q. The Application of Deep Learning in Electrocardiogram: Where We Came from and Where We Should Go? Int. J. Cardiol. 2021, 337, 71–78. [Google Scholar] [CrossRef]
  8. Friedman, P.A. The Electrocardiogram at 100 Years: History and Future. Circulation 2024, 149, 411–413. [Google Scholar] [CrossRef]
  9. Anbalagan, T.; Nath, M.K.; Vijayalakshmi, D.; Anbalagan, A. Analysis of Various Techniques for ECG Signal in Healthcare, Past, Present, and Future. Biomed. Eng. Adv. 2023, 6, 100089. [Google Scholar] [CrossRef]
  10. Samartkit, P.; Pullteap, S. Non-Invasive Continuous Blood Pressure Sensors in Biomedical Engineering Research: A Review. Sens. Actuators A Phys. 2024, 367, 115084. [Google Scholar] [CrossRef]
  11. Rafie, N.; Kashou, A.H.; Noseworthy, P.A. ECG Interpretation: Clinical Relevance, Challenges, and Advances. Hearts 2021, 2, 505–513. [Google Scholar] [CrossRef]
  12. Fye, W.B. A History of the Origin, Evolution, and Impact of Electrocardiography. Am. J. Cardiol. 1994, 73, 937–949. [Google Scholar] [CrossRef] [PubMed]
  13. Kashou, A.H.; Ko, W.-Y.; Attia, Z.I.; Cohen, M.S.; Friedman, P.A.; Noseworthy, P.A. A Comprehensive Artificial Intelligence–Enabled Electrocardiogram Interpretation Program. Cardiovasc. Digit. Health J. 2020, 1, 62–70. [Google Scholar] [CrossRef] [PubMed]
  14. Brad, R.; Ilie, B.; Florea, A.; Berntzen, L.; Teodoru, M. IoT Device for Long-Term ECG Monitoring in Collaborative Environment. J. Artif. Intell. Auton. Intell. 2024, 1, 82–95. [Google Scholar] [CrossRef]
  15. Jiao, W.; Wang, J.; Gao, X.; Du, L.; Li, Y.; Zhao, L.; Fang, D.; Chen, X. ZEROECG: Zero-Sensation ECG Monitoring by Exploring RFID MOSFET. In Proceedings of the ACM MobiCom ’24: Proceedings of the 30th Annual International Conference on Mobile Computing and Networking, Washington, DC, USA, 18–22 November 2024; pp. 1237–1251. [Google Scholar] [CrossRef]
  16. Singh, R.; Rajpal, N.; Soni, P.K.; Upadhyay, G.M. An AIOT Enabled Multi-Level Decision Support System for Remote Arrhythmia Analysis Using Efficient Wavelet Transform. SN Comput. Sci. 2024, 5, 1121. [Google Scholar] [CrossRef]
  17. Zovko, K.; Šerić, L.; Perković, T.; Belani, H.; Šolić, P. IoT and Health Monitoring Wearable Devices as Enabling Technologies for Sustainable Enhancement of Life Quality in Smart Environments. J. Clean. Prod. 2023, 413, 137506. [Google Scholar] [CrossRef]
  18. Yang, Z.; Zhou, Q.; Lei, L.; Zheng, K.; Xiang, W. An IoT-Cloud Based Wearable ECG Monitoring System for Smart Healthcare. J. Med. Syst. 2016, 40, 286. [Google Scholar] [CrossRef]
  19. Zhang, Y.; Liu, H.; Su, X.; Jiang, P.; Wei, D. Remote Mobile Health Monitoring System Based on Smart Phone and Browser/Server Structure. J. Healthc. Eng. 2015, 6, 717–738. [Google Scholar] [CrossRef]
  20. Assaad, R.H.; Mohammadi, M.; Poudel, O. Developing an Intelligent IoT-Enabled Wearable Multimodal Biosensing Device and Cloud-Based Digital Dashboard for Real-Time and Comprehensive Health, Physiological, Emotional, and Cognitive Monitoring Using Multi-Sensor Fusion Technologies. Sens. Actuators A Phys. 2024, 381, 116074. [Google Scholar] [CrossRef]
  21. Giordano, M.; Leitner, C.; Vogt, C.; Benini, L.; Magno, M. PULSE: Accurate and Robust Ultrasound-Based Continuous Heart-Rate Monitoring on a Wrist-Worn IoT Device. arXiv 2024, arXiv:2410.16219. [Google Scholar] [CrossRef]
  22. Zhu, G.; Wang, X.; Zhang, G.; Yue, Y.; Yuan, S.; Du, H.; Zhang, Z.; Ren, F.; Ren, P.; Sun, Q. Multifunctional Flexible Sensor with the Hybrid Staggered-Rib Conductive Network for Intelligent Recognition of Human Biomechanical and Electrophysiological Signals. ACS Appl. Nano Mater. 2024, 7, 24061–24070. [Google Scholar] [CrossRef]
  23. Alegre, L.M.; Pisarello, M.I. Ambulatory Electrocardiographic Monitoring Prototype. In Proceedings of the 2024 IEEE Biennial Congress of Argentina (ARGENCON), San Nicolás de los Arroyos, Argentina, 18–20 September 2024; pp. 1–6. [Google Scholar] [CrossRef]
  24. Wang, W.; Lu, L.; Ma, H.; Li, Z.; Lu, X.; Xie, Y. Self-Template Manufacturing of on-Skin Electrodes with 3D Multi-Channel Structure for Standard 3-Limb-Lead ECG Suit. Microsyst. Nanoeng. 2024, 10, 196. [Google Scholar] [CrossRef]
  25. Schramm, D.; Varini, R.; Gala, A.B.E.; Banerjee, A.; Betts, T. Comprehensive Cardiac Interval Analysis in the WEAR-TECH Study Cohort by Comparing the Apple Watch Series 6 against a Simultaneous 12-Lead ECG. Eur. Heart J. 2024, 45, ehae666.353. [Google Scholar] [CrossRef]
  26. Madavarapu, J.B.; Nachiyappan, S.; Rajarajeswari, S.; Anusha, N.; Venkatachalam, N.; Madavarapu, R.C.B.; Ahilan, A. Hot Watch: IOT Based Wearable Health Monitoring System. IEEE Sens. J. 2024, 24, 33252–33259. [Google Scholar] [CrossRef]
  27. Vizitiu, C.; Bîră, C.; Dinculescu, A.; Nistorescu, A.; Marin, M. Exhaustive Description of the System Architecture and Prototype Implementation of an IoT-Based eHealth Biometric Monitoring System for Elders in Independent Living. Sensors 2021, 21, 1837. [Google Scholar] [CrossRef]
  28. Scrugli, M.A.; Loi, D.; Raffo, L.; Meloni, P. An Adaptive Cognitive Sensor Node for ECG Monitoring in the Internet of Medical Things. IEEE Access 2021, 10, 1688–1705. [Google Scholar] [CrossRef]
  29. Dankovich, L.J.; Joyner, J.S.; He, W.; Sesay, A.; Vaughn-Cooke, M. CogWatch: An Open-Source Platform to Monitor Physiological Indicators for Cognitive Workload and Stress. HardwareX 2024, 19, e00538. [Google Scholar] [CrossRef]
  30. Pavlov, Y.G.; Kasanov, D.; Kosachenko, A.I.; Kotyusov, A.I.; Busch, N.A. Pupillometry and Electroencephalography in the Digit Span Task. Sci. Data 2022, 9, 325. [Google Scholar] [CrossRef]
  31. Parent, M.; Albuquerque, I.; Tiwari, A.; Cassani, R.; Gagnon, J.-F.; Lafond, D.; Tremblay, S.; Falk, T.H. PASS: A Multimodal Database of Physical Activity and Stress for Mobile Passive Body/Brain-Computer Interface Research. Front. Neurosci. 2020, 14, 542934. [Google Scholar] [CrossRef]
  32. Esgalhado, F.; Batista, A.; Vassilenko, V.; Russo, S.; Ortigueira, M. Peak Detection and HRV Feature Evaluation on ECG and PPG Signals. Symmetry 2022, 14, 1139. [Google Scholar] [CrossRef]
  33. Hemakom, A.; Atiwiwat, D.; Israsena, P. ECG and EEG Based Detection and Multilevel Classification of Stress Using Machine Learning for Specified Genders: A Preliminary Study. PLoS ONE 2023, 18, e0291070. [Google Scholar] [CrossRef]
  34. Wu, N.M.; Cao, N.H.; Nguyen, N.H.-L.; Surmacz, K.; Hargrove, C. Modeling Perceived Stress via HRV and Accelerometer Sensor Streams. In Proceedings of the 37th Annual International Conference of the IEEE Engineering in Medicine and Biology Society (EMBC), Milan, Italy, 25–29 August 2015; pp. 1625–1628. [Google Scholar] [CrossRef]
  35. Masrur, N.; Halder, N.; Rashid, S.; Setu, J.H.; Islam, A.; Ahmed, T. Performance Analysis of Ensemble and DNN Models for Decoding Mental Stress Utilizing ECG-Based Wearable Data Fusion. In Proceedings of the 2024 IEEE International Black Sea Conference on Communications and Networking, Tbilisi, Georgia, 24–27 June 2024; pp. 276–279. [Google Scholar] [CrossRef]
  36. Heyat, M.B.B.; Akhtar, F.; Abbas, S.J.; Al-Sarem, M.; Alqarafi, A.; Stalin, A.; Abbasi, R.; Muaad, A.Y.; Lai, D.; Wu, K. Wearable Flexible Electronics Based Cardiac Electrode for Researcher Mental Stress Detection System Using Machine Learning Models on Single Lead Electrocardiogram Signal. Biosensors 2022, 12, 427. [Google Scholar] [CrossRef]
  37. Hasnul, M.A.; Aziz, N.A.A.; Alelyani, S.; Mohana, M.; Aziz, A.A. Electrocardiogram-Based Emotion Recognition Systems And Their Applications in Healthcare—A Review. Sensors 2021, 21, 5015. [Google Scholar] [CrossRef] [PubMed]
  38. Butkevičiūtė, E.; Michalkovič, A.; Bikulčienė, L. ECG Signal Features Classification for the Mental Fatigue Recognition. Mathematics 2022, 10, 3395. [Google Scholar] [CrossRef]
  39. Tjolleng, A.; Pramudita, N.D. A Review of Driver Cognitive Load Detection Using ECG Signals. SHS Web Conf. 2024, 189, 01008. [Google Scholar] [CrossRef]
  40. Amin, M.; Ullah, K.; Asif, M.; Waheed, A.; Haq, S.U.; Zareei, M.; Biswal, R.R. ECG-Based Driver’s Stress Detection Using Deep Transfer Learning and Fuzzy Logic Approaches. IEEE Access 2022, 10, 29788–29809. [Google Scholar] [CrossRef]
  41. Amancharla, A.; Shanbhag, A.A.; Sunitha, R. Analysis of EEG and ECG Time Series in Response to Olfactory and Cognitive Tasks. Procedia Comput. Sci. 2024, 235, 745–756. [Google Scholar] [CrossRef]
  42. Milivojević, M.; Dujković, D.; Luković, A.; Gavrovska, A. Entropy Analysis of Electrocardiograms for Cognitive Performance Evaluation. In Proceedings of the 2024 32nd Telecommunications Forum (TELFOR), Belgrade, Serbia, 26–27 November 2024; pp. 1–4. [Google Scholar] [CrossRef]
  43. Grzeszczyk, M.K.; Blanco, R.; Adamczyk, P.; Kus, M.; Marek, S.; Pręcikowski, R.; Lisowska, A. CogWear: Can we detect cognitive effort with consumer-grade wearables? (version 1.0.0). PhysioNet 2023, RRID:SCR_007345. [Google Scholar] [CrossRef]
  44. Islam, M.R.; Kabir, M.M.; Mridha, M.F.; Alfarhood, S.; Safran, M.; Che, D. Deep Learning-Based IoT System for Remote Monitoring and Early Detection of Health Issues in Real-Time. Sensors 2023, 23, 5204. [Google Scholar] [CrossRef]
  45. Pash, A.; Nagaraja, S.R. An Efficient ECG Monitoring System using MQTT Protocol for Remote Patients in an IoT System. Int. J. Intell. Syst. Appl. Eng. 2023, 12, 146–153. [Google Scholar]
  46. Grassini, S. Electrochemical Impedance Spectroscopy (EIS) for the in-Situ Analysis of Metallic Heritage Artefacts. In Corrosion and Conservation of Cultural Heritage Metallic Artefacts; Elsevier: Amsterdam, The Netherlands, 2013; pp. 347–367. [Google Scholar]
  47. ECG Top D/BT—Medset. n.d. Available online: https://www.medset.com/en/products/resting-ecg/3148-2-2-2 (accessed on 11 May 2025).
  48. PADSY ECG-Management—Medset. n.d. Available online: https://www.medset.com/en/krankenhausmanagement (accessed on 11 May 2025).
  49. Mautgreve, W.; Klunker, C.; Zywietz, C. HES EKG expert-an expert system for comprehensive ECG analysis and teaching. In Proceedings of the Computers in Cardiology, Jerusalem, Israel, 19–22 September 1989; pp. 77–80. [Google Scholar] [CrossRef]
  50. Kim, S.; Kim, H. A New Metric of Absolute Percentage Error for Intermittent Demand Forecasts. Int. J. Forecast. 2016, 32, 669–679. [Google Scholar] [CrossRef]
  51. Stroop, J.R. Studies of Interference in Serial Verbal Reactions. J. Exp. Psychol. 1935, 18, 643–662. [Google Scholar] [CrossRef]
  52. MacLeod, C.M. Half a Century of Research on the Stroop Effect: An Integrative Review. Psychol. Bull. 1991, 109, 163–203. [Google Scholar] [CrossRef] [PubMed]
  53. Koch, C. Self-Monitoring, Need for Cognition, and the Stroop Effect: A Preliminary Study. Percept. Mot. Ski. 2003, 96, 212–214. [Google Scholar] [CrossRef] [PubMed]
  54. Banich, M.T.; Milham, M.P.; Atchley, R.A.; Cohen, N.J.; Webb, A.; Wszalek, T.; Kramer, A.F.; Liang, Z.-P.; Barad, V.; Gullett, D.; et al. Prefrontal Regions Play a Predominant Role in Imposing an Attentional ‘Set’: Evidence from fMRI. Cogn. Brain Res. 2000, 10, 1–9. [Google Scholar] [CrossRef] [PubMed]
  55. Peirce, J.; Gray, J.R.; Simpson, S.; MacAskill, M.; Höchenberger, R.; Sogo, H.; Kastman, E.; Lindeløv, J.K. PsychoPy2: Experiments in Behavior Made Easy. Behav. Res. Methods 2019, 51, 195–203. [Google Scholar] [CrossRef]
  56. Glenny, R.W.; Robertson, H.T.; Yamashiro, S.; Bassingthwaighte, J.B. Applications of Fractal Analysis to Physiology. J. Appl. Physiol. 1991, 70, 2351–2367. [Google Scholar] [CrossRef]
  57. Chen, Y. Fractal Modeling and Fractal Dimension Description of Urban Morphology. Entropy 2020, 22, 961. [Google Scholar] [CrossRef]
  58. Mandelbrot, B.B.; Wheeler, J.A. The Fractal Geometry of Nature. Am. J. Phys. 1983, 51, 286–287. [Google Scholar] [CrossRef]
  59. Dubrulle, B. Multi-Fractality, Universality and Singularity in Turbulence. Fractal Fract. 2022, 6, 613. [Google Scholar] [CrossRef]
  60. Vehel, J.L.; Rams, M. Large Deviation Multifractal Analysis of a Class of Additive Processes with Correlated Nonstationary Increments. IEEE/ACM Trans. Netw. 2013, 21, 1309–1321. [Google Scholar] [CrossRef]
  61. Christophe, C.; Véhel, J.L.; Tricot, C. Continuous Large Deviation Multifractal Spectrum: Definition and Estimation. In Proceedings of the Fractals 98, Valletta, Malta, 25–28 October 1998. [Google Scholar]
  62. Guével, R.L.; Véhel, J.L. Hausdorff, Large Deviation and Legendre Multifractal Spectra of Lévy Multistable Processes. Stoch. Process. Their Appl. 2019, 130, 2032–2057. [Google Scholar] [CrossRef]
  63. Ihlen, E.A.F. Multifractal Analyses of Response Time Series: A Comparative Study. Behav. Res. Methods 2013, 45, 928–945. [Google Scholar] [CrossRef] [PubMed]
  64. Gavrovska, A. Effects on Long-Range Dependence and Multifractality in Temporal Resolution Recovery of High Frame Rate HEVC Compressed Content. Appl. Sci. 2023, 13, 9851. [Google Scholar] [CrossRef]
  65. Karahanoglu, F.I.; Bayram, İ.; Van De Ville, D. A Signal Processing Approach to Generalized 1-D Total Variation. IEEE Trans. Signal Process. 2011, 59, 5265–5274. [Google Scholar] [CrossRef]
  66. Chethan, C. Prediction of Heart Disease Using Different KNN Classifier. In Proceedings of the 6th International Conference on Intelligent Computing and Control Systems (ICICCS), Madurai, India, 6–8 May 2021; pp. 1186–1194. [Google Scholar] [CrossRef]
  67. Cover, T.; Hart, P. Nearest Neighbor Pattern Classification. IEEE Trans. Inf. Theory 1967, 13, 21–27. [Google Scholar] [CrossRef]
  68. Shdefat, A.Y.; Mostafa, N.; Al-Arnaout, Z.; Kotb, Y.; Alabed, S. Optimizing HAR Systems: Comparative Analysis of Enhanced SVM and K-NN Classifiers. Int. J. Comput. Intell. Syst. 2024, 17, 150. [Google Scholar] [CrossRef]
  69. Vazan, R.; Filcikova, D.; Mravec, B. Effect of the Stroop Test Performed in Supine Position on the Heart Rate Variability in Both Genders. Auton. Neurosci. 2017, 208, 156–160. [Google Scholar] [CrossRef]
  70. Miller, K.M.; Price, C.C.; Okun, M.S.; Montijo, H.; Bowers , D. Is the N-Back Task a Valid Neuropsychological Measure for Assessing Working Memory? Arch. Clin. Neuropsychol. 2009, 24, 711–717. [Google Scholar] [CrossRef]
  71. Hoffmann, U.; Vesin, J.M.; Ebrahimi, T.; Diserens, K. An efficient P300-based brain-computer interface for disabled subjects. J. Neurosci. Methods 2008, 167, 115–125. [Google Scholar] [CrossRef]
  72. Olimex Shield EKG-EMG. Available online: https://www.olimex.com/Products/Duino/Shields/SHIELD-EKG-EMG/ (accessed on 5 June 2025).
  73. Artífice, A.; Ferreira, F.; Marcelino-Jesus, E.; Sarraipa, J.; Jardim-Gonçalves, R. Student’s Attention Improvement Supported by Physiological Measurements Analysis. In Technological Innovation for Smart Systems; IFIP Advances in Information and Communication Technology; Springer: Cham, Switzerland, 2017; pp. 93–102. [Google Scholar]
  74. Ehrmann, G.; Blachowicz, T.; Homburg, S.V.; Ehrmann, A. Measuring Biosignals with Single Circuit Boards. Bioengineering 2022, 9, 84. [Google Scholar] [CrossRef]
Figure 1. Routine cardiac monitoring using common three-channel acquisition system explaining a geometric arrangement of three electrodes, called Einthoven’s triangle.
Electronics 14 02468 g001
Figure 2. Architecture of the proposed IoT-based ECG telemonitoring system for cognitive load assessment.
Electronics 14 02468 g002
Figure 3. Low-cost device components and synthetic signal usage: (a) main device components for in vivo measurements; (b) ECG generator applied for synthetic ECG signal input.
Electronics 14 02468 g003
Figure 4. ECG monitoring using a 12-lead Wilson system.
Electronics 14 02468 g004
Figure 5. The reference-based performance assessment using ECG waveform generated input or in vivo measurements.
Electronics 14 02468 g005
Figure 6. Cognitive load state detection based on extracted features and machine learning.
Electronics 14 02468 g006
Figure 7. Waveform representation via multifractal spectrum: (a) left and right sides of a baseline ECG spectrum; and (b) a variation found in the post-phase.
Electronics 14 02468 g007
Figure 8. ECG waveforms for the reference and the proposed device in the case of: (a) synthetic and (b) in vivo measurements.
Electronics 14 02468 g008
Figure 9. ECG waveforms for the two phases in the cognitive load experiment using the low-cost device.
Electronics 14 02468 g009
Figure 10. Misclassified data using the proposed model and total variation features: (a) right versus left side total variation and (b) total variation of the whole spectrum versus left side total variation.
Electronics 14 02468 g010
Figure 11. (a) Unlabeled multifractal spectra and (b) correctly marked multifractal spectra.
Electronics 14 02468 g011
Figure 12. (a) Baseline variation effect and (b) a subtle post-phase variation.
Electronics 14 02468 g012
Figure 13. Feature group experimental analysis: (a) accuracy obtained by different classification models, with the best models highlighted by dashed outlines; (b) corresponding values presented as a heatmap and (c) box plots where the red central mark denotes the median, the blue edges define the 25th and 75th percentiles, and both whiskers and red outliers are shown; (d) misclassified data in the case of combining Shannon entropy with the fourth feature group.
Electronics 14 02468 g013
Table 1. Arduino-based consumer-grade and medical-grade components.
No.SolutionsTechnology/HardwareCostAdvantagesChallenges
1Arduino-based prototype/DIY solutionsARM Cortex-M4 + AD8232 Module [18,26,41] *Low-cost components includedFront-end for analog circuit designComplex initial setup
Olimex ECG/EMG Shield + Arduino Uno [42]Low-cost components includedOpen-source hardware for simple initial setupPlug-and-play experience with possible lower performance
ADS1293 Module + Arduino/MCU [24]Low-cost components includedPowerful and cost-effective solutionAdvanced component-level integration
2Consumer- and professional-grade solutionsZephyr BioHarness sensor and
multimodal approach [19,29,31],
Polar H10 [21],
Apple Watch Series 6 [25,35],
Empatica E4 wristband,
Samsung Galaxy Watch4 and
Muse S EEG headband [43] **
Mid-cost components includedAccessibility of commercial solutions and plug-and-play experienceNot intended for diagnostics with possible limited data access
3Medical- and clinical-grade solutionseego™ 8 ANT neuro [33],
ActiCHamp 64-channels EEG system with active electrodes [30]
High-cost components includedMedical certification and specialized ecosystemHigh-cost and less portable
* Besides the Arduino components, table includes mid-cost, wearable-grade device for multimodal approach. ** Multimodal approach for cognitive load detection.
Table 2. Characteristics with brief explanations.
No.CharacteristicsBrief Explanation
1HRV temporal measuresMean RR interval, standard deviation of RR intervals, Root Mean Square of Successive Differences (RMSSD), pNN50 (percentage of NN intervals > 50 ms)
2Shannon entropyEntropy provides a measure of the complexity or irregularity of a signal (ShEn)
3MF spectrum extremaAnalysis of extreme values in a multifractal spectrum, local and global minima and maxima
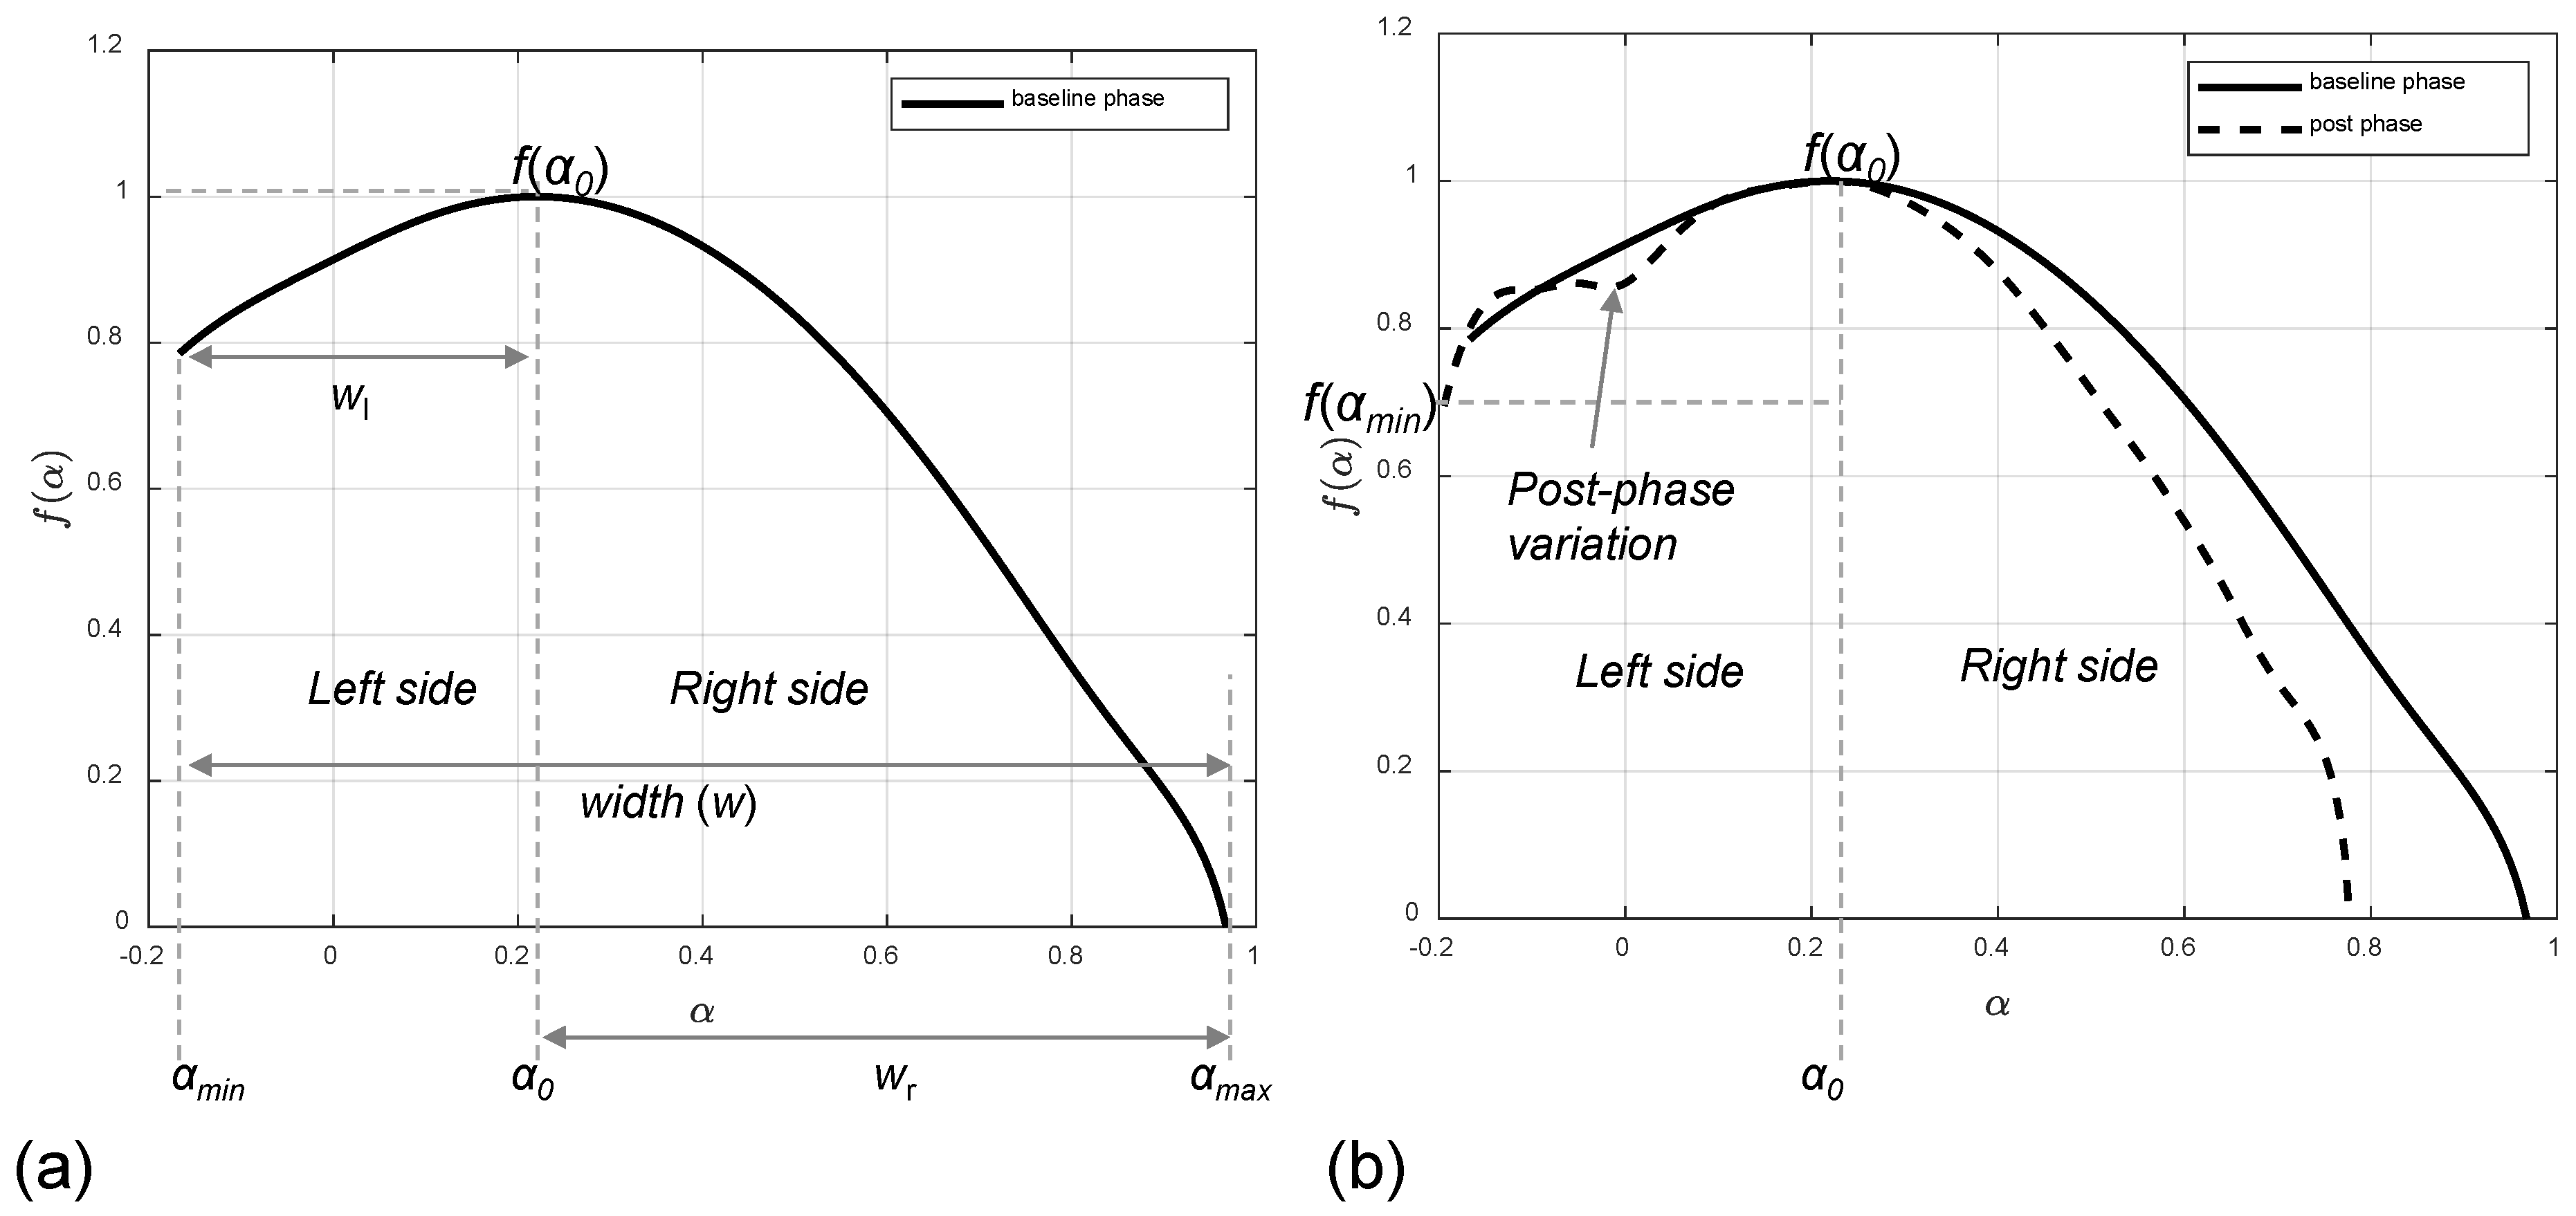
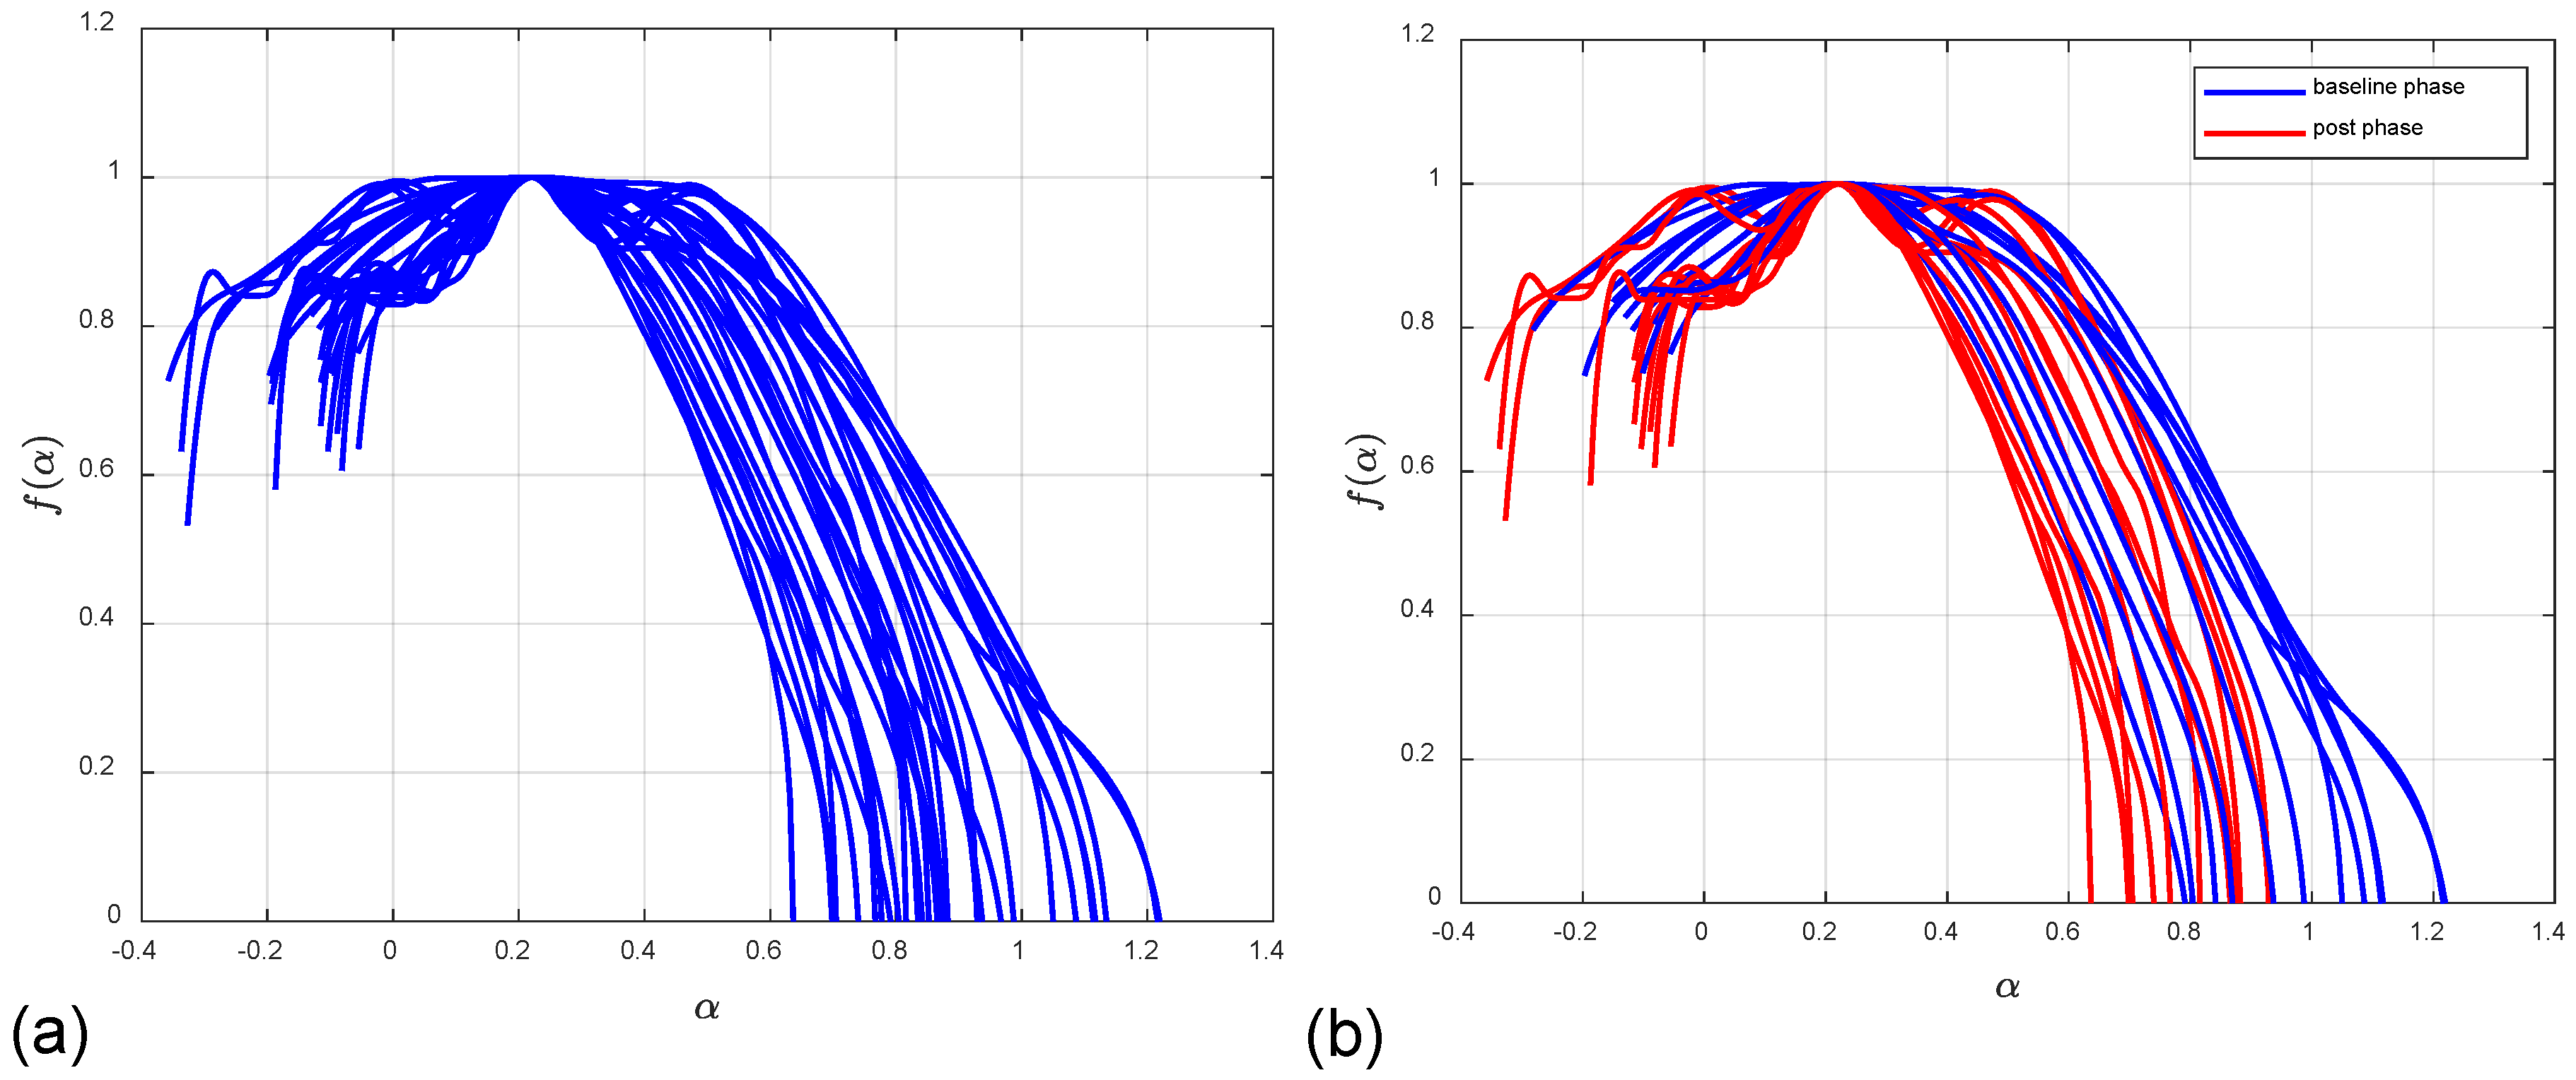
4WidthsAnalysis of the multifractal spectrum’s width, examining both the total width and the widths of its left and right sides individually
5SlopesAnalysis of the slope of the left and right sides of a multifractal spectrum
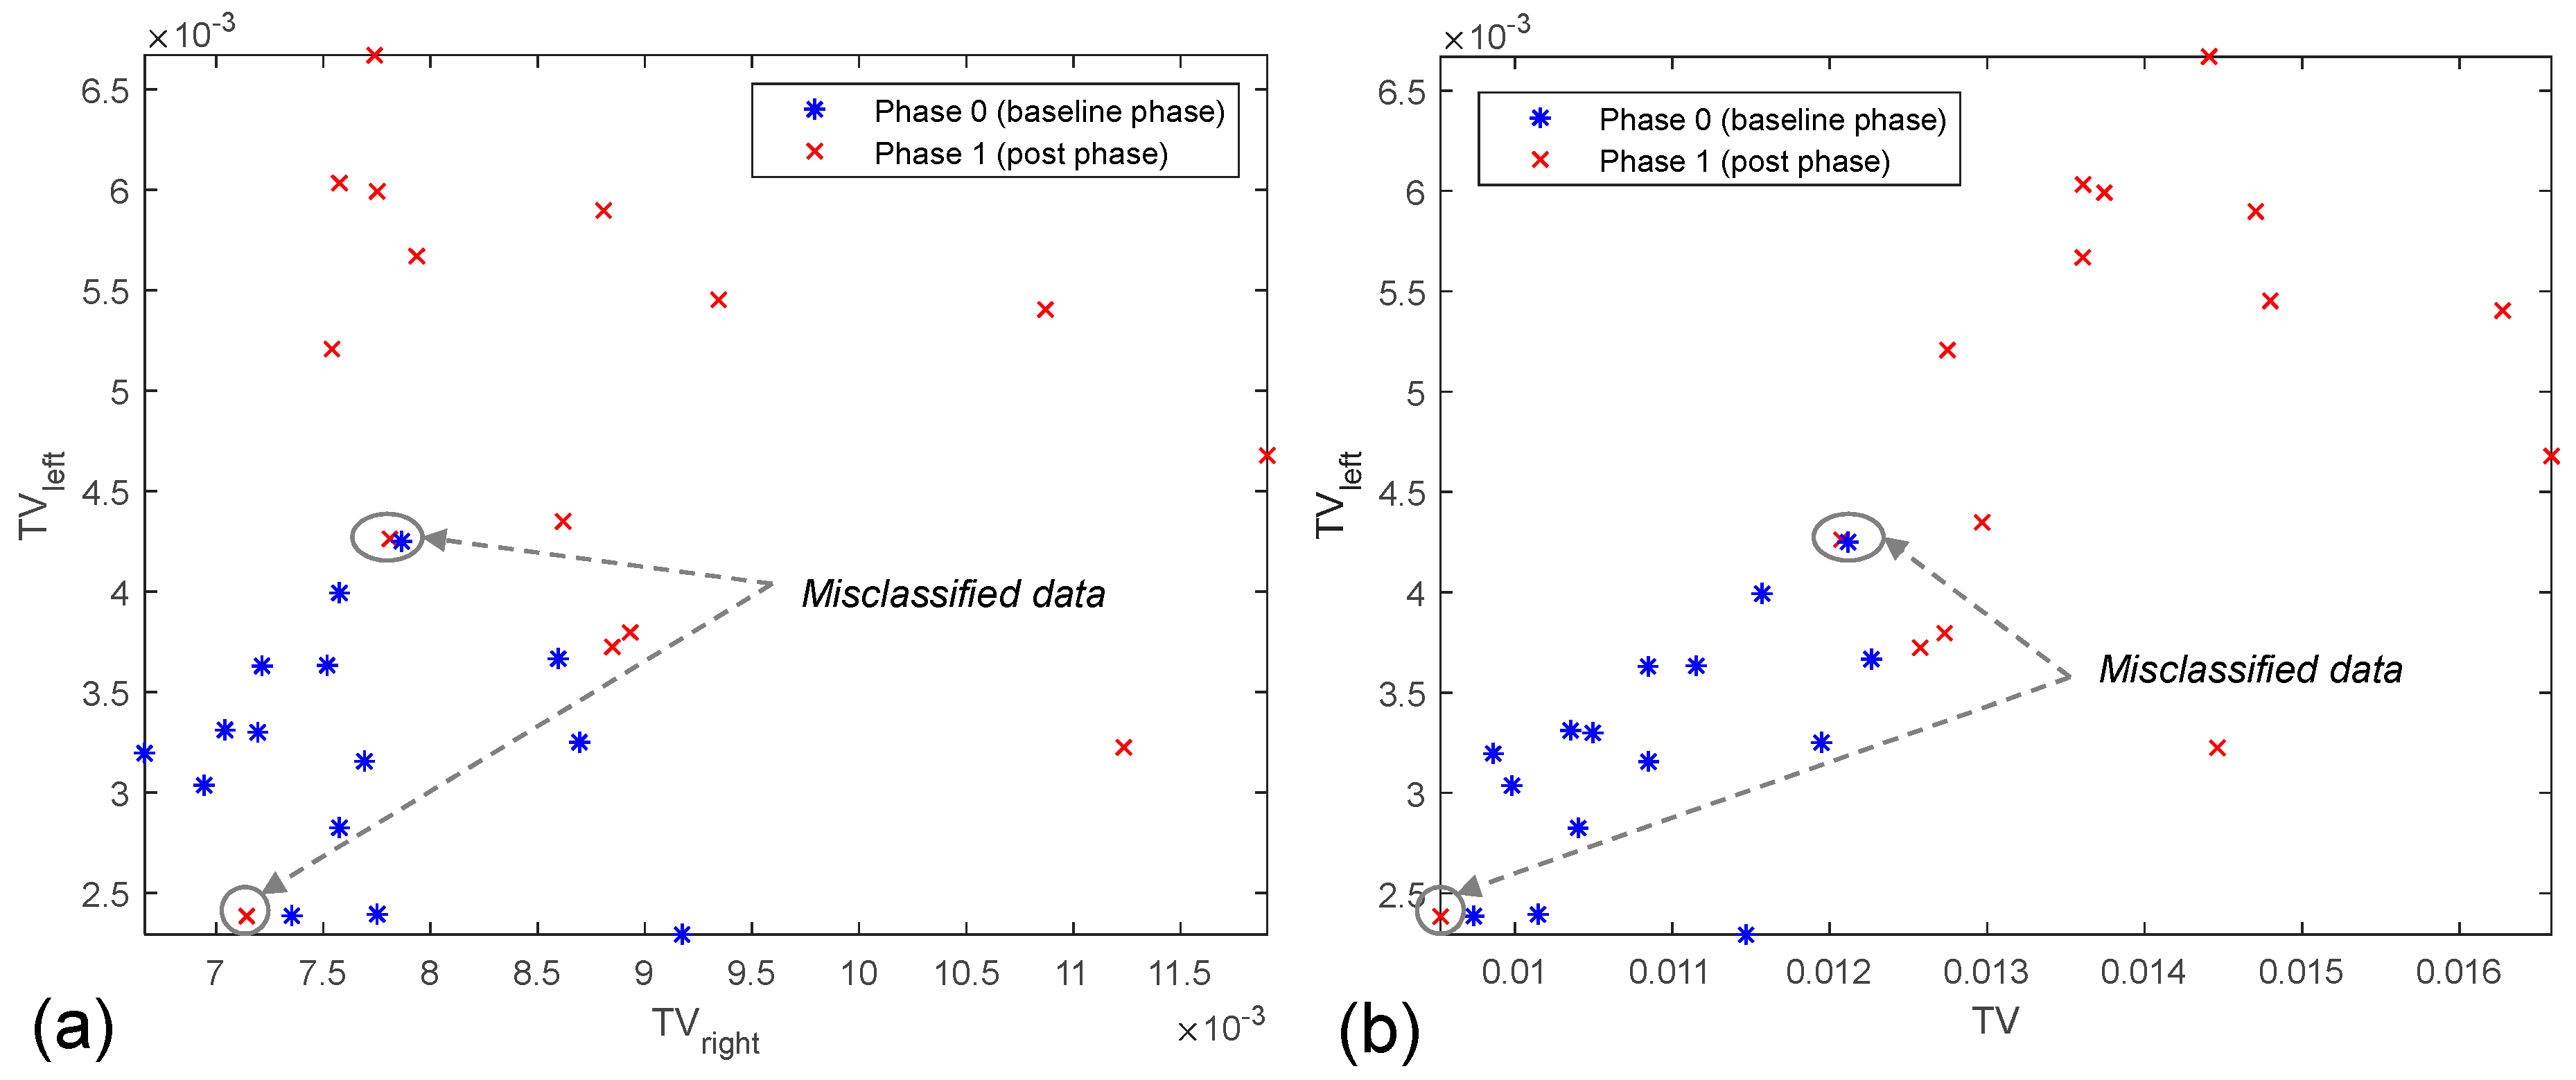
6Total variationsCalculation of the total variation for the left (TVleft) and right (TVright) sides of a spectrum, as well as the total variation (TV) for an entire spectrum
Table 3. Four groups formed from features of the analyzed characteristics.
Feature Group IDFeature Group Explanation
1HRV temporal measures, entropy and MF spectrum-based features
2Shannon entropy and MF spectrum-based features
3MF spectrum-based features, including total variations
4 *MF-based total variations (TV, TVleft, TVright)
* Additionally, Shannon entropy is added to the TV-based feature group for experimental purposes.
Table 4. Performance of different classifier types for the TV-based features.
Classifier No.Classifier TypeFalse Positive Rate (FPR)True Positive Rate (TPR)Accuracy
[%]
1Fine tree0.130.8786.7
2Linear discriminant0.330.8776.7
3Logistic regression0.200.9386.7
4Linear SVM0.270.8780.0
5Cubic SVM0.200.9386.7
6Fine kNN0.130.8083.3
7Cosine kNN0.201.0090.0
8Cubic kNN0.331.0083.3
9Weighted kNN0.130.8083.3
10Ensemble bagged tree0.130.9390.0
Table 5. Comparison between the classifiers without and with entropy-based characterization.
No.Classifier TypeAccuracy [%]AUCF1 Score
Without EntropyWith EntropyWithout EntropyWith EntropyWithout EntropyWith Entropy
1Ensemble bagged tree90.086.70.920.890.90320.8750
2Cosine kNN
(proposed approach)
90.093.30.920.930.90910.9375
Disclaimer/Publisher’s Note: The statements, opinions and data contained in all publications are solely those of the individual author(s) and contributor(s) and not of MDPI and/or the editor(s). MDPI and/or the editor(s) disclaim responsibility for any injury to people or property resulting from any ideas, methods, instructions or products referred to in the content.

