Article

Quantifying Cyber Resilience: A Framework Based on Availability Metrics and AUC-Based Normalization

1
Department of Computer Engineering, Hoseo University, Asan 31499, Republic of Korea
2
Department of Information Protection, Hoseo University, Asan 31499, Republic of Korea
3
Department of Computer Engineering, Sejong University, Seoul 05006, Republic of Korea
4
Department of Convergence Engineering for Intelligent Drones, Sejong University, Seoul 05006, Republic of Korea
*
Author to whom correspondence should be addressed.
Electronics 2025, 14(12), 2465; https://doi.org/10.3390/electronics14122465
Submission received: 27 April 2025 / Revised: 12 June 2025 / Accepted: 16 June 2025 / Published: 17 June 2025
(This article belongs to the Special Issue Advanced Research in Technology and Information Systems, 2nd Edition)

Abstract

This study presents a metric selection framework and a normalization method for the quantitative assessment of cyber resilience, with a specific focus on availability as a core dimension. To develop a generalizable evaluation model, service types from 1124 organizations were categorized, and candidate metrics applicable across diverse operational environments were identified. Ten quantitative metrics were derived based on five core selection criteria—objectivity, reproducibility, scalability, practicality, and relevance to resilience—while adhering to the principles of mutual exclusivity and collective exhaustiveness. To validate the framework, two availability-oriented metrics—Transactions per Second (TPS) and Connections per Second (CPS)—were empirically evaluated in a simulated denial-of-service environment using a TCP SYN flood attack scenario. The experiment included three phases: normal operation, attack, and recovery. An Area Under the Curve (AUC)-based Normalized Resilience Index (NRI) was introduced to quantify performance degradation and recovery, using each organization’s Recovery Time Objective (RTO) as a reference baseline. This approach facilitates objective, interpretable comparisons of resilience performance across systems with varying service conditions. The findings demonstrate the practical applicability of the proposed metrics and normalization technique for evaluating cyber resilience and underscore their potential in informing resilience policy development, operational benchmarking, and technical decision-making.

1. Introduction

Cyber resilience has gained increasing attention in recent years due to the rising frequency and sophistication of cyberattacks, coupled with the growing digitization and interconnectivity of modern infrastructure. In particular, the deepening technical and structural interdependencies among critical societal services mean that a single failure or compromise can trigger cascading effects across entire systems, making resilience an urgent priority.
Defined as the ability to prepare for, withstand, and recover from cyber incidents, cyber resilience has become a core element of modern security strategies. Unlike traditional approaches that emphasize prevention, cyber resilience focuses on maintaining operational continuity through integrated capabilities for detection, response, and recovery.
Recent high-impact incidents underscore the need for robust resilience measures. For instance, the 2020 SolarWinds supply chain attack involved the insertion of malicious code into a widely used monitoring software platform, compromising numerous organizations worldwide—including U.S. federal agencies—and exposing vulnerabilities in the global software supply chain [1]. Similarly, the 2021 Colonial Pipeline ransomware attack exploited a network design weakness, resulting in a five-day shutdown of critical fuel infrastructure. This led to fuel shortages and widespread disruptions [2], prompting the Cybersecurity and Infrastructure Security Agency (CISA) to launch multiple initiatives to bolster national infrastructure resilience [3].
In 2023, South Korea’s national joint authentication service experienced a 56-h outage caused by a switch failure, resulting in over 240,000 user complaints [4]. In 2024, a software deployment error at CrowdStrike—a major U.S. cloud security firm—disrupted Windows-based systems across banks, airlines, and hospitals, causing airport check-in failures and widespread flight delays [5].
These incidents illustrate that cyber resilience must address a wide range of disruptions, not only from deliberate cyberattacks but also from configuration errors, software bugs, and human mistakes. As such, there is a growing consensus on the need for quantitative approaches to resilience assessment. In response, several global frameworks have emerged to guide resilience planning. For example, MITRE’s Cyber Resiliency Engineering Framework (CREF) identifies four strategic goals: anticipate, withstand, recover, and adapt [6].
However, many existing frameworks rely heavily on checklist-based or managerial controls, which fall short in capturing system performance degradation during actual attack scenarios—particularly those affecting availability. To address this gap, quantitative methodologies are required to evaluate how effectively systems maintain and restore functionality under adverse conditions.
Yodo and Wang (2016) introduced an engineering-based approach that quantifies resilience using the cumulative Area Under the Curve (AUC) of performance over time [7]. While this method offers a solid foundation, it lacks standardization for diverse service environments and does not specify metric selection criteria.
In this study, we define key requirements for quantitative cyber resilience metrics and propose a set of ten metrics that meet these criteria. Two availability-focused metrics—Transactions per Second (TPS) and Connections per Second (CPS)—were validated through controlled denial-of-service experiments on a real-world web service platform. By applying AUC-based normalization relative to each organization’s Recovery Time Objective (RTO), we demonstrate an objective and interpretable method for resilience assessment. Our findings offer practical insights into availability-focused evaluation methods and contribute to advancing quantitative approaches to cyber resilience.

2. Related Research

2.1. Recent Trends and Emerging Directions in Cybersecurity Research

Contemporary research in information security has shifted its emphasis from traditional threat-blocking mechanisms to a more holistic approach that enhances cyber resilience. This includes strengthening key capabilities such as threat detection, system identification, and integrity assurance.
For instance, Cong et al. explored the critical observability of stochastic discrete-event systems in cyber-physical environments affected by sensor faults or communication losses, thereby improving fault detection and identification mechanisms [8]. Lin et al. introduced a security detection platform that integrates IOTA-based distributed ledger technology (DLT) with the InterPlanetary File System (IPFS), providing a practical framework for vulnerability identification and data integrity [9]. Similarly, Kim et al. proposed a secure authentication protocol tailored for smart city IoT infrastructures, utilizing biometric mutual authentication combined with Physical Unclonable Functions (PUFs) to mitigate potential security threats [10].
Song et al. mathematically analyzed the applicability of One-Wafer Periodic (1-WP) scheduling in a dual-arm cluster tool used for semiconductor manufacturing, depending on the number of iterations of the reentry process. Based on the results, he proposed a so-lution to reduce cycle time and improve system productivity [11].
Together, these studies illustrate the field’s ongoing transition toward building systems that are not only secure by design but also capable of resilient detection and adaptive response to emerging cyber threats.

2.2. Trends in Cyber Resilience Policies and Frameworks

In recent years, cyber resilience has been increasingly integrated into national-level strategies and regulatory frameworks across major jurisdictions. The United States, through its National Cybersecurity Strategy (2023) [12], the European Union via the Cyber Resilience Act (2022) [13], the United Kingdom’s National Cyber Strategy (2022) [14], and Japan’s Cybersecurity Strategy (2021) [15] have all institutionalized cyber resilience as a core component of policy aimed at securing critical infrastructure and essential services.
Beyond national policies, several international and standards-based frameworks have also contributed to defining and operationalizing cyber resilience. The U.S. National Institute of Standards and Technology (NIST) incorporates resilience principles into its Cybersecurity Framework (CSF), particularly through the PROTECT function, which focuses on maintaining system availability and operational continuity under adverse conditions [16]. The World Economic Forum (WEF) has developed a Cyber Resilience Index (CRI) that evaluates organizations using a structured checklist of 24 primary and 48 secondary criteria, organized under six operational principles. A weighted scoring model is applied to compute an overall CRI score [17]. Additionally, NIST Special Publication 800-160 Volume 2 offers a systems engineering-based framework for designing resilient systems. It presents a comprehensive set of practices addressing adversarial threats, attack mitigation strategies, and resilient architecture principles [18]. However, this framework lacks a quantitative methodology to measure the effectiveness of specific controls or to determine whether the level of resilience achieved is adequate, leaving a gap in evaluative precision for policy and implementation.

2.3. Research on ICT and Web Service Quality Metrics

Efforts to quantify the performance and reliability of ICT and web services have gained prominence as foundational components for assessing cyber resilience. In South Korea, the Ministry of Science and ICT has introduced a set of performance metrics for evaluating wireless Internet services. These include connection success rate, transmission success rate, latency, data loss rate, and throughput. Among these, latency, throughput, and loss rate are particularly noteworthy, as they can be empirically measured and are directly applicable to resilience evaluation frameworks [19].
Complementing these national-level efforts, Oriol et al. [20] conducted a comprehensive systematic review of web service quality evaluation models. Their study identified and consolidated key metrics such as accessibility, accuracy, processing capacity, mean time to recovery (MTTR), robustness, availability, and response time. These metrics were synthesized into a unified evaluation framework, offering a conceptual foundation for their potential adaptation as metrics of cyber resilience.
These findings suggest a convergence between traditional ICT performance metrics and resilience-focused evaluation criteria, indicating the viability of leveraging established service quality metrics in the development of quantitative cyber resilience assessment models.

2.4. Cyber Resilience Quantification Models and Simulation-Based Research

Quantifying cyber resilience often involves evaluating system performance variations over time in response to adverse events. One widely recognized approach is the Cyber Resilience Quantification Framework (CRQF), proposed by AlHidaifi et al. [21]. This framework conceptualizes resilience as comprising four phases—Preparation, Absorption, Recovery, and Adaptation—and employs simulation-generated performance curves to illustrate how systems recover over time. Quantitative analyses are then applied to assess the effectiveness of resilience strategies.
Building on this time-series perspective, Weisman et al. [22] introduced a quantitative method based on the Area Under the Curve (AUC) to evaluate resilience in vehicular network systems subjected to cyberattacks. By measuring the degree of performance degradation and the speed of recovery, the AUC-based approach enables comparative analysis of different defense mechanisms and provides a standardized metric for resilience evaluation. This method is particularly useful in assessing the overall robustness of cyber-physical systems under attack conditions, as illustrated in Figure 1.
Further extending the scope of resilience analysis, Llansó et al. proposed a mission-centric model that links resilience to business and operational objectives [23]. By incorporating the concept of Mission Essential Functions (MEFs), their framework evaluates how cyberattacks affect mission success rates. This approach allows for resilience assessments that move beyond traditional performance metrics and address organizational impact, offering a broader perspective on system continuity and strategic recovery.
Collectively, these studies contribute to the development of quantitative and simulation-based models that enable systematic measurement of cyber resilience in diverse operational contexts.

3. Criteria for Selecting Quantitative Metrics

To enable objective and consistent evaluation of cyber resilience, this study proposes a structured methodology for selecting quantitative metrics based on five core criteria: objectivity, reproducibility, scalability, practicality, and resilience representation. These criteria are supported by two complementary design principles—Mutual Exclusivity (ME) and Collective Exhaustiveness (CE)—that guide the construction of a coherent and comprehensive evaluation framework.

3.1. The Necessity of Criteria for Selecting Quantitative Metrics

As cyber resilience becomes a strategic imperative in both policy and operational domains, the need for quantifiable, reliable, and actionable metrics is increasingly emphasized. Existing frameworks, such as the World Economic Forum’s Cyber Resilience Index (CRI), offer checklist-based assessments from a managerial perspective [17]. Bodeau underscores that effective resilience metrics must capture a system’s responsiveness during incidents and not merely recovery time or residual functionality [24]. Similarly, NIST SP 800-55 Revision 1 mandates that performance metrics should be quantifiable, reproducible, and objectively interpretable [25], while ISO/IEC 27004:2016 identifies measurability and quantitativeness as essential for performance evaluation [26].
By establishing well-defined criteria for metric selection, organizations can ensure consistent measurement of resilience, facilitate benchmarking, and support the development of adaptive and proactive cybersecurity strategies.

3.2. Selection Criteria for Quantitative Cyber Resilience Metrics

Drawing upon existing research and standards—including Bodeau’s operational criteria [24], NIST’s Cyber Resiliency Engineering Framework (CREF) [6], and Bruneau’s resilience attributes [27]—this study identifies five essential criteria for the selection of cyber resilience metrics:

3.2.1. Objectivity

Objectivity refers to a metric’s ability to be clearly defined, quantifiable, and interpretable independent of evaluator bias. According to NIST SP 800-55 Revision 1, metrics must support objective decision-making through quantifiability and consistency [25]. For example, server response time can be measured in milliseconds using standardized tools, ensuring clear interpretation across evaluators and contexts.

3.2.2. Reproducibility

Reproducibility ensures that metrics yield consistent results under identical conditions, regardless of who performs the evaluation or when it is conducted. As noted by Bodeau [24] and ISO/IEC 27004:2016 [26], this property is essential for comparative analysis and long-term monitoring. Inconsistent measurements undermine the credibility and reliability of resilience assessments.

3.2.3. Scalability

Scalability refers to a metric’s applicability across various domains, architectures, and service environments. Murino et al. [28] and Haque [29] emphasize the need for generalizable, model-independent metrics that can accommodate evolving cyber environments—from cloud infrastructures to IoT ecosystems and smart cities.

3.2.4. Practicality

Metrics must be operationally feasible and interpretable in real-world environments. Bodeau stresses that overly theoretical metrics often face resistance in practice [30]. Metrics such as throughput, availability, and response time are examples of practical metrics that are both measurable and immediately actionable.

3.2.5. Resilience Representation

To fully capture the concept of cyber resilience, metrics should go beyond availability and recovery time to represent the system’s entire lifecycle—from incident detection through response and recovery. This is consistent with recommendations from both the WEF CRI [17] and Bodeau [24], who argue for time-series metrics that model degradation and recovery processes. The WEF CRI emphasizes that organizations must measure performance degradation and recovery over time and cover the full cycle of detection, response, and recovery [17]. Bodeau (2018) similarly argues that practitioners should quantify and structure degradation and recovery rather than use binary availability checks or instantaneous performance snapshots [24]. Thus, metrics must reflect the structured entirety of the system lifecycle to quantitatively assess cyber resilience.

3.3. Complementary Metric Design Criteria

In addition to the five essential criteria, two design principles are proposed to guide the construction of a comprehensive and non-redundant metric system: Mutual Exclusivity (ME) and Collective Exhaustiveness (CE).

ME and CE Principles

The MECE (Mutually Exclusive, Collectively Exhaustive) principle—widely applied in systems engineering and structured problem-solving—ensures that selected metrics avoid overlap (ME) and comprehensively cover all relevant dimensions (CE). Lee applied this principle in machine learning to reduce feature redundancy and improve model interpretability [31].
In cyber resilience evaluation, the ME principle helps distinguish metrics such as “latency” and “response time,” which may otherwise overlap in scope. The CE principle ensures that no relevant resilience aspect remains unmeasured—an essential requirement for evaluating interconnected and large-scale systems such as smart cities or critical national infrastructures.
Together, ME and CE serve to enhance the analytical rigor, clarity, and operational viability of the cyber resilience evaluation framework by minimizing ambiguity and maximizing coverage.

4. Process for Selecting Quantitative Metrics

This section outlines a structured methodology for deriving quantitative cyber resilience metrics tailored to real-world service environments. The proposed process is grounded in the five core selection criteria—objectivity, reproducibility, scalability, practicality, and resilience representation—and is reinforced by two complementary design principles: Mutual Exclusivity (ME) and Collective Exhaustiveness (CE).
As illustrated in Figure 2, the methodology proceeds through a sequence of analytical steps, from service identification to the final selection of metrics, to ensure alignment with actual operational demands and resilience requirements.

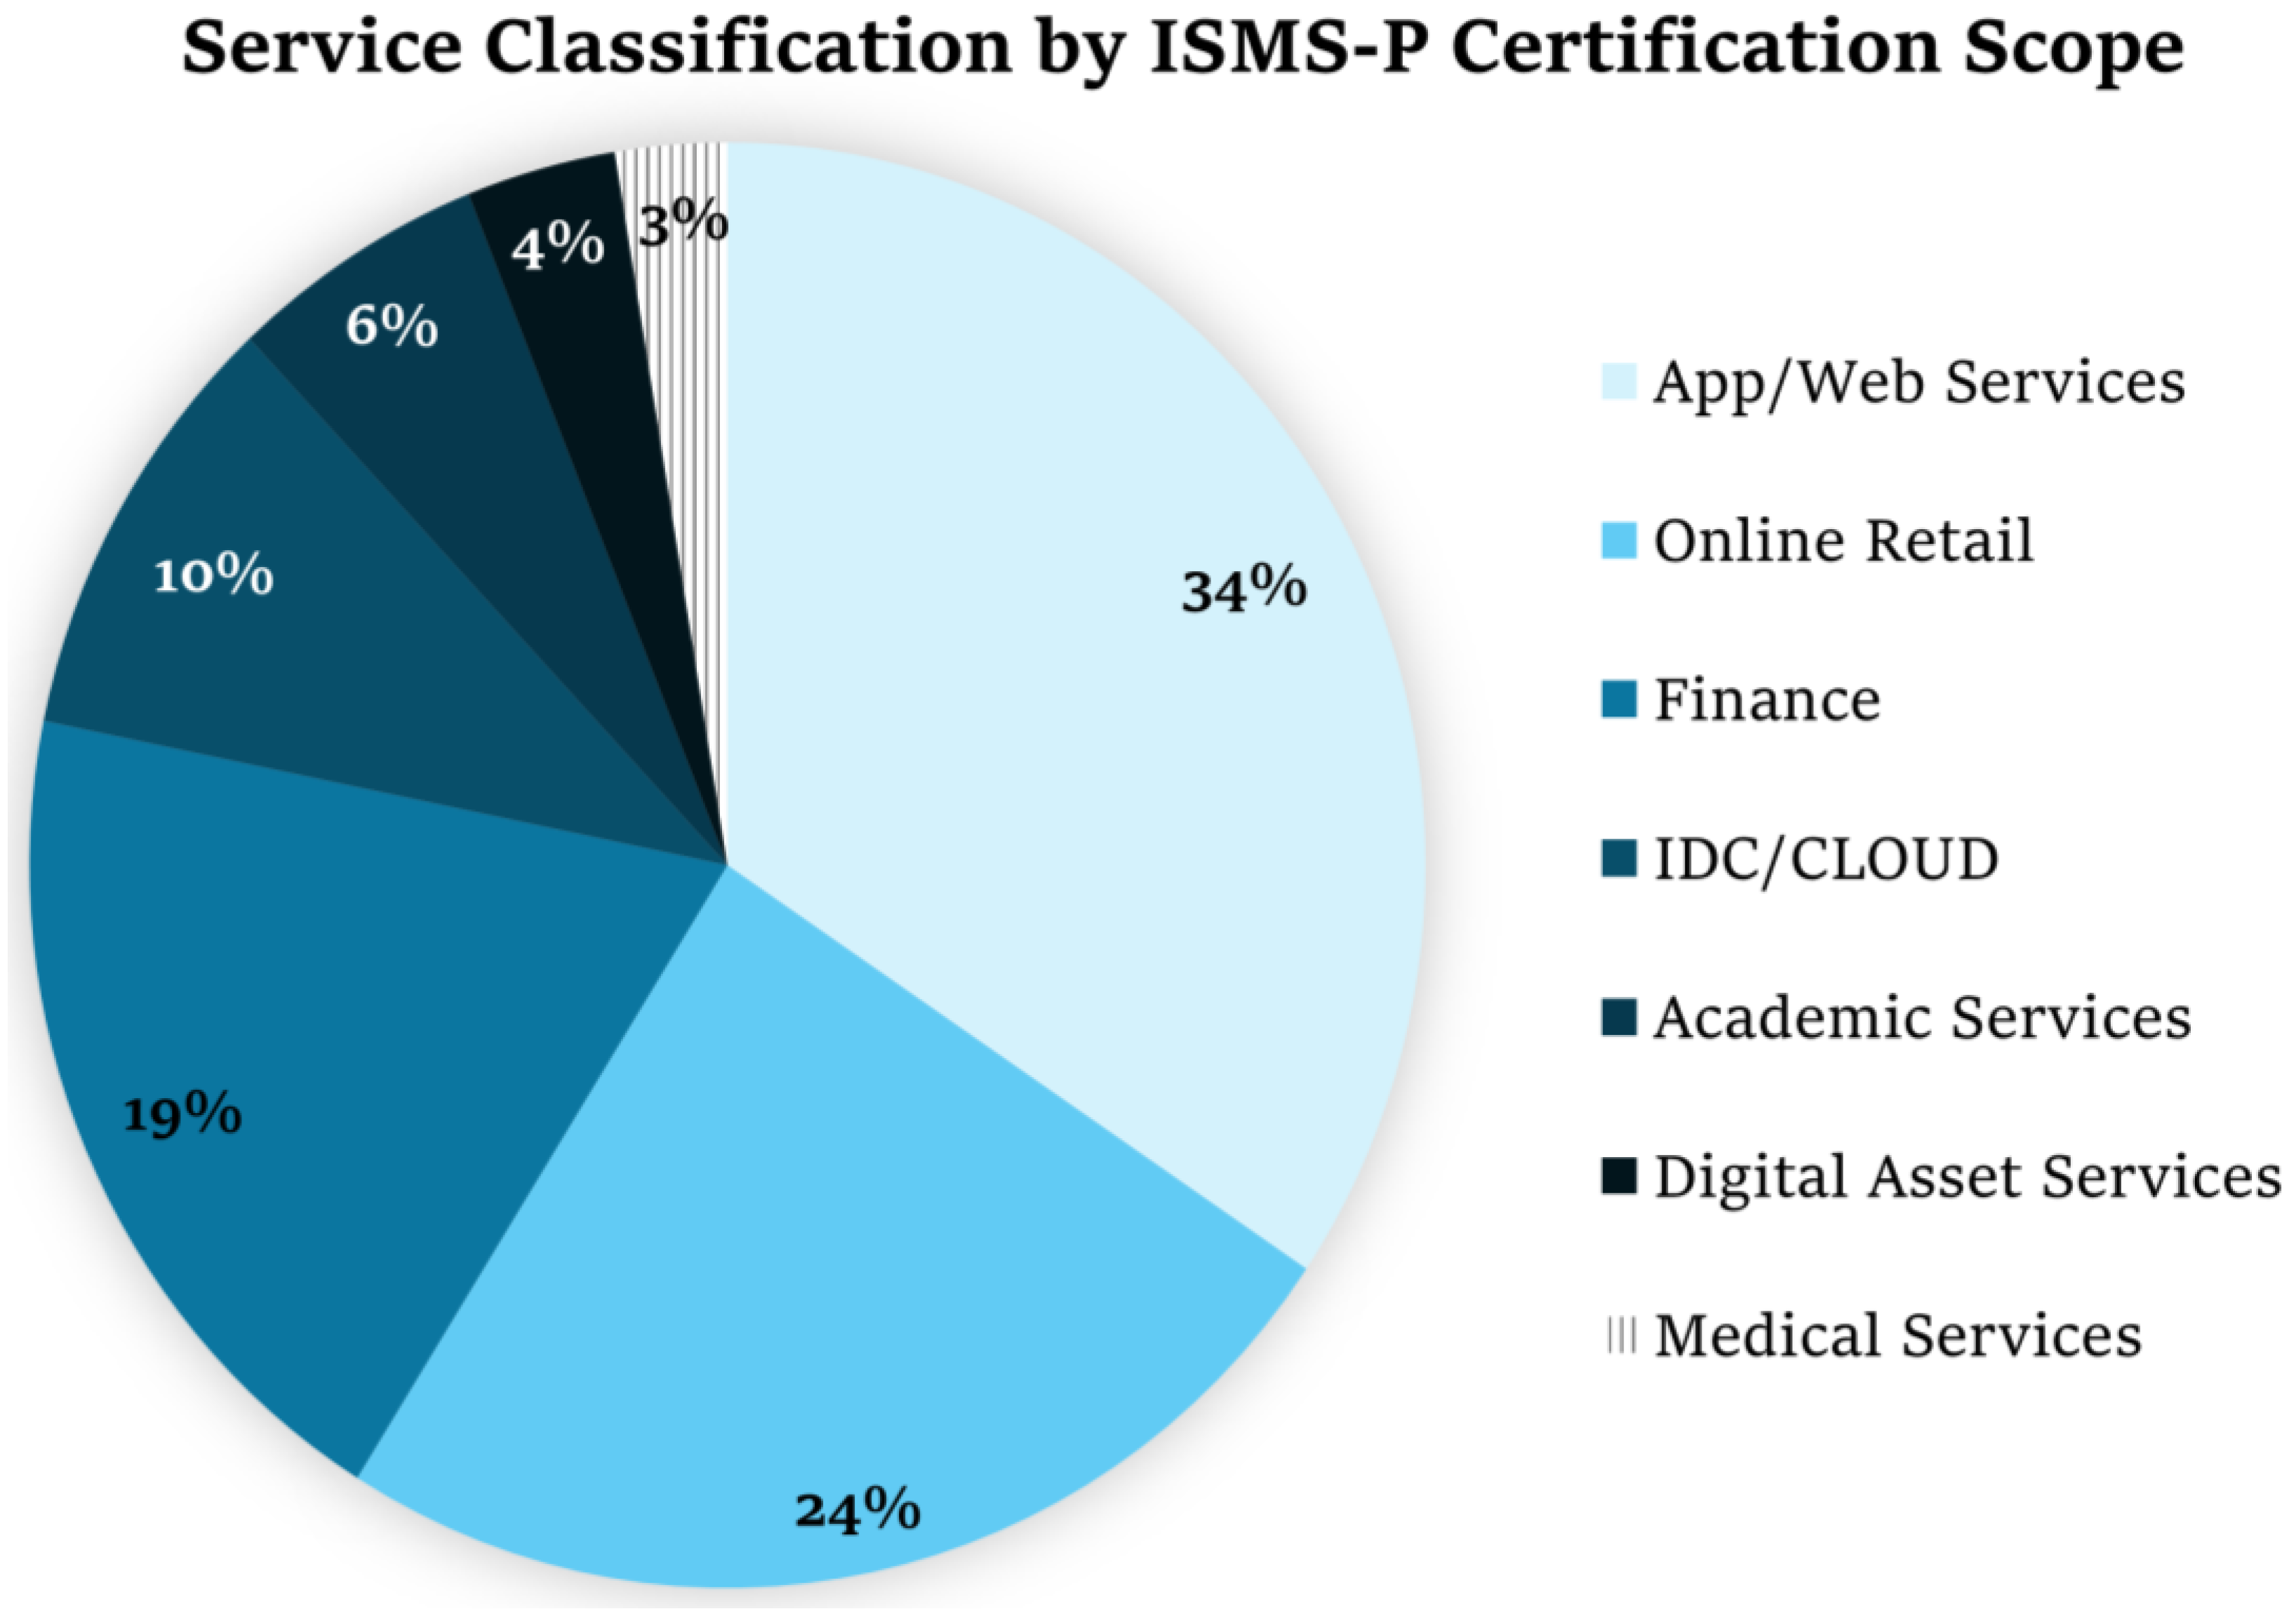
4.1. Selection of Target Services

According to NIST Special Publication 800-160 Volume 2, cyber resilience assessment should consider services from four perspectives: programmatic, operational, architectural, and threat-based [18]. Similarly, MITRE ATT&CK framework categorizes services based on technical deployment environments—Cloud, On-Premise, or Hybrid—to identify exposure to adversarial behaviors [32]. To align with these principles, this study classifies services based on real-world operational data from organizations certified under the Information Security Management System—Personal Information (ISMS-P) in South Korea. The ISMS-P certification system, governed by the Korea Internet & Security Agency (KISA), integrates the international ISO/IEC 27001 standard with domestic privacy protection mandates [33], and requires organizations to specify their core service types during the certification process. As of 1 July 2024, 124 organizations have received ISMS-P certification.
These institutions span diverse sectors, including app/web service operations (34%), online retail (24%), finance (19%), IDC/cloud services (10%), academic systems (6%), virtual asset services (4%), and medical information systems (3%) (see Figure 3). Although these categories are administratively defined, they exhibit distinct operational properties—such as transaction intensity, availability requirements, and regulatory constraints—necessitating context-specific resilience metrics. Table 1 presents the seven major service categories examined, along with their respective resilience priorities. For app/web service operations—including public portals, corporate websites, enterprise resource planning (ERP) systems, and online gaming platforms—data integrity and low response latency are critical due to their reliance on real-time interactions and user experience. In contrast, financial services and virtual asset platforms require high levels of data integrity, security, and regulatory compliance, owing to their exposure to high-value transactions and strict legal obligations. Academic systems, such as university portals and online learning platforms, demand scalability and real-time data processing capabilities to support traffic surges during registration or examination periods. Medical information systems, which handle sensitive patient data, prioritize data integrity and confidentiality, as service disruptions or breaches may pose risks to patient safety and privacy.
This classification process accounts for the varying operational goals, user behavior patterns, and regulatory contexts associated with each service type. By aligning resilience metrics with the specific threats and resilience demands of each domain, the framework ensures that resulting measurements are both relevant and actionable. Consequently, the classification of services and the identification of their resilience requirements form the foundation of a robust, domain-sensitive cyber resilience evaluation methodology.

4.2. Identification of Key Services and Candidate Quantitative Metrics

To identify relevant metrics, we analyzed service categories and associated resilience characteristics based on the operational contexts of ISMS-P-certified organizations. The identification process followed two steps:
  • Preliminary Metric Selection: Literature review and sector case analysis were conducted to identify metrics aligned with resilience attributes required in key industries, such as finance, public services, and healthcare.
  • Derivation of Candidate Metrics: Based on the analysis, we derived a list of candidate metrics that reflect real-world operational characteristics.
These include metrics commonly collected by APM (Application Performance Monitoring), SIEM (Security Information and Event Management), and infrastructure telemetry tools, which are routinely used to monitor latency, throughput, authentication success, and resource usage in real-time operational settings [34,35].
Table 2 presents the resulting candidate metrics mapped to the corresponding resilience requirements. Their validity was assessed by applying the selection criteria introduced in Section 3.
Table 3 shows the preliminary application of the full evaluation framework to 19 candidate metrics.

4.3. Incorporation of Resilience Quantitative Metrics Selection Criteria

Each candidate metric was evaluated against the five selection criteria. For instance: Jitter, though it indicates temporal instability, shows low reproducibility under identical conditions (RFC 5481) [36]. Capacity, as a static upper bound, does not reflect real-time changes under stress. Throughput, on the other hand, dynamically reflects service performance and is more resilient-representative in degradation and recovery scenarios [37]. Packet Loss, while useful during detection or response, does not directly indicate recovery capability and is therefore less representative of full resilience.
This filtering process ensured that only metrics with strong alignment to the selection criteria were retained for further consideration.

4.4. Application of Complementary Design Criteria for Metrics Selection

To improve the structural consistency and completeness of the final metric set, two higher-order design principles—Mutual Exclusivity (ME) and Collective Exhaustiveness (CE)—were applied.

4.4.1. Mutually Exclusive (ME)

The ME principle ensures that metrics do not exhibit semantic or functional redundancy. For example, metrics such as Response Time, End-to-End Delay, Latency, Jitter, and Page Load Time capture similar temporal aspects of service performance, albeit across different contexts or layers. Similarly, Connection Success Rate and Connections Per Second (CPS) both reflect connection performance. Throughput and Capacity, as well as Packet Loss and Data Loss Rate, exhibit similar overlaps.
To reduce redundancy, only one representative metric from each overlapping group was selected, with the others designated as context-specific or supplementary. Metrics such as Response Time, CPS, Throughput, Packet Loss, and TPS were selected for their clarity and cross-sectoral applicability.

4.4.2. Collectively Exhaustive (CE)

The CE principle ensures that no essential domain is left unmeasured. For example, Provisioning Time, while conceptually similar to Mean Time to Recovery (MTTR), was retained because it reflects resilience through dynamic resource allocation—particularly important in cloud environments. It captures preparatory recovery mechanisms, such as auto-scaling and service reconfiguration, which MTTR alone does not fully address [38].
Applying CE guarantees that all service categories and resilience mechanisms—ranging from detection and response to recovery and adaptation—are sufficiently covered.

4.5. Final Selection of Quantitative Metrics

Table 4 presents the final set of ten quantitative metrics selected through the structured evaluation framework proposed in this study. Each metric is accompanied by a formal definition and a computational formula. The selected metrics were chosen based on their demonstrated applicability across a wide range of service domains and their adherence to the five core selection criteria—objectivity, reproducibility, scalability, practicality, and resilience representation—as well as the Mutual Exclusivity (ME) and Collective Exhaustiveness (CE) design principles. This dual-filtering approach ensured that the final metric set avoids redundancy while maintaining full coverage of critical cyber resilience dimensions.
Among the selected metrics, Mean Time to Recovery (MTTR) was identified as a foundational resilience metrics applicable to nearly all service types. MTTR quantifies the average time required to restore a system to a defined steady-state operational condition following a disruption. Importantly, the “steady state” must be contextually defined based on each organization’s performance benchmarks or key performance indicators (KPIs). Response Time, Packet Loss, and Fault Detection Time were selected for their importance in environments with strict performance and availability requirements—such as telecommunications, healthcare, and cloud data centers—where rapid responsiveness and network stability are critical.
Metrics such as Transactions Per Second (TPS), Connections Per Second (CPS), Throughput, and Concurrent Connections (CC) represent key metrics of a system’s processing capacity and scalability under stress. TPS, as an application-layer metric, offers a direct measure of service throughput. However, in environments using encryption protocols (e.g., TLS/SSL), TPS may become impractical to observe due to packet-level obfuscation. In such cases, CPS—operating at the transport layer (Layer 4)—provides a viable alternative by measuring system load and session-handling capacity based on observable traffic characteristics.
Two additional metrics were included to reflect critical aspects of system adaptability and security responsiveness: Authentication Time and Provisioning Time. Authentication Time captures the delay in validating user or system access credentials, while Provisioning Time measures the duration required for automatic, policy-driven reallocation or configuration of resources. The inclusion of Provisioning Time is particularly relevant in cloud-native and virtualized environments, where resilience often involves preemptive or dynamic actions such as horizontal scaling, component isolation, service redeployment, or migration—actions that occur prior to or in lieu of full recovery.
Collectively, these ten metrics provide a comprehensive and scalable foundation for evaluating cyber resilience across diverse operational contexts, enabling consistent, service-aware measurement aligned with both technical and organizational resilience objectives.

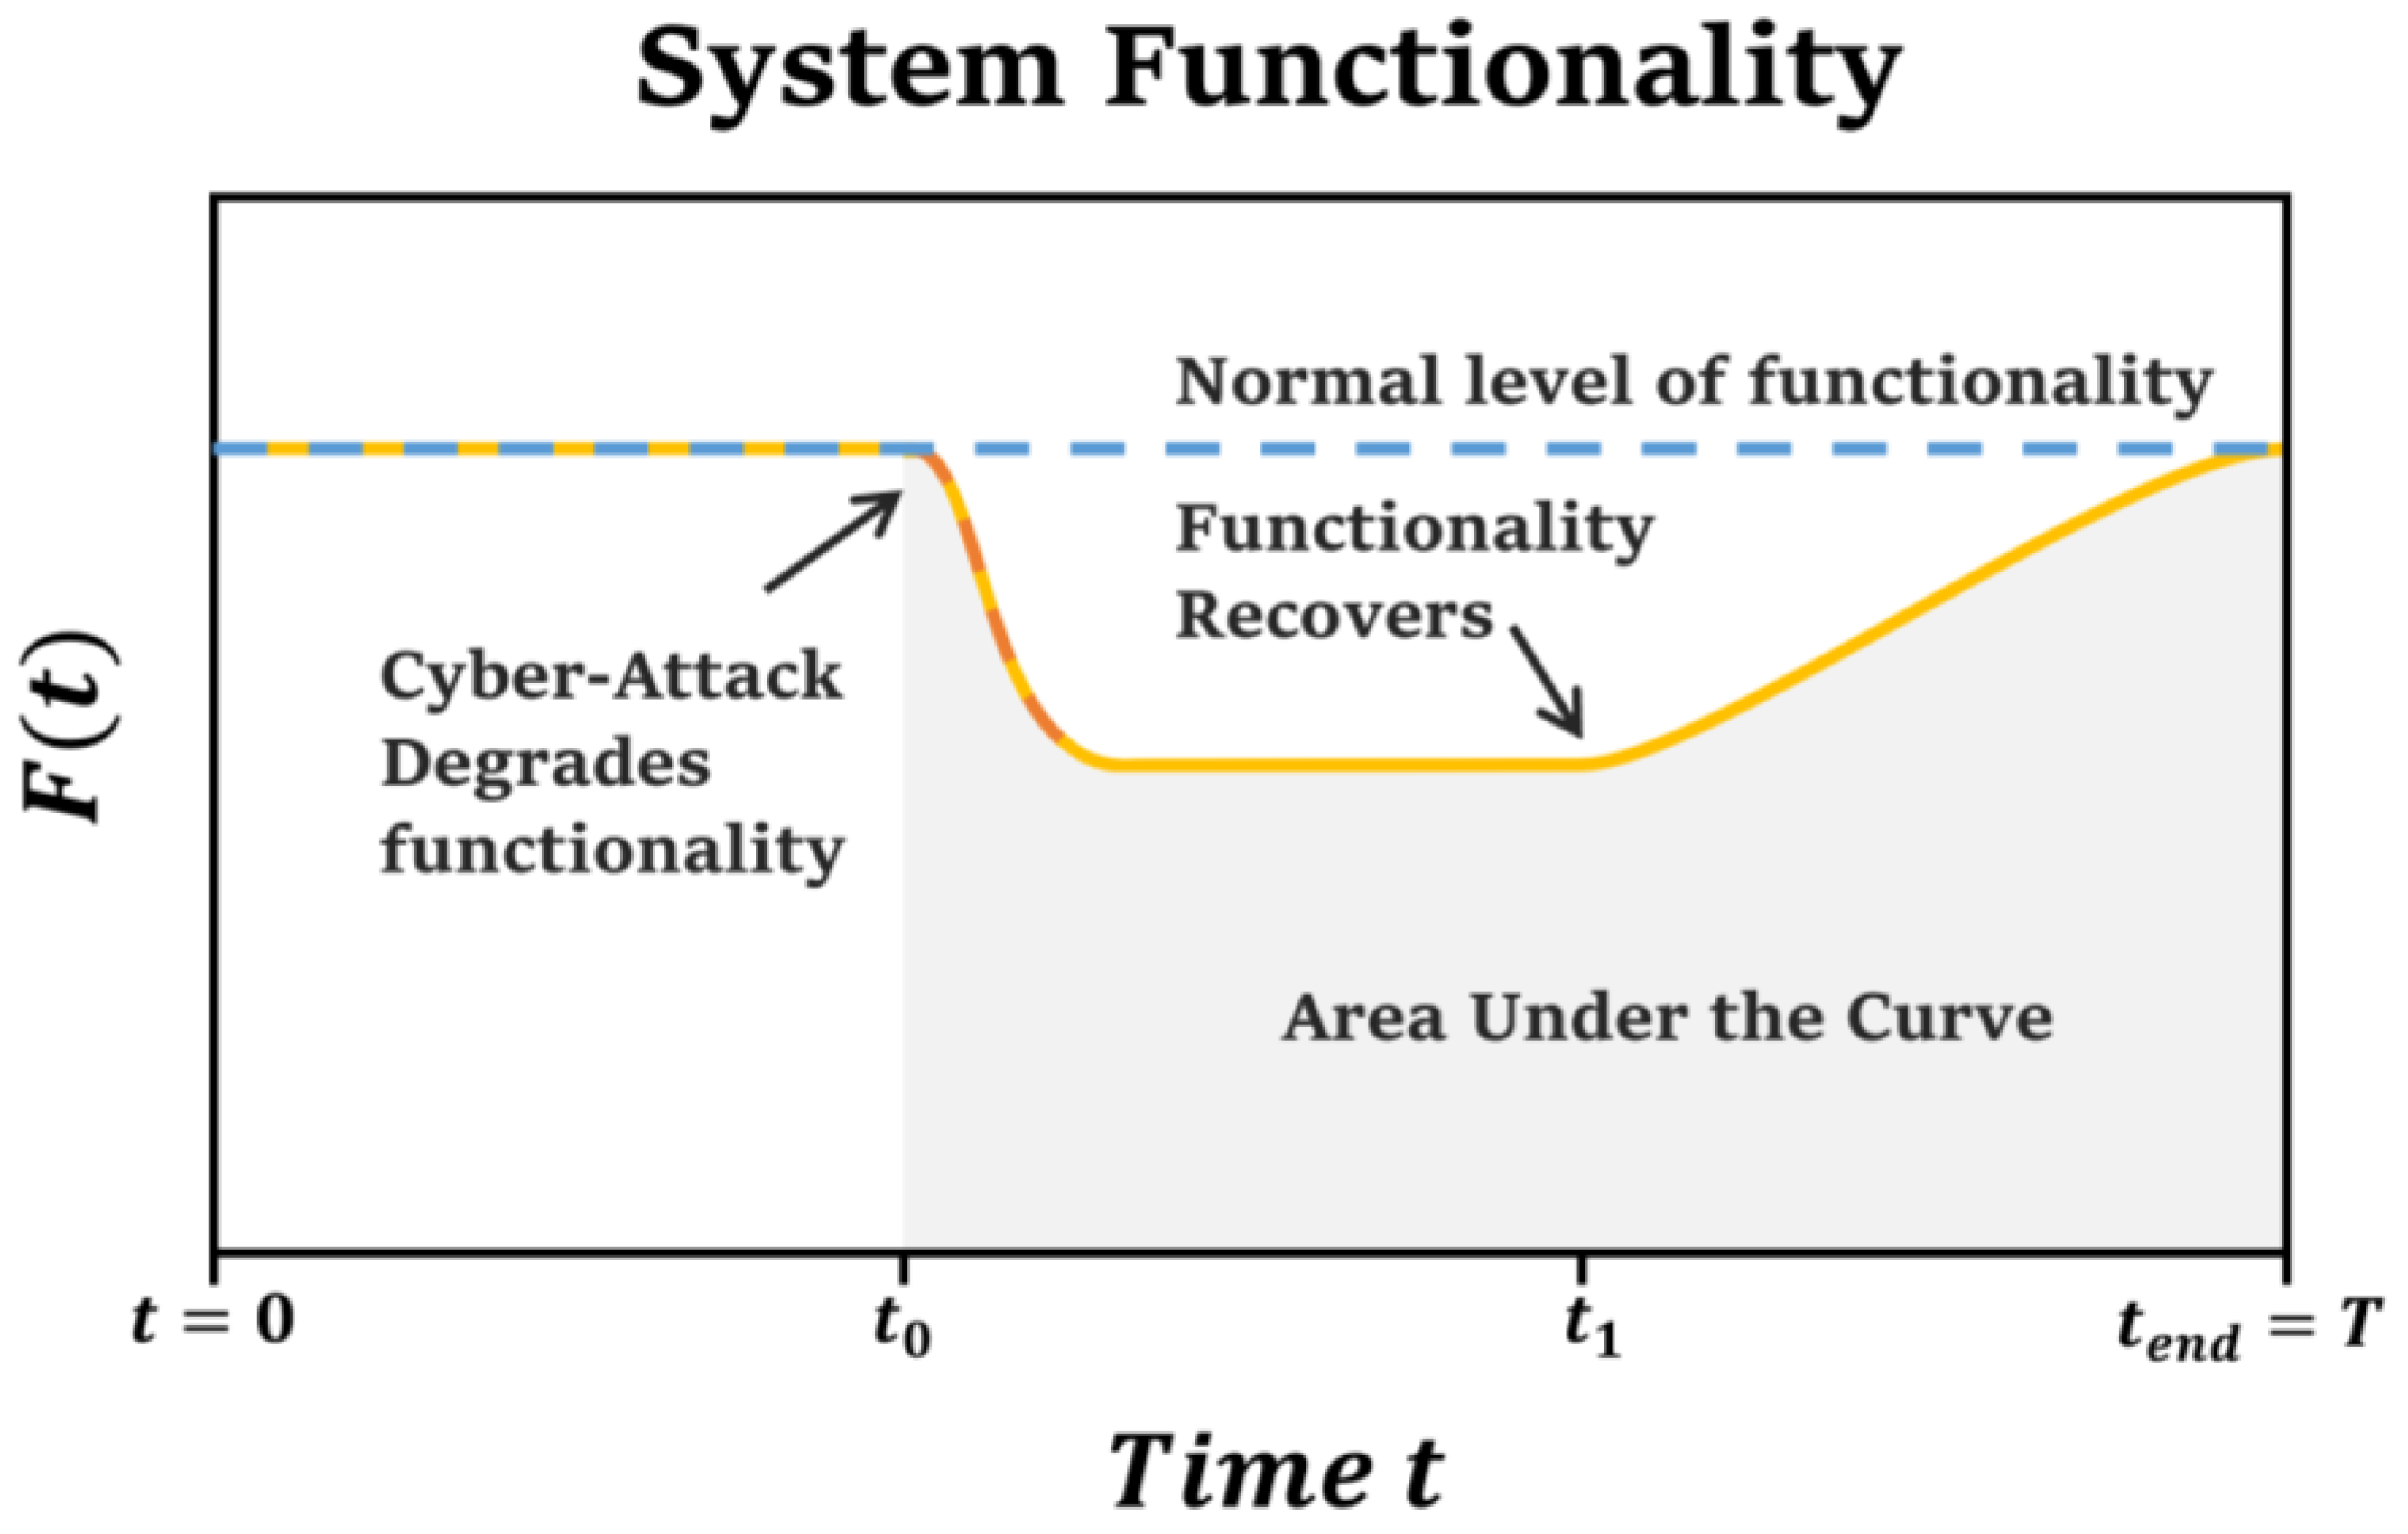
5. Normalization of Cyber Resilience Metrics

5.1. Necessity of Normalizing Quantitative Metrics

The ten cyber resilience metrics derived in Section 4.5—such as TPS, CPS, MTTR, and Response Time—are well-suited for real-time monitoring and for analyzing variations in system performance. These metrics are effective in detecting operational anomalies and evaluating resilience within individual systems. However, direct comparisons across heterogeneous systems remain challenging, as service-specific performance requirements and infrastructure configurations vary significantly.
For instance, the ITU-T guidelines for packet loss recommend a loss rate of 1% or lower for toll-quality telephony and 3% or lower for business-quality communication [39]. This illustrates how quality requirements may vary depending on the target service.
Therefore, to compare and evaluate cyber resilience levels across services or institutions, it is necessary to normalize diverse quantitative metrics using a common methodology that enables relative comparison. In this chapter, we define an AUC-based normalization method for each metric and propose an approach for comparing quantitative resilience levels across heterogeneous systems.

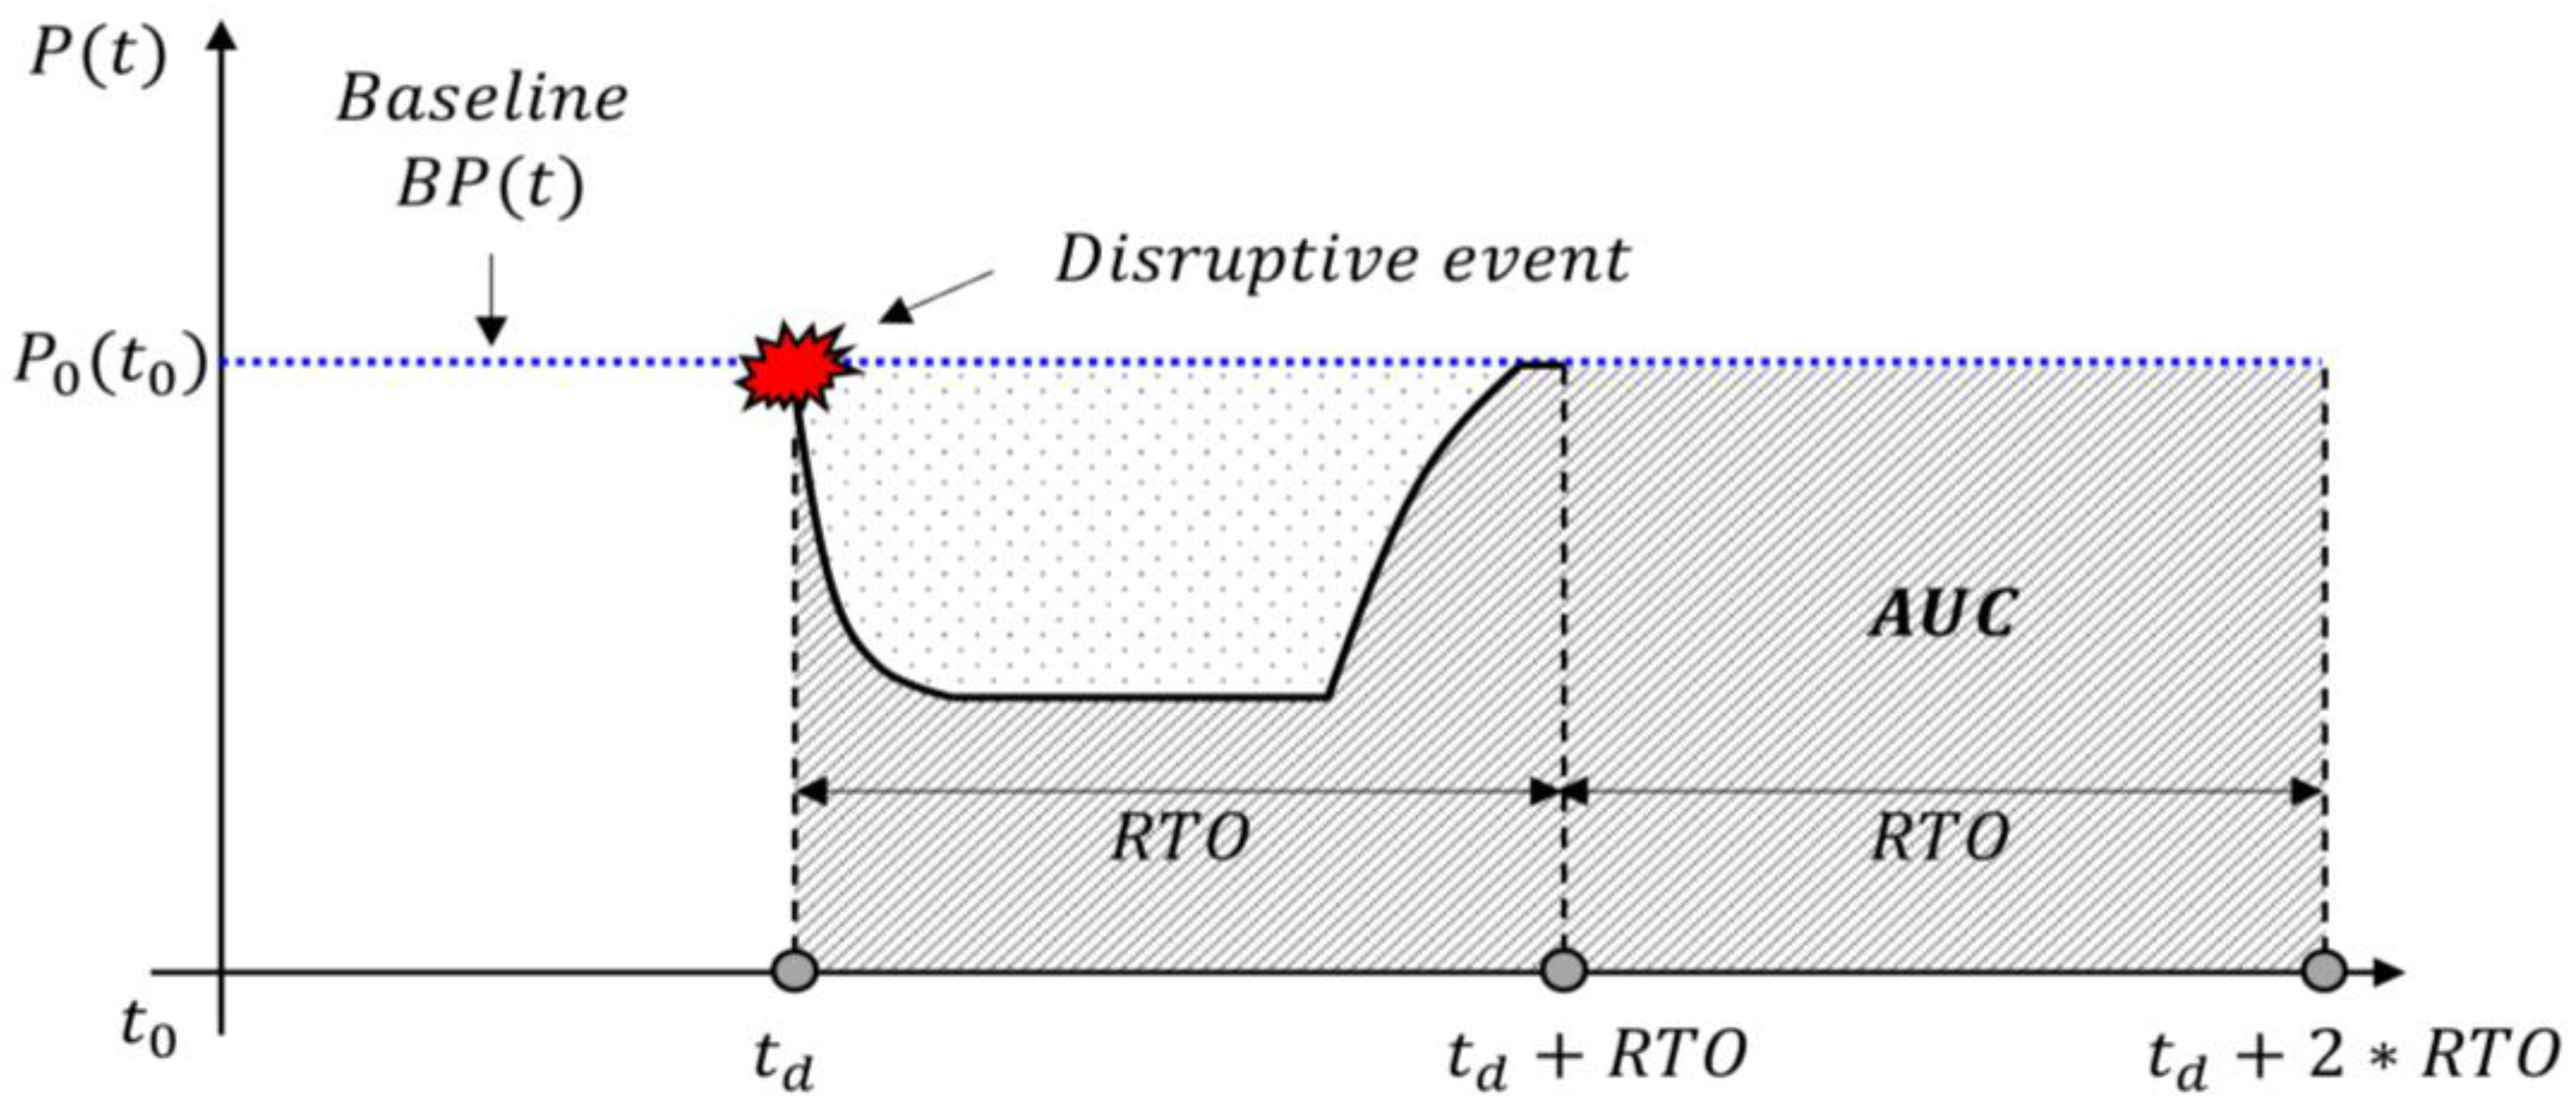
5.2. AUC-Based Normalization Evaluation

The AUC is used as a basis for quantifying performance degradation during the normalization of quantitative metrics. It serves as a key metric for visually representing and evaluating the extent of performance decline and the recovery trend of a system in the event of a cyberattack or failure. For instance, when performance metrics such as TPS or CPS are represented as time-varying curves, the AUC indicates the cumulative level of performance maintained throughout the entire observation period.
From a resilience normalization perspective, AUC is used to convert the relative loss of each metric into a normalized scale by expressing the actual performance AUC as a ratio of the baseline AUC (i.e., the AUC under ideal conditions). A higher AUC value indicates that the system maintained relatively high performance during the failure, whereas a lower AUC suggests more severe performance degradation or delayed recovery.
This AUC-based performance loss approach has also been used as a key quantification method in the field of Engineering Resilience. Yodo & Wang (2016) [7] and Dessavre et al. [40] calculated the Impacted Area (IA) on the resilience curve to reflect the cumulative impact of performance degradation and presented it as a resilience metric by calculating the ratio of the actual measured AUC to the ideal performance target. Equation (1) below defines the integral resilience index Ψ i   of the resilience metric i ,
Ψ i = t d t d + T * P i t d t t d t d + T * B P i t d t
where P i ( t ) is the performance of metric i at time t , B P i ( t ) is the base line (ideal) performance of metric i at time t , t d is the time at which the damage occurred, and T * refers to the control period, which represents a sufficiently long reference window.
The choice of control period T * affects interpretation. If T * is short and the degradation is severe, the index may appear low even if recovery is rapid. Conversely, slow recovery with minimal degradation may yield a higher index despite reduced service continuity.
To improve standardization and relevance, this study proposes using a fixed observation window ranging from the disruption time t d to twice the organization’s Recovery Time Objective (2 × RTO). This enables evaluation of whether recovery occurs within a tolerable period. The revised AUC-based normalized resilience index (NRI) is defined in Equation (2), and its graphical representation is shown in Figure 4.
Ψ i = t d t d + 2 × RTO P i t d t t d t d + 2 × RTO B P i t d t
where RTO is the resilience target time of the organization. If an attack occurs and the performance of the measured metric remains at zero for the entire period of twice the resilience target time, Ψ i   is calculated as 0. If recovery is achieved shortly after the attack, Ψ i   is measured as a value close to 1. If system performance drops to zero due to the attack but recovers precisely within the organization’s resilience target time, Ψ i is measured as 0.5.

6. Demonstration of Cyber Resilience Metrics

An empirical experiment was conducted to evaluate TPS and CPS, which represent web transaction performance and client access performance to a web server, respectively. These two metrics are among the most critical of the ten quantitative cyber resilience metrics previously defined, particularly for web-based services.
This experiment reproduces the occurrence and mitigation of a TCP SYN flooding attack, classified as Endpoint Denial of Service (T1499) in the MITRE ATT&CK framework [32], under simulated normal web traffic conditions. The primary objective is to demonstrate the applicability and interpretation of cyber resilience metrics in response to service disruptions.

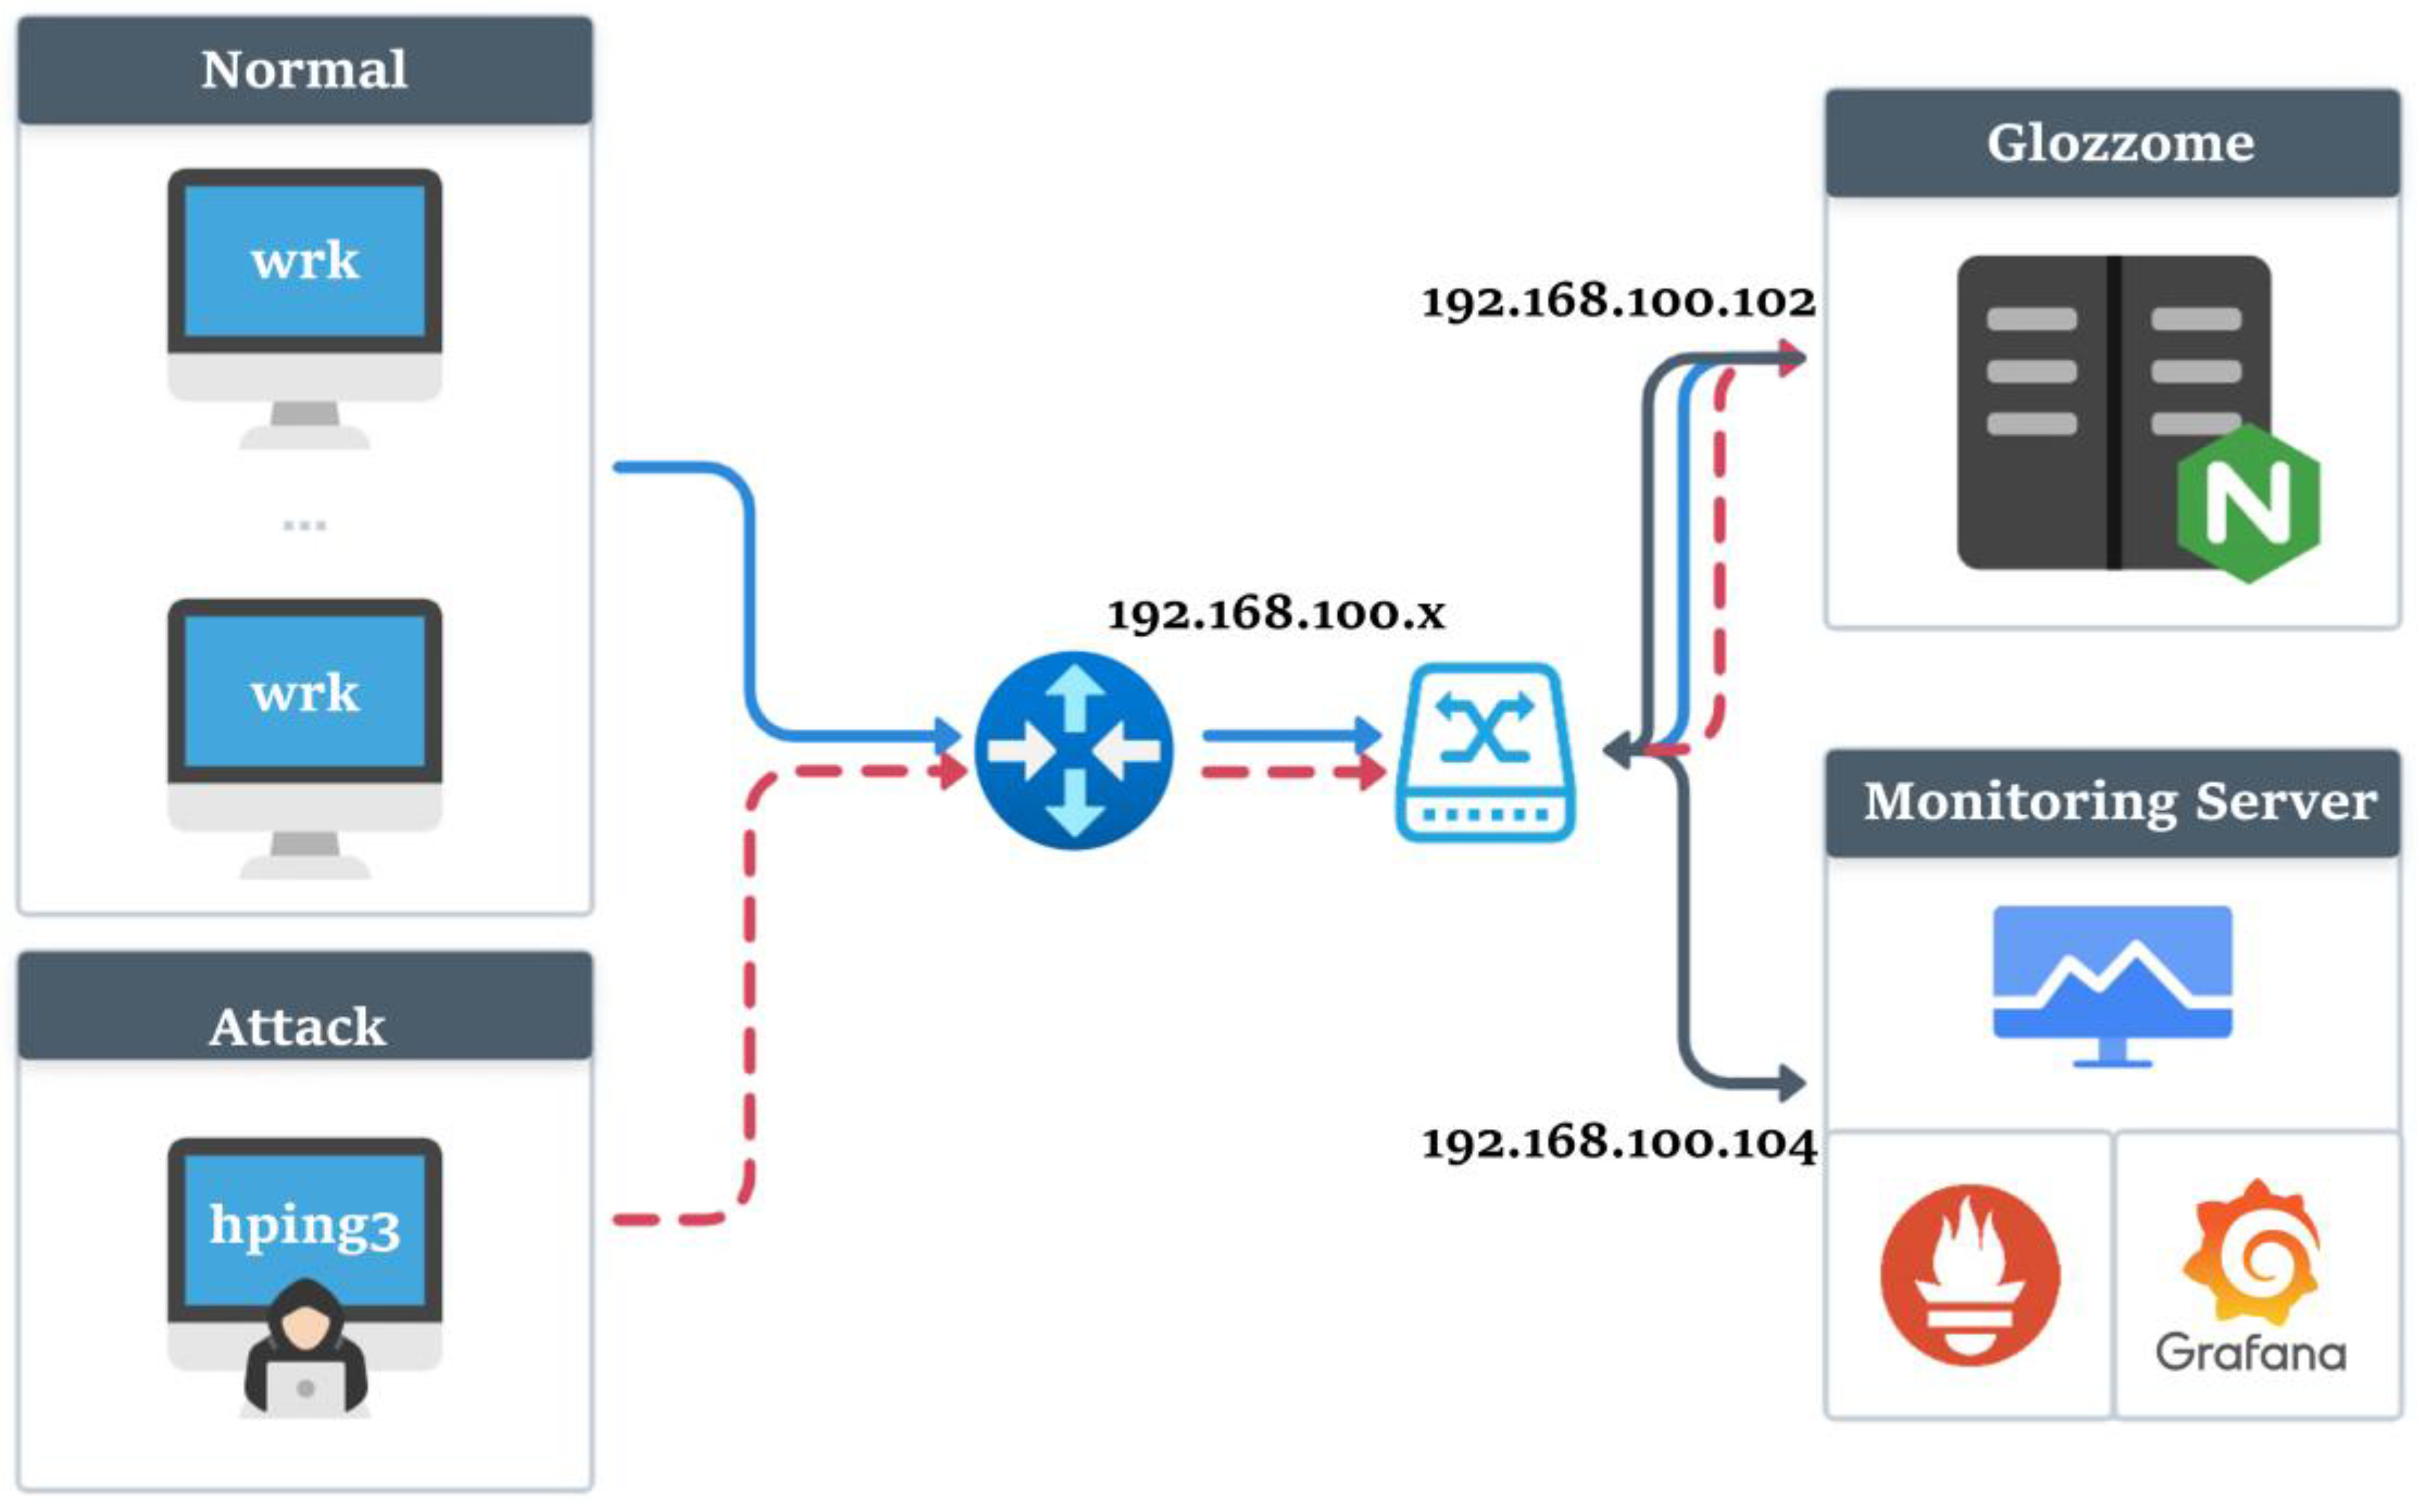
6.1. Experimental Environment

The experiment was conducted in an Nginx-based web server environment running on a system equipped with an Intel® Xeon® Gold 6426Y CPU (16 cores per socket, 2 sockets, totaling 32 physical cores), Santa Clara, CA, USA. With Hyper-Threading enabled, the system supported 64 logical processors (threads). The number of Nginx worker processes was configured to match the number of physical cores to ensure optimal concurrency and throughput.
The server was equipped with 256 GiB of physical memory and configured to handle both normal and attack traffic through a 10 Gbps network interface (ens7f0). Monitoring of TPS and CPS was performed using Grafana, which received metric data via a separate 10 Gbps interface (ens7f1).
No software-level resource limits (e.g., CPU capping or memory constraints) were imposed during the experiment; all system resources were made fully available to simulate realistic high-load operating conditions.
The test webpage was a virtual corporate site named Glozzome, designed to resemble the structure and behavior of a real-world enterprise website [41]. Glozzome consisted of five HTML pages, each comprising 5 to 7 content sections, and was implemented using HTML, CSS, and Bootstrap to ensure a responsive, production-like interface. The overall experimental network architecture is illustrated in Figure 5.
To evaluate the TPS and CPS metrics, synthetic traffic was generated using the wrk tool, which simulated 1024 unique user IP addresses and produced approximately 14,000 TPS under normal web service conditions. Following this, a TCP SYN flooding attack was initiated against the Glozzome website using the hping3 tool (version 3.0.0-alpha-2). The attack intensity was incrementally increased by 0.3% every 5 s, starting from 50 packets per second (pps) and scaling up to 40,000 pps.
wrk is a multithreaded HTTP benchmarking tool that supports Lua scripting for advanced workload simulation. In this experiment, wrk was configured with a Lua script to emulate realistic normal client behavior by randomly requesting a mixture of HTML, CSS, JavaScript, and PNG resources hosted on the web server.
hping3 is a packet generation tool capable of crafting large volumes of custom TCP packets. For this experiment, it was configured to perform a SYN flood by progressively increasing the TCP SYN packet transmission rate, adhering to the defined ramp-up pattern. The target web server ran on Ubuntu 24.04, where the TCP SYN cookie mechanism is enabled by default to mitigate SYN flood attacks. However, this feature was explicitly disabled to simulate an unprotected attack scenario and allow clear observation of TPS and CPS variations under increasing load conditions.
To monitor the system in real time, a Prometheus-based monitoring environment was deployed, utilizing the nginx-prometheus-exporter to expose NGINX server statistics. This exporter converts NGINX status metrics into Prometheus-compatible format, enabling collection of cumulative metrics such as the total number of HTTP requests and established TCP connections.
Average TPS and CPS values were calculated using Prometheus’s rate() function with a 1-min time window, and the results were visualized at 15-s intervals using Grafana. This setup enabled real-time monitoring of attack onset, performance degradation, and subsequent recovery.
To mitigate TCP SYN flooding attacks, the TCP SYN cookie mechanism was activated at the operating system level. This technique allows the server to complete the TCP three-way handshake without allocating memory resources in the connection queue when it becomes saturated. Instead, connection state information is encoded into the Initial Sequence Number (ISN) of the SYN-ACK packet. Upon receiving a valid ACK from the client, the server reconstructs the Transmission Control Block (TCB) and establishes the connection. This stateless approach significantly reduces resource consumption and preserves service availability under high SYN flood conditions [42].

6.2. Experimental Process

An experimental scenario was designed to represent the Survive, Sustain, and Recovery phases in alignment with the AUC-based resilience modeling framework proposed by Weisman and Rahiminejad [22,43]. Among the ten selected evaluation metrics, TPS and CPS were used to assess the transaction processing performance of the web service.
The experiment was conducted over a 40-min period, from 16:05 to 16:45. Attack traffic commenced at 16:15, ten minutes after the initiation of normal traffic, and continued for 30 min. The summary of results is presented in Table 5.

6.2.1. Normal Service Phase (Normal)

In the absence of any attack traffic, wrk was used to generate normal web service load, beginning at 16:05. The system stably processed approximately 14,200 TPS and 140 CPS, representing the normal operational baseline of the web service.

6.2.2. Initial Attack Phase (Survive)

At 16:15, SYN flooding traffic was generated using hping3, with the attack rate exceeding 200 pps. During this early phase, the server maintained stable performance, with TPS and CPS remaining at approximately 14,200 and 140, respectively. At 16:17:45, the attack traffic increased to 14,290 pps, resulting in a performance degradation of approximately 10%, with TPS dropping to 12,378 and CPS to 117. This time point is designated as the disruptive event onset, denoted as t d , for resilience analysis.

6.2.3. Sustained Attack Phase (Sustain)

From 16:21, the attack intensity increased significantly, reaching 64,000 pps. Under this load, the system’s performance collapsed: TPS dropped to 5, and CPS fell to 1, indicating a 99.9% reduction relative to the normal operating levels. At this point, the web service was functionally unavailable, with the vast majority of requests failing.

6.2.4. Defense and Recovery Phase (Recovery)

At 16:30, the TCP SYN Cookie feature, built into the Ubuntu 24.04 operating system, was enabled to mitigate the ongoing SYN flooding attack. This mechanism affects the TCP connection establishment phase, and thus has a direct impact on the CPS metric, which in turn influences TPS due to the dependency of transactions on successful connections.
Following activation, the system began to recover. Within 15 s (i.e., by 16:30:15), TPS increased to 8578, and CPS rose to 92.3. By 16:30:45, both metrics had nearly returned to their baseline levels, with TPS reaching 14,251 and CPS at 151, indicating near-complete restoration of service.

6.3. Normalized Resilience Index

Assuming the organization’s Recovery Time Objective (RTO) is 15 min, the interval from the onset of the attack ( t d = 16:15) to t d + 2 × R T O (i.e., 16:45) was defined as the resilience analysis window. Within this 30-min interval, the normalized resilience index Ψ T P S was 0.60, that the Ψ C P S was 0.61.
These results demonstrate that the Normalized Resilience Index (NRI) provides a valid and quantifiable method for assessing cyber resilience. Furthermore, a threshold value of 0.5 can serve as a practical decision boundary, with values above 0.5 indicating that the recovery target has been met.
Figure 6 and Figure 7 present the normalized AUC results for TPS and CPS, respectively, illustrating the trajectory of system recovery toward its baseline performance levels following the SYN flooding attack.
To validate this approach, we compared the proposed NRI with the Integral Resilience Index (IRI) suggested by Dessavre et al. [40]. Table 5 summarizes the results of both indices across various RTO settings and analysis windows. As shown, the IRI values remain constant (e.g., 0.28 or 0.61) for a given analysis window, regardless of whether the system meets the recovery target. In contrast, the NRI values vary according to RTO setting, allowing a more accurate reflection of whether the organization’s RTO was satisfied. For instance, when the RTO is set to 15 min, the NRI is 0.60, indicating that the system recovered within the desired timeframe. However, when the RTO is shortened to 5 min, NRI drops to 0.13, signaling that the recovery objective was not achieved. This behavior demonstrates that the proposed NRI is more sensitive and informative in evaluating resilience performance relative to predefined organizational goals.

7. Conclusions

This study proposed a structured framework for the quantitative evaluation of cyber resilience by identifying and refining key metric selection criteria and developing a standardized methodology for their application. Drawing upon the principles of objectivity, reproducibility, scalability, practicality, and resilience representation, the framework enabled the identification of ten core quantitative metrics applicable across diverse service environments. These metrics were selected to support consistent, interpretable, and generalizable resilience assessments grounded in real-world operational contexts.
To demonstrate the practical utility of the proposed framework, we empirically validated the framework using an attack-recovery scenario focused on two metrics: Transactions Per Second (TPS) and Connections Per Second (CPS). By applying an Area Under the Curve (AUC)-based normalization method, the experiment quantified resilience performance over time. The results showed that both metrics achieved an AUC-based Normalized Resilience Index (NRI) exceeding 0.5, indicating compliance with the organization’s Recovery Time Objective (RTO) and validating the approach’s effectiveness in reflecting dynamic system recovery behavior.
Despite these promising findings, the empirical validation was limited to only two of the ten proposed metrics. Further experimentation is necessary to validate the remaining metrics across additional resilience dimensions and operational contexts. Moreover, the present study concentrated primarily on availability-related metrics. Future research should expand the framework to encompass metrics that reflect other core components of cyber resilience, including confidentiality and integrity. Finally, to enhance practical deployment, there is a need to develop an integrated resilience evaluation model that synthesizes these metrics into a unified, empirically supported assessment system adaptable to various industry domains.

Author Contributions

Conceptualization, H.C. and D.S.; methodology, H.C. and D.S.; software, J.-H.S. and H.-J.K.; validation, J.-H.S. and J.J.; formal analysis H.C. and D.S.; investigation, J.-H.S. and J.J.; resources, H.-J.K.; data curation, H.-J.K.; writing—original draft preparation, H.C. and J.-H.S.; writing—review and editing, J.J. and D.S.; visualization, H.-J.K.; supervision, H.C.; project administration, H.C.; funding acquisition, H.C. All authors have read and agreed to the published version of the manuscript.

Funding

This work was supported by Institute of Information & communications Technology Planning & Evaluation (IITP) grant funded by the Korea government (MSIT) (RS-2024-00439139, Development of a Cyber Crisis Response and Resilience Test Evaluation Systems).

Data Availability Statement

The data presented in this study are available on request from the corresponding author.

Conflicts of Interest

The authors declare no conflict of interest.

References

  1. Peisert, S.; Schneier, B.; Okhravi, H.; Massacci, F.; Benzel, T.; Landwehr, C.; Michael, J.B. Perspectives on the SolarWinds Incident. IEEE Secur. Priv. 2021, 19, 7–13. [Google Scholar] [CrossRef]
  2. Beerman, J.; Berent, D.; Falter, Z.; Bhunia, S. A Review of Colonial Pipeline Ransomware Attack. In Proceedings of the 2023 IEEE/ACM 23rd International Symposium on Cluster, Cloud and Internet Computing Workshops (CCGridW), Brisbane, Australia, 8–15 May 2023; IEEE: Piscataway, NJ, USA, 2023; pp. 8–15. [Google Scholar] [CrossRef]
  3. UNECE Task Force on Digitalization in Energy. Case Study “Cyber Resilience of Critical Energy Infrastructure”. 2023. Available online: https://unece.org/sites/default/files/2023-12/Pipeline_Cyberattack_case.study_.2023_rev.2_0.pdf (accessed on 3 June 2025).
  4. GovInsider. South Korea’s 56 Hours of Paralysis Is a Cyber Resilience Cautionary Tale. Available online: https://govinsider.asia/intl-en/article/south-koreas-56-hours-of-paralysis-is-a-cyber-resilience-cautionary-tale (accessed on 3 June 2025).
  5. Abdullah, F. Social and Ethical Implications of the 2024 CrowdStrike Vulnerability: A Cybersecurity Case Study; University of North Texas: Denton, TX, USA, 2024. [Google Scholar] [CrossRef]
  6. Bodeau, D.J.; Graubart, R. Cyber Resiliency Engineering Framework; MITRE Technical Report MTR110237; MITRE Corporation: Bedford, MA, USA, 2011. [Google Scholar]
  7. Yodo, N.; Wang, P. Engineering Resilience Quantification and System Design Implications: A Literature Survey. J. Mech. Des. 2016, 138, 111408. [Google Scholar] [CrossRef]
  8. Cong, X.; Zhu, H.; Cui, W.; Zhao, G.; Yu, Z. Critical Observability of Stochastic Discrete Event Systems Under Intermittent Loss of Observations. Mathematics 2025, 13, 1426. [Google Scholar] [CrossRef]
  9. Lin, I.C.; Ruan, J.Y.; Chang, C.C.; Chang, C.C.; Wang, C.T. A Cybersecurity Detection Platform Integrating IOTA DLT and IPFS for Vulnerability Management. Electronics 2025, 14, 1929. [Google Scholar] [CrossRef]
  10. Kim, C.; Son, S.; Park, Y. A Privacy-Preserving Authentication Scheme Using PUF and Biometrics for IoT-Enabled Smart Cities. Electronics 2025, 14, 1953. [Google Scholar] [CrossRef]
  11. Song, T.; Qiao, Y.; He, Y.; Wu, N.; Li, Z.; Liu, B. Dual-Arm Cluster Tool Scheduling for Reentrant Wafer Flows. Electronics 2023, 12, 2411. [Google Scholar] [CrossRef]
  12. The White House. National Cybersecurity Strategy. 2023. Available online: https://bidenwhitehouse.archives.gov/wp-content/uploads/2023/03/National-Cybersecurity-Strategy-2023.pdf (accessed on 3 June 2025).
  13. European Commission. Proposal for a Regulation of the European Parliament and of the Council on Horizontal Cybersecurity Requirements for Products with Digital Elements and Amending Regulation (EU) 2019/1020 (COM(2022) 454 Final, 2022/0272(COD)). 2022. Available online: https://eur-lex.europa.eu/legal-content/EN/TXT/?uri=CELEX%3A52022PC0454 (accessed on 3 June 2025).
  14. Cabinet Office. National Cyber Strategy 2022. 2021. Available online: https://www.gov.uk/government/publications/national-cyber-strategy-2022 (accessed on 3 June 2025).
  15. National Center of Incident Readiness and Strategy for Cybersecurity (NISC). Cybersecurity Strategy. 2021. Available online: https://www.nisc.go.jp/eng/pdf/cs-senryaku2021-en.pdf (accessed on 3 June 2025).
  16. National Institute of Standards and Technology. The NIST Cybersecurity Framework (CSF) Version 2.0; NIST: Washington, DC, USA, 2024. [CrossRef]
  17. World Economic Forum. The Cyber Resilience Index: Advancing Organizational Cyber Resilience; World Economic Forum: Geneva, Switzerland, 2022; Available online: https://www.weforum.org/publications/the-cyber-resilience-index-advancing-organizational-cyber-resilience/ (accessed on 3 June 2025).
  18. Ross, R.; Pillitteri, V.; Graubart, R.; Bodeau, D.; McQuaid, R. NIST Special Publication 800-160 Volume 2: Developing Cyber Resilient Systems: A Systems Security Engineering Approach; NIST: Gaithersburg, MD, USA, 2019. [Google Scholar] [CrossRef]
  19. Ministry of Science and ICT. 2024 Telecommunications Service Coverage Inspection and Quality Evaluation Results; Ministry of Science and ICT: Seoul, Republic of Korea, 2024. [Google Scholar]
  20. Oriol, M.; Marco, J.; Franch, X. Quality Models for Web Services: A Systematic Mapping. Inf. Softw. Technol. 2014, 56, 1167–1182. [Google Scholar] [CrossRef]
  21. AlHidaifi, S.M.; Asghar, M.R.; Ansari, I.S. Towards a Cyber Resilience Quantification Framework (CRQF) for IT Infrastructure. Comput. Netw. 2024, 247, 110446. [Google Scholar] [CrossRef]
  22. Weisman, M.J.; Kott, A.; Ellis, J.E.; Murphy, B.J.; Parker, T.W.; Smith, S.; Vandekerckhove, J. Quantitative Measurement of Cyber Resilience: Modeling and Experimentation. In Proceedings of the 2023 ACM Workshop on Secure and Trustworthy Cyber-Physical Systems (SaT-CPS’23), New York, NY, USA, 15–17 October 2023; p. 3. [Google Scholar] [CrossRef]
  23. Llansó, T.; McNeil, M. Towards an Organizationally-Relevant Quantification of Cyber Resilience. In Proceedings of the 54th Hawaii International Conference on System Sciences, Maui, HI, USA, 5–8 January 2021; pp. 7065–7074. [Google Scholar] [CrossRef]
  24. Bodeau, D.J.; Graubart, R.D.; McQuaid, R.M.; Woodill, J. Cyber Resiliency Metrics, Measures of Effectiveness, and Scoring: Enabling Systems Engineers and Program Managers to Select the Most Useful Assessment Methods; MITRE Technical Report; MITRE Corporation: Bedford, MA, USA, 2018. [Google Scholar]
  25. Kent, K.; Souppaya, M.; Johnson, J.; Dempsey, K. NIST Special Publication 800-55 Revision 1: Performance Measurement Guide for Information Security; NIST: Gaithersburg, MD, USA, 2008. [Google Scholar] [CrossRef]
  26. ISO/IEC 27004:2016; Information Security Management—Monitoring, Measurement, Analysis and Evaluation, 2nd ed. International Organization for Standardization: Geneva, Switzerland, 2016.
  27. Bruneau, M.; Chang, S.E.; Eguchi, R.T.; Lee, G.C.; O’Rourke, T.D.; Reinhorn, A.M.; Shinozuka, M.; Tierney, K.; Wallace, W.A.; von Winterfeldt, D. A Framework to Quantitatively Assess and Enhance the Seismic Resilience of Communities. Earthq. Spectra 2003, 19, 733–752. [Google Scholar] [CrossRef]
  28. Murino, G.; Armando, A.; Tacchella, A. Resilience of Cyber-Physical Systems: An Experimental Appraisal of Quantitative Measures. In Proceedings of the 2019 11th International Conference on Cyber Conflict (CyCon), Tallinn, Estonia, 22–24 May 2019; IEEE: Piscataway, NJ, USA, 2019; Volume 900, pp. 1–19. [Google Scholar] [CrossRef]
  29. Haque, M.A.; De Teyou, G.K.; Shetty, S.; Krishnappa, B. Cyber Resilience Framework for Industrial Control Systems: Concepts, Metrics, and Insights. In Proceedings of the IEEE International Conference on Intelligence and Security Informatics (ISI), Miami, FL, USA, 21–23 September 2018; pp. 25–30. [Google Scholar] [CrossRef]
  30. Bodeau, D.; Graubart, R. Cyber Resiliency Design Principles; MITRE Technical Report MTR170001; MITRE Corporation: Bedford, MA, USA, 2017. [Google Scholar]
  31. Lee, C.Y.; Chen, B.S. Mutually-Exclusive-and-Collectively-Exhaustive Feature Selection Scheme. Appl. Soft Comput. 2018, 68, 961–971. [Google Scholar] [CrossRef]
  32. MITRE Corporation. MITRE ATT&CK Framework. 2023. Available online: https://attack.mitre.org/ (accessed on 3 June 2025).
  33. Kim, S.J.; Kim, T.-S. Analysis on ISMS Certification and Organizational Characteristics Based on Information Security Disclosure Data. Inf. Syst. Rev. 2023, 25, 205–231. [Google Scholar] [CrossRef]
  34. Sahasrabudhe, M.; Panwar, M.; Chaudhari, S. Application performance monitoring and prediction. In Proceedings of the 2013 IEEE International Conference on Signal Processing, Computing and Control (ISPCC), Solan, India, 26–28 September 2013; IEEE: Piscataway, NJ, USA, 2013; pp. 1–6. [Google Scholar]
  35. Tuyishime, E.; Balan, T.C.; Cotfas, P.A.; Cotfas, D.T.; Rekeraho, A. Enhancing cloud security—Proactive threat monitoring and detection using a siem-based approach. Appl. Sci. 2023, 13, 12359. [Google Scholar] [CrossRef]
  36. IETF. RFC 5481: TCP Loss Probing; RFC Editor: Fremont, CA, USA, 2009; Available online: https://datatracker.ietf.org/doc/html/rfc5481 (accessed on 3 June 2025).
  37. IETF. RFC 2330: Framework for IP Performance Metrics; RFC Editor: Fremont, CA, USA, 1998; Available online: https://www.rfc-editor.org/rfc/rfc2330.html (accessed on 3 June 2025).
  38. Ju, M.; Liu, Y.; Zhou, F.; Xiao, S. Disaster-Resilient and Distance-Adaptive Services Provisioning in Elastic Optical Inter-Data Center Networks. J. Lightwave Technol. 2022, 40, 4064–4077. [Google Scholar] [CrossRef]
  39. ETSI. 101 329 V2.1.1: Telecommunications and Internet Protocol Harmonization Over Networks (TIPHON); ETSI: Sophia Antipolis, France, 1999. [Google Scholar]
  40. Dessavre, D.G.; Ramirez-Marquez, J.E.; Barker, K. Multidimensional Approach to Complex System Resilience Analysis. Reliab. Eng. Syst. Saf. 2016, 149, 34–43. [Google Scholar] [CrossRef]
  41. Mrhrifat. Glozzome. GitHub. 2025. Available online: https://github.com/mrhrifat/glozzome (accessed on 3 June 2025).
  42. IETF. RFC 4987: TCP SYN Flooding Attacks and Common Mitigations; RFC Editor: Fremont, CA, USA, 2007; Available online: https://datatracker.ietf.org/doc/html/rfc4987 (accessed on 3 June 2025).
  43. Rahiminejad, A.; Plotnek, J.; Atallah, R.; Dubois, M.A.; Malatrait, D.; Ghafouri, M.; Mohammadi, A.; Debbabi, M. A resilience-based recovery scheme for smart grid restoration following cyberattacks to substations. Int. J. Electr. Power Energy Syst. 2023, 145, 108610. [Google Scholar] [CrossRef]
Figure 1. Weisman’s resilience graph [22]. The blue dashed line represents the normal level of functionality, and the orange curve indicates the actual functionality over time during and after a cyber-attack.
Electronics 14 02465 g001
Figure 2. Metrics Selection Framework: The framework begins with the identification of target services for resilience evaluation, followed by the generation of candidate metrics tailored to each service type. Each candidate is then assessed against five core selection criteria—objectivity, reproducibility, scalability, practicality, and resilience representation. Metrics that satisfy all five criteria are further evaluated using the Mutual Exclusivity (ME) principle to eliminate semantic and functional overlaps. Non-redundant metrics that meet all requirements are selected as final metrics. If no metric fully satisfies the criteria, existing performance metrics in current operational use may be considered. If suitable metrics are still lacking, the Collective Exhaustiveness (CE) principle is applied to ensure that all critical resilience aspects are adequately covered for the given service type. This stepwise approach ensures both methodological rigor and comprehensive domain applicability in the construction of cyber resilience evaluation systems.
Electronics 14 02465 g002
Figure 3. Service Classification by ISMS-P Certification Scope.
Electronics 14 02465 g003
Figure 4. AUC-based evaluation graph proposed in this study. The time at which a disruptive event occurs in the system is defined as t d . The RTO (Recovery Time Objective) represents the organization’s target recovery time, and resilience is measured by calculating the AUC from t d to t d + 2 × RTO.
Electronics 14 02465 g004
Figure 5. Experimental Network Configuration. To monitor the web server’s performance during the attack, we transmitted its status information to Prometheus using the Nginx-exporter, and used Grafana to visualize and analyze the collected data in detail. The experiment was conducted on the Glozzome website, where the wrk tool was used to generate approximately 14,000 pps of normal traffic. Subsequently, we used the hping3 tool to launch a SYN flooding attack against the Glozzome website, disrupting the server’s ability to maintain connections and preventing it from handling normal traffic.
Electronics 14 02465 g005
Figure 6. TPS Metrics in WEB Service. During the experiment, we aimed to demonstrate that the web server’s TPS (Transaction Per Second)—chosen alongside the attack PC’s PPS as a quantitative metric—is a suitable metric of cyber resilience. As the attack PC’s PPS increased, the web server’s TPS fell, reflecting performance degradation due to the attack (detection). When the server’s SYN Cookie feature was enabled, its TPS rose, reflecting the server’s response to the attack (response). Afterwards, the TPS returned to about 14,000, indicating that the server had stabilized (recovery). The pink-shaded region represents the duration of the TCP SYN flooding attack, during which TPS behavior was analyzed.
Electronics 14 02465 g006
Figure 7. CPS Metrics in WEB Service. During the experiment, we aimed to demonstrate that the web server’s CPS (Connection Per Second)—chosen alongside the attack PC’s PPS as a quantitative metric—is a suitable metric of cyber resilience. As the attack PC’s PPS increased, the web server’s CPS fell, reflecting performance degradation due to the attack (detection). When the server’s SYN Cookie feature was enabled, its CPS rose, reflecting the server’s response to the attack (response). Afterwards, the CPS returned to about 140, indicating that the server had stabilized (recovery). The pink-shaded region represents the duration of the TCP SYN flooding attack, during which CPS behavior was analyzed.
Electronics 14 02465 g007
Table 1. Classification of Services and Key Resilience Requirements.
Service TypeClassification CriteriaKey Resilience Requirements
App/Web ServicePublic Portals, Content Services, Communities, ERPFast response and page loading, Scalability, Data integrity
Online RetailE-commerce, Payment Systems, Logistics Integration PlatformsService availability, Transaction integrity and reliability, Prompt response, Scalability, Security
Academic ServiceLMS, Academic Administration, Examination SystemsConcurrent user handling, Stable performance, Data accuracy/integrity
IDC/CloudIaaS, PaaS, CDN, DNS, NMSAutomatic fault recovery and prompt restoration, Network quality assurance, Scalability, Security
Digital asset serviceBlockchain Exchange, Smart Contracts, Wallet ServiceTransaction integrity and consistency, Prompt transaction processing, Scalability, Security
FinanceInternet Banking, Card Payments, Securities Trading, Insurance InformationData integrity/accuracy, Low latency and stable response, Security, Prompt recovery
Medical ServiceEMR, Telemedicine, HISData integrity/accuracy, Security, Real-time performance, Prompt fault recovery
Table 2. Quantitative Metrics Candidates by Service Type. “O” denotes applicability to each service domain.
No. App/Web ServiceOnline RetailAcademic ServiceIDC/CloudDigital Asset ServiceFinanceMedical Service
1Connection Success RateOOO
2CPSO OOO
3Latency OOOO
4ThroughputO O
5DataLossRateOOOOOOO
6AuthenticationOOO OOO
7TPSOOOOOOO
8CapacityOOOO
9Response TimeOOOO OO
10MTTROOOOOOO
11CC OOOO
12JitterO OO O
13Packet Loss O O
14End-to-End Delay O
15Provisioning Time O
16Failure Detection Time O OOOO
17Page Load TimeOOO O
18Purchase Completion Rate O
19Test Submission Success O
Table 3. Final Cyber Resilience Quantitative Metrics Selection Results. “O” indicates that the metric satisfies the given selection criterion; “△” indicates partial or conditional satisfaction; “X” indicates that the criterion is not satisfied. The “Selected” column shows metrics chosen for inclusion in the final set.
No. ObjectivityReproducibilityScalabilityPracticalityResilience RepresentationMEDuplicatedSelected
1Connection Success RateOOOOXCPS
2CPSOOOOOXCPSO
3LatencyOOOOXResponse Time
4ThroughputOOOOOXThroughputO
5DataLossRateOOXPacket Loss Rate
6AuthenticationOOOOOO-O
7TPSOOOOOXTPSO
8CapacityXXXXXXThroughput
9Response TimeOOOOOXResponse TimeO
10MTTROOOOOOMTTRO
11CCOOOOOO-O
12JitterXXOXResponse Time
13Packet Loss RateOOOOXPacket Loss RateO
14End-to-End DelayOOOOXResponse Time
15Provisioning TimeOOOOOOMTTRO
16Failure Detection TimeOOOOOO-O
17Page Load TimeOOOOXResponse Time
18Purchase Completion RateOOOOXTPS
19Test Submission SuccessOOXTPS
Table 4. Quantitative Metrics Definition and Formula.
No. DuplicatedFormulaUnit
1Failure Detection TimeTime elapsed from the occurrence of a system failure until it is detected.Detection Time − Failure Occurrence Timesec
2Packet Loss RateThe ratio of lost packets to the total packets transmitted over the network.((Number of Transmitted Packets − Number of Received Packets)/Number of Transmitted Packets) × 100%
3CPSThe number of new connections that a system or device (e.g., load balancer) can establish per second.Total Number of Connections/Time (seconds)connections/s
4Response TimeThe total time from when the client sends a request to when it receives a response from the server.Response Received Time − Request Sent Timems
5ThroughputThe amount of data successfully transmitted or processed through the system over a specified period, measured in bits per second.Data Transferred/Timebps
6AuthenticationThe ratio of successful authentications (logins) without error or delay to the total number of authentication attempts.((Number of Successful Authentication Attempts/Total Number of Authentication Attempts) × 100)%
7TPSThe number of transactions the system can process per second, indicating the transactions executed within a given time interval.Total Number of Transactions/Time (seconds)requests/s
8MTTRMean Time to Recovery is defined as the average time required to restore the system to its pre-failure (normal operating) state following a system failure.Total Recovery Time/Number of Failurestime
9CCThe number of active connections (sessions) the system can maintain concurrently.Number of Concurrent Sessionscnt
10Provisioning TimeAn metrics reflecting how quickly and completely a virtual machine (VM) in a clustered environment recovers after a failure.((Number of Recovered Resources/Number of Resources Affected by the Failure) × 100)%
Table 5. IRI vs. NRI Comparison Across Different RTO and Analysis Windows.
t 0 t d T * RTOIRI (TPS)NRI (TPS)
16:1516:17:4516:315 min0.280.13
16:1516:17:4516:3110 min0.280.41
16:1516:17:4516:3115 min0.280.60
16:1516:17:4516:3120 min0.280.71
16:1516:17:4516:455 min0.610.13
16:1516:17:4516:4510 min0.610.41
16:1516:17:4516:4515 min0.610.60
16:1516:17:4516:4520 min0.610.71
Disclaimer/Publisher’s Note: The statements, opinions and data contained in all publications are solely those of the individual author(s) and contributor(s) and not of MDPI and/or the editor(s). MDPI and/or the editor(s) disclaim responsibility for any injury to people or property resulting from any ideas, methods, instructions or products referred to in the content.

