Article

Optimizing an Urban Water Infrastructure Through a Smart Water Network Management System

by
Evangelos Ntousakis
,
Konstantinos Loukakis
,
Evgenia Petrou
,
Dimitris Ipsakis
and
Spiros Papaefthimiou
*
School of Production Engineering & Management, Technical University of Crete, 73100 Chania, Greece
*
Author to whom correspondence should be addressed.
Electronics 2025, 14(12), 2455; https://doi.org/10.3390/electronics14122455
Submission received: 6 May 2025 / Revised: 10 June 2025 / Accepted: 12 June 2025 / Published: 17 June 2025

Abstract

Water, an essential asset for life and growth, is under growing pressure due to climate change, overpopulation, pollution, and industrialization. At the same time, water distribution within cities relies on piping networks that are over 30 years old and thereby prone to leaks, cracking, and losses. Taking this into account, non-revenue water (i.e., water that is distributed to homes and facilities but not returning revenues) is estimated at almost 50%. To this end, intelligent water management via computational advanced tools is required in order to optimize water usage, to mitigate losses, and, more importantly, to ensure sustainability. To address this issue, a case study was developed in this paper, following a step-by-step methodology for the city of Heraklion, Greece, in order to introduce an intelligent water management system that integrates advanced technologies into the aging water distribution infrastructure. The first step involved the digitalization of the network’s spatial data using geographic information systems (GIS), aiming at enhancing the accuracy and accessibility of water asset mapping. This methodology allowed for the creation of a framework that formed a “digital twin”, facilitating real-time analysis and effective water management. Digital twins were developed upon real-time data, validated models, or a combination of the above in order to accurately capture, simulate, and predict the operation of the real system/process, such as water distribution networks. The next step involved the incorporation of a hydraulic simulation and modeling tool that was able to analyze and calculate accurate water flow parameters (e.g., velocity, flowrate), pressure distributions, and potential inefficiencies within the network (e.g., loss of mass balance in/out of the district metered areas). This combination provided a comprehensive overview of the water system’s functionality, fostering decision-making and operational adjustments. Lastly, automatic meter reading (AMR) devices could then provide real-time data on water consumption and pressure throughout the network. These smart water meters enabled continuous monitoring and recording of anomaly detections and allowed for enhanced control over water distribution. All of the above were implemented and depicted in a web-based environment that allows users to detect water meters, check water consumption within specific time-periods, and perform real-time simulations of the implemented water network.

1. Introduction

1.1. Background and Objective

Water is a vital yet limited resource that requires efficient management strategies to minimize waste and ensure sustainability. A major challenge in water distribution systems is the high percentage of non-revenue water (NRW), i.e., water that is consumed but not invoiced. In several regions, NRW may account for nearly 50% of the system input volume, highlighting the urgent need for modern solutions to optimize usage and mitigate losses [1,2].
The main reasons for water losses include physical losses, commercial losses, unbilled authorized consumption, or even unauthorized consumption. Physical losses are typically due to leaks, pipe cracking, and aging infrastructure. Commercial losses result from faulty water meters, illegal connections, and billing errors. Unbilled authorized consumption accounts for firefighting, municipal services, and system maintenance [3].
The European Union has developed a series of strategies and directives that aim towards the preservation of water, the tackling of droughting periods, and, eventually, the establishment of long-term water management. The Water Framework Directive (WFD)—Directive 2000/60/EC [4] focuses, among others, on ensuring that there is enough water to support wildlife and human needs. A key objective of the above directive requires member states to report individual river basin management plans and programs of measures in order to restore water bodies in a good status (in terms of chemical substances, quantities, provision, environmental protection, etc.). Furthermore, monitoring the network for potable water, water quality, water safety plans, etc., conforms to the Drinking Water Directive 98/83/EC, as amended by Directive 2015/1787/EC.
In Greece, this challenge in water distribution networks is particularly pronounced due to aging infrastructure and lack of essential monitoring technologies, such as pressure and flow sensors, data recording, and intelligent telemetric networks. These shortcomings lead to substantial resource losses, including water, energy, and operational labor [5]. Table 1 shows an overview of costs related to NRW per region around the world. As can be seen, around USD 40 million (10% of that is attributed only to Europe) is lost due to the faults in water management systems.
Regarding the current status of water management for the studied region of Crete in Greece, it has been found that recurring drought phenomena, degradation of the subsoil, and the over-extraction of groundwater put pressure on local authorities for the efficient management of resources. In 2023, rainfall dropped to just 40% of the average, and early 2024 showed similar low precipitation levels. At the same time, average temperatures have risen by 0.5 °C, compared to the 1991–2020 baseline. The combination of reduced water availability, rising temperatures, and advancing desertification clearly indicates that the climate crisis is already impacting the island of Crete [6]. Additionally, potable water quality is of the highest importance and is ensured via costly pre- and post-treatment processes in order to meet regulatory standards. The Aposelemis water treatment plant that serves Heraklion and other Cretan cities especially incorporates advanced treatment technologies, such as pre-ozonation, coagulation/sedimentation, sand filtration, post-chlorination, and clean water storage for a daily capacity of more than 100,000 m3 [7].
To address the aforementioned challenges, the present study proposes the implementation of an integrated intelligent water network management system which incorporates telemetry sensors and smart water meters. This advanced system is able to monitor real-time data with a frequency of minutes (e.g., every 15 min) while employing a digital twin model to simulate and analyze key operational parameters, such as pressures, flow rates, and potential leakages. However, it is highlighted that constant monitoring wears on the sensitive electronic units; therefore, data recordings at 6 h intervals are more practical. By using open-source software for geographic information systems (i.e., QGIS 3.28.3) and advanced hydraulic modeling (i.e., EPANET 2.2), the approach presented in this study allows for a more precise detection of inefficiencies, predictive maintenance needs, and optimized resource allocation. Both software tools have advanced capabilities that allow users to add features to their case studies and end up with a realistic representation of water networks. Ultimately, the integration of smart monitoring and digital twin technologies presents an innovative practice to enhance urban water infrastructure resilience and sustainability. The application of the proposed cutting-edge techniques represents a significant leap towards sustainable water management for an antiquated infrastructure, reducing water losses and ensuring better resource allocation.

1.2. Literature Review

To begin with, Ramos et al. [8] presented a comprehensive framework for the development and deployment of smart water grids (SWGs) integrated with digital twin technology, aiming to improve the overall performance, sustainability, and resilience of water distribution systems. Their research emphasized the digital transformation of water utilities, wherein real-time data from sensors and telemetry systems were fed into hydraulic simulation models—most notably EPANET—to create dynamic digital twins. These models mirrored the physical state of the infrastructure and allowed for predictive analytics, scenario testing, and real-time decision-making. The study also explored how this integration supported objectives such as energy efficiency, leakage detection, asset management, and system optimization, placing special emphasis on the role of digital innovation in smart water governance.
Similarly, the study by Brahmbhatt, Maheshwari, and Gudi [9] delved into the development of a decision support system (DSS) powered by digital twin technology for leak localization and water quality control in large-scale water distribution networks. Their research introduced a multi-layered architecture that fused physical sensors, cloud-based computation, and simulation tools to generate actionable insights. Using EPANET for hydraulic modeling, the system processed real-time telemetry data to simulate network behavior and pinpoint abnormal conditions. A key contribution of their work lay in the intelligent prioritization of leak zones using machine learning algorithms, which enhanced the accuracy and timeliness of interventions. In addition to leak detection, the authors addressed water quality monitoring by modeling chlorine decay and contamination risks, positioning their system as a holistic solution for smart water management.
Expanding the discussion to practical leak management methodologies, Farley and Trow [2] provided a foundational guide for the assessment, monitoring, and control of water losses in distribution networks. Their work has become a cornerstone reference in the field of non-revenue water (NRW) assessment, presenting a structured approach based on the IWA water balance method. The book detailed strategies such as minimum night flow analysis, step testing, and active leakage control (ALC), supported by technologies including acoustic correlators, pressure loggers, and smart meters. This study also emphasized the importance of establishing district metered areas (DMAs) for localized monitoring and quantification of losses. Their practical orientation made the methodology applicable in both developed and developing contexts, reinforcing its status as a go-to reference for water utilities worldwide.
In a complementary vein, Farah and Shahrour [10] presented a thorough review of existing water leak detection technologies, highlighting the challenges posed by aging infrastructure, increasing demand, and climate-related stressors. Their review categorized detection techniques into passive, active, and data-driven methods, including acoustic sensing, pressure transients, satellite-based imaging, and AI-based anomaly detection. Moreover, they pointed out current limitations, such as high installation costs, scalability issues, and data uncertainty, while also suggesting future research directions, including the development of autonomous detection platforms and hybrid modeling approaches that combine physics-based and machine learning models.
Focusing specifically on non-revenue water (NRW), González-Gómez, García-Rubio, and Guardiola [3] conducted an in-depth analysis of the economic and technical aspects of water losses in urban environments. Their study outlined the institutional, financial, and infrastructural causes of NRW and examined its impacts on water utility performance and sustainability. The authors proposed various mitigation strategies, including water auditing, hydraulic modeling, and performance benchmarking, all of which rely on accurate metering and network partitioning. The use of EPANET was emphasized for simulating pressure and flow dynamics, which aided in identifying high-risk zones and validating intervention outcomes. Their findings stressed the need for a multidisciplinary approach, combining engineering solutions with governance and policy reforms.
Giudicianni et al. [11] explored the integration of smart technologies for energy-efficient operations and leakage control in modern water infrastructures. Their study proposed a model that combined IoT devices, sensor networks, and digital twins to create a cyber–physical system capable of real-time monitoring and control. By incorporating machine learning algorithms, their system simultaneously identified energy inefficiencies and potential leak events that reduced operational costs and enhanced sustainability. The research aligns conceptually with Ramos et al. [8], reinforcing the idea that smart water grids serve as platforms for convergence between water resource management, energy efficiency, and digital innovation.
Recent studies emphasize several aspects that refer to (i) the critical role of district metered area (DMA) monitoring, (ii) platforms that enhance active leakage control (ALC) through integration with the water balance method (WBM), and (iii) the development of standardized frameworks for quantifying water losses. By segmenting the distribution network into manageable zones, DMAs enable localized application of the WBM, allowing utilities to distinguish between authorized consumption and apparent and real losses. Virtual DMAs, as presented by Xylem [12], use existing sensor infrastructure to reduce costs and improve scalability. Kowalski and Suchorab [13] further showed that optimized sensor placement within DMAs significantly increased the sensitivity of leakage detection. Mobile DMAs were introduced for temporary WBM assessments, especially using minimum night flow analysis [14]. Hydraulic modeling tools like WaterGEMS support accurate DMA design, aiding in data collection for WBM calculations [15], while deep learning approaches enhance anomaly detection and demand forecasting across correlated DMAs [16]. Together, these approaches illustrate the growing integration of data-driven DMA monitoring with water balance techniques to support efficient and proactive leakage control.

2. Methodology and Computational Framework

2.1. Case Study Area

This study focused on the water distribution network in the historic center (Old Town) of Heraklion, Crete. Spanning about 1.4 km2, it encompasses 5600 water meters and serves more than 10,000 permanent residents. Moreover, during peak season, the population increases to up to 16,000, leading, unavoidably, to a corresponding rise in water consumption. According to data provided by the Heraklion Water Supply and Sewerage Company (in Greek, the acronym is ∆EYAH, and we will use the Latin acronym DEYAH throughout this paper), annual water consumption reaches 600,000 m3, showing a consistent upward trend.
The network operates on a gravity-based system, which consists of a single reservoir and two storage tanks. Water is drawn from the “Aposelemi” reservoir with supplementary supply from 10 boreholes scattered throughout the city’s outskirts. The “Aposelemi” dam has an overall storage capacity of 27.1 million m3, with a peak reservoir level of 221 m, and is replenished by the “Malia” and “Tylisos” springs. Each storage tank holds 6000 m3, has a height of 6 m, and is located at elevations of 70 m and 102 m, respectively.
The water distribution infrastructure consists of pipelines with diameters ranging from 9 to 60 cm, made from materials such as polyvinyl chloride (PVC), high-density polyethylene (HDPE), and cement-lined cast iron. The total length of the network spans approximately 70 km, ensuring the supply of potable water to both local residents and its rising seasonal population. Figure 1 below illustrates the location of the studied water network and the historic town’s premises.

2.2. Water Network Digitalization in QGIS

The first major contribution of this study was the digitalization of the water distribution network’s spatial data, utilizing geographic information systems (GIS) to enhance the precision and accessibility of water asset mapping. This process involved the recording of all the technical characteristics of the network, including pipe length, diameter, material type, and the locations of water meters, tanks, and reservoirs.
To achieve this, geographical data obtained from the Heraklion Water Supply and Sewerage Company were processed using QGIS, a popular open-source GIS software [8,17]. Specifically, the most recent version “QGIS 3.28.3” was used for mapping and analyzing network assets. Additionally, a number of useful plug-ins were integrated into the software and could be found in the software features as “Quick Map Services” and “QWater”. The “Quick Map Services” plugin for QGIS is developed and maintained by NextGIS, a company specialized in geospatial software development and solutions. This plugin provides users with streamlined access to a wide range of basemaps and geospatial web services, including those from Open Street Map, Google Maps, Bing Maps, Esri, and NASA. Through its integration with the Quick Map Services (QMS) catalog, it enables efficient discovery and incorporation of mapping services directly within the QGIS environment, thereby enhancing the functionality and analytical capabilities of geospatial workflows [18,19]. On the other hand, the “QWater” plugin facilitates the design and analysis of water supply networks within QGIS by integrating EPANET functionalities. It allows users to create EPANET input files, run simulations, and analyze results directly in QGIS. The plugin is based on the “GHydraulics” plugin and is available here [20,21].

Data Processing

Processing and modeling of spatial data presented multiple challenges, which were methodically tackled through the following steps:
  • Selection of network components:
    -
    Identifying the infrastructure elements under study, such as water supply pipelines, reservoirs, and storage tanks.
  • Addressing missing data:
    -
    Missing elevation data (altitude attribute) for all network point elements (i.e., nodes, tanks, reservoirs) were resolved by using a QGIS function to extract values from Google Maps. This was achieved by leveraging a “.tiff” raster data file for precise topographical referencing (Figure 2).
    -
    Gaps in data, including loss coefficients and roughness coefficients, were addressed by referencing the material properties of each network component.
  • Integration of water meter data:
    -
    Water meters were mapped and linked to their corresponding pipelines, based on factors such as proximity, orientation, and network topology.
    -
    The water meter datasets, initially created in “.xlsx” format, were converted into “.shp” (shapefile) for flawless integration into QGIS.
  • Maintaining network continuity:
    -
    Introducing nodes/junctions at pipeline intersections to preserve topological integrity and ensure the continuity of the hydraulic system.
  • Water Network Partition:
    -
    Additional nodes and junctions were introduced at pipeline intersections to maintain the topological integrity of the hydraulic model.
The digital water network in QGIS included the following layers and attributes:
  • 2 Reservoirs;
  • 2 Tanks;
  • 6041 Pipes;
  • 5781 Junctions, from which 4578 were water meters.
The systematic digitalization and data processing framework significantly improved the network visualization and analytical capabilities of the water distribution infrastructure, as shown in Figure 3.

2.3. Digital Twin of the Hydraulic Model Developed in EPANET

EPANET 2.2 is a widely used hydraulic and water quality modeling software developed by the U.S. Environmental Protection Agency (EPA) for analyzing the behavior of pressurized water distribution networks. Engineers and water resource specialists use EPANET for a number of reasons, including to design new water infrastructure, rehabilitate aging systems, improve reservoir and pump operations, reduce energy consumption, assess water quality, and develop emergency response strategies [9].
This software supports both steady-state and dynamic (extended period) simulations, regardless of the network’s size or topology. It calculates flow rates (e.g., m3/h) and water velocity (e.g., m/s) in pipes, pressure levels at nodes (e.g., bar), and water levels (e.g., m) in storage tanks. Additionally, EPANET provides water quality analysis by simulating the aging of water, tracking the transport of chemical substances, and evaluating changes in water composition over time. Its hydraulic modeling relies on the principles of mass and energy conservation. At the same time, it incorporates the relationship between head loss and flow rate while considering the specific characteristics of the pipelines.
One of the EPANET’s most valuable applications is its ability to allow for the creation of a digital twin—a virtual model replica of the actual water distribution system, based on the hydraulic modeling capabilities. More specifically, the combination of real-time data with hydraulic modeling enables the developed digital twin to enhance operational decision-making, support predictive maintenance, and boost overall system performance. The simulation framework makes it possible to detect pressure fluctuations, flow irregularities, and potential inefficiencies, allowing for proactive network management [8,17].
In this study, the hydraulic model for EPANET was built by converting the spatial data of QGIS with the “QWaters” plug-in (discussed previously). The resulting hydraulic model offered an accurate and detailed representation of the entire network, including nodes, pipes, storage tanks, reservoirs, and their associated attributes (Figure 4). To ensure accurate simulations, a number of key parameters still needed to be set within EPANET. These included nodal demand values and demand patterns, operational rules for storage tanks, and time-based settings, like simulation duration and time steps.

2.4. NRW Reduction—Leak Detection

Water supply and irrigation networks, regardless of their age, often experience water leakage issues. The timely detection of leaks within the distribution system is of critical importance due to the economic burden placed on the end user, potential service interruptions, environmental costs, and other related impacts. Consequently, there is a substantial body of research and practical experience focused on leak detection and water loss reduction methods. In the literature review conducted by E. Farah and I. Shahrour [10], these methods were classified into four categories: non-acoustic, acoustic, inline, and software-based approaches, with a detailed analysis of their respective advantages and limitations.
In this study, the dedicated web-based application (thereafter called SmartLIK) that was designed and developed to monitor and manage an intelligent water distribution network had the potential to identify and locate areas/pipes of potential leaks and alert the water network operator to act with physical detection systems.

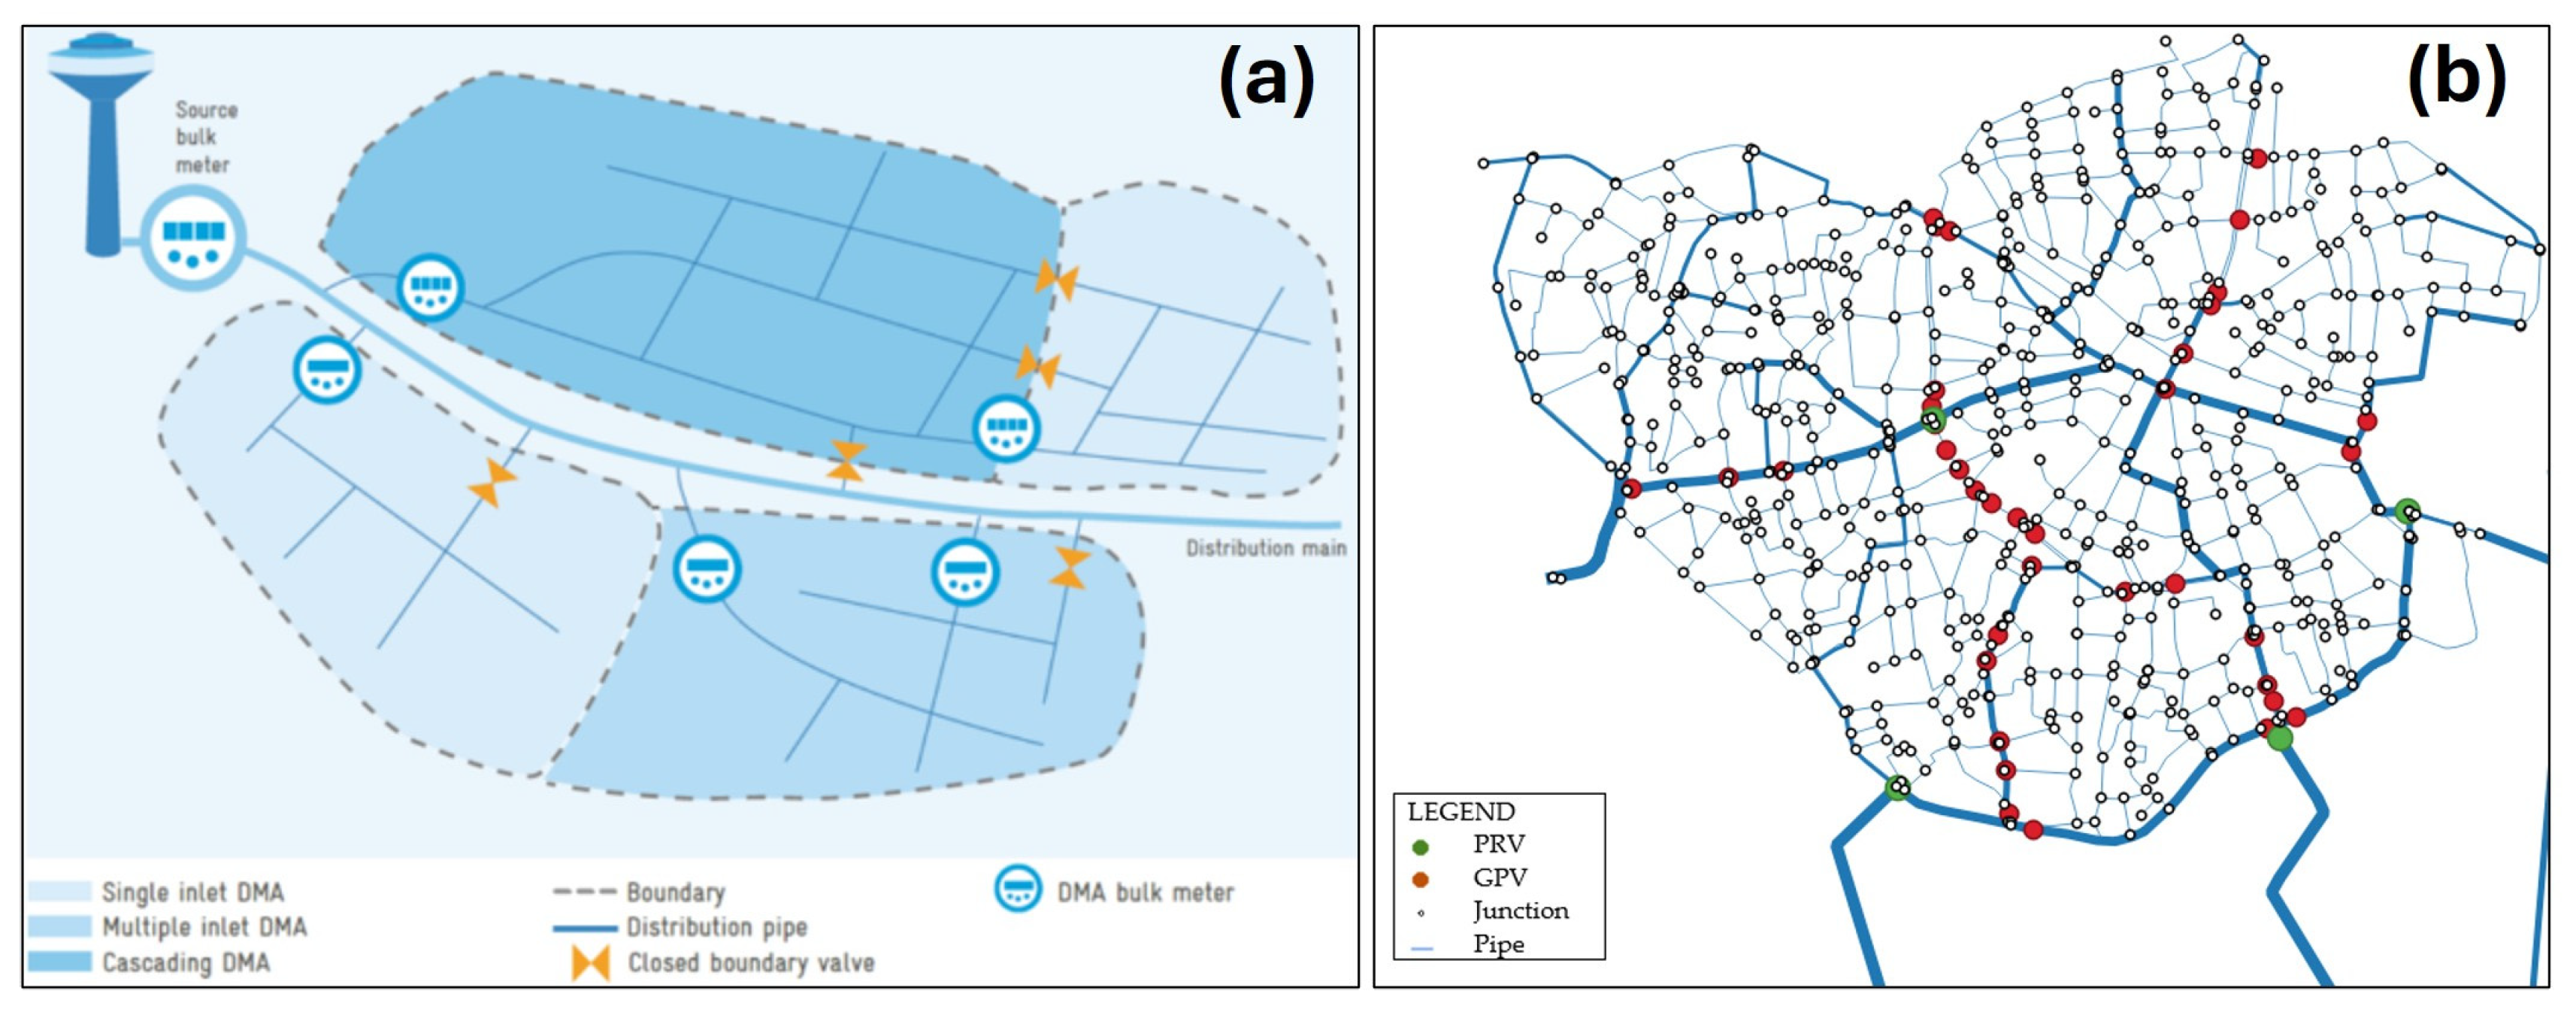
2.4.1. District Metered Areas (DMAs)

The water balance method, which falls under software-based leak detection and active leakage control (ALC), involves comparing real-time recorded inflows and outflows (i.e., consumption in volume per time) [22]. In order for this method to be effective, it is crucial to divide the network into smaller zones, typically containing between 500 and 3000 consumers. Pressure regulation at the entry point of each zone is equally important to keep pressure within the optimal range [23]. These zones, known as district metered areas (DMAs), are illustrated in Figure 5a. In Heraklion’s Old Town, the water supply network is divided into four zones, with general purpose valves (GPV) installed between the zones and pressure-reducing valves (PRV) at the inlets, as seen in Figure 5b.

2.4.2. Application of EPANET’s Trace Function for DMA Isolation

A major challenge faced during the creation of the digital twin was the task of dividing the network into smaller subnetworks (zones). In physical networks, general purpose valves (GPV) are installed to regulate flow, control pressure, isolate sections for maintenance, and prevent backflow. Since the locations of the GPVs were not included in the original QGIS dataset, they were not automatically transferred into the hydraulic model in EPANET. To overcome this limitation, a detailed manual inspection of the pipe connection between zones was necessary in order to insert the valves and thereby properly isolate each zone. This process was greatly aided by EPANET’s “Trace” function, which simulates the direction and extent of flow through the network from a specified source node. For instance, Figure 6 shows the flow path originating from a random node (node #593), which remained entirely within the boundaries of Zone 2, confirming the zoning setup and the accurate representation of the physical network’s behavior.

3. Results

3.1. Integrated System for Water Distribution Network Management

SmartLIK is an integrated web-based ecosystem suited for the intelligent management of water distribution networks, featuring multi-component elements for monitoring and control. SmartLIK incorporates the complete digital twin of the water network as a core component and processes real-time data from a telemetric network of digital water meters and sensors deployed across different areas of a water distribution network.
SmartLIK is realized in the JAVA environment. It receives as inputs the GIS map (discussed in detail in Section 2) and the EPANET simulations and displays the digital twin of the real network in an analytical online graphical environment (see Figure 7). This digital platform is able to provide important information on network parameters, such as pressures, pipeline flows, consumption, and estimated leaks. This allows the user to directly interact with the water network, identify potentially vulnerable sections of the network, and avoid operational failures and damages. As a result, water losses can be significantly reduced, and water resources are protected.
The system operates as a web-based platform that collects data, runs hydraulic simulations (via its direct connection to EPANET), and displays the digital twin of the water network through an interactive graphical user interface (GUI). The platform provides insights into critical network parameters, such as pipeline pressures, flow rates, consumption levels, and estimated leakages. Due to real-time user interaction, the system supports proactive decision-making, helping operators identify vulnerable sections of the network and implement preventive maintenance. This approach not only reduces water losses but also improves conservation.
The user enters the application via a web browser and provides the necessary login information in order to be authenticated. The main page is the live map with the DMAs in different colors (see Figure 7 for the city of Heraklion), and what the nodes (pressure or demand) and links (flow or velocity) will show can be selected. SmartLIK incorporates a series of intelligent features (see Figure 7) as it performs the hydraulic modeling of the network based on real-time or past data and depicts the results on the map via a color-based approach that indicates any abnormal parameters. Additionally, the user can select any water meter and monitor all the recorded measurements, perform a mass balance for selected DMA zones, display the water level in the tanks, or monitor parameters in pumping stations.

3.2. Leak Detection—Water Balance Method

Based on the hydraulic digital twin of the water distribution network, a leak detection and localization system was developed. This system was grounded in the analysis of water balance calculations by comparing the inflows and outflows within delineated district metered areas (DMAs), as shown in Equation (1) [23].
System Input Volume = Consumption + Leakage
The implementation of the water balance method (WBM) relies on a structured algorithm developed in “Node.js”—an open-source JavaScript runtime environment—that runs on the self-hosted work server of the integrated SmartLIK system. The algorithm begins with collecting water flow data on the system input volume (SIV), measured at the four (4) DMA inlets. Next, it calculates the total authorized consumption from the end-users’ water meters at each zone. Ultimately, the difference between the input and authorized consumption yields the total water losses. Water meter data are accessed through a web service utilizing the “HTTP GET” method and are archived in a “MySQL” database, “MariaDB”.
Once the DMA boundaries are defined as mentioned in Section 2.4.1, the algorithm/system processes synchronized real-time data from smart meters installed at both consumer endpoints and DMA inlets (see Figure 8a). At each digital water meter, the corresponding zone attribute is assigned. This offers continuous monitoring of each zone’s hydraulic balance. Through the application’s designed interface (see Figure 8b), users have the possibility to access detailed information about the water balance in each zone—including non-revenue water displayed in a structured tabular format. For each DMA, the system indicates the total demand—representing the volume of water supplied into the zone over a given period of time—as well as the total recorded consumption, which is the sum of the readings from the smart meters. These values are used to calculate both the absolute balance and the balance percentage for each zone, helping to identify significant discrepancies between water supplied and water consumed. Zones with balance percentages exceeding acceptable thresholds are flagged for further investigation, given that these discrepancies may indicate potential leaks or other issues within the distribution network. Moreover, the table inset in the following figure includes a summary row with aggregated data for the entire network, giving users a complete view of the system’s performance throughout the specified timeframe.

4. Discussion and Conclusions

This study presented the development of a step-by-step methodology and a dedicated web-based tool aiming at the intelligent management of the municipal water network of the city of Heraklion, Greece. The developed tool, called SmartLIK, integrated advanced technologies, such as the digitalization of the network’s spatial data, using QGIS and the hydraulic simulation and modeling via EPANET. In this approach, technical parameters (i.e., piping, valves, meters, tanks, pumping stations), water flow parameters (i.e., velocity, flowrate, pressure distributions, indicated consumption, water balance), and potential inefficiencies within the network were calculated and represented live on an interactive map. Furthermore, the application read real-time data (from AMR and water meters) in order to provide accurate information on water consumption and pressure throughout the network, thus allowing for continuous monitoring, immediate detection of anomalies, enhanced control, and minimization of the NRW.
The problem of the NRW in the entire DEYAH (Heraklion water network operator) network is extensive, and according to 2019 data, the NRW value reached 50.66%. At the same time, the cost of network repairs is also significant: about 3000 faults are repaired per year, and with an average repair cost of EUR 300/fault. (A total annual cost of EUR 1,000,000 is anticipated.) As indicated by DEYAH, the application of SmartLIK for one year in the specific part of Heraklion’s water network led to a significant reduction of the NRW (as depicted in Table 2) from 46.4 to 31.3%. Furthermore, real water losses were reduced by more than 100,000 m3, and losses (per connection and per pipe length) were significantly less.
The evaluation of SmartLIK is continuously improving. Its application allows for the i. diagnosis and reduction of network failures (due to continuous pressure control), ii. reduction of leaks, iii. saving of water resources and reduction of NRW, and iv. reduction of operating costs (saving of energy, man-hours, materials, etc.) and water service costs, with the possibility of reducing water tariffs for consumers.

Author Contributions

Conceptualization, S.P.; methodology, S.P., E.N., K.L., E.P. and D.I.; software, K.L., E.P. and E.N.; validation, K.L., E.N. and E.P.; data curation, K.L., E.N. and E.P.; writing—original draft preparation, E.N.; writing—review and editing, S.P. and D.I.; supervision, S.P.; project administration, S.P.; funding acquisition, S.P. All authors have read and agreed to the published version of the manuscript.

Funding

This work was funded by the project “Smart Leak detection network based on IoT technology and Knowledge” funded by Iceland, Liechtenstein, and Norway through the EEA Grants 2014–2021 (European Economic Area Financial Mechanism).

Data Availability Statement

Data are contained within the article.

Conflicts of Interest

The authors declare no conflicts of interest.

Abbreviations

The following abbreviations were used in this manuscript:
NRWNon-revenue water
WDNWater distribution network
DEYAHHeraklion Water Supply and Sewerage Company
GISGeographic information systems
AMRAutomatic meter reading
DTDigital twin
GUIGraphical user interface
DMADistrict metered area
ALCActive leakage control
GPVGeneral purpose valve
PRVPressure-reducing valve

References

  1. Liemberger, R.; Wyatt, A. Quantifying the global non-revenue water problem. Water Sci. Technol. Water Supply 2019, 19, 831–837. [Google Scholar] [CrossRef]
  2. Farley, M.; Trow, S. Losses in Water Distribution Networks: A Practitioners’ Guide to Assessment, Monitoring and Control. Water Intell. Online 2015, 4, 9781780402642. [Google Scholar] [CrossRef]
  3. González-Gómez, F.; García-Rubio, M.A.; Guardiola, J. Why is non-revenue water so high in so many cities? Int. J. Water Resour. Dev. 2011, 27, 345–360. [Google Scholar] [CrossRef]
  4. Water Framework Directive—European Commission. Available online: https://environment.ec.europa.eu/topics/water/water-framework-directive_en (accessed on 29 May 2025).
  5. Kanakoudis, V.; Tsitsifli, S.; Samaras, P.; Zouboulis, A.I. Urban Water Distribution Networks performance assessment: Comparing eight cases from Cyprus, Greece, Italy, France and Spain, located within the EU Mediterranean Basin. In Proceedings of the IPWE2013 6th International Perspective on Water Resources & the Environment, Izmir, Turkey, 7–9 January 2013. [Google Scholar]
  6. Crete Fights Droughts with New Irrigation Project. Available online: https://www.eib.org/en/stories/droughts-crete-irrigation-agriculture (accessed on 29 May 2025).
  7. Water Treatment. Available online: https://www.emvis.gr/index.php/water-treatment (accessed on 29 May 2025).
  8. Ramos, H.M.; Kuriqi, A.; Besharat, M.; Creaco, E.; Tasca, E.; Coronado-Hernández, O.E.; Pienika, R.; Iglesias-Rey, P. Smart Water Grids and Digital Twin for the Management of System Efficiency in Water Distribution Networks. Water 2023, 15, 1129. [Google Scholar] [CrossRef]
  9. Brahmbhatt, P.; Maheshwari, A.; Gudi, R.D. Digital twin assisted decision support system for quality regulation and leak localization task in large-scale water distribution networks. Digit. Chem. Eng. 2023, 9, 100127. [Google Scholar] [CrossRef]
  10. Farah, E.; Shahrour, I. Water Leak Detection: A Comprehensive Review of Methods, Challenges, and Future Directions. Water 2024, 16, 2975. [Google Scholar] [CrossRef]
  11. Giudicianni, C.; Herrera, M.; Nardo, A.d.; Adeyeye, K.; Ramos, H.M. Overview of Energy Management and Leakage Control Systems for Smart Water Grids and Digital Water. Modelling 2020, 1, 134–155. [Google Scholar] [CrossRef]
  12. Xylem. Optimizing Leak Detection with a Virtual DMA; Xylem: Washington, DC, USA, 2021. [Google Scholar]
  13. Kowalski, D.; Suchorab, P. The Impact Assessment of Water Supply DMA Formation on the Monitoring System Sensitivity. Appl. Sci. 2023, 13, 1554. [Google Scholar] [CrossRef]
  14. Jenks, B.; Papa, F.; Karney, B.W. Mobile DMA testing for leakage assessment: Perspectives from Ontario, Canada. Water Supply 2023, 23, 1843–1858. [Google Scholar] [CrossRef]
  15. Kowalska, B.; Suchorab, P.; Kowalski, D. Division of district metered areas (DMAs) in a part of water supply network using WaterGEMS (Bentley) software: A case study. Appl. Water Sci. 2022, 12, 166. [Google Scholar] [CrossRef]
  16. Malialis, K.; Mavri, N.; Vrachimis, S.G.; Kyriakou, M.S.; Eliades, D.G.; Polycarpou, M.M. Urban Water Consumption Forecasting Using Deep Learning and Correlated District Metered Areas. Available online: https://arxiv.org/pdf/2501.00158 (accessed on 29 May 2025).
  17. Deb, A.; Das, S.; Gupta, R.; Mukherjee, A. Water Distribution System Design using QGIS and EPANET. Environ. Ind. Lett. 2023, 1, 101–110. [Google Scholar] [CrossRef]
  18. QuickMapServices: Easy Basemaps in QGIS|NextGIS. Available online: https://nextgis.com/blog/quickmapservices/ (accessed on 29 May 2025).
  19. QuickMapServices—QGIS Python Plugins Repository. Available online: https://plugins.qgis.org/plugins/quick_map_services/#plugin-about (accessed on 29 May 2025).
  20. GitHub—Jorgealmerio/QWater: Hydraulic Design and Analysis of Water Supply Networks. Available online: https://github.com/jorgealmerio/QWater?utm_source=chatgpt.com (accessed on 29 May 2025).
  21. QWater—QGIS Python Plugins Repository. Available online: https://plugins.qgis.org/plugins/QWater/ (accessed on 29 May 2025).
  22. Kanakoudis, V.; Muhammetoglu, H. Urban Water Pipe Networks Management Towards Non-Revenue Water Reduction: Two Case Studies from Greece and Turkey. CLEAN—Soil. Air Water 2014, 42, 880–892. [Google Scholar] [CrossRef]
  23. Farley, M. Leakage Management and Control: Best Practices Training Manual; WHO: Geneva, Switzerland, 2001; pp. 1–98. Available online: https://iris.who.int/bitstream/handle/10665/66893/WHO_SDE_WSH_01.1_eng.pdf?sequence=1&isAllowed=y (accessed on 15 April 2025).
Figure 1. The studied water distribution network with the 4 distinctive DMAs, located at the Old Town of Heraklion, Crete, Greece.
Electronics 14 02455 g001
Figure 2. Raster data file of elevation attribute data for the water distribution network.
Electronics 14 02455 g002
Figure 3. Visualization of Heraklion historic center water distribution network in QGIS.
Electronics 14 02455 g003
Figure 4. Digital twin of the Heraklion historic center water distribution system in EPANET.
Electronics 14 02455 g004
Figure 5. (a) DMA isolation and control [11]; (b) GPV and PRV installation in WDN of Heraklion.
Electronics 14 02455 g005
Figure 6. Flow path tracing for DMA isolation with the “Trace” function in EPANET.
Electronics 14 02455 g006
Figure 7. Operating screen of SmartLIK, with detailed time series of measured values for a random water meter.
Electronics 14 02455 g007
Figure 8. (a) SmartLIK DMA visualization; (b) DMA water balance method for leak detection.
Electronics 14 02455 g008
Table 1. Overview of the cost related to NRW per region around the world [1].
RegionVolume of NRWAverage Level of NRWCost/Value of NRW
Million m3/DayBillion m3/YearL/Capita/DayBillion USD/Year
Sub-Saharan Africa14.15.2641.4
Australia and New Zealand1.00.3360.1
Caucasus and Central Asia8.02.91520.8
East Asia53.019.3426.2
Europe26.89.8503.4
Latin America and Caribbean69.125.21218.0
Middle East and Northern Africa41.215.0964.8
Pacific Islands0.50.22110.1
Russia, Ukraine, Belarus9.53.5651.1
South Asia63.423.2936.0
Southeast Asia18.46.7812.0
USA and Canada40.714.81195.7
Total346126
Table 2. Water network parameters before and after the application of the SmartLIK.
Before SmartLIKAfter SmartLIK
Incoming water1,120,000 m31,011,000 m3
Real losses362,800 m3260,490 m3
Water losses per connection168.4 m3/connection/year96.4 m3/connection/year
Water losses per pipe length9.8 m3/km/year5.6 m3/km/year
Apparent losses per connection9.04%0.5%
NRW per volume46.4%31.3%
Disclaimer/Publisher’s Note: The statements, opinions and data contained in all publications are solely those of the individual author(s) and contributor(s) and not of MDPI and/or the editor(s). MDPI and/or the editor(s) disclaim responsibility for any injury to people or property resulting from any ideas, methods, instructions or products referred to in the content.

