Article

Data Fusion-Based Joint 3D Object Detection Using Point Clouds and Images

1
School of Optoelectronic Engineering, Changchun University of Science and Technology, Changchun 130022, China
2
Zhongshan Institute, Changchun University of Science and Technology, Zhongshan 528400, China
3
PONOVO POWER CO., LTD., Beijing 101102, China
*
Author to whom correspondence should be addressed.
Electronics 2025, 14(12), 2414; https://doi.org/10.3390/electronics14122414
Submission received: 14 May 2025 / Revised: 10 June 2025 / Accepted: 12 June 2025 / Published: 13 June 2025
(This article belongs to the Special Issue Point Cloud Data Processing and Applications)

Abstract

:
Three-dimensional object detection has emerged as a focal point of increasing interest among researchers, driven by advancements in and widespread adoption of autonomous driving technologies. However, this field still faces inherent challenges in single-modal approaches that rely solely on point cloud data for 3D object detection, such as the difficulty in effectively extracting features from sparse point clouds and the lack of critical texture information in the captured representations. To overcome these limitations, we introduce PomageNet, a fusion approach that combines point cloud and image data for 3D object detection. First, initial detection results from the two different kinds of data were applied as inputs, and joint encoding was performed. The encoded joint tensor is then fed into fusion layers. In the fusion stage, multiple 1 × 1 2D convolutions are employed to extract joint high-dimensional features. To enhance feature extraction, a parallel dual-branch framework was designed, and a multidimensional joint encoding mechanism tailored to the network was proposed to better capture contextual information. Experiments show that the capacity of our model is comparable to state-of-the-art (SOTA) methods on KITTI, which was achieved by the proposed network. Results were delivered by the method in detecting small objects, a key challenge in 3D object detection. An average precision (AP) of 67.87% and 60.40% was reached on the cyclist and pedestrian splits of KITTI. Compared to CLOCs, significant improvements were achieved by PomageNet, with 1.28%, 8.40%, and 3.64% increases in the result of detection achieved on the car, cycle, and pedestrian splits of the KITTI dataset.

1. Introduction

Three-dimensional (3D) object detection technology fundamentally aims to identify and localize target objects within 3D data representations such as point clouds. Compared with 2D object detection, this approach effectively mitigates performance degradation caused by object occlusion and results in reduced sensitivity to illumination variations. However, its complexity significantly surpasses that of 2D detection due to the inherent challenges of processing sparse, unstructured 3D data. Traditional 3D detection methods are categorized into point and voxel-based approaches, with emerging image-based methods gaining recognition as the field evolves. Notable point-based frameworks include the pioneering PointNet series: PointNet [1], PointNet++ [2], and PointRCNN [3]. As one of the earliest deep learning architectures capable of directly processing raw point clouds, PointNet addresses the inherent disorderliness of point data through symmetric feature aggregation functions, enabling effective feature extraction. PointNet++ further advances this paradigm by introducing hierarchical feature learning mechanisms to capture local geometric structures at multiple scales. PointRCNN represents a 3D object detection framework that integrates a region proposal network (RPN) with point cloud processing, leveraging raw point data directly to preserve geometric fidelity and avoid information loss inherent in intermediate representations. While point-based methods demonstrate advantages in feature preservation, their computational efficiency remains constrained by the high overhead of processing unordered point sets. This limitation has driven the emergence of voxel-based approaches, which discretize point clouds into 3D voxel grids and employ convolutional neural networks for feature extraction and detection. In 2017, VoxelNet [4] pioneered voxelization of raw point clouds, achieving notable accuracy improvements through hierarchical feature learning within an end-to-end trainable architecture. Subsequently, SECOND [5] introduced sparse convolutional networks to significantly enhance computational efficiency while maintaining detection precision, effectively addressing the sparsity of 3D data. PointPillars [6], proposed in 2019, organized point clouds into vertical columnar structures and processed them as pseudo-images via two-dimensional (2D) convolutions, achieving a favorable balance between speed and accuracy. Further advancements emerged with PV-RCNN [7] in 2020, which fused point-wise and voxel-wise features through a proposal-based framework to boost performance in complex scenes. Recent innovations continue to optimize sparse data processing. In 2023, researchers from Facebook AI Research developed SparseConvNet [8], which refines sparse convolutional architectures to improve memory efficiency and point cloud representation capability. Parallel efforts produced SparseBEV [9], which employs dynamic sparse convolutions and adaptive feature sampling for efficient bird’s-eye-view (BEV) detection, demonstrating SOTA in real-time applications. These developments underscore the ongoing evolution of 3D detection paradigms toward balancing accuracy, computational efficiency, and scene adaptability. In 2024, the latest DynamicVoxelNet [10] introduced dynamic voxelization technology, which enhances robustness and detection accuracy in complex scenarios with uneven point cloud distributions through adaptive adjustment of voxel resolution. These voxel-based methods have distinct advantages in latency, average precision of detection, and the processing of complex geometric structures.
Image-based 3D detection approaches have emerged as alternative methodologies. These methods typically utilize image data as the primary input to extrapolate 3D bounding boxes, aiming to synergize the complementary advantages of multimodal data. A seminal example is Mono3D [11], proposed by Chen et al. in 2016. More recently, in 2023, Xie et al. developed M²BEV [12], a unified BEV framework that integrates multicamera image fusion. Furthermore, with the maturation of Transformer architectures, novel 3D object detection techniques incorporating transformer improvements have emerged, exemplified by FocalFormer3D [13], which adapts the Transformer paradigm for enhanced 3D perception tasks.
Single-modal object detection techniques have demonstrated remarkable performance with advancing technology, relying solely on unimodal data for 3D detection, which has been proven to exhibit inherent and unresolved limitations. For instance, point cloud-based methods often lack critical texture information inherent in images, whereas image-based approaches are significantly vulnerable to occlusion and illumination variations. Consequently, camera–LiDAR data fusion—integrating image and point cloud modalities—has increasingly become a research priority. The fusion of point cloud and image data represents a pivotal form of multi-sensor integration, aiming to enhance the accuracy and reliability of scene understanding by synergizing complementary characteristics from heterogeneous modalities.
Figure 1 shows a ground robot equipped with a LiDAR and a camera. Late fusion integrates the detection results of two modalities. It involves independent processing of point clouds and images using dedicated algorithms, followed by integration via mechanisms such as weighted averaging or voting schemes to derive final detections. Late fusion mitigates errors inherent to single-modal data and enhances system robustness, making it particularly suitable for accuracy-critical applications. Thus, this paper proposes PomageNet, a novel late-fusion 3D object detection framework. The framework comprises three modules: a data preprocessing module, a fusion network, and an output layer. Unlike conventional late-fusion methods that rely on simplistic decision mechanisms, PomageNet introduces a dual-branch fusion network architecture. The key innovations are outlined as follows:
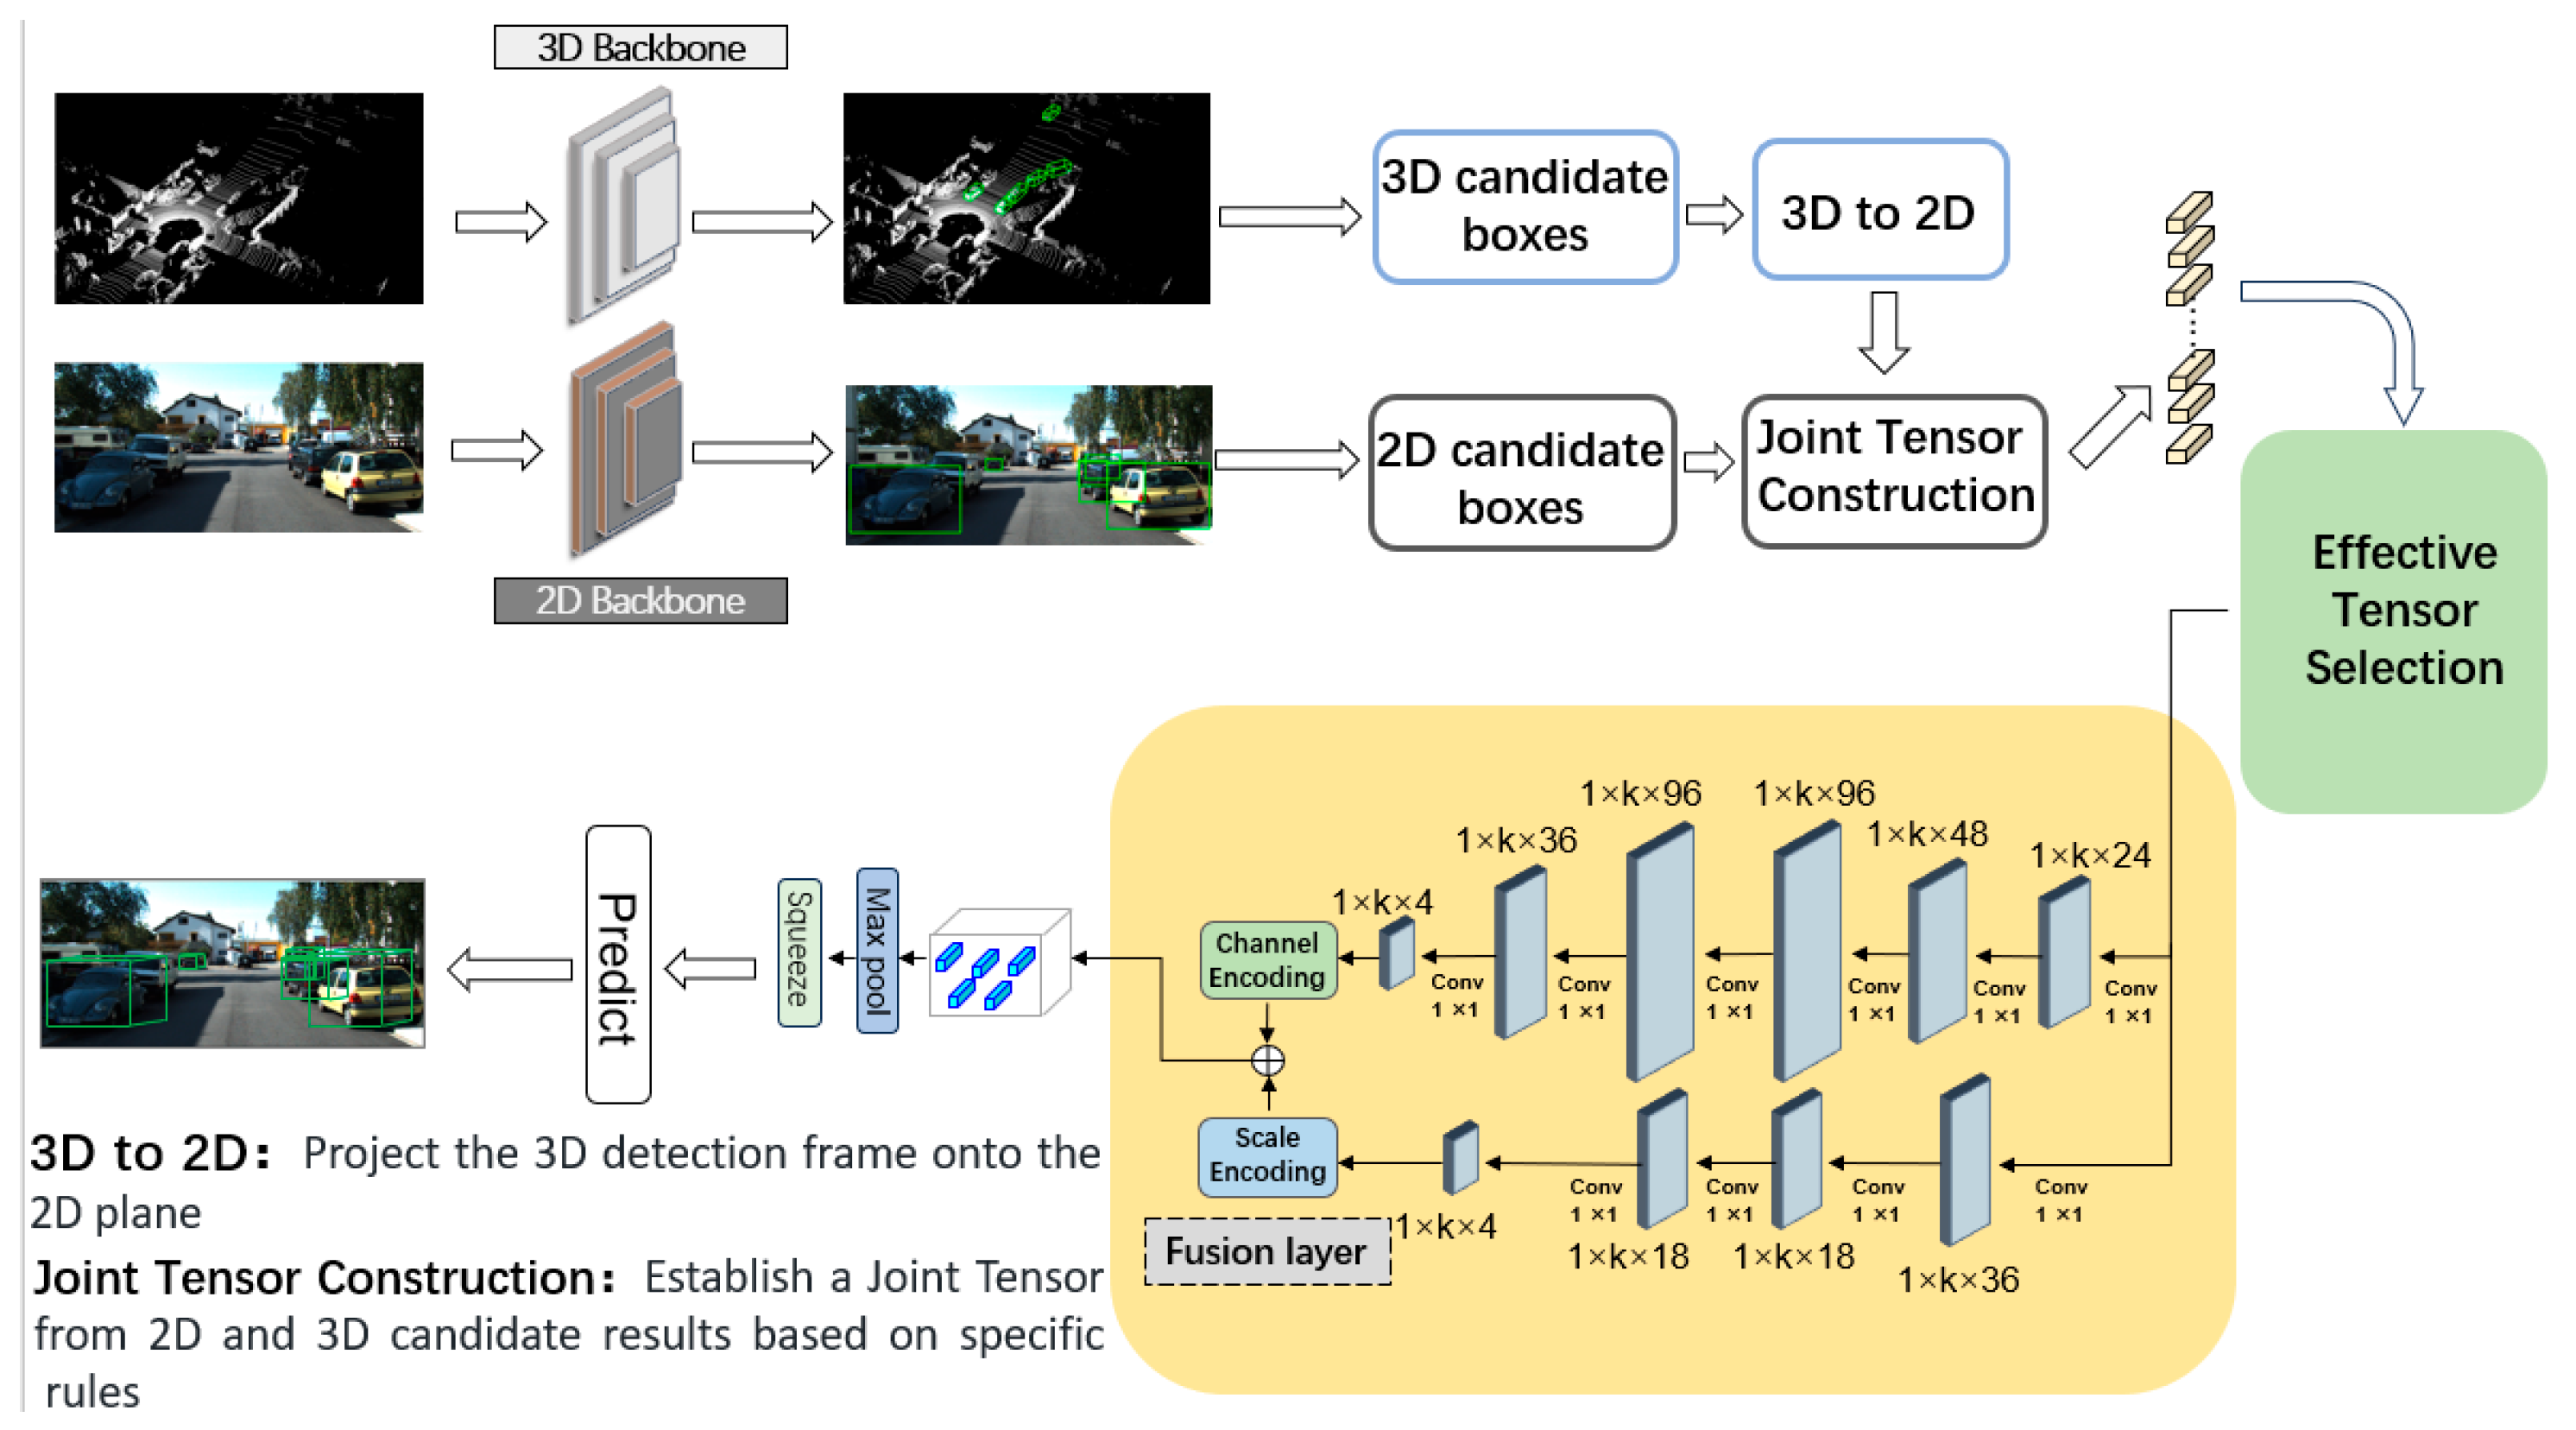
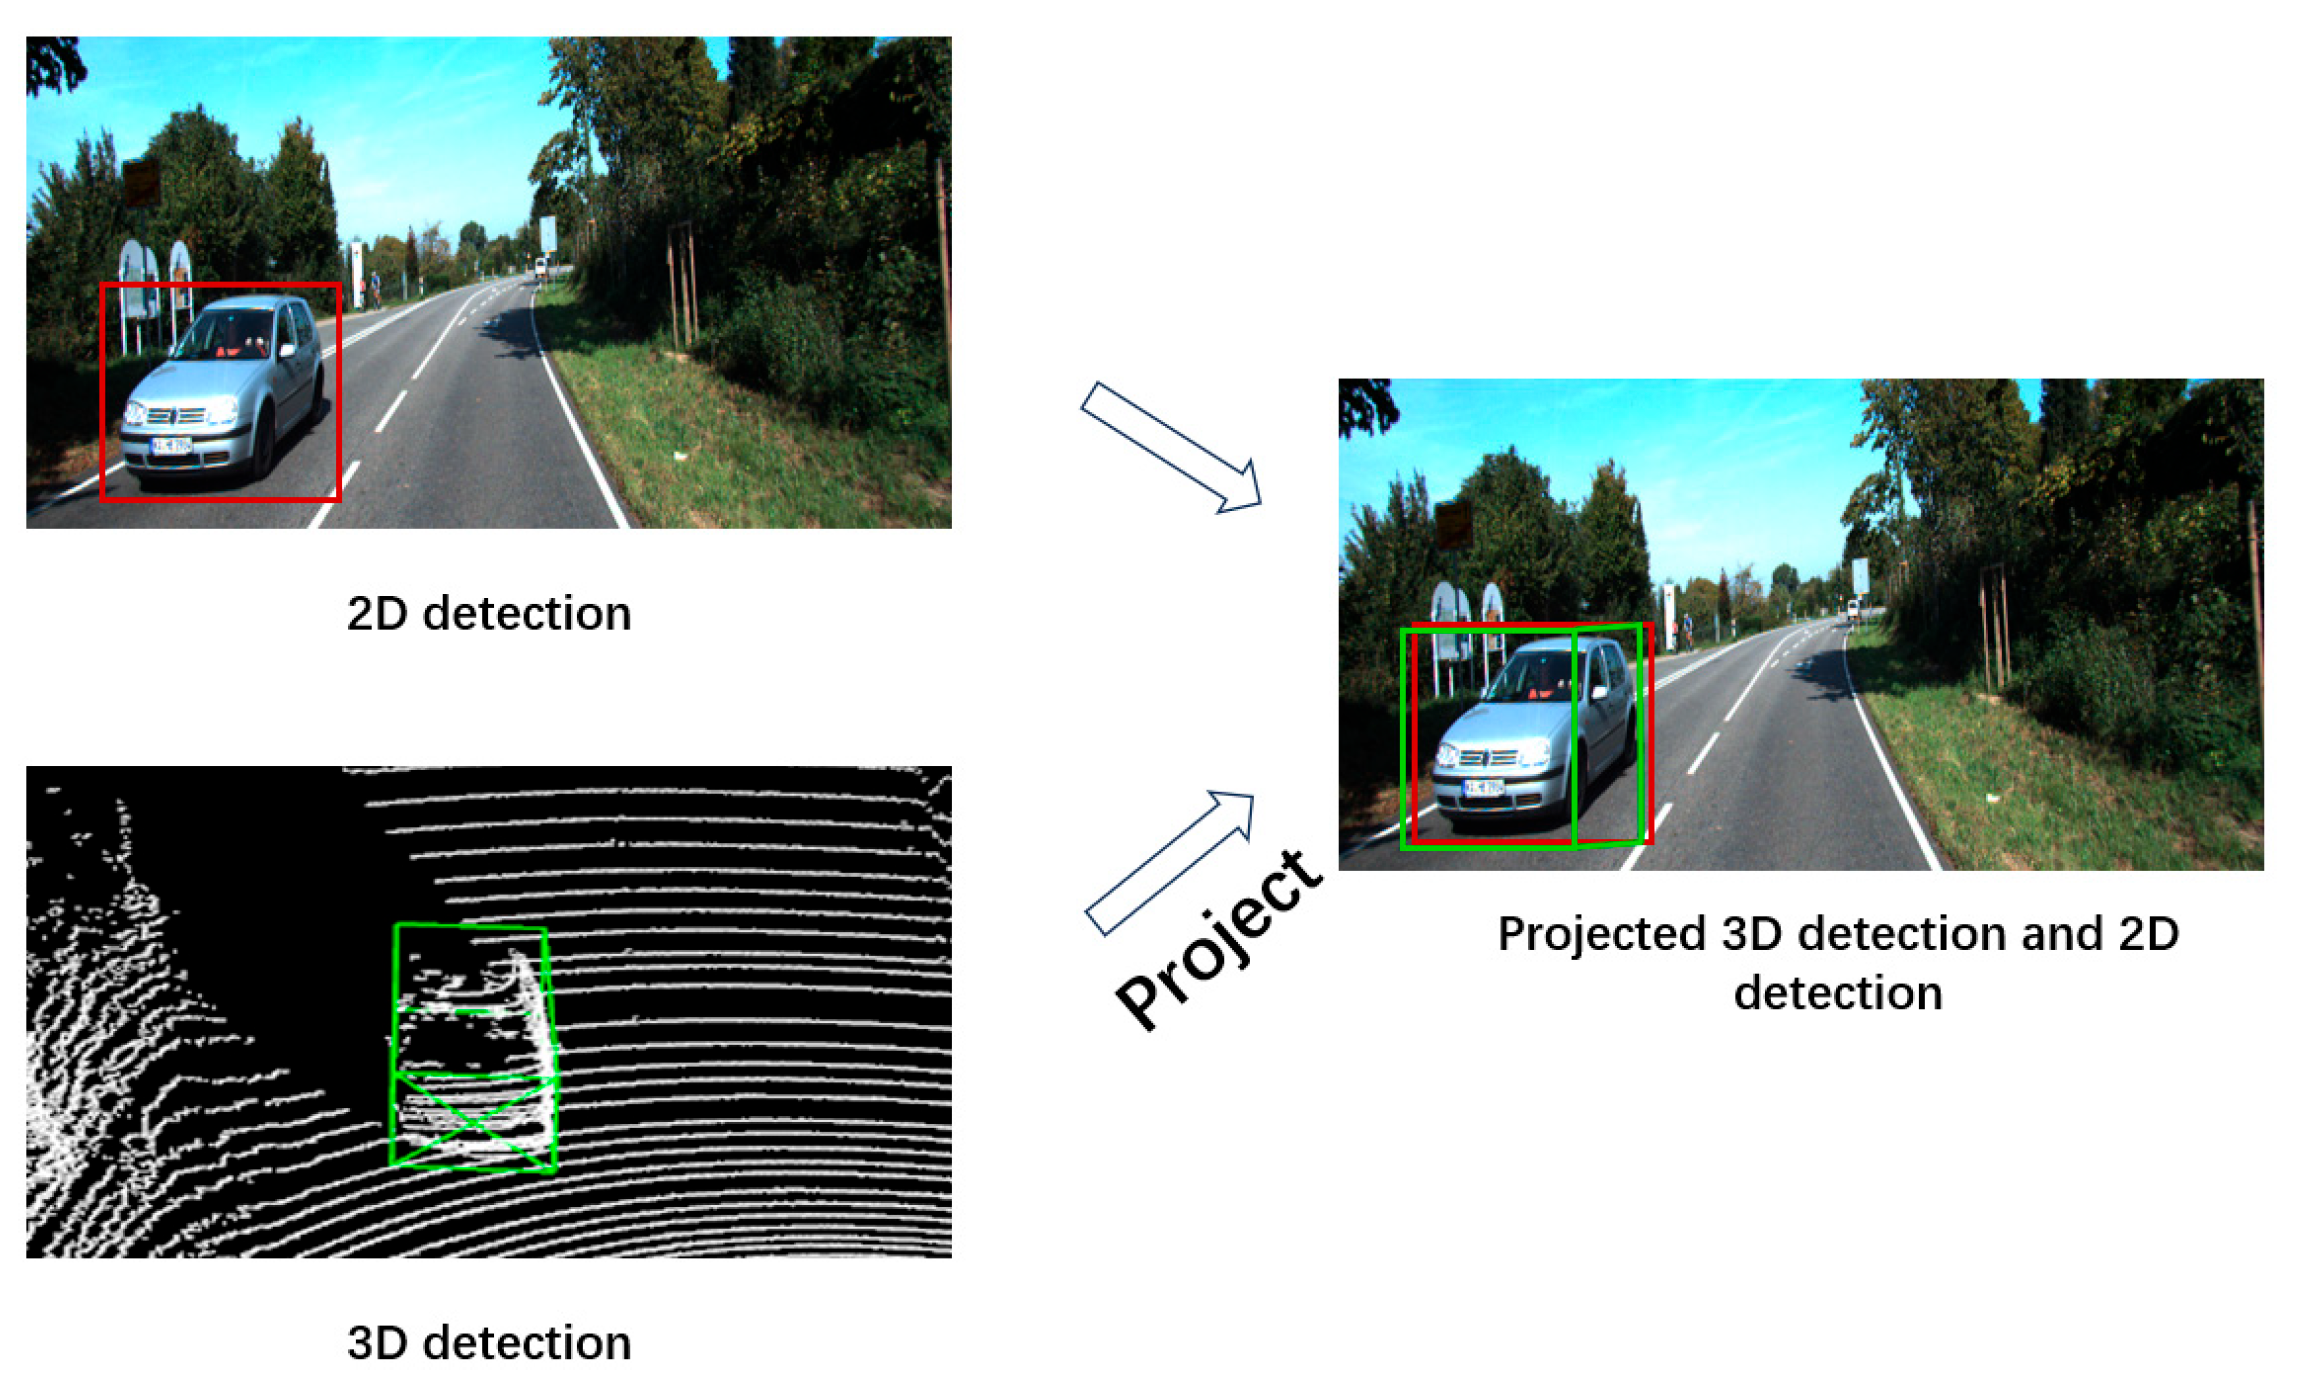
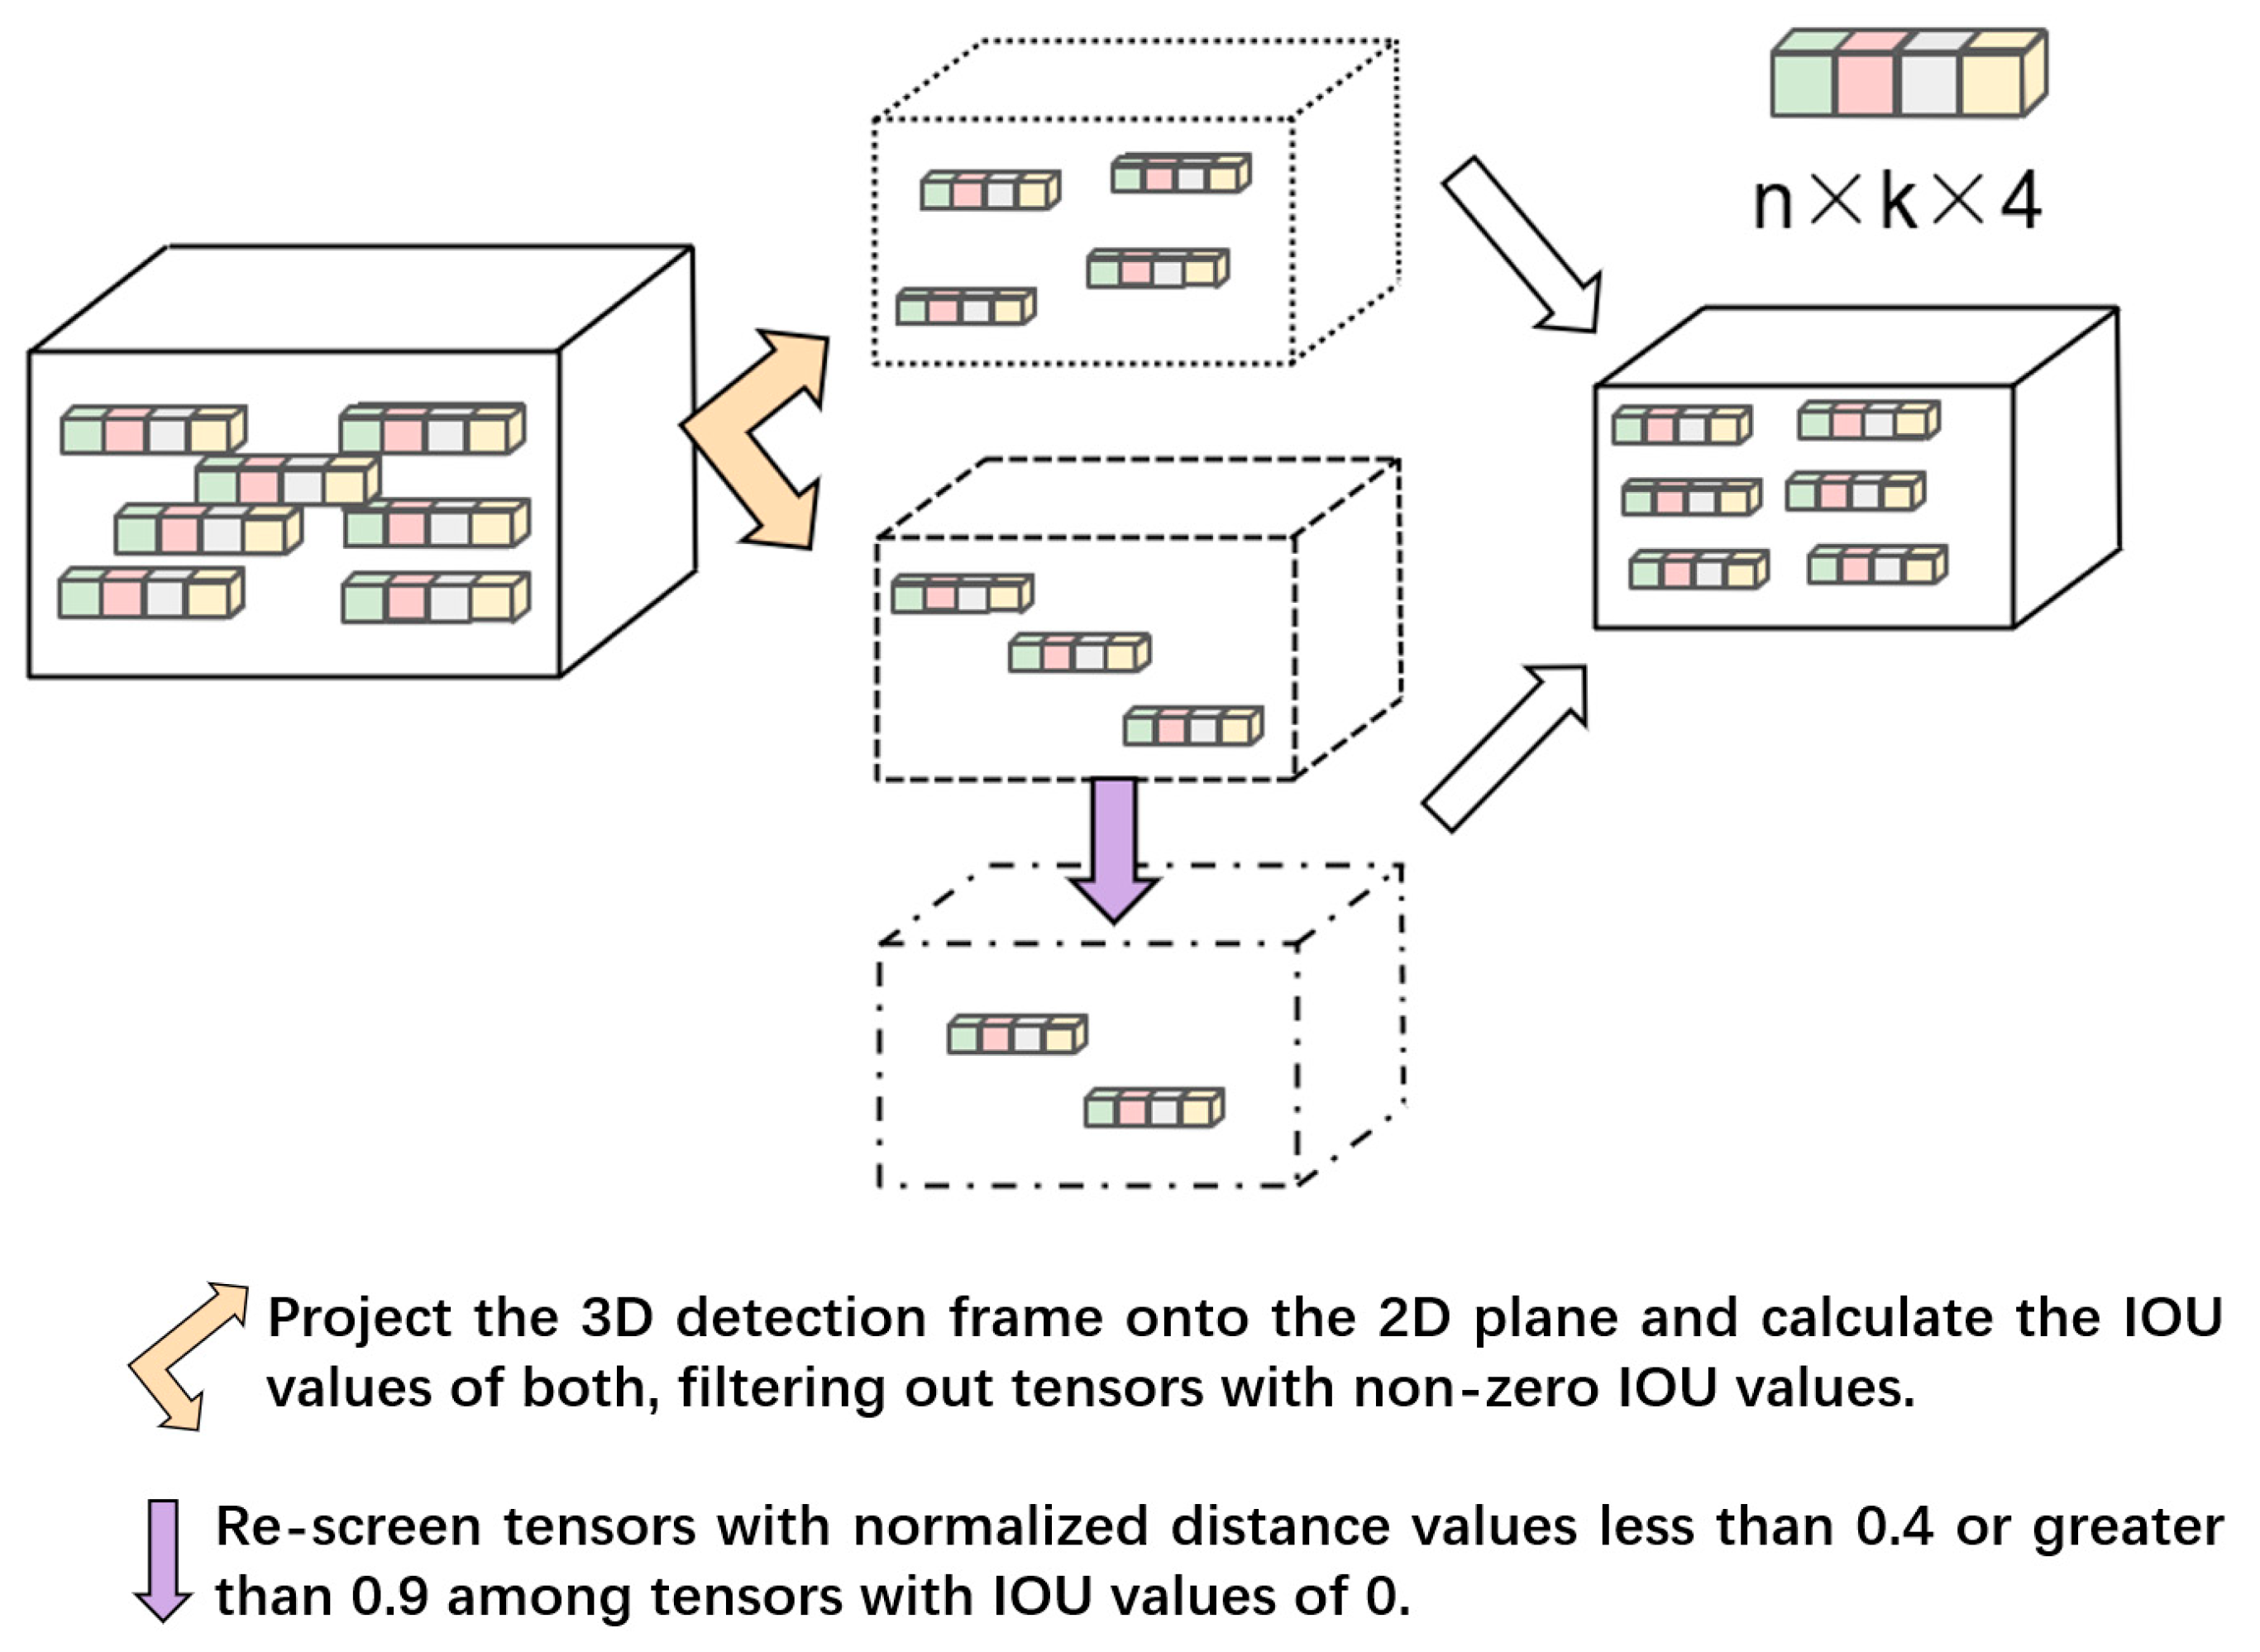
  • We construct a joint tensor with fused confidence scores by aligning 2D and 3D detection results. Specifically, 3D candidate bounding boxes are projected onto the 2D image plane, and their intersection-over-union (IoU) with 2D detection candidates is computed. These IoU metrics serve as the basis for generating the joint tensor, which is then fed into the fusion network.
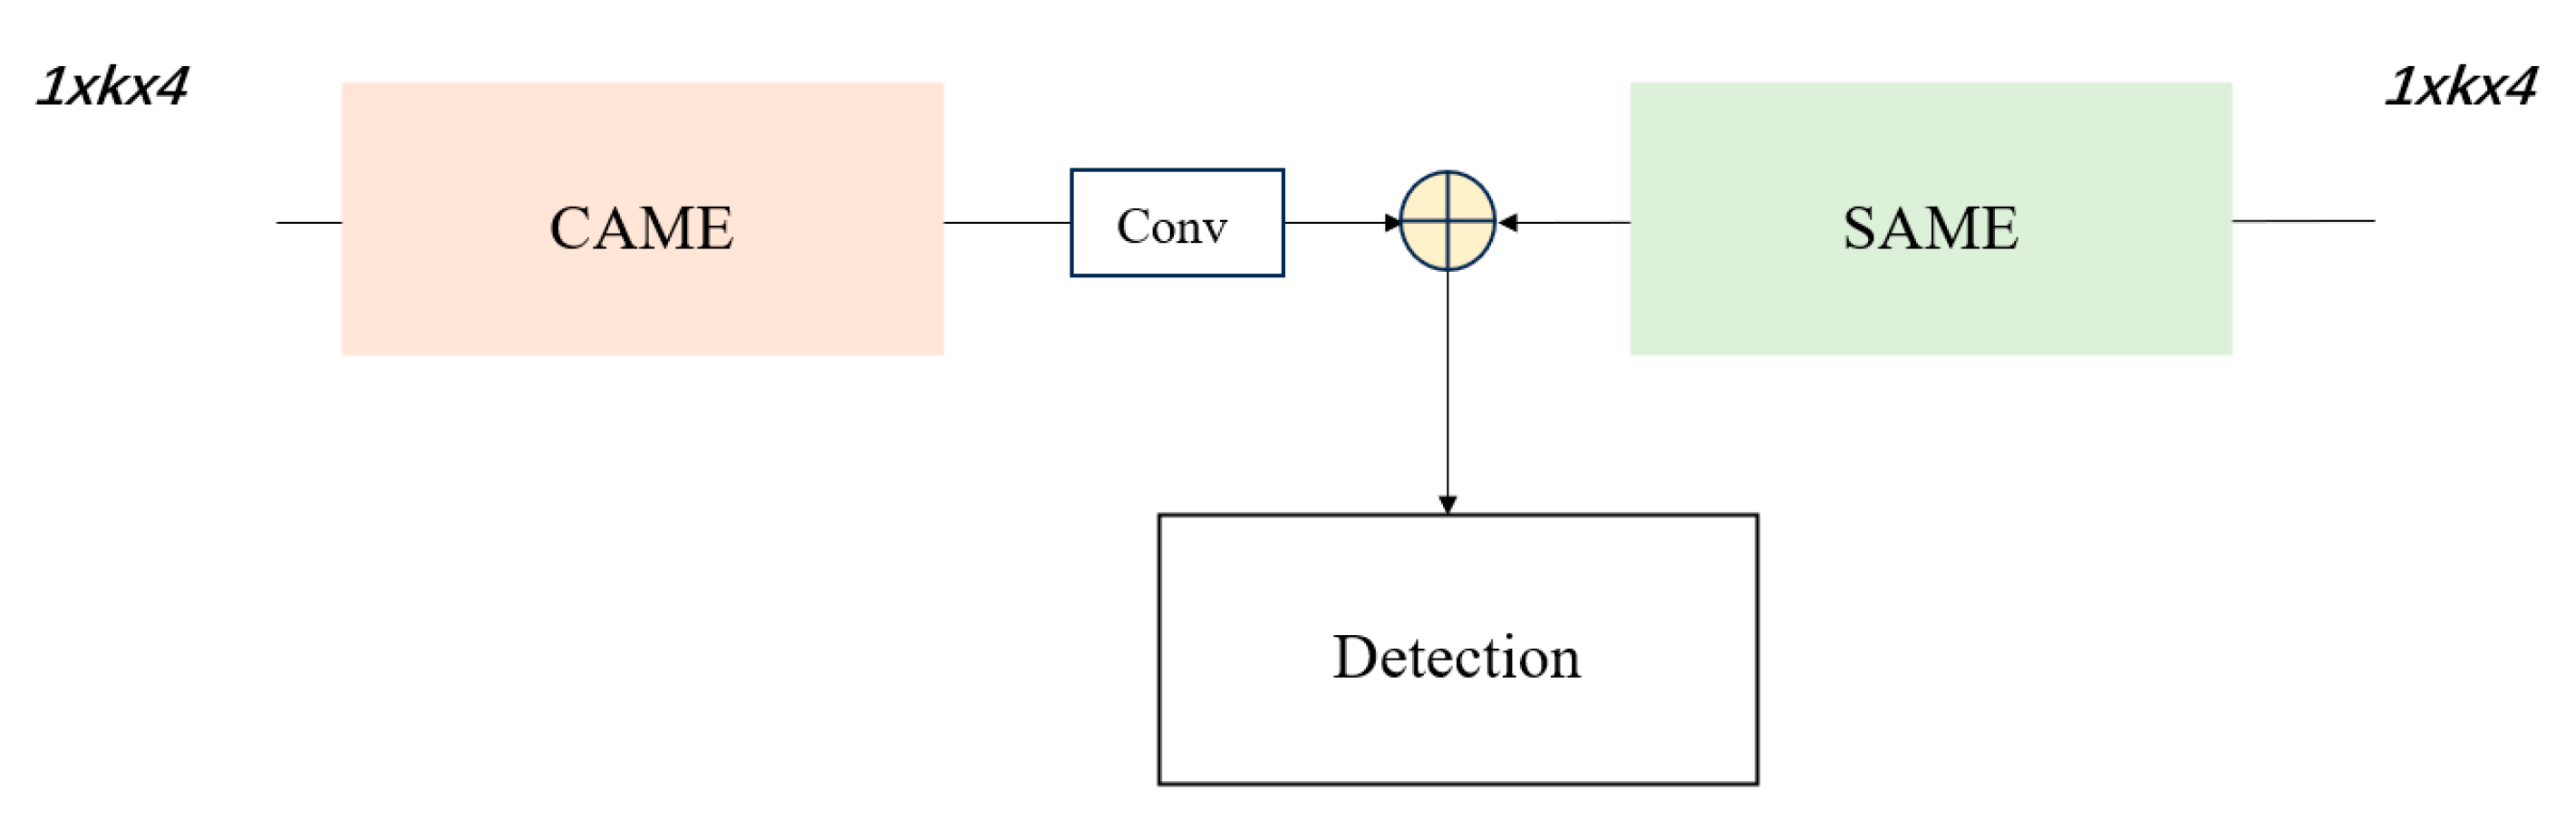
  • We introduce a dual-branch structure where parallel subnetworks independently process modality-specific features. This architecture enhances feature discriminability and overall average precision.
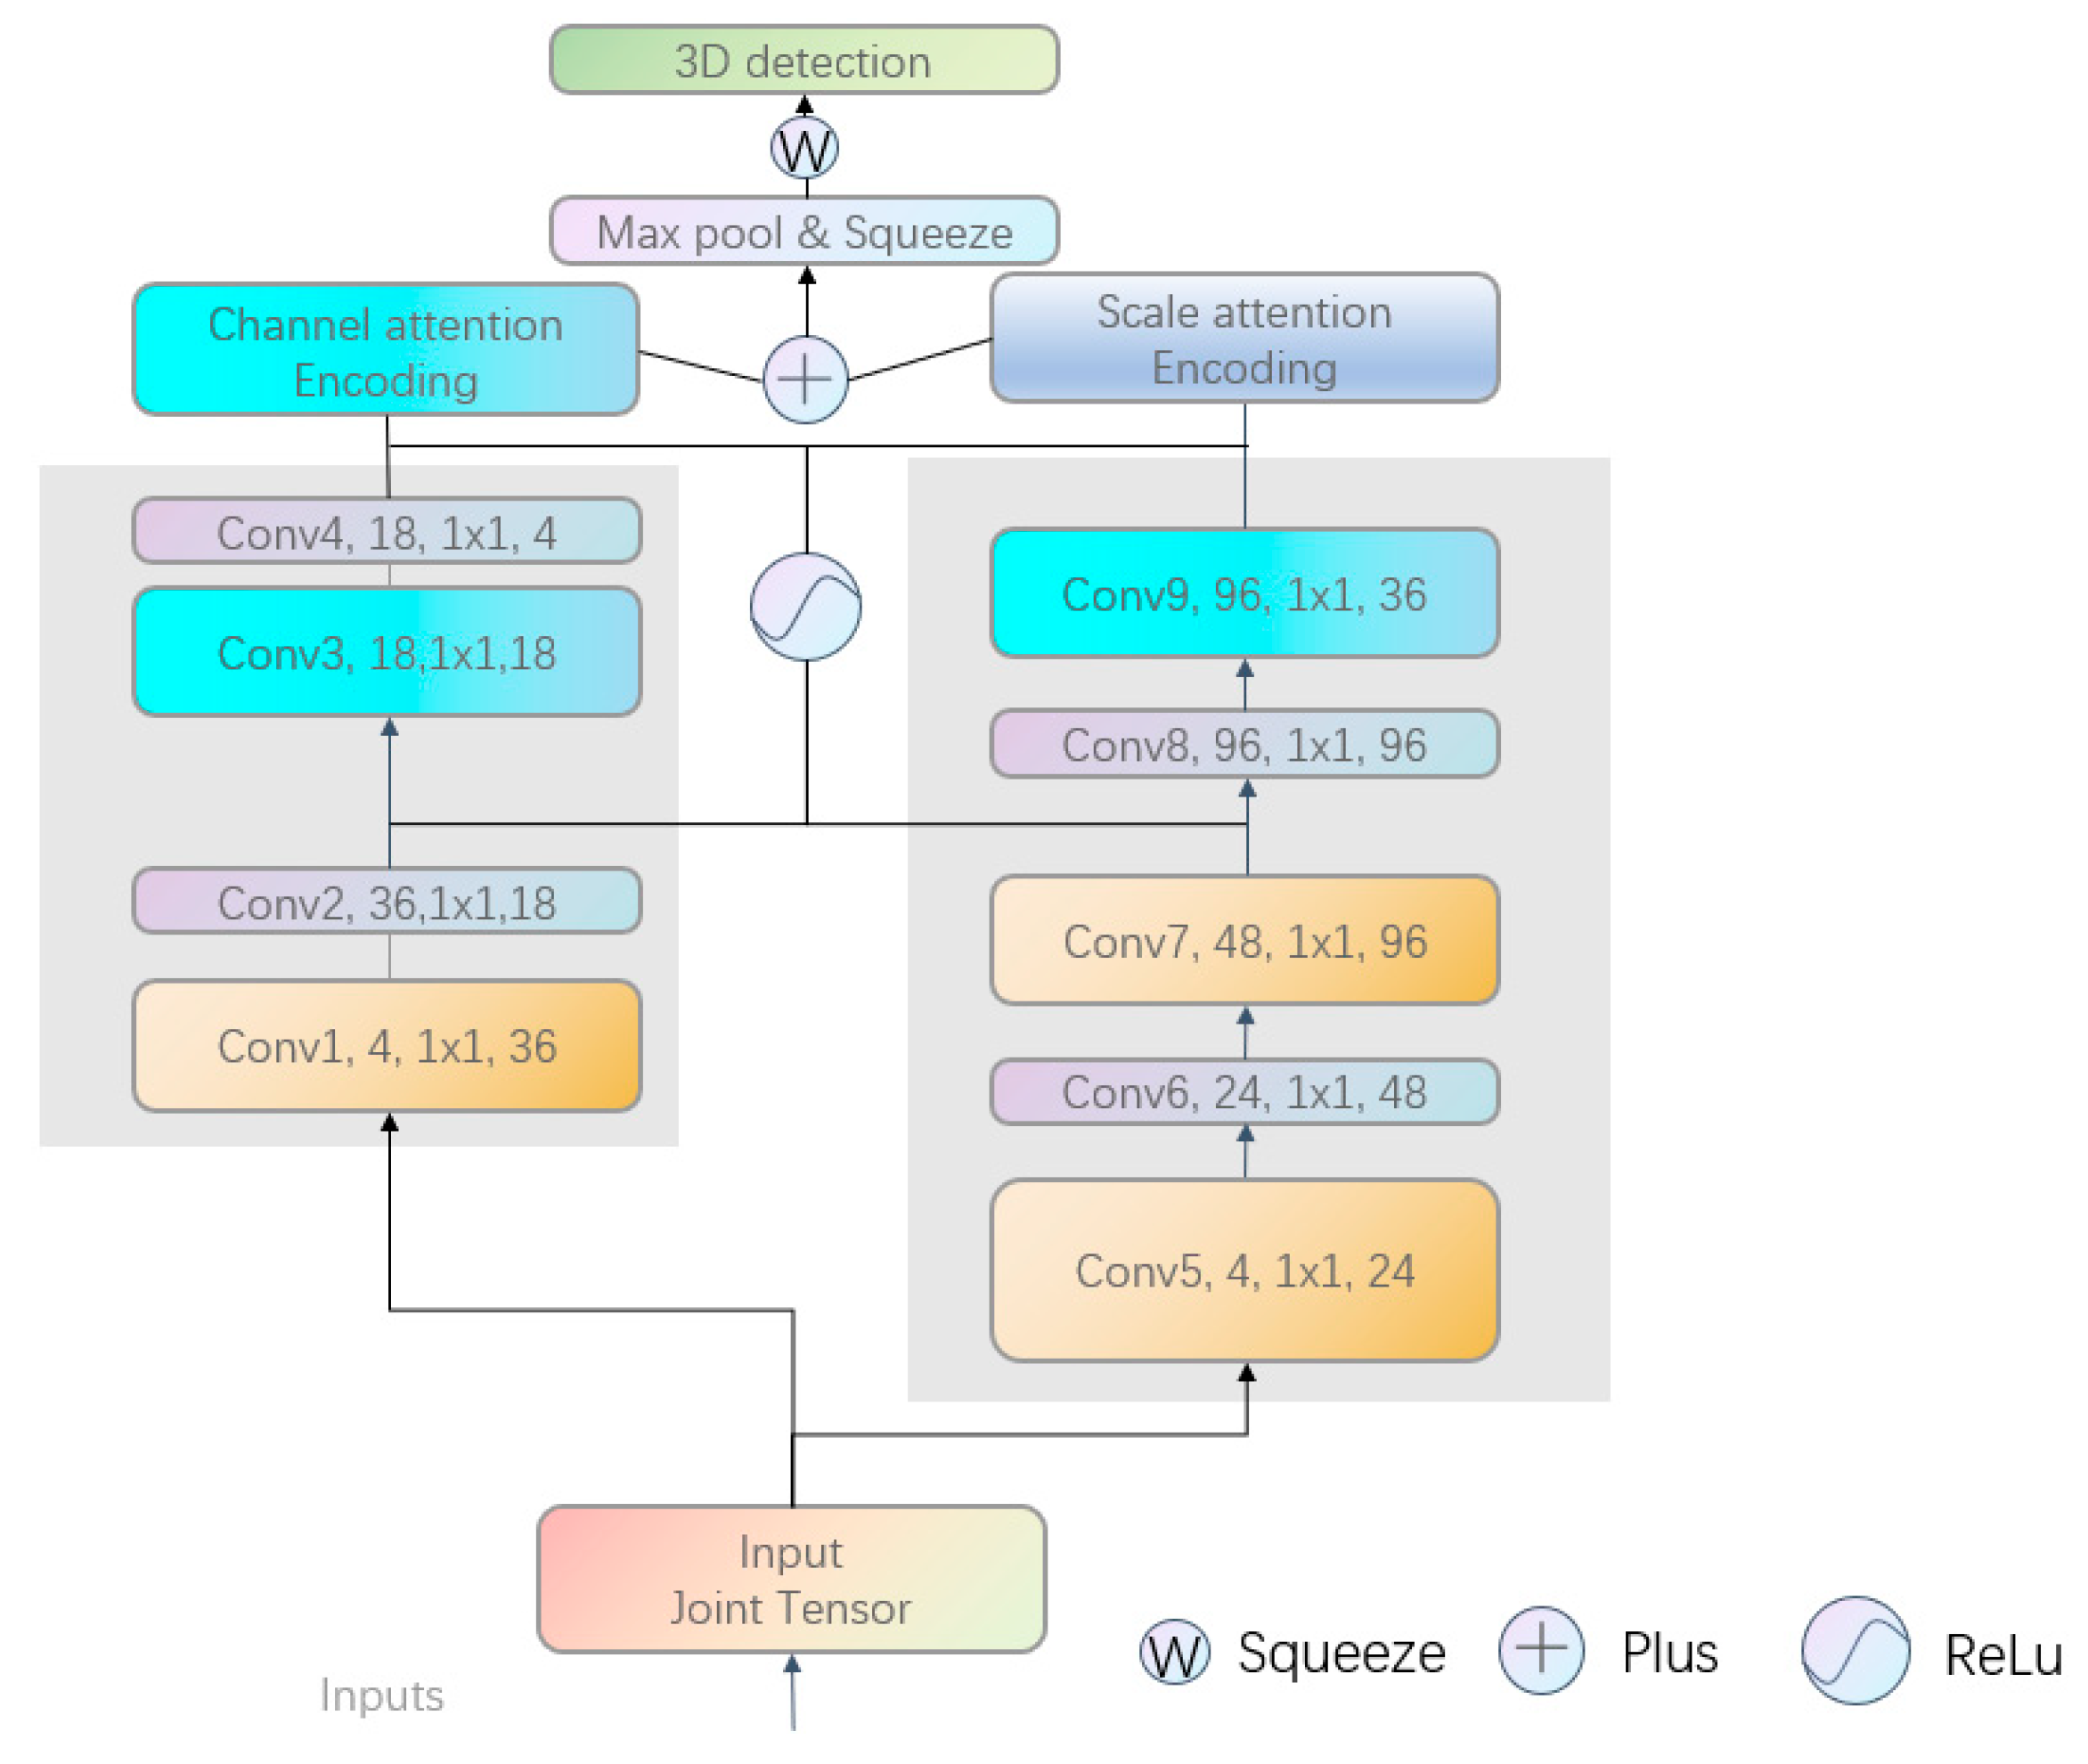
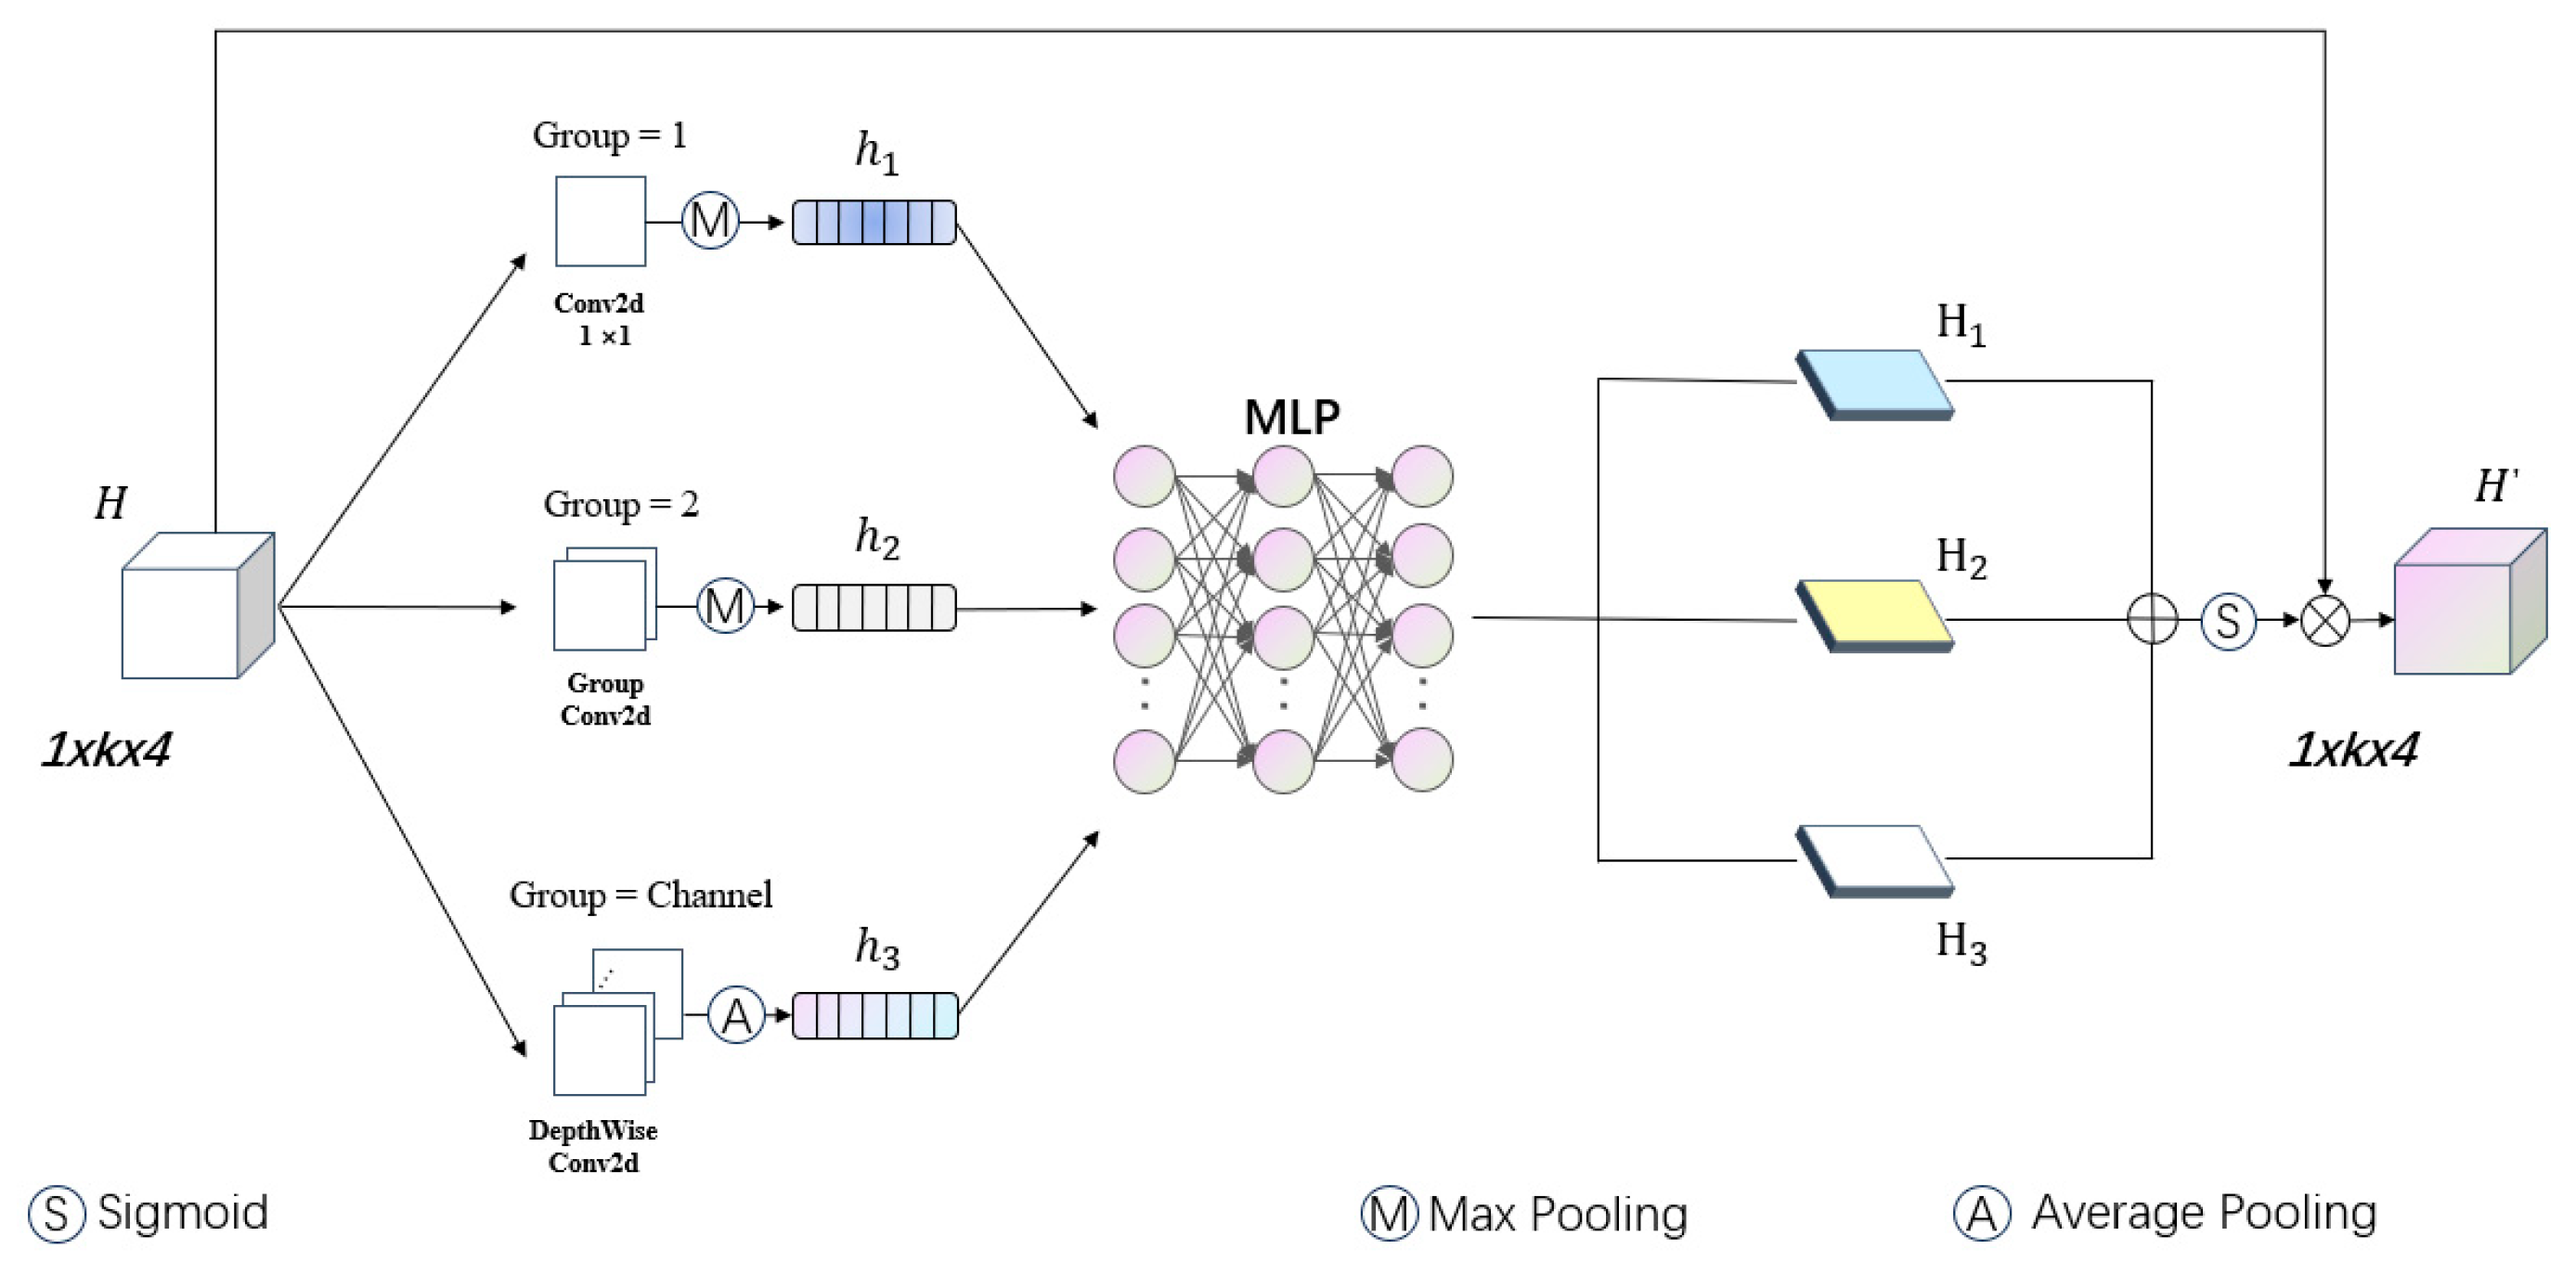
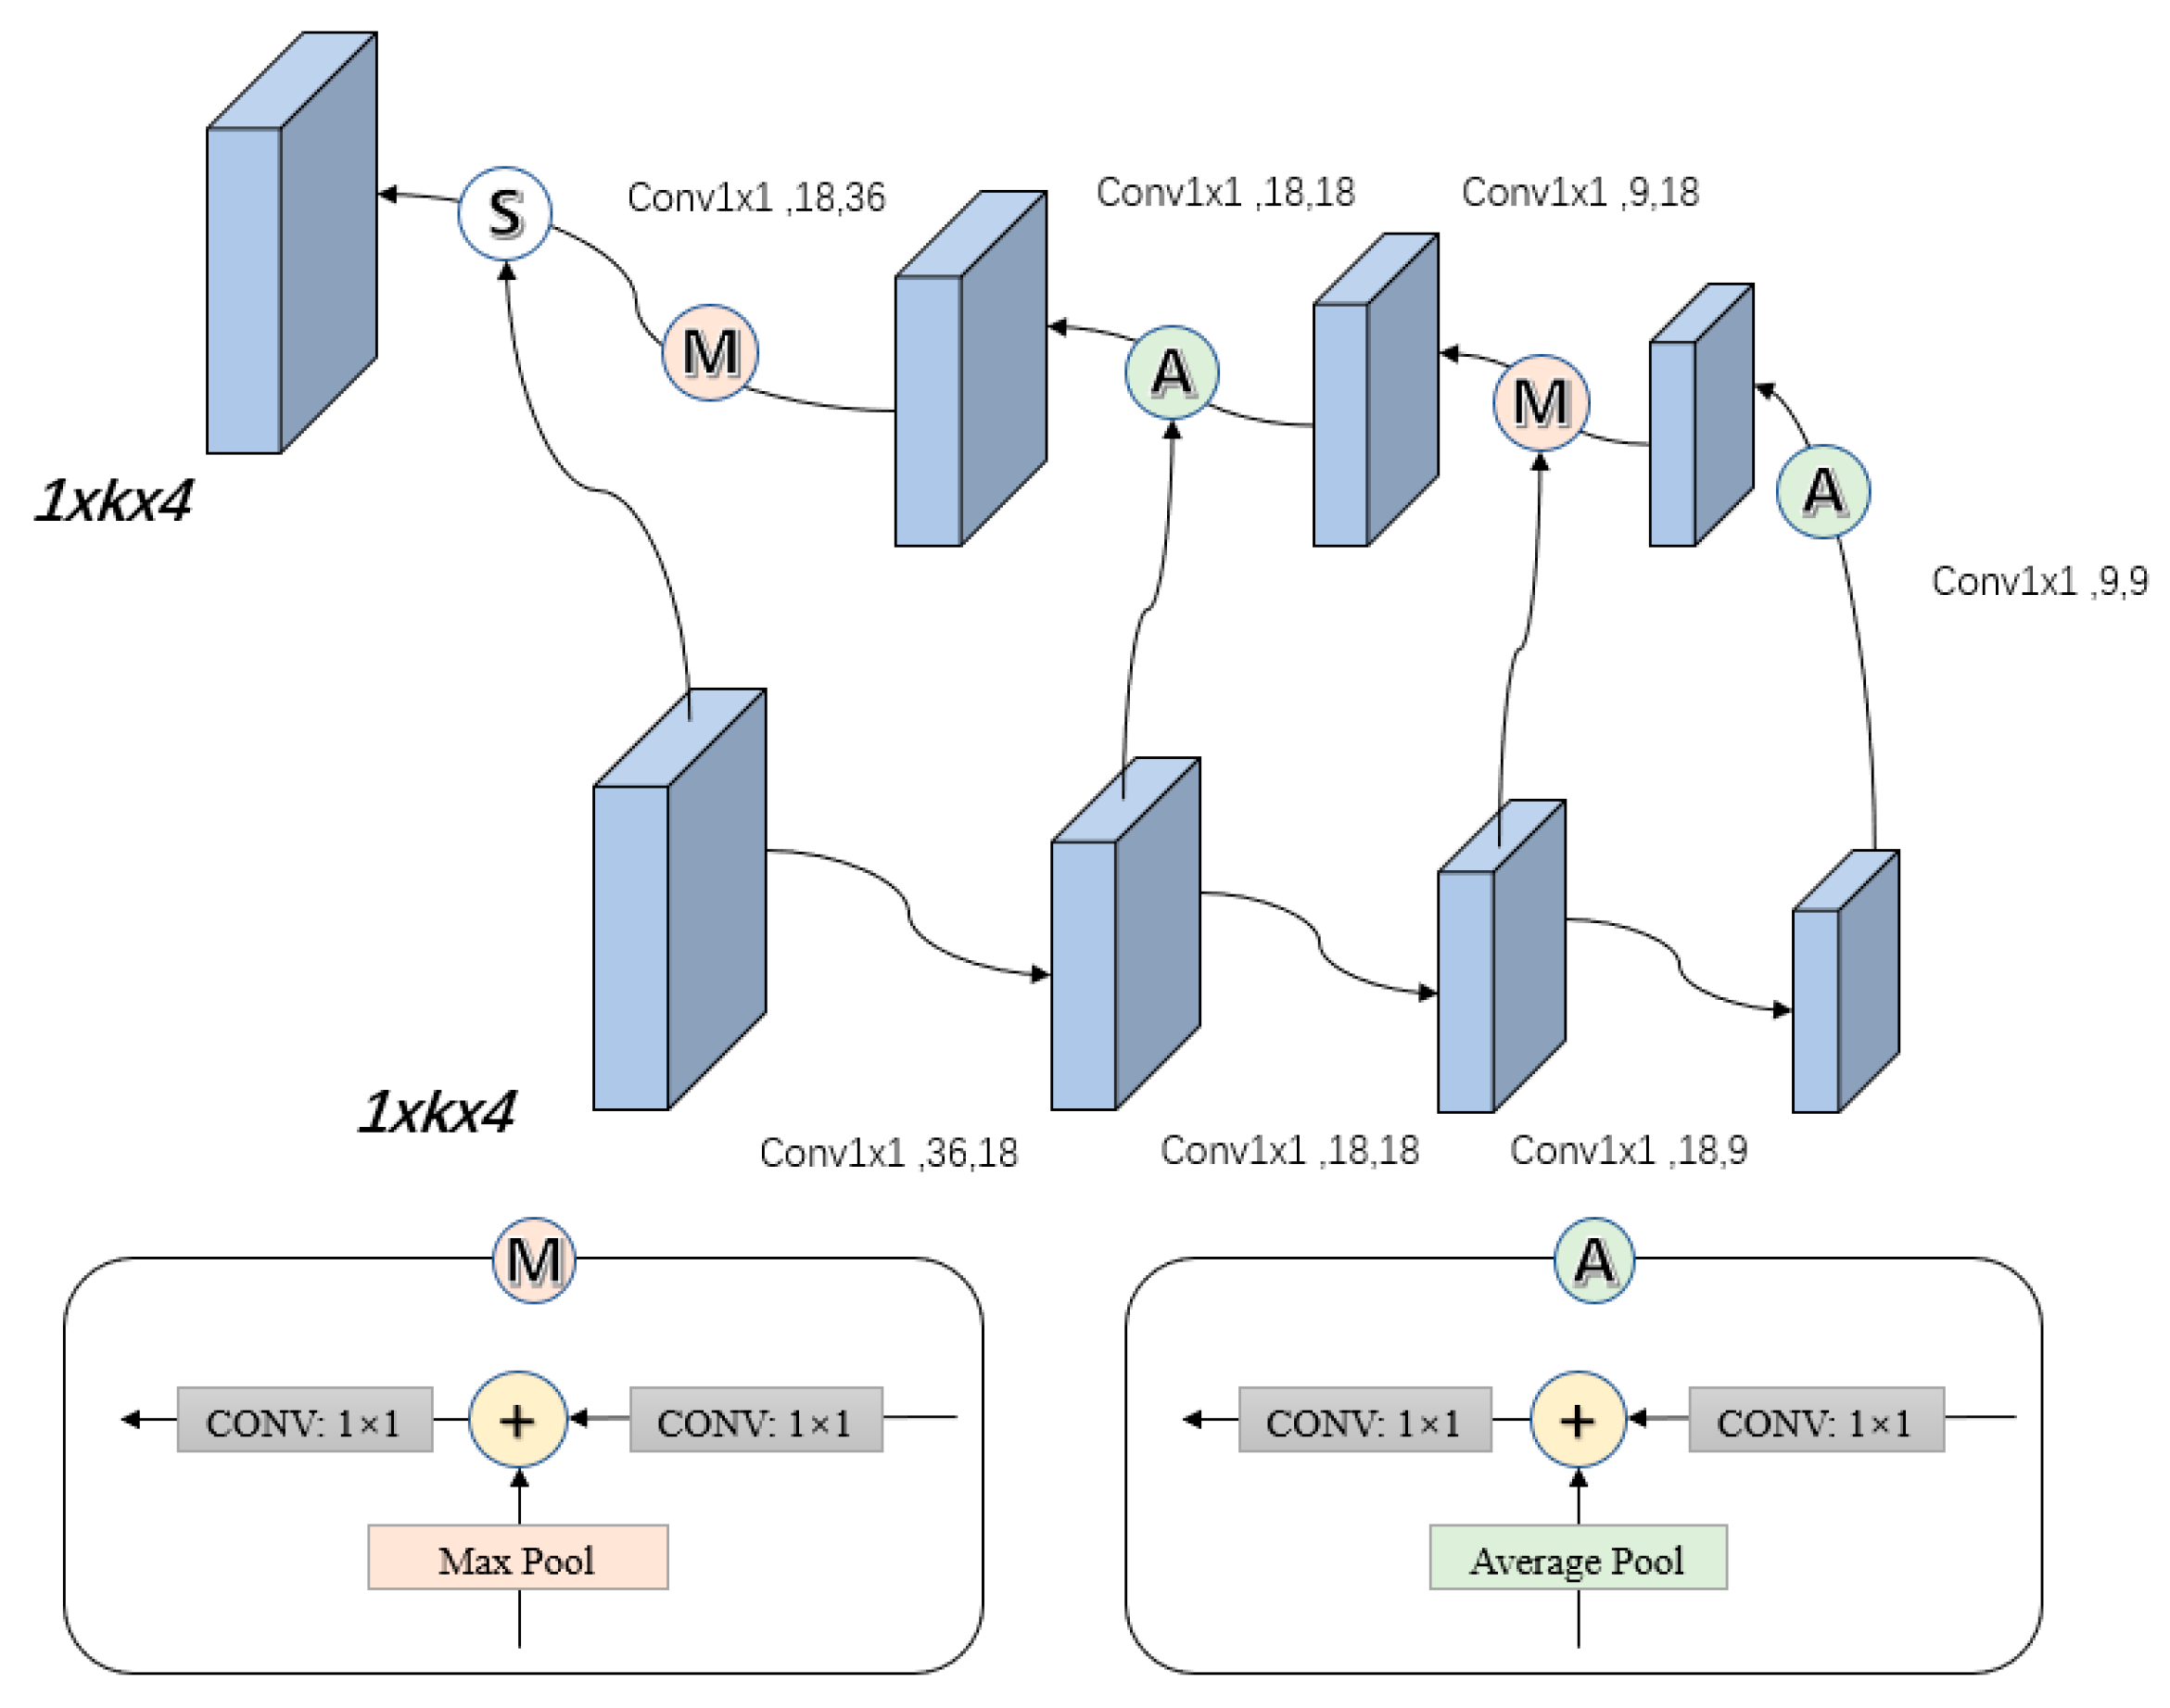
  • To prevent the network from overlooking distant spatial features in original candidate regions, we integrate a cross-attention mechanism into the fusion branches. Channel attention and spatial attention modules were embedded in the two branches of the fusion network, functioning as channel encoders and spatial encoders, respectively. Channel attention emphasizes feature relevance across channels, whereas spatial attention focuses on contextual relationships within feature maps. The outputs of these modules are adaptively combined to produce the final fused features.

2. Related Works

Recently, substantial progress has been made in data fusion-based 3D object detection methodologies. These methods are systematically categorized into early, intermediate, and late fusion methods on the basis of their integration stages. Early fusion combines raw sensor data prior to feature extraction, intermediate fusion merges modality-specific features during network processing, and late fusion consolidates detection outputs from independent modality-specific pipelines. Figure 2 shows the average precision(AP) of fusion detection approaches on te KITTI dataset.

2.1. Early Fusion

In 2018, Qi et al. proposed F-PointNet [14], which first performed 2D object detection on 2D images to define 3D frustum regions based on 2D bounding boxes. Three-dimensional bounding box regression was then conducted on the point clouds within these frustums, significantly improving search efficiency and detection accuracy. Building upon this idea, Zhao et al. proposed SIFRNet [15], which improved the representation of frustum regions by incorporating front-view images and truncated frustum point clouds, further improving the quality of object box predictions. Subsequently, Chen et al. proposed MV3D [16], a 3D detection system utilizing multiple viewpoints that adopts a two-stage pipeline. It generated 3D proposals and projected them into three views for feature extraction. MV3D had the highest value of average precision on the KITTI dataset at the time, but suffered from high cost. Thus, Ku et al. presented AVOD [17], which incorporates multi-view feature fusion during the first stage to produce a proposal region. By applying the Region Proposal Network (RPN) on high-resolution fused features, AVOD significantly enhances the detection of small objects in the scene.

2.2. Middle Fusion

Feature fusion at the feature extraction stage demonstrates strong robustness, with performance largely dependent on the quality of extracted features. In 2018, Xu et al. proposed SqueezeSeg [18], which combines CNNs with CRFs to segment point cloud data in real time. In 2020, 3D-CVF [19] introduced a cross-view fusion mechanism to jointly leverage camera and point cloud features, enhancing 3D average precision in complex scenes. PointPainting [20] attached image segmentation results to point clouds, effectively mitigating cross-modal misalignment in the bird’s-eye view (BEV), though it relied heavily on segmentation accuracy. EPNet [21] employed LI-Fusion for point-wise semantic fusion from images and introduced a consistency loss to improve alignment between localization and classification.
In addition, middle fusion strategies have been widely adopted in tasks such as segmentation and 3D reconstruction. Representative methods such as LaserNet++ [22] and DVLO [23] leverage multi-modal fusion to improve system robustness and accuracy, particularly in the detection of small objects.

2.3. Late Fusion

Compared to the other two fusion strategies, late fusion is a more straightforward and efficient approach. As a consequence, this technique has emerged as the most commonly used framework for multi-sensor fusion within the field of practical applications. In recent years, an increasing number of late fusion techniques have been proposed and employed across multiple domains such as intelligent transportation, bird’s-eye view recognition, and road scene perception. In 2021, Dong et al. introduced AssociationNet [24], which projects targets detected in millimeter-wave radar point clouds onto the image plane. A neural network then learns target features in the image coordinate system to compute a similarity matrix. CLOCs [25] was proposed the same year as an effective late fusion method. It introduces a post-fusion network intended to take over the role of non-maximum suppression (NMS), improving the precision of candidate bounding boxes. Subsequently, Pang et al. proposed Fast-CLOCs [26], an enhanced version of CLOCs that achieved superior average precision across multiple datasets. In 2024, Sgaravatti et al. [27] proposed a multimodal delayed fusion approach in a cascade structure that blends LiDAR inputs with image-based information at the high-level feature stage to further advance the accuracy and stability of detecting objects in 3D environments. Similarly, FusionRCNN [28] employs a late fusion strategy to combine LiDAR and camera features within a two-stage detection framework, significantly improving detection accuracy. CL-fusionBEV [29] adopts a BEV-based late fusion method that integrates camera and LiDAR data to enhance 3D object average precision. PLC-Fusion [30] proposes a viewpoint-based hierarchical depth fusion approach that consolidates multi-modal data in the late fusion stage, leading to improved performance in autonomous driving scenarios. BAFusion [31] introduces a bidirectional attention mechanism to combine LiDAR and camera features during the late fusion phase, improving robustness and accuracy. SparseFusion [32] presents a multi-modal sparse representation fusion strategy that achieves efficient information integration during late fusion.
Moreover, numerous BEV-based late fusion methods have emerged. For instance, BEVFusion4D [33] utilizes cross-modal guidance and temporal aggregation strategies to significantly enhance average precision in dynamic scenes. MSMDFusion [34] employs a multi-scale and multi-depth seed point mechanism to integrate multi-source data during the late fusion stage, thereby boosting precision. BEVFusion [35] presents an integrated approach combining multi-task capabilities with multi-sensor fusion, which enhances both 3D object detection and semantic segmentation in BEV representation. Sec-CLOCs [36], built upon CLOCs, targets adverse weather conditions such as snowy environments by integrating YOLOv8s and SECOND detectors through a late fusion mechanism to improve detection robustness. Finally, VoxelNextFusion [37] proposes a simple, unified, and efficient voxel-based fusion framework that integrates LiDAR and camera features in the late fusion stage, demonstrating strong performance in 3D object detection tasks.

3. Materials and Methods

Figure 3 illustrates five principal components: upstream candidate result acquisition, preliminary data fusion module, joint tensor construction, fusion network, and final output. This structured pipeline systematically integrates heterogeneous data sources through progressive feature transformation and multi-dimensional representation learning, ultimately producing optimized decision outcomes.
We comprehensively elaborate on the implementation framework of PomageNet. The implementation pipeline is initiated by employing SECOND for 3D object detection and Cascade-RCNN [38] for 2D detection in parallel. The derived 3D bounding boxes are transformed and aligned onto the 2D image surface. Through joint calibration of intrinsic and extrinsic camera parameters, we establish geometrically consistent multimodal representations for downstream processing.
As shown in Figure 4, the multimodal detection outputs are consolidated into a joint tensor through geometric co-registration. Candidate regions coplanar in the projective space undergo IoU quantification, with those exhibiting non-zero spatial overlap (IoU > 0) being selected as optimal fusion candidates. Our fusion architecture employs a dual-branch parallel topology exclusively composed of 1 × 1 convolutional layers. Channel-wise encoding and scale-wise encodings are successively applied in each branch, followed by feature aggregation through global max-pooling to generate the final detection.

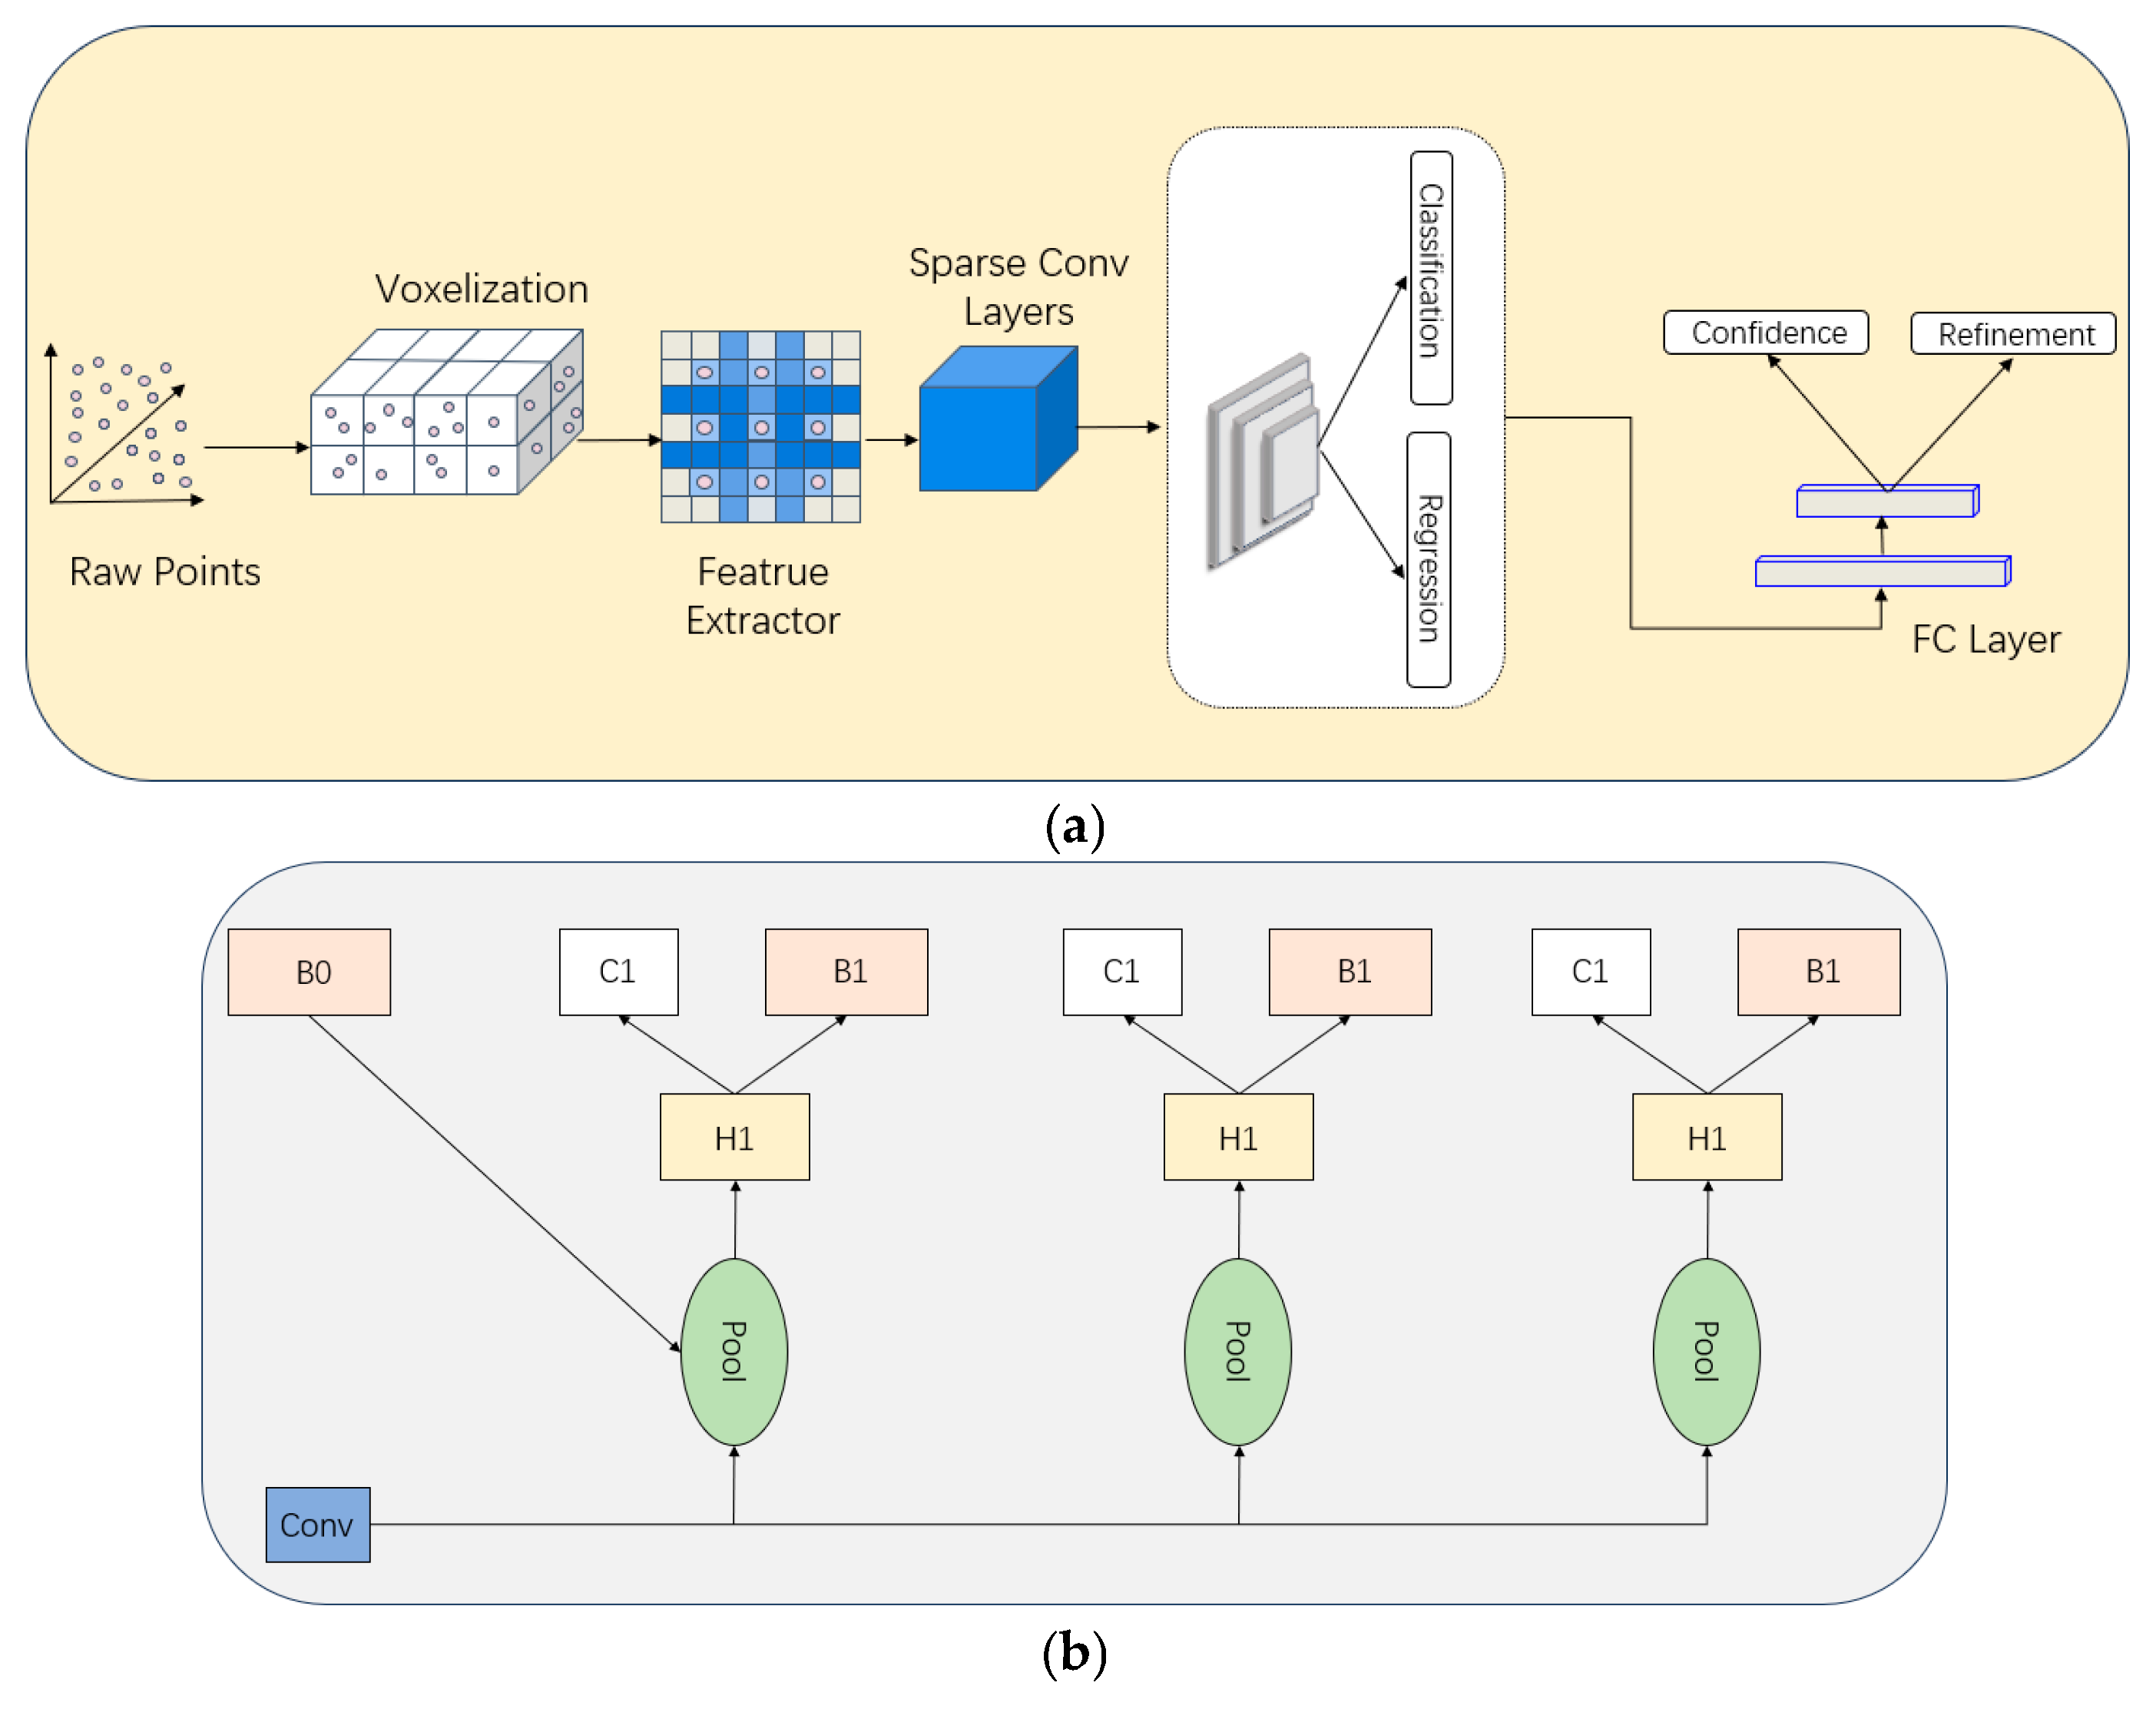
3.1. Upstream Candidate Result Acquisition

Figure 5a presents a schematic representation of the SECOND network architecture, while Figure 5b illustrates the cascaded output refinement module in Cascade R-CNN.
The quality of upstream detection outputs constitutes a critical determinant for all subsequent fusion architectures, as their performance exerts the most significant and direct impact on multimodal-integration efficacy. Figure 5a,b present schematic diagrams of the upstream 2D/3D detection frameworks (SECOND and Cascade R-CNN), illustrating their architecture. LiDAR-acquired point cloud data and camera-captured RGB imagery—captured under identical observational conditions—are separately processed through their respective detection pipelines to generate modality-specific bounding box proposals.

3.2. Joint Tensor Construction

The PomageNet framework is architected to augment 3D average precision through strategic integration of 2D visual cues. This necessitates implementing an effective fusion strategy that ensures cross-modal correspondence. Specifically, an association matrix is constructed by combinatorially pairing i 2D proposals with j 3D candidates to form a joint tensor as formalized in Formulas (1) and (2):
c i 2 d = [ d i x , d i y , d i h , d i w , p i 2 d ]
c i 3 d = [ h j , w j , l j , x j , y j , z j , θ , p j 3 d ]
In Equation (1), the initial four components correspond to the offset values of the two-dimensional bounding boxes, while the term ci2d denotes the confidence level associated with the i-th class in the 2D object detection task. In a similar manner, Equation (2) begins with seven elements, which collectively describe the seven-dimensional representation of a 3D bounding box. Correspondingly, cj3d reflects the confidence score linked to the j-th category in the 3D detection scenario.
In Formula (1), dix, diy, dih, and diw denote the coordinate adjustments applied to the two-dimensional bounding box positions along different axes, whereas pi2d represents the category confidence score for the i-th 2D detection. In Formula (2), hj, wj, and lj correspond to the length, width, and height of the 3D bounding box, respectively. xj, yj, zj indicate the 3D coordinates of the bounding box center, and θ defines the rotation angle of the candidate box relative to the reference plane. Similarly, pj3d denotes the category confidence score for the j-th 3D detection.
c j 2 d = [ d j x , d j y , d j h , d j w , p j 3 d ]
As illustrated in Formula (3), 3D candidate boxes undergo a transformation to aligns them with the corresponding positions on the image plane by leveraging the sensor-specific internal characteristics and external alignment data of the camera and LiDAR, where cj2d denotes the projected 2D representation of the 3D candidate box on the image plane. We compute the IoU between the original 2D detection boxes and the projected 3D candidates. The reconstructed input tensor denoted as Qi,j is formally expressed in Formula (4):
Q i , j = [ I o U i , j , p i 2 d , p j 3 d , d j ]
I o U i , j = S I S U
In Formula (4), the first element Qi,j represents the IoU metric calculated between two candidate bounding boxes. Specifically, SI denotes the area of the overlapping region between the two boxes, while SU corresponds to the total area covered by their union. Concurrently, dj quantifies the normalized distance in the xy-plane between the LiDAR sensor and the j-th 3D bounding box, as defined in Formula (6):
d j = ( x j x i ) 2 + ( y j y i ) 2 ω
The coordinates (xj, yj) denote the position of the j-th target in the xy-plane, while (xl, yl) represent the coordinates of the LiDAR system within the same planar coordinate framework, with ω being a constant parameter.

3.3. Screening Mechanism

The effectiveness of PomageNet stems from its utilization of high-performance 2D detection outcomes to guide the enhancement of 3D detection results. Thus, the implementation of meticulous screening on the input joint tensor becomes imperative.
As illustrated in Figure 6, the joint tensor construction process incorporates a dual-stage screening mechanism. Candidate pairs with IoU values computed via Formula (5) below zero are systematically eliminated. The subsequent screening phase retains exclusively those candidates demonstrating IOU values above zero while simultaneously requiring their normalized distances calculated through Equation (6) to fall within the experimentally determined optimal range of 0.4 to 0.9. This threshold interval has been rigorously validated through comprehensive ablation studies.

3.4. Fusion Network

Serving as the terminal component of the PomageNet framework prior to the output layer, the fusion network is architecturally designed to achieve comprehensive integration of the constructed joint tensor while maintaining computational efficiency. Accordingly, we adopt a deliberately simplified dual-branch architecture comprising convolutional layers and multi-dimensional joint encoding modules to emphasize information synergy over structural complexity. This configuration ensures effective cross-modal feature interaction while preserving essential spatial-semantic relationships embedded in the tensor representation.
Figure 7 shows the architectural configuration of the fusion network, which incorporates a dual-branch design for complementary feature processing. The first branch, designated as the channel pathway, employs multi-channel attention encoding to perform hierarchical refinement of extracted feature maps, with principal emphasis on inter-channel information exchange. The second branch, termed the scale pathway, applies analogous attention-based processing to its feature maps while specifically focusing on spatial correlation within the joint tensor. These two distinct attention encoding mechanisms are subsequently integrated through element-wise summation. They have formed a multi-dimensional joint attention encoding module that effectively synthesizes both channel-wise and spatial-wise feature interdependencies.

3.5. Multi-Dimensional Joint Attention Encoding

To achieve optimal fusion of feature representations within the joint tensor, we propose a Multi-dimensional Joint Attention encoding mechanism, as illustrated in Figure 8. It can give different attention weights to the information in the feature map from the channel and scale dimensions. These components are embedded at the terminal segments of two distinct network branches to capture dimension-specific feature hierarchies. The final fused representation is obtained through element-wise summation of the two attention-enhanced feature maps, which ensures the comprehensive fusion of cross-dimensional characteristics while maintaining representational consistency.
H,H’,h represent feature maps in different stages. The MLP (Multi-Layer Perceptron) is used to further process the features. The vectors h1, h2, and h3 represent the outputs obtained from grouped convolution, while H1, H2, and H3 correspond to the resulting feature vectors after being processed by the MLP. Figure 9 shows the channel attention mechanism in multi-dimensional joint attention encoding. Our channel attention mechanism is different from the transmitted channel attention mechanism. In this module, the feature maps are first convolved through three groups with different numbers of groups (1, 2, and channels) to obtain three different feature maps. The three feature maps are processed through global-level feature aggregation through average and max pooling operations.
Global information is extracted by aggregating spatial information from the feature map using a global averaging strategy. The dependency relationships between channels are learned using a shared fully connected layer, and channel attention weights are obtained through the Sigmoid activation function. Channel weighting is applied to the input feature map to enhance the feature representation of important channels. The reason for adding different grouped convolutions is to increase the sample size of different channel feature maps and enhance the robustness of feature representation.
H = σ ( ( M P max ) + ( M P max ) + ( M P a v g ) ) H
In Formula (7), H represents the original feature map, while H’ denotes the feature after processing. σ represents the sigmoid activation function, M is the multi-layer perceptron structure, Pavg and Pmax are the global average pooling and max pooling operations.
Figure 10 shows the scale attention module in multi-dimensional joint attention encoding. The scale attention in PomageNet should be accurately referred to as pseudo-scale attention. We also use 1 × 1 convolution to change the number of channels to obtain features of different dimensions, rather than changing the size of the feature map. Global information is obtained through max pooling and average pooling. They are fused by concatenating and adding these different feature maps. Ultimately, sigmoid was once again applied to obtain completely new weights.
H = σ ( P max ( P avg h 4 + ( P max h 5 + h 3 ) + ( P max h 6 + h 2 ) ) ) H
H is the input feature vector, hi is the feature map processed by convolution at different stages, Pavg and Pmax are global average pooling and max pooling.

3.6. Focal Loss

In PomageNet, the same loss function as the 3D baseline has been applied and proven to be effective. It is primarily composed of three distinct components: classification loss, directional classification loss, and candidate box regression loss. Classification loss is mainly applied to balance foreground and background. However, the difference from SECOND is that the input of the focal loss is the fused prediction probability:
F L p t = α 1 p t γ log p t
where pt is the predicted probability of the target, and α and γ are the relevant parameters of the classification loss. The regression loss for candidate boxes is defined as follows:
L θ = Smooth L 1 sin θ p θ t
where θp is the predicted direction angle of the target, and θt is the true direction angle of the target. An improved version of the Smooth L1 loss is applied to regress and train the seven-dimensional vectors in the 3D candidate boxes. The reason for adding the predicted direction angle and the true direction angle is to impose a constraint on regression training. The error caused by the predicted direction being opposite to the actual direction can be reduced. The directional classifier is a softmax loss function. Thus, the overall objective function that needs to be trained for the loss function in PomageNet is shown in Formula 11:
L total   = β 1 L cls   + β 2 L reg - θ + L reg - other   + β 3 L dir  
Lcls is the classification loss, Ldir is the directional classification loss, Lreg-θ is the angle-constrained loss, and Lreg-other is the position and size loss of the candidate box.

4. Analysis of Experimental Results

4.1. Dataset and Implementation Details

The novel fusion network PomageNet was evaluated on the KITTI [39] dataset. The numbers of training and testing samples were 7481 and 7518, respectively. In this dataset, 7481 training samples with ground truth labels were split into 3712 samples for training and 3769 samples for validation. The testing process was conducted on an NVIDIA RTX A6000 GPU. We employed the Adam optimizer with an initial learning rate of 0.003, which was gradually reduced by a factor of 0.8 throughout training. A batch size of 1 was applied, with each individual training sample counted as one step. Based on this setup, the training was carried out for a total of 37,120 steps.

4.2. Experiment on KITTI Dataset

To verify the effectiveness of our network, we conducted comparative experiments using PomageNet and other advanced 3D object detection networks on the car category of the Kitti dataset. N/A stands for no experimental results in that category in that model. Bolded results represent the best results. Relatively, blue color represents the second best result. The values of average precision are listed in Table 1:
We carried out experiments to compare PomageNet and other advanced 3D object detection methods on the car split of the Kitti test set. As shown in Table 1, the symbol L refers to the LiDAR-based detection method, M corresponds to the detection of monocular 3D objects, and F represents the fusion-based method. The best result is marked in black and blue, indicating that it is the second-best result.
It is not difficult to see from the table that although the cost of monocular object 3D detection is the lowest, the AP of this detection approach is significantly lower than that of the other two methods. Methods based on LiDAR and fusion have developed more maturely. Among the methods based on LiDAR, the two-stage 3D object detection methods, such as PIRCNN and PVRCNN, have achieved the best results so far, and their results are significantly better than those of the one-stage method. PomageNet combines two-dimensional detection with the one-stage SECOND method, resulting in a significant improvement in its results, with a 1.28% increase in detection results, on the car split of the Kitti validation set.
Table 2 shows that compared with other advanced models. PomageNet performs better in detecting small-sized targets such as cyclists and pedestrians. Bolded results represent the best results. Relatively, blue color represents the second best result. Compared with our baseline SECOND, the experimental result increased by 11.13% and 8.52% in the two categories, respectively. In addition, even in point cloud and image fusion models, our method has improved the pedestrian split by 3.64% compared to the highest fusion method.
In Figure 11, the bounding box in green corresponds to the location of the detected car, yellow represents the cyclist, and blue represents the pedestrian. The position of the yellow circle represents the part detected by SECOND error detection and PomageNet detection. The red circle represents the error detection of the SECOND algorithm.
In Figure 11, the bounding box in green corresponds to the location of the detected car, yellow represents the cyclist, and blue represents the pedestrian. The position of the yellow circle represents the part detected by SECOND error detection and PomageNet detection. The red circle represents the error detection of the SECOND algorithm. From the detection results of some typical scenarios in Figure 11, it provides an intuitive comparison of the detection results of the three methods. Its average precision is significantly better than its baseline. Compared with CLOCs, our method achieves improvements of 1.28%, 8.40%, and 3.64% across the three splits; and compared with SECOND, the gains are 6.16%, 11.13%, and 8.52%, respectively.
In addition, from the BEV view, the advantages of our network are even more apparent. As shown in Table 3, PomageNet showed varying degrees of improvement in detection results when faced with three detection difficulties. Bolded results represent the best results. Relatively, blue color represents the second best result. Compared with SECOND, the results have increased by 9.70% and 8.70%, respectively. Compared to CLOCs detected by fusion, the experimental result also increased by 5.36% and 2.00%, respectively.

4.3. Ablation Studies

As shown in Table 4, comparative experiments were conducted on the pedestrian and cyclist splits of the Kitti dataset to investigate the contributions of various parts of PomageNet to network performance. In this study, we apply the SECOND network as the baseline to explore this issue. The joint application of channel attention encoding (CAE) and scale attention encoding (SAE) in the following table is equivalent to the application of multi-dimensional joint attention encoding mentioned. The detection results under moderate difficulty conditions are summarized below:
From Table 4, we can conclude that fusion of 2D images contributes the most to the improvement of model performance, with improvements of 6.35% and 8.55% on the pedestrian and cyclist splits. This further proves that the improvement of the model performance of PomageNet in small-sized object detection depends on the fusion of image and point cloud data. A significant contribution is the multi-dimensional attention joint encoding module proposed in this paper. When channel attention encoding and scale attention encoding are applied simultaneously, the average precision of PomageNet is improved by 1.99% and 1.90%.
We examine further the role played by different data selection strategies on performance within the data filtering framework. The proposed method is derived from the semantic consistency between images and point clouds. Hence, maintaining the value of IoU greater than zero during the initial data filtering phase is essential. Our analysis specifically focuses on how the normalized distance from the radar to targets affects model performance. To facilitate systematic processing, we normalized this parameter during the construction of the joint tensor representation. The experimental results, shown quantitatively, are presented in Table 5:
As shown in Table 5, d denotes the normalized distance (range: [0,1]). Under the controlled experimental configuration with other modules remaining unchanged, we systematically evaluated different distance intervals on the car split of the KITTI dataset. The empirical results demonstrate that the average precision peaks at 83.64% when constraining the operational range to 0.4 < d < 0.9.

4.4. Deep Exploration

Further experiments were conducted to demonstrate the performance of PomageNet in multiple dimensions. The previous experiment was conducted under the condition of 40 recalls according to the official Kitti standard. Correspondingly, we also conducted comparative experiments on object detection under the condition of 11 recall, another commonly used benchmark.
Figure 12 compares the detection results of SECOND, CLOCs, and PomageNet on car splits during 11 recalls and 40 recalls. The results were compared with the moderate detection difficulty. The results of 3D detection are shown in (a), while the detection results from the BEV perspective are presented in (b). Under 11Recall, the performance of PomageNet is still higher than that of SECOND and CLOCs.
As shown in Table 6, to verify the strong generalizability of our method, we replaced the 3D backbone of PomageNet with PointPillars and conducted experiments on the replaced method. Consequently, our method can effectively improve the performance of the original 3D backbone by fusing 2D images. The data in the table also reflect that the fusion results of our method are largely dependent on the original average precision of the 3D backbone. The data labeled in blue background indicates the values boosted by our method.
We further analyzed the latency and parameter volume of our method, as illustrated in Figure 13. In conjunction with the previous detection results on the KITTI dataset, our method achieved a substantial performance improvement over CLOCs, with only marginal increases in parameter count (by 0.28 M) and latency (by 2.34 ms). Specifically, the improvements reached 1.28% for cars, 8.40% for cyclists, and 3.64% for pedestrians.

5. Conclusions

A novel and effective 3D object detection framework, PomageNet, which employs image and point cloud post-fusion, was proposed to enhance average precision. Our approach leverages the inherent semantic consistency between 2D image features and 3D point cloud representations of the same object and applies 2D detection results to guide and refine 3D predictions. Specifically, raw confidence scores were extracted from both 2D and 3D detection outputs. Then, the IoU was calculated from the 2D candidate boxes, and the 3D bounding boxes were projected onto the image plane. Subsequently, candidate pairs with IoU values exceeding zero were retained as semantically consistent object proposals. Following secondary screening, these proposal pairs were aggregated to construct a joint tensor. In addition, a dual-branch fusion network with multi-dimensional joint attention encoding was introduced to comprehensively integrate cross-modal features from the joint tensor. The refined features were subsequently fed into the detection head to optimize the final 3D detection. The experimental results show that PomageNet significantly outperforms its 3D baseline, achieving a 7.16% improvement in detection results. Notably, compared with CLOCs, the framework exhibits enhanced performance in detecting small-scale objects, with mAP gains of 8.40% and 3.64% on the cyclist and pedestrian splits.
PomageNet is a novel and high-performance network. However, it also presents two primary limitations. The current implementation restricts end-to-end multi-category detection due to the constraints in loss function computation, which only ensures valid optimization for a single category. Potential performance gains may be further unlocked by integrating more robust 3D baseline architectures. These aspects constitute promising directions for future refinement of the framework.

Author Contributions

Conceptualization, J.L.; methodology, J.L.; software, J.L.; validation, J.L.; formal analysis, J.L.; investigation, J.L.; resources, J.L.; data curation, Y.Q.; writing—original draft preparation, J.L.; writing—review and editing, J.L.; visualization, J.L.; supervision, S.W. and L.C.; project administration, S.W.; funding acquisition, S.W. All authors have read and agreed to the published version of the manuscript.

Funding

This work is supported by the Social Welfare Science and Technology Project of Zhongshan Science and Technology Bureau (2023SYF05) and the Innovation Team Project of Zhongshan Science and Technology Bureau (CXTD2023002).

Data Availability Statement

Data underlying the results presented in this paper are not publicly available at this time but may be obtained from the author upon reasonable request.

Acknowledgments

The authors wish to thank the anonymous reviewers and the associated editor for their valuable suggestions.

Conflicts of Interest

Author Lang Chen was employed by the company PONOVO POWER CO., LTD. The remaining authors declare that the research was conducted in the absence of any commercial or financial relationships that could be construed as a potential conflict of interest.

References

  1. Qi, C.R.; Su, H.; Mo, K.; Guibas, L.J. PointNet: Deep Learning on Point Sets for 3D Classification and Segmentation. In Proceedings of the IEEE Conference on Computer Vision and Pattern Recognition, Honolulu, HI, USA, 21–26 July 2017; pp. 77–85. [Google Scholar]
  2. Qi, C.R.; Li, Y.; Su, H.; Guibas, L.J. PointNet++: Deep Hierarchical Feature Learning on Point Sets in a Metric Space. In Advances in Neural Information Processing Systems; Curran Associates Inc.: Red Hook, NY, USA, 2017; pp. 5105–5114. [Google Scholar]
  3. Shi, S.; Wang, X.; Li, H. Pointrcnn: 3d object proposal generation and detection from point cloud. In Proceedings of the IEEE/CVF Conference on Computer Vision and Pattern Recognition, Long Beach, CA, USA, 15–20 June 2019; pp. 770–779. [Google Scholar]
  4. Zhou, Y.; Tuzel, O. VoxelNet: End-to-end learning for point cloud based 3d object detection. In Proceedings of the IEEE Conference on Computer Vision and Pattern Recognition, Salt Lake City, UT, USA, 18–23 June 2018; pp. 4490–4499. [Google Scholar]
  5. Yan, Y.; Mao, Y.; Li, B. Second: Sparsely embed-ded convolutional detection. Sensors 2018, 18, 3337. [Google Scholar] [CrossRef] [PubMed]
  6. Lang, A.H.; Vora, S.; Caesar, H.; Zhou, L.; Yang, J.; Beibom, O. PointPillars: Fast encoders for object detection from point clouds. In Proceedings of the lEEE/CVF Conference on Computer Vision and Pattern Recognition, Long Beach, CA, USA, 15–20 June 2019; pp. 12697–12705. [Google Scholar]
  7. Shi, S.; Guo, C.; Jiang, L.; Wang, Z.; Shi, J.; Wang, X.; Li, H. PV-RCNN: Point-Voxel Feature Set Abstraction for 3D Object Detection. In Proceedings of the 2020 IEEE/CVF Conference on Computer Vision and Pattern Recognition (CVPR), Seattle, WA, USA, 13–19 June 2020; pp. 2849–2858. [Google Scholar]
  8. Graham, B.; Engelcke, M.; van der Maaten, L. 3D Semantic Segmentation with Submanifold Sparse Convolutional Networks. In Proceedings of the 2018 IEEE/CVF Conference on Computer Vision and Pattern Recognition, Salt Lake City, UT, USA, 18–23 June 2018; pp. 9224–9232. [Google Scholar]
  9. Zhou, H.; Ge, Z.; Liu, S. SparseBEV: High-performance sparse 3D object detection for autonomous driving. In Proceedings of the 2023 IEEE/CVF Conference on Computer Vision and Pattern Recognition, Vancouver, BC, Canada, 17–24 June 2023; pp. 18000–18009. [Google Scholar]
  10. Li, B.; Guo, Q.; Chen, X. DynamicVoxelNet: Efficient 3D Object Detection with Dynamic Voxelization. In Proceedings of the 2022 IEEE International Conference on Intelligent Robots and Systems (IROS), Kyoto, Japan, 23–27 October 2022; pp. 12345–12352. [Google Scholar]
  11. Chen, X.; Kundu, K.; Zhang, Z.; Ma, H.; Fidler, S.; Urtasun, R. Monocular 3D Object Detection for Autonomous Driving. In Proceedings of the 2016 IEEE Conference on Computer Vision and Pattern Recognition, Las Vegas, NV, USA, 27–30 June 2016; pp. 2147–2156. [Google Scholar]
  12. Xie, E.; Yu, Z.; Zhou, D. M2BEV: Multi-Camera Joint 3D Detection and Segmentation with Unified Bird’s-Eye View Representation. In Proceedings of the 2022 IEEE/CVF Conference on Computer Vision and Pattern Recognition, New Orleans, LA, USA, 18–24 June 2022; pp. 17642–17651. [Google Scholar]
  13. Yang, J.; Xie, E.; Wang, M. FocalFormer3D: Focusing on Hard Instance for 3D Object Detection. In Proceedings of the 2023 IEEE/CVF Conference on Computer Vision and Pattern Recognition, Vancouver, BC, Canada, 17–24 June 2023; pp. 17644–17653. [Google Scholar]
  14. Qi, C.R.; Liu, W.; Wu, C.; Su, H.; Guibas, L.J. Frustum PointNets for 3D Object Detection from RGB-D Data. In Proceedings of the 2017 IEEE Conference on Computer Vision and Pattern Recognition, Honolulu, HI, USA, 21–26 July 2017; pp. 1097–1105. [Google Scholar]
  15. Zhang, X.; Chen, Y.; Liu, Z. SIFRNet: Semantic-aware image fusion for robust autonomous driving. In Proceedings of the 2023 IEEE Conference on Computer Vision and Pattern Recognition, Vancouver, BC, Canada, 17–24 June 2023; pp. 1120–1129. [Google Scholar]
  16. Chen, B.; Liu, D.; Chan, S.H.; Li, Q. MV3D: Multi-view 3D detection for autonomous driving. In Proceedings of the 2017 IEEE Conference on Computer Vision and Pattern Recognition, Honolulu, HI, USA, 21–26 July 2017; pp. 755–763. [Google Scholar]
  17. Ku, J.; Mozifian, M.; Lee, J.; Harakeh, A.; Waslander, S.L. AVOD: Aggregate view object detection for autonomous driving. In Proceedings of the 2018 IEEE Conference on Computer Vision and Pattern Recognition, Salt Lake City, UT, USA, 18–23 June 2018; pp. 2000–2008. [Google Scholar]
  18. Wu, B.; Wan, A.; Yue, X.; Keutzer, K. SqueezeSeg: Convolutional neural nets with recurrent CRF for real-time road-object segmentation from 3D LiDAR point cloud. In Proceedings of the IEEE International Conference on Robotics and Automation, Brisbane, QLD, Australia, 21–25 May 2018; pp. 1887–1893. [Google Scholar]
  19. Park, S.; Kim, Y.; Shin, J.; Jeon, H. 3D-CVF: 3D cross-view fusion for multi-modal autonomous driving perception. In Proceedings of the 2023 IEEE Conference on Computer Vision and Pattern Recognition, Vancouver, BC, Canada, 17–24 June 2023; pp. 10000–10009. [Google Scholar]
  20. Vora, S.; Lang, A.H.; Helou, B.; Beijbom, O. Pointpainting: Se-quential fusion for 3d object detection. In Proceedings of the IEEE/CVF Conference on Computer Vision and Pattern Recognition, Seattle, WA, USA, 13–19 June 2020; pp. 4604–4612. [Google Scholar]
  21. Xie, E.; Liu, C.; Wang, Z.; Li, W.; Loy, C.C.; Lin, D.; Luo, P. EPNet: Enhancing point features with image semantics for 3D object detection. In Proceedings of the 2020 European Conference on Computer Vision, Glasgow, UK, 23–28 August 2020; pp. 35–52. [Google Scholar]
  22. Liang, M.; Yang, B.; Hu, R.; Chen, Y.; Casas, S.; Urtasun, R. LaserNet++: Learning 3D Lane Detection from Weak Labels via Adaptive Temporal Modeling. In Proceedings of the 2020 IEEE/CVF Conference on Computer Vision and Pattern Recognition, Seattle, WA, USA, 13–19 June 2020; pp. 13487–13496. [Google Scholar]
  23. Lee, L.; Kim, M. DVLO: Deep Visual-LiDAR Odometry for Autonomous Vehicles. In Proceedings of the 2023 IEEE International Conference on Autonomous Systems, Barcelona, Spain, 13–17 March 2023; pp. 112–119. [Google Scholar]
  24. Wang, Y.; Zhao, H.; Chen, Q. AssociationNet: End-to-End Learning for Multi-Object Association in Autonomous Driving. In Proceedings of the 2021 IEEE/CVF International Conference on Computer Vision, Montreal, QC, Canada, 10–17 October 2021; pp. 12345–12355. [Google Scholar]
  25. Pang, S.; Morris, D.; Radha, H. Clocs: Camera-lidar object candidates fusion for 3d object detection. In Proceedings of the 2020 IEEE/RSJ International Conference on Intelligent Robots and Systems, Las Vegas, NV, USA, 24 October 2020–24 January 2021; pp. 10386–10393. [Google Scholar]
  26. Yang, Z.; Sun, Y.; Chen, L. Fast-CLOCs: Fast Camera-LiDAR Object Candidates Fusion for Robust 3D Object Detection. In Proceedings of the 2022 IEEE International Conference on Robotics and Automation (ICRA), Philadelphia, PA, USA, 23–27 May 2022; pp. 5678–5685. [Google Scholar]
  27. Sgaravatti, C.; Basla, R.; Pieroni, R.; Corno, M.; Savaresi, S.; Magri, L.; Boracchi, G. A Multimodal Hybrid Late-Cascade Fusion Network for Enhanced 3D Object Detection. In Proceedings of the Proceedings of the European Conference on Computer Vision (ECCV) Workshops, Milan, Italy, 29 September–4 October 2024; pp. 339–356. [Google Scholar]
  28. Xu, X.; Dong, S.; Zhou, Y.; Xu, T.; Ding, L.; Wang, J.; Jiang, P.; Song, L.; Li, J. FusionRCNN: LiDAR-Camera Fusion for Two-Stage 3D Object Detection. Remote Sens. 2023, 15, 1839. [Google Scholar] [CrossRef]
  29. Shi, P.; Liu, Z.; Dong, X.; Yang, A. CL-fusionBEV: 3D Object Detection Method with Camera-LiDAR Fusion in Bird’s Eye View. Complex Intell. Syst. 2024, 10, 7681–7696. [Google Scholar] [CrossRef]
  30. Mushtaq, H.; Deng, X.; Azhar, F.; Ali, M.; Sherazi, H. PLC-Fusion: Perspective-Based Hierarchical and Deep LiDAR-Camera Fusion for 3D Object Detection in Autonomous Vehicles. Information 2024, 15, 739. [Google Scholar] [CrossRef]
  31. Wu, Z.; Ye, M.; Zhang, Y.; Sun, W.; Zhao, T. BAFusion: Bidirectional Attention Fusion for 3D Object Detection Based on LiDAR and Camera. Sensors 2024, 24, 4718. [Google Scholar] [CrossRef] [PubMed]
  32. Xie, Y.; Xu, C.; Rakotosaona, M.; Rim, P.; Tombari, F.; Keutzer, K.; Tomizuka, M.; Zhan, W. SparseFusion: Fusing Multi-Modal Sparse Representations for Multi-Sensor 3D Object Detection. In Proceedings of the IEEE/CVF International Conference on Computer Vision (ICCV), Paris, France, 1–6 October 2023; pp. 17591–17602. [Google Scholar]
  33. Cai, H.; Zhang, Z.; Zhou, Z.; Lin, Z.; Ding, W.; Zhao, J. BEVFusion4D: Learning LiDAR-Camera Fusion Under Bird’s-Eye-View via Cross-Modality Guidance and Temporal Aggregation. arXiv 2023, arXiv:2301.09561. [Google Scholar]
  34. Jiao, Y.; Jie, Z.; Chen, S.; Chen, J.; Ma, L.; Jiang, Y. MSMDFusion: Fusing LiDAR and Camera at Multiple Scales with Multi-Depth Seeds for 3D Object Detection. In Proceedings of the IEEE/CVF Conference on Computer Vision and Pattern Recognition (CVPR), Vancouver, BC, Canada, 17–24 June 2023; pp. 21643–21652. [Google Scholar]
  35. Liu, Z.; Tang, H.; Amini, A.; Yang, X.; Mao, H.; Rus, D.; Han, S. BEVFusion: Multi-Task Multi-Sensor Fusion with Unified Bird’s-Eye View Representation. arXiv 2023, arXiv:2205.13542. [Google Scholar]
  36. Gong, R.; Fan, X.; Cai, D.; Lu, Y. Sec-CLOCs: Multimodal Back-End Fusion-Based Object Detection Algorithm in Snowy Scenes. Sensors 2024, 24, 7401. [Google Scholar] [CrossRef] [PubMed]
  37. Song, Z.; Zhang, G.; Xie, J.; Liu, L.; Jia, C.; Xu, S. VoxelNextFusion: A Simple, Unified and Effective Voxel Fusion Framework for Multi-Modal 3D Object Detection. IEEE Trans. Geosci. Remote Sens. 2023, 61, 5705412. [Google Scholar] [CrossRef]
  38. Cai, Z.; Vasconcelos, N. Cascade R-CNN: Delving into High Quality Object Detection. In Proceedings of the 2018 IEEE/CVF Conference on Computer Vision and Pattern Recognition (CVPR), Seattle, WA, USA, 18–23 June 2018; pp. 6154–6162. [Google Scholar]
  39. Geiger, A.; Lenz, P.; Urtasun, R. Are we ready for autonomous driving? the kitti vision benchmark suite. In Proceedings of the IEEE Conference on Computer Vision and Pattern Recognition, Providence, RI, USA, 16–21 June 2012; pp. 3354–3361. [Google Scholar]
  40. Shi, W.; Rajkumar, R. Point-GNN: Graph neural network for 3D object detection in a point cloud. In Proceedings of the IEEE/CVF Conference on Computer Vision and Pattern Recognition, Seattle, WA, USA, 13–19 June 2020; pp. 1711–1719. [Google Scholar]
  41. Meng, X.; Zhou, Y.; Du, K.; Ma, J.; Meng, J.; Kumar, A. EFNet: Enhancing feature information for 3D object detection in LiDAR point clouds. J. Opt. Soc. Am. A 2024, 4, 739–748. [Google Scholar] [CrossRef] [PubMed]
  42. Yang, Z.; Sun, Y.; Liu, S.; Jia, J. 3DSSD: Point-Based 3D Single Stage Object Detector. In Proceedings of the IEEE/CVF International Conference on Computer Vision, Montreal, QC, Canada, 10–17 October 2020; pp. 11037–11045. [Google Scholar]
  43. Xie, L.; Xiang, C.; Yu, Z. PI-RCNN: An Efficient Multi-sensor 3D Object Detector with Point-based Attentive Cont-conv Fusion Module. arXiv 2019, arXiv:1911.06084. [Google Scholar] [CrossRef]
  44. Zhang, Z.; Shen, Y.; Li, H.; Zhao, X.; Yang, M.; Tan, W.; Pu, S.; Mao, H. Maff-net: Filter false positive for 3d vehicle detection with multi-modal adaptive feature fusion. In Proceedings of the IEEE 25th International Conference on Intelligent Transportation Systems, Gold Coast, Australia, 18 November–21 November 2022; pp. 369–376. [Google Scholar]
  45. Pan, X.-R.; Xia, Z.-F.; Song, J.; Li, E.; Huang, G. 3D Object Detection with Pointformer. arXiv 2021, arXiv:2012.11409. [Google Scholar]
  46. Liu, Z.; Wu, Z.; Tóth, R. SMOKE: Single-Stage Monocular 3D Object Detection via Keypoint Estimation. In Proceedings of the 2020 IEEE/CVF Conference on Computer Vision and Pattern Recognition, Seattle, WA, USA, 13–19 June 2020; pp. 996–1005. [Google Scholar]
  47. Brazil, G.; Liu, X. M3D-RPN: Monocular 3D Region Proposal Network for Object Detection. In Proceedings of the 2019 IEEE/CVF International Conference on Computer Vision, Seoul, Republic of Korea, 27 October–2 November 2019; pp. 9286–9295. [Google Scholar]
  48. Chong, Z.; Ma, X.; Zhang, H.; Yue, Y.; Li, H.; Wang, Z.; Ouyang, W. Monodistill: Learning spatial features for monocular 3d object detection. arXiv 2022, arXiv:2201.10830. [Google Scholar]
  49. Brazil, G.; Liu, X. Frustum ConvNet: Sliding Frustums to Aggregate Local Point-Wise Features for Amodal 3D Object Detection. In Proceedings of the 2019 IEEE/CVF Conference on Computer Vision and Pattern Recognition (CVPR), Long Beach, CA, USA, 15–20 June 2019; pp. 9286–9295. [Google Scholar]
  50. Yang, Z.; Sun, Y.; Shu, L.; Shen, X.; Jia, J. IPOD: Intensive Point-based Object Detector for Point Cloud. arXiv 2018, arXiv:1812.05276. [Google Scholar]
Figure 1. A LiDAR–camera fusion-enabled ground surveillance robot.
Electronics 14 02414 g001
Figure 2. Average precision of fusion detection approaches on the KITTI dataset.
Electronics 14 02414 g002
Figure 3. The overall architecture of PomageNet.
Electronics 14 02414 g003
Figure 4. Two-dimensional detection and projected 3D detection.
Electronics 14 02414 g004
Figure 5. Architectural configurations of both 2D and 3D detection frameworks. (a) Architecture of the two-dimensional detector. (b) Architecture of the three-dimensional detector.
Electronics 14 02414 g005
Figure 6. The screening process of the joint tensor.
Electronics 14 02414 g006
Figure 7. Fusion network.
Electronics 14 02414 g007
Figure 8. Multi-dimensional joint attention encoding module.
Electronics 14 02414 g008
Figure 9. Channel attention encoding module in the fusion network.
Electronics 14 02414 g009
Figure 10. Scale attention encoding module.
Electronics 14 02414 g010
Figure 11. Visualization of the KITTI dataset.
Electronics 14 02414 g011
Figure 12. Comparison of detection results on car split during Recall and 40Recall. (a) Three-dimensional detection. (b) Bird’s-eye view detection.
Electronics 14 02414 g012
Figure 13. Latency and parameter volume analysis.
Electronics 14 02414 g013
Table 1. Comparison experiment of the average precision of the car split model on the Kitti dataset.
MethodsModality3D AP(%)Bird’s Eye View AP(%)
EasyModHardEasyModHard
VoxelNet [4]L81.7965.4662.8589.6084.8178.57
PointPillars [6]L86.9977.1274.9889.7787.0283.71
Point-GNN [40]L87.8978.3477.3889.8288.3187.16
MV3D [16]L71.0962.3557.7386.0276.9068.49
AVOD [17]F73.5965.7858.3886.8085.4477.73
AVOD(Fp) [17]F81.9471.8866.3888.5383.7977.90
F-PointNet [14]F81.2070.3962.1988.7084.0075.33
EFNet [41]L86.7177.2575.7389.6687.2785.61
SECOND [5]L87.4376.4869.1095.6189.5486.96
3DSSD [42]L88.3679.5774.55N/AN/AN/A
EPNet [21]F92.2882.5980.14N/AN/AN/A
PV-RCNN [7]L92.1084.3682.48N/AN/AN/A
PI-RCNN [43]L88.2778.5377.75N/AN/AN/A
MAFF [44]F88.8879.3774.6889.3186.6189.72
Pointformer [45]L90.0579.6578.8995.6890.7788.46
CLOCs(SM) [25]F92.3782.3678.2396.3492.5987.81
SMOKE [46]M14.7612.811.5019.9915.6115.28
M3D-RPN [47]M20.4016.4813.3426.8621.1517.14
MonoDIS [48]M18.0514.9813.4224.2618.4318.43
F-ConvNet [49]F84.1668.8860.05N/AN/AN/A
PomageNetF92.9583.6480.2296.6692.7389.88
Table 2. Comparison experiment of average precision of cyclist and pedestrian split models on the Kitti dataset.
MethodsModalityCyclistPedestrian
EasyModHardEasyModHard
SECOND [5]L78.50 56.7452.8358.01 51.8847.05
VoxelNet [4]L81.9765.4662.8557.8653.4248.87
PointPillars [6]L82.3159.3355.2558.5351.4245.20
IPOD [50]F78.19 59.4051.3860.88 49.7945.43
F-PointNet [14]F77.26 61.3753.7857.13 49.5745.48
AVOD-FPN [17]F69.39 57.1251.0958.49 50.3246.98
F-ConvNet [49]F84.16 68.8860.0557.04 48.9644.33
Painted(PR) [20]F83.91 71.5462.9758.70 49.9346.29
CLOCs(SM) [25]F85.4759.4755.0062.5456.7652.26
PomageNetF89.1467.8763.6668.3460.4054.22
Table 3. Comparison experiment of average precision from the BEV perspective on cyclist and pedestrian split on the Kitti dataset.
MethodsModalityCyclistPedestrian
EasyModHardEasyModHard
SECOND [5]L81.9159.3355.5361.97 56.77 51.27
PointPillars [6]L84.6567.3957.2866.97 59.45 53.42
CLOCs(SM) [25]F88.9663.4059.8169.35 63.47 58.93
PomageNetF91.7369.0364.1571.6265.4759.21
Table 4. The impact of individual components within PomageNet.
2D-3D FusionData SelectionCAESAEPedestrian AP (%)Cyclist AP (%)
51.8856.74
58.2365.29
58.4165.77
59.2766.34
58.6666.26
60.4067.87
Table 5. Average precision variation with LiDAR–object distance (%).
d > 0.1d > 0.2d > 0.3d > 0.4
d < 0.983.2783.3283.5883.64
d < 0.883.2183.3283.5383.60
d < 0.783.2283.3183.5383.58
d < 0.683.1883.3183.5283.58
Table 6. Three-dimensional detection and BEV average precision of PomageNet under different backbones on the car split.
Methods3D AP(%)Bird’s Eye View AP(%)
EasyModHardEasyModHard
SECOND [5]87.43 76.4869.10 95.6189.5486.96
PomageNet92.9583.6480.2296.6692.7389.88
+5.52+7.16+11.12+1.05+3.19+2.92
PointPillars [6]86.9977.1274.9889.7787.0283.71
PomageNet89.9779.6476.4291.4588.3684.28
+2.98+2.52+1.44+1.68+1.34+0.57
Disclaimer/Publisher’s Note: The statements, opinions and data contained in all publications are solely those of the individual author(s) and contributor(s) and not of MDPI and/or the editor(s). MDPI and/or the editor(s) disclaim responsibility for any injury to people or property resulting from any ideas, methods, instructions or products referred to in the content.

