1. Introduction
Modern enterprise networks face a wide range of evolving threats driven by increased connectivity, cloud adoption, and remote work environments. These threats include sophisticated malware, ransomware, phishing, and insider attacks, as well as advanced persistent threats (APTs). Attackers often leverage lateral movement and privilege escalation to navigate internal networks undetected. In addition, enterprises are increasingly targeted by zero-day exploits, making timely threat detection and response more critical than ever. The complexity and scale of modern IT infrastructures further amplify these risks, challenging traditional security defenses.
In this paper, we focus on the problem of finding the network exposure surface [
1,
2,
3,
4] for enterprise networks, one of the basic threats that is the foundation of advanced threats. Network exposure surface refers to the sum of network assets that are directly exposed and accessed by external entities on the Internet. These exposed assets are critical to enterprise security protection [
5], as they easily become primary targets for potential attackers. Accurately identifying and managing the network exposure surface is the foundation of network security defense, which can effectively reduce the risk of enterprises suffering from network attacks.
However, existing methods for analyzing the network exposure surface have significant limitations. Traditional packet testing methods [
6,
7], while effective in specific scenarios, face serious combinatorial explosion problems. In IPv4 network environments, when testing exposed assets that can be reached by external traffic entering through different interfaces, the number of test cases that need to be constructed grows exponentially, resulting in inefficiency and incomplete coverage at enterprise network scales. On the other hand, firewall-based static analysis methods [
8,
9] simply analyze the firewall policies to compute the network exposure surface. Although computationally efficient, the firewall policy-only methods generate false positives due to ignoring potential routing behaviors and other security measures within the network, reducing the credibility of analysis results.
To address these problems, we present an accurate and efficient network-based static analysis method of the network exposure surface in enterprise networks. Instead of simply analyzing firewall policies, we construct a global device-level forwarding graph to model both the forwarding behaviors and the security policies in enterprise networks with switches and firewalls. The device-level forwarding graph takes the physical and logical forwarding features, such as Forwarding Information Base (FIB), Virtual Routing and Forwarding (VRF), Virtual System (VSYS), and Zone policies, into account, and builds a fine-grained element-level model with the Forwarding (FWD) element characterizing FIB, VRF, and VSYS and the Filtering (FLT) element characterizing Zone policies. The precise network-level modeling of complex forwarding behaviors enables accurate analysis of the network exposure surface.
Furthermore, we provide an efficient network exposure surface analysis algorithm based on the proposed forwarding graph model. In particular, the algorithm takes the Internet-facing ingress interfaces as input, and traverses the forwarding graph using Breadth-First Search (BFS) to find all reachable endpoint interfaces. By checking against the associated network assert information in these endpoint interfaces, the algorithm can find all reachable network asserts, and find all network exposure surfaces. To improve the efficiency, we further present the multi-thread BFS (MTBFS) algorithm with two parallel mechanisms that are based on parallel starting interfaces and parallel neighboring interface exploration. Experimental results show that this method can significantly improve the efficiency of network exposure surface analysis in large-scale network environments while ensuring high accuracy. Considering a network with 7970 switches and 16 Internet-facing interfaces, our MTBFS algorithm achieves 20x speedup over the naive BFS/Depth-first search (DFS) algorithms.
Overall, this paper makes the following contributions:
We present a forwarding graph model that captures fine-grained forwarding and filtering behaviors of switches and firewalls, enabling accurate network exposure surface analysis.
We design a parallel BFS-based traversal algorithm to efficiently identify reachable assets from Internet-facing interfaces within the forwarding graph.
We evaluate our approach on large-scale networks, demonstrating both its accuracy and a 20× speedup over baseline algorithms.
The rest of the paper is organized as follows.
Section 2 presents the Related Work.
Section 3 presents the background of enterprise networks and the motivation for our new approach.
Section 4 overviews the system based on our new approach.
Section 5 and
Section 6 provide the detailed model and algorithm design.
Section 7 provides the performance evaluation results.
Section 9 concludes this paper.
2. Related Work
2.1. Network Exposure Surface Analysis
Network exposure surface analysis services have been offered by several major security vendors [
1,
2] and public cloud providers [
3,
4]. Tools like PING are commonly used to monitor active hosts within enterprise networks [
6]. Ref. [
7] introduces clustering techniques to reduce the analysis workload when applying the PING tool, while ref. [
10] provides a broader set of tools that expand the analysis scope from merely identifying hosts to discovering services running on them. In addition, refs. [
8,
9] analyze firewall configurations to determine reachable hosts and services. However, as discussed in
Section 3, these methods have notable limitations in terms of accuracy and scalability.
Network exposure surface analysis is conceptually related to network attack surface analysis: once vulnerabilities exist in exposed assets, they can be exploited by attackers. The concept of the network attack surface has been extensively studied in recent years. Ref. [
11] advocates for the use of network obfuscation to enlarge the perceived attack surface, thereby diverting attacks away from critical services and reducing their risk. Ref. [
12] uses attack surface metrics to quantify the vulnerability of individual services, and ref. [
13] further extends the notion to encompass diverse types of network resources. Ref. [
10] provides a comprehensive survey of tools for identifying vulnerable services at the host level. An attack graph [
14] is a structured representation that models the possible paths an attacker may take to compromise a system by sequentially exploiting vulnerabilities. Compared to traditional attack surface analysis, attack graphs provide a more advanced view by revealing potential chains of attack behaviors. Numerous techniques have been developed to construct and optimize attack graphs [
15,
16,
17,
18]. More recently, the automated construction of attack graphs has gained increasing attention [
19,
20,
21].
In contrast to these works, our approach aims to identify services exposed to the Internet across an entire enterprise network, and is complementary to existing host- and service-level vulnerability assessment techniques.
2.2. Network Reachability Analysis
Network exposure surface analysis is closely related to network reachability analysis, with a specific focus on identifying reachability from the Internet to internal hosts. Early works such as [
22,
23] pioneered static network reachability analysis. This line of research later evolved into data-plane verification (DPV) techniques [
24,
25,
26,
27,
28,
29], which have become the de facto standard for performing static reachability analysis. These DPV approaches typically construct forwarding graph models, leverage specialized data structures to represent header spaces, and apply customized algorithms to determine reachability. In contrast to prior works, which primarily model switches and routers, our approach explicitly incorporates the detailed behavior of firewalls—an essential component for protecting enterprise networks.
To improve analysis efficiency, equivalence class (EC)-based methods [
30,
31,
32,
33,
34,
35,
36] were introduced to accelerate header space exploration. While effective in some cases, these approaches struggle to scale when the number of packet header fields increases (e.g., when ACL policies are considered) [
29]. Moreover, most EC-based methods are single-threaded and lack parallel execution capabilities. Furthermore, refs. [
37,
38,
39] consider the distributed architecture with multiple servers/switches to accelerate DPV. In contrast, our approach employs a raw computation approach without using the EC model to improve the generality. By leveraging the multi-thread approach in a single server, we significantly enhance performance in analyzing network exposure surfaces in large-scale enterprise networks without using cluster-level computation resources.
3. Background and Motivation
3.1. Preliminary
Modern enterprise networks are designed to provide secure and reliable connectivity both to the Internet and within the organization.
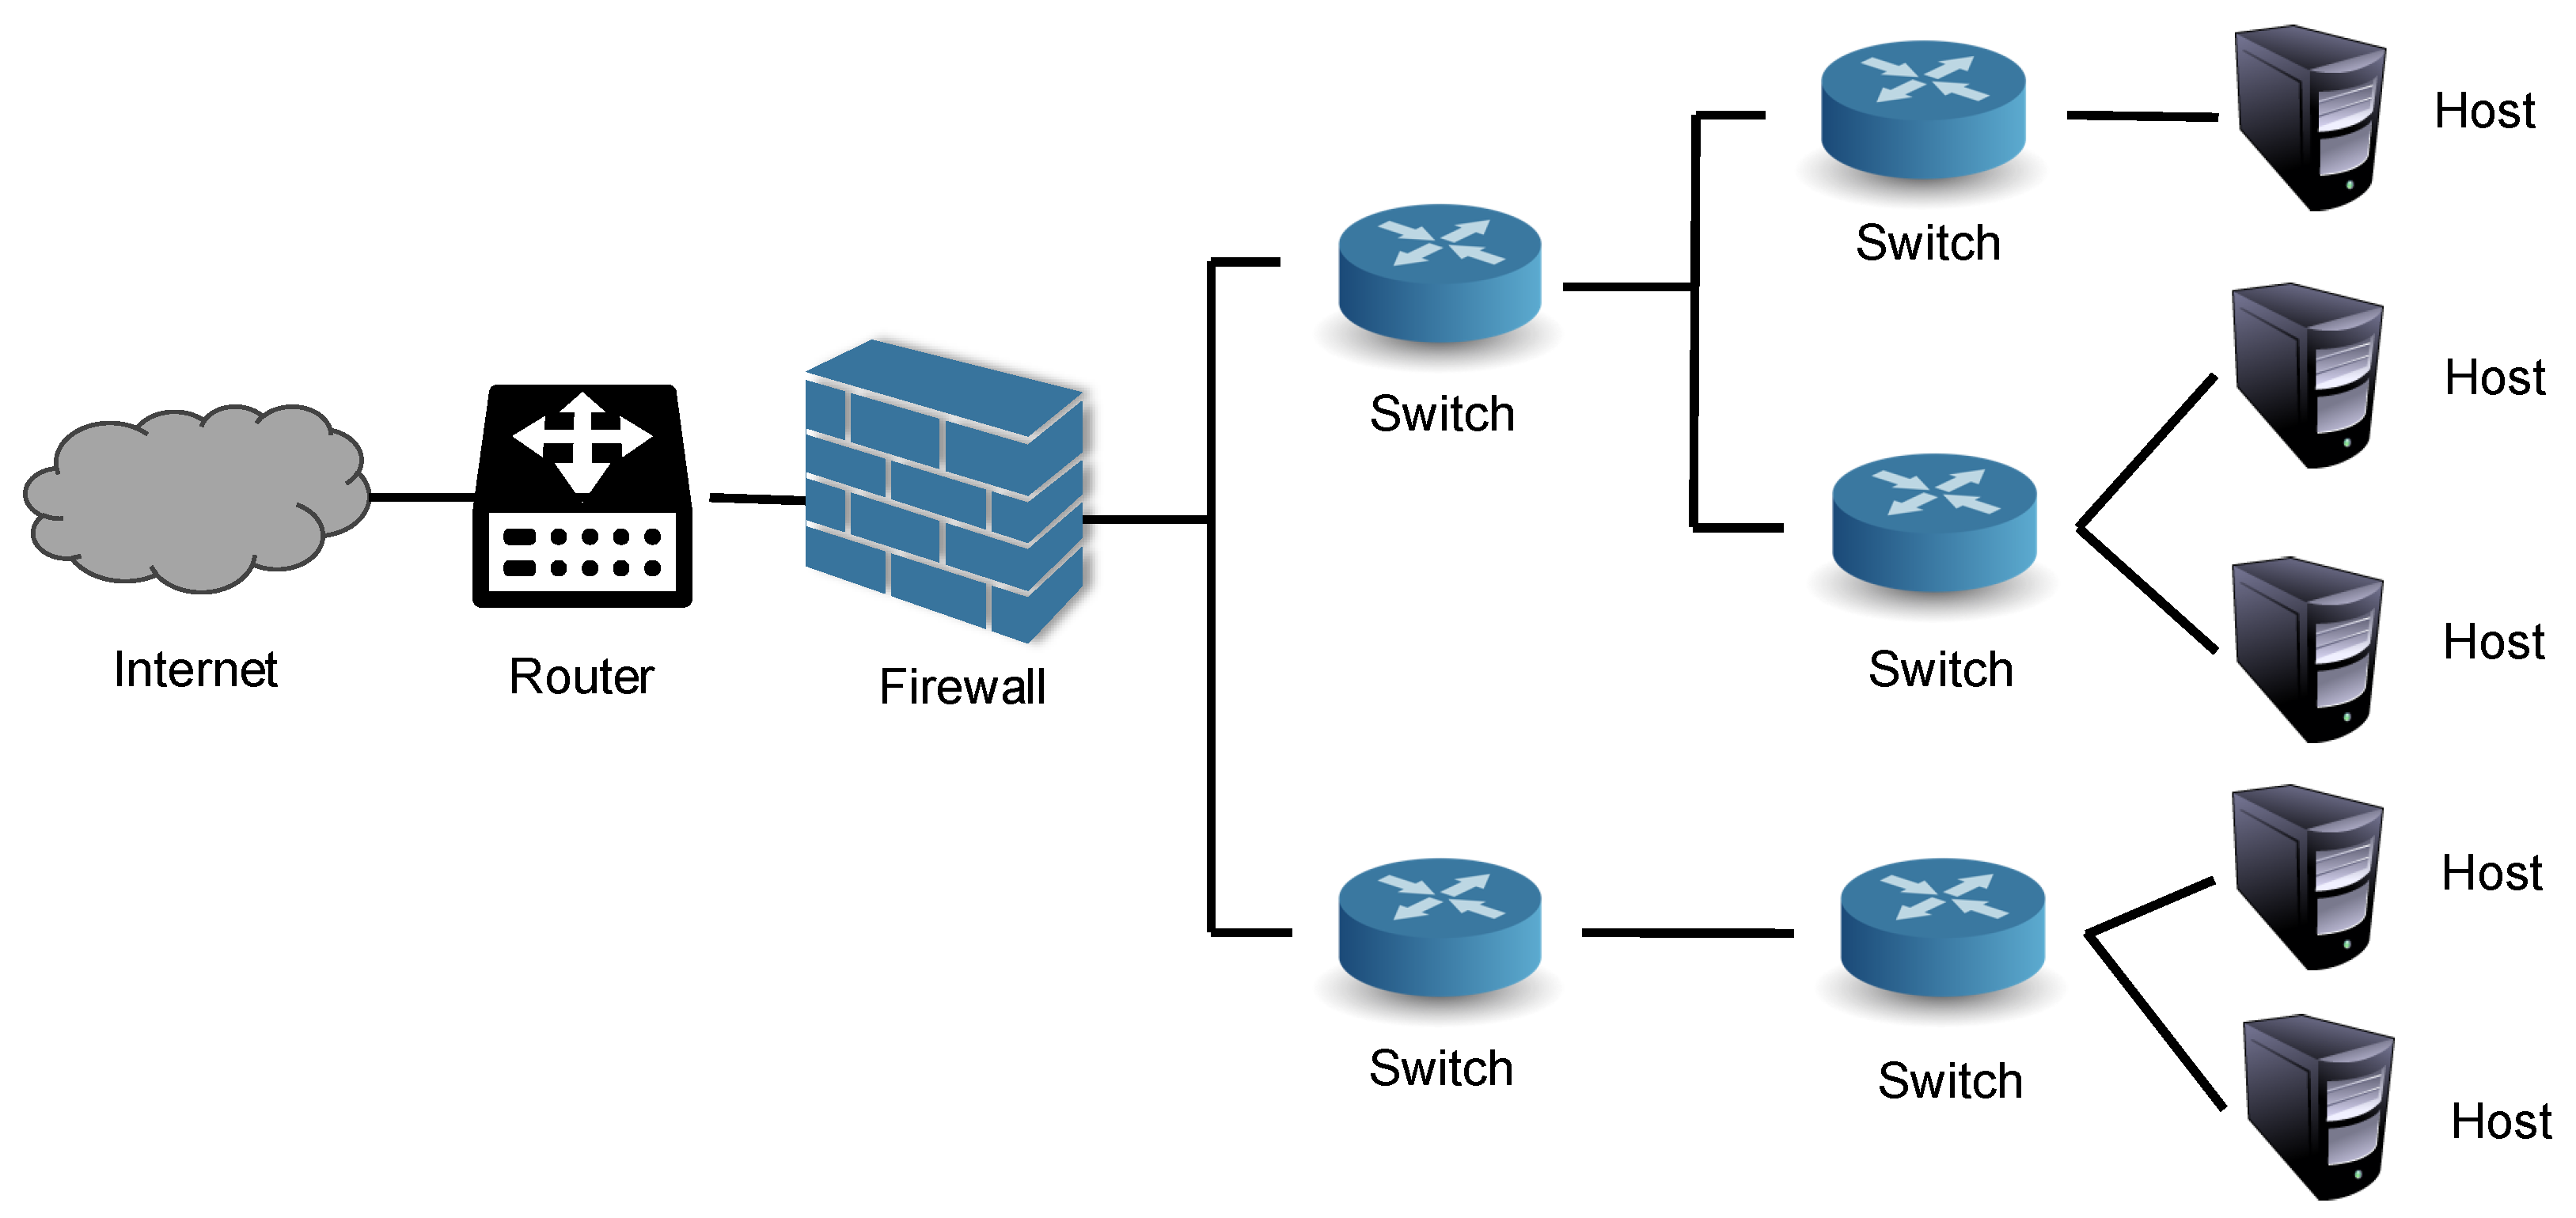
Figure 1 shows a typical structure of an enterprise network. Enterprise networks often adopt the core-aggregation-access three-tier architecture. Recent trends also advocate the spline-leaf two-tier architecture [
40,
41]. At the network boundary, a router is typically deployed to connect the enterprise network to external networks, such as the Internet. Within the organization, switches serve as the primary devices for forwarding data between endpoints (e.g., servers and hosts), where network asserts (services) exist in these endpoints. These switches form the backbone of the internal network, interconnecting servers and hosts, and are commonly arranged in hierarchical layers (e.g., as access, aggregation and core). To protect against external threats, firewalls are strategically placed at the network perimeter. These firewalls inspect and filter data packets based on predefined security policies, playing a critical role in maintaining network integrity and safeguarding sensitive enterprise data.
To support diverse services, modern enterprise network devices are often equipped with advanced features. In the following, we introduce some typical features used in the switch/router and firewall.
3.1.1. Switch/Router
Layer 3 switches are commonly used in modern enterprise networks to support efficient internal routing. Unlike traditional Layer 2 switches, which forward traffic based solely on MAC addresses, Layer 3 switches can make routing decisions using IP addresses, enabling communication between different network segments. Layer 3 switches support dynamic routing protocols like OSPF and BGP, as well as access control lists (ACLs) for traffic filtering. Their functionality closely resembles that of routers, though routers typically offer a broader range of features, such as support for Virtual Private Networks (VPNs) and various WAN protocols. Since our focus is on routing, we do not distinguish between Layer 3 switches and routers in the remainder of this paper. Layer 3 switches and routers have the following important features that affect the packet forwarding:
Forwarding Information Base (FIB). Routers forward packets by consulting a data structure called the Forwarding Information Base (FIB), which is derived from the routing table. When a packet arrives, the router examines its destination IP address and performs a lookup in the FIB to determine the optimal next hop and the corresponding outbound interface. The FIB is optimized for fast lookups and contains only the most relevant routing entries needed for packet forwarding. The routing table may include static routes or dynamic routes learned from routing protocols such as OSPF or BGP.
Virtual Routing and Forwarding (VRF). Virtual Routing and Forwarding (VRF) is a network virtualization technology that allows multiple independent routing table instances to run simultaneously on the same physical switch/router. Each VRF maintains its own FIB, enabling the same IP addresses to coexist in different VRFs without conflict. In network exposure surface analysis, the existence of VRF means that the same target IP may have completely different reachability and security attributes in different routing domains.
3.1.2. Firewall
Firewalls are critical security components in enterprise networks, functioning as stateful or stateless packet filters that enforce security policies at the network perimeter and across internal segments. They inspect packet headers based on criteria such as IP addresses, ports, protocols, and connection states. In large-scale enterprise environments, firewalls play a central role in implementing zero-trust architectures and ensuring compliance with security policies across distributed infrastructures. Firewalls have the following important features that affect the packet forwarding:
Virtual System (VSYS). Virtual System (VSYS) is a logical isolation mechanism provided by modern firewalls, allowing multiple independent virtual firewall instances to be created on a single physical device. Each VSYS has its own configuration, policy set, and management domain, enabling different departments or tenants to maintain security isolation while sharing physical devices. In network exposure surface analysis, the existence of VSYS increases the complexity of analysis, as each virtual system may have different security policies affecting the exposed network assets.
Security Zone. A Security Zone is a logical concept in firewalls used to group network interfaces and define security policies. Typical zone divisions include internal zones (Trust), external zones (Untrust), and DMZ zones. Firewall policies are typically defined based on zone pairs, controlling traffic from source zones to destination zones. In network exposure surface analysis, understanding zone divisions is crucial for accurately assessing the degree of asset exposure, as access control policies between different zones directly determine which assets can be accessed externally.
Figure 2 provides an example of the internal structure of a firewall, which contains a total of four VSYS instances. Each VSYS instance has several ports, and each port belongs to a zone. These attributes, which are different from those of switches, pose challenges to the network exposure surface analysis. We present the relevant designs in
Section 5.
3.2. Limitation of Existing Approaches
There exist several approaches for network exposure surface analysis. However, they have some limitations: the traditional packet testing method has the combinatorial explosion problem, and the firewall-based analysis method has the false positive problem.
3.2.1. Combinatorial Explosion Problem of the Exhaustive Packet Testing Method
The packet testing or traffic injection methods [
6,
7] based on the PING tool are a common approach to verify the reachability of two endpoints. However, the test coverage has an exponential relationship with the network scale. Consider a typical IPv4 network with 24-bit addresses where there are
n interfaces that can receive traffic from the Internet. When testing which exposed assets can be reached by external traffic entering through different interfaces, a total of
test cases need to be constructed.
This combinatorial explosion is particularly severe in enterprise-level network environments. For example, a medium-sized enterprise network may have 10 Internet access points and thousands of network segments. To comprehensively test all possible exposed surfaces, the theoretical number of test data packets that need to be generated would be huge. Even with sampling testing, it is difficult to achieve comprehensive coverage within a reasonable time, resulting in incomplete test results or excessively long test cycles, which cannot meet the timeliness requirements of enterprise security operations.
3.2.2. False Positive Problem of the Firewall-Based Static Analysis Method
General static analysis methods [
8,
9] assume that firewalls can directly reach all target servers, ignoring the blocking effects of potential routing behaviors and other security measures within the network on actual traffic, thus having serious deficiencies in modeling completeness. For example, suppose in an enterprise network, an external firewall allows IP address 192.168.1.100 to access the HTTP service (port 80) of internal server 10.0.0.50, but there is a switch ACL rule in the internal network prohibiting access to port 80 from that IP. The general static analysis models would incorrectly mark this service as an “exposed asset”, when in fact, the service is unreachable.
Such false positives not only require security teams to expend significant manpower on manual verification but may also lead to incorrect allocation of security resources, preventing truly exposed high-risk assets from receiving timely protection. In large enterprise networks, an excessively high false positive rate can cause the credibility of analysis results to collapse, making the method difficult to use in actual security operations.
4. System Overview
To address the above problems, we present an efficient and accurate approach based on fine-grained network modeling to find network exposure surface in enterprise networks. The proposed approach is a static analysis approach that does not inject traffic into the network and avoids the exhaustive testing packet problem, and is more accurate than the firewall-based analysis approach.
Figure 3 illustrates the overall system architecture based on the proposed approach. The system collects physical link information (i.e., network topology) and metadata from network devices, including configurations and FIBs. It also identifies ingress interfaces connected to the Internet and endpoint interfaces connected to hosts. Additionally, the system gathers host asset information (e.g., occupied protocol ports) through either predefined planning data or active host scanning.
Based on the network information, the system constructs a device-level forwarding graph, where each device is represented as a virtual node and decomposed into multiple physical nodes (interfaces). A directional edge is added between two intra-device nodes (interfaces) to indicate that packets can be forwarded from the inbound interface to the outbound interface. For two inter-device nodes (interfaces) connected by a physical link, a bidirectional edge is introduced.
The definition of an intra-device edge is different for switches and firewalls. In particular, each device is modeled as a sequence of processing elements: a switch is represented by a forwarding (FWD) element, while a firewall is represented by an FWD element followed by a filtering (FLT) element. The FWD element captures the forwarding behavior determined by the FIB in both switches and firewalls, while the FLT element captures the filtering behavior enforced by zone policies in firewalls. This modeling approach enables us to construct a comprehensive device-level forwarding graph. The model details are presented in
Section 5.
With the global device-level forwarding graph constructed, the system applies a search algorithm to identify reachable endpoint interfaces from the entrance interfaces. Specifically, the system assumes all packets can start from each entrance interface, and then performs a parallelized analysis to explore all reachable endpoint interfaces with a set of reachable packets. Leveraging the network asset information (e.g., IP, port) associated with these interfaces, the system can determine whether the network assert is in the reachable packet set, and completes the network exposure surface analysis. Details of the search algorithm are provided in
Section 6.
The core design philosophy of this system is summarized as follows: (1) constructing a device-level forwarding graph model considering fine-grained element-level forwarding features to accurately characterize the complex forwarding behavior of network devices, and (2) adopting parallelized analysis techniques to significantly improve analysis efficiency. These design choices avoid the combinatorial explosion problem inherent in traditional packet testing approaches and address the false positive issues common in firewall-based static analysis. As a result, the system provides an accurate and efficient solution for network exposure surface analysis in large-scale, complex enterprise environments.
5. Model Design
This section provides the details of modeling device behaviors as elements, which is essential for accurate analysis of the network exposure surface.
5.1. Overview of the Element Model
To accurately characterize the complex behavior of network devices, we construct a multi-level element model considering both physical and logical features. We define two elementary elements: the Forwarding (FWD) element that models the device forwarding behavior, and the Filtering (FLT) element that models the packet filtering behavior. In particular, firewalls include both the FWD element and the FLT element due to the VSYS and Zone features, while switches focus solely on forwarding decisions of the VRF feature and only have the FWD element.
Each FWD or FLT element has input ports, output ports, and directional edges between the input ports and output ports. In the FWD element, an input port is an inbound interface, while an output port is an outbound interface. Each directional edge allows some packets forwarded from the inbound interface to the outbound interface according to the FIB rules. The FLT element only exists in the firewall. In the FLT element, there are one virtual input port and two virtual output ports (PERMIT and DENY). The input port is characterized by the Zone-pair. Meanwhile, the directional edge from the input port to the PERMIT (DENY) output port carries the permit (deny) packets of the ACL policy associated with the Zone-pair. To connect an FWD element and an FLT element, we need to consider a specific edge in the FWD element with an inbound interface and an outbound interface, find the corresponding source zone (associated with the inbound interface) and target zone (associated with the outbound interface), and connect the edge with the FLT element associated with the Zone-pair .
In addition, we introduce the concept of
header space that denotes the allowed packets from one interface to the other interface. Here, we only focus on the header of a packet, since the payload of a packet usually does not impact the forwarding. Each packer header is represented by a five-tuple (i.e., source IP, destination IP, source port, destination port, protocol type). We adopt the commonly used binary decision diagram (BDD) [
42] to represent a header space. BDD is an efficient data structure to enable fast logic operations of Boolean formulas. There exist other data structures to model the header space and enable computation, e.g., ternary bit vectors [
25,
26], tries/intervals [
30,
33,
34,
43], and ddNF [
32]; however, as shown in [
44], BDDs provide the best trade-off in the ease of tool development and performance. In particular, we consider the five-tuple fields of the packet header, and let each packet header bit be a Boolean variable. For each bit, if the bit value is 1, we let the variable be true; if the bit value is 0, we let the variable be false; if the bit value is not specified, we do not use the variable. In this way, we can convert each forwarding/filtering rule to a Boolean formula, and perform subtraction and aggregation/addition on these Boolean formulas.
Figure 4 shows an example of the device forwarding element model, while the above shows the switch element model and the below shows the firewall element model. The multi-level design can accurately reflect the hierarchical relationships of concepts such as VSYS and Zone in modern firewalls, as well as VRF-based forwarding in switches, thereby achieving precise modeling of complex network behaviors.
5.2. Design of the Forwarding (FWD) Element
The Forwarding element serves as a critical component in our model, primarily responsible for simulating and accurately representing the routing forwarding behavior of network devices. Each VSYS in a firewall or VRF instance in a switch maintains an independent Forwarding element instance, which ensures complete routing isolation between different routing domains.
For the Forwarding element, the input ports are inbound interfaces, and the output ports are outbound interfaces. Each edge carries a packet header space that denotes the allowed packets forwarded from the inbound interface to the outbound interface. The details of these basic units are as follows.
The inbound interfaces comprise all physical interfaces within the VSYS (for firewalls) or VRF (for switches). These interfaces serve as the entry points for traffic into the virtual system or routing domain and maintain their physical attributes throughout the forwarding process.
The outbound interfaces are dynamically determined by the FIB tables within the VSYS or VRF, reflecting the actual forwarding exits that the packets will take.
The packet header space of an edge between an inbound interface and an outbound interface is determined by FIB rules. A forwarding rule in FIB specifies the destination prefix and the outgoing interface. For the destination prefix, we can simply convert it into a header space. However, given the longest-prefix -match principle in FIB, we need to subtract the header space specified by higher-priority rules. In this way, we can compute the header space of each forwarding rule. If there are multiple forwarding rules that use the same outgoing interfaces, we aggregate the packet header space represented by each rule.
Figure 4a shows an example of the switch FWD element model. The Forwarding element operates solely on VRF instances to handle routing decisions. Traffic entering through inbound interfaces in VRF1:3–4 is forwarded based on the VRF1 FIB table. In the illustrated example, traffic destined for the 10.0.1.0/24 (10.0.0.0/24) network segment is directed to the outbound interface 1 of VRF1 (2 of VRF1), reflecting the switch’s ability to manage VRF-based forwarding.
Figure 4b shows an example of the firewall FWD element model. The FWD element of VSYS-1 encompasses a comprehensive set of inbound interfaces: interfaces 1–3 belonging to Trust-V1 zone (representing internal network access), interfaces 4–6 of Untrust-V1 zone (handling external traffic), and interfaces 7–9 of DMZ-V1 zone (managing inter-zone communications). When processing traffic destined for the 10.0.1.0/24 (10.0.0.0/24) network segment, the VSYS FIB directs the traffic to the outbound interface 8 of DMZ-V1 (7 of DMZ-V1), demonstrating the firewall’s ability to manage VSYS-based forwarding.
5.3. Design of the Filtering (FLT) Element
The Filtering element represents another crucial component of our model, specifically designed to enforce policy control behavior within the firewall. For policy control behavior, ACLs (Access Control Lists) are organized according to the Zone-pair directions of interfaces within the VSYS.
This element implements sophisticated filtering mechanisms with the following advanced characteristics:
Each Zone-pair is allocated an independent Filtering element instance, enabling precise and granular expression of access control policies between different security zones. This design allows for detailed policy enforcement while maintaining clear separation between different security domains.
The input ports are represented by Zone-pairs, which are determined through the firewall’s processing pipeline after the Forwarding element.
The output ports adopt a binary model: the PERMIT port and the DENY port, where the PERMIT port allows the packets to proceed to the next device, and the DENY port discards the packets. Additionally, the PERMIT port reuses the same interface as the outbound interface of the previous Forwarding element, meaning that the packets are allowed to leave the outbound interface.
The packet header space of an edge between an input port and the PERMIT output port is determined by the ACL policy applied on the Zone-pair of the input port. In particular, each ACL policy rule with permit action specifies a packet header space. We need to aggregate the allowed packet header space following the top-to-bottom principle, and let the aggregated header space be the edge packet header space. Meanwhile, the packet header space of the edge between the input port and the DENY output port is the complement header space of the edge header space between the input port and the PERMIT output port.
Figure 4b shows an example of the firewall FLT element model. Consider the specific case of traffic flow from zone Trust-V1 to zone DMZ-V1. The element’s input port is precisely defined as the ZonePair (Trust-V1, DMZ-V1), representing traffic originating from the Trust zone and destined for the DMZ zone. The policy enforcement mechanism then evaluates the traffic against configured ACL rules: for traffic targeting the 10.0.0.0/24 (10.0.1.0/24) network segment, the element permits the traffic, allowing the packets to reach interface 7 (8) of DMZ-V1; for other traffic, the element discards the packets and prevents unauthorized access to the protected network segment.
5.4. Device Forwarding Process
The above subsection introduces the model design for the Forwarding and Filtering element. This subsection introduces the detailed forwarding process applied to the switches and firewalls with these two elements.
For switches, the core processing algorithm is shown in Algorithm 1. For firewalls specifically, due to their unique security requirements and zone-based architecture, a specialized forwarding process is required. The core forwarding algorithm is shown in Algorithm 2.
| Algorithm 1 Switch Forwarding Process. |
- 1:
Input: Inbound interface , and input packet header space - 2:
Output: Outbound interface , and output packet header space - 3:
- 4:
// Phase 1: Forwarding Element Processing - 5:
Determine the VRF v where belongs to - 6:
Determine the outbound interface and the forwarding header space according to the FIB in VRF v - 7:
Compute the allowed header space - 8:
- 9:
if == NULL then - 10:
= NULL - 11:
end if - 12:
return and
|
| Algorithm 2 Firewall Forwarding Process. |
- 1:
Input: Inbound interface , and input packet header space - 2:
Output: Outbound interface , and output packet header space - 3:
- 4:
// Phase 1: Forwarding Element Processing - 5:
Bind to the source zone corresponding to - 6:
Determine the VSYS v where belongs to - 7:
Determine the outbound interface and the forwarding header space according to the FIB in VSYS v - 8:
Compute the allowed header space - 9:
Bind p to the target zone corresponding to - 10:
- 11:
// Phase 2: Filtering Element Processing - 12:
Construct Zone-pair based on the source zone and the target zone - 13:
Locate corresponding ACL policy for Zone-pair z - 14:
Compute the permitted header space for the ACL policy - 15:
Compute the allowed header space - 16:
- 17:
if is NULL then - 18:
= NULL - 19:
end if - 20:
return and
|
6. Algorithm Design
This section provides details of the analysis algorithm based on the device-level forwarding graph model, which is key to achieving efficient static analysis of the network exposure surface. After computing the header space of a reachable path, we model the network assert on the endpoint interface (device) as a header space, and compute their intersection. If not null, the assert is reachable and is exposed to the Internet.
We first present a breadth-first search (BFS) algorithm in
Section 6.1, and then extend the algorithm to a parallel version to improve the performance in
Section 6.2.
6.1. Basic Algorithm: BFS-Based Analysis
We first identify Internet ingress interfaces that connect the Internet, and the endpoint interfaces that connect the network asserts via network planning or service planning information. Then, we adopt the BFS approach for each Internet ingress interface with full header space to find all reachable endpoint interfaces and associated header space. The BFS-based traversal systematically explores all possible paths by examining all neighboring interfaces in a breadth-first manner. Meanwhile, each transversal computes the intersected head space based on the current header space and the edge header space.
For each intersected header space, there are several cases:
If the intersected header space is not null, then,
- −
if the explored interface belongs to the endpoint interfaces, the current exploration ends and the algorithm marks an endpoint interface is reachable with the intersected header space;
- −
if the explored interface exists in the current path, a loop is detected, and the current exploration is stopped to prevent routing loops;
- −
otherwise, the algorithm enqueues the explored interface for further exploration.
If the intersected header space is null, the explored interface is not reachable, and the current exploration is stopped.
The overall algorithm is shown in Algorithm 3.
| Algorithm 3 BFS-based Algorithm (For Each Internet Ingress Interface). |
- 1:
Input: Endpoint interface set , device-level forwarding graph and ingress interface i - 2:
Output: Reachable endpoint interface set - 3:
- 4:
Initialize queue Q with full packet space, interface i and path - 5:
while Q is not empty do - 6:
Dequeue the tuple (p, , ) from Q - 7:
Traverse next interfaces according to network topology E in - 8:
for each interface encountered do - 9:
Extract the allowed header space - 10:
Compute the intersected header space - 11:
if is not NULL and then - 12:
Add to - 13:
End the current path exploration - 14:
else if is not NULL and then - 15:
Update the new path - 16:
Enqueue (, , ) to Q - 17:
else if then - 18:
End the current path to prevent routing loops - 19:
else if is NULL then - 20:
End the current path exploration - 21:
end if - 22:
end for - 23:
end while - 24:
return
|
After finding all reachable endpoint interfaces with reachable header space, we can intersect the network asset information (i.e., Layer-3 IP and Layer-4 port) with the reachable header space to check whether the assert is reachable from Internet ingress interfaces.
6.2. Parallel Design
Although the above BFS-based algorithm works, the efficiency can be further improved by applying a parallel strategy. There are two mechanisms: during the initialization phase, parallel threads can be applied to the starting ingress interfaces (i.e., Algorithm 3 can be executed in parallel); during the forwarding phase, parallel threads can be applied to the traversed interfaces (i.e., Line 8 in Algorithm 3 can be parallelized).
Through these parallel mechanisms integrated into the core BFS-based analysis algorithm, we can efficiently handle large-scale networks. Experimental results demonstrate that this approach significantly improves the efficiency of network exposure surface analysis in large-scale complex network environments.
6.2.1. Starting Interface Parallel Mechanism
To improve the exploration efficiency, our algorithm incorporates a starting interface parallel mechanism. This mechanism is primarily aimed at multiple starting packets at the Internet ingress interfaces, and is implemented as follows:
Each starting packet can reuse the existing forwarding graph model for parallel analysis.
The queues generated during initialization are stored independently based on the starting ingress interfaces.
The analysis processes of packets from different starting interfaces are independent of each other, avoiding resource contention.
Figure 5 illustrates an example of the starting interface parallel mechanism: the packet from starting interface A and the packet from starting interface B initialize independent queues Queue_A and Queue_B, respectively, and are processed in their own threads.
6.2.2. Traversed Interface Parallel Mechanism
In addition to the starting interface parallelism, the algorithm employs a traversed interface parallel mechanism aimed at packet spaces generated during the forwarding process. This mechanism is implemented as follows:
Each traversed interface can reuse the existing global forwarding graph model for parallel analysis.
The paths generated during traversal are stored independently based on the traversed interfaces.
The analysis processes of packets on different traversed interfaces are independent of each other, maximizing parallelism.
For example, as shown in
Figure 5, packet 1, after passing through the Forward_VSYS1 and Filter_Trust-DMZ(V1) elements, is routed to the interface of the DMZ zone and triggers policy decisions, pointing to different next-hop devices B and C, generating packet space 3 and 4 that can continue to be forwarded. These two packet spaces can be run in parallel in subsequent traversals, fully utilizing the multi-core processing capability in modern CPUs.
7. Evaluation
This section provides a comprehensive evaluation of the model and algorithms presented in this paper. We begin by detailing the experimental setup (e.g., the datasets used), and the implementations of DFS and BFS algorithms that are compared with our parallel BFS approach. Subsequently, we conduct tests on the mentioned datasets, examining both single-interface and multi-interface scenarios.
7.1. Experimental Setup
7.1.1. Server Configuration
The experiments were conducted on a high-performance server running Ubuntu 18.04, equipped with two Intel(R) Xeon(R) Gold 6230 CPUs (80 cores, 2.10 GHz base clock) supporting AVX-512 and Turbo Boost, 256 GB RAM, ensuring efficient parallel processing and memory-intensive task handling.
7.1.2. Dataset
To emulate large-scale networks while preserving the same network structures in different scale, we use the Fattree architecture to mimic enterprise network environments.
Since the original Fattree topology lacks firewall devices and Internet ingress/egress points, we modify it by replacing one Top-of-Rack (ToR) switch with a firewall and designating certain ToR switches as Internet ingress/egress devices with varying number of ingress interfaces. We also adapt the FIB generation algorithm to ensure that north–south traffic traverses the firewall, and accordingly generate the necessary virtual systems (vsys), zones, and policy rules for the firewall. The Fattree architecture offers an ideal baseline for evaluating organized network environments, with datasets spanning from dozens to hundreds of nodes in complexity.
Table 1 presents a detailed characterization of our six experimental datasets, specifying switch counts, link counts, ingress interface count, and FIB/policy rule numbers.
7.1.3. Comparison Methods
To evaluate the effectiveness of our parallel mechanisms, we implemented both sequential BFS and depth-first search (DFS) approaches as baseline benchmarks. The BFS implementation follows a breadth-first search methodology detailed in Algorithm 3, traversing network paths layer-by-layer utilizing a queue-based data structure. The DFS implementation employs a stack instead of a queue to facilitate depth-first path exploration, while preserving identical routing validation and filtering logic. Both approaches are built upon the same foundational forwarding graph model, with the sole distinction lying in their respective traversal methodologies.
7.2. Performance in Single Starting Interface
We first evaluate the performance of different algorithms with a single starting interface. As shown in
Figure 6, when the network size increases, the execution time of all three algorithms (DFS, BFS, and MTBFS) grows. For smaller FatTree networks, MTBFS shows only modest performance gains over traditional DFS and BFS approaches, as the limited hop count means parallel threads complete traversal quickly, reducing the ratio of actual computation time to total execution time (including thread scheduling overhead). However, as network size grows, MTBFS’s advantages become increasingly apparent. For example, in a FatTree network with
k = 80 (containing 7970 switches), MTBFS completes the analysis in approximately 3.7 ms compared to around 6.2ms for DFS and BFS, representing a 1.5× improvement. This demonstrates how MTBFS’s parallel approach delivers significant benefits for large-scale networks.
7.3. Performance in Multiple Starting Interfaces
We then consider varying number of ingress interfaces that can be served as starting interfaces. When analyzing multiple starting interfaces simultaneously, the performance differences between algorithms become more pronounced. As shown in
Figure 7, DFS and BFS exhibit significantly higher execution times, requiring approximately 17 s for
k = 80, while MTBFS demonstrates superior scalability, completing the analysis in less than 1 s. This represents a 20× performance improvement over traditional approaches. The dramatic performance advantage of MTBFS can be attributed to its parallel processing architecture, which efficiently distributes the workload across multiple threads when handling multiple starting interfaces. Even as the network size increases substantially, MTBFS maintains relatively stable performance through effective parallelization of the traversal process.
7.4. Parallelism Analysis
To comprehensively evaluate the parallel performance, we conduct extensive experiments utilizing 80 cores on our server platform. We focus on two critical performance metrics: CPU Utilization (defined as the percentage of CPU cores actively engaged in processing tasks) and the Parallelism Ratio (calculated as the ratio between the actual parallel execution time and the theoretical sequential execution time). We use the time tool to measure the CPU utilization which could exceed 100%, and the utilization value denotes the average number of cores used. The theoretical sequential execution time is derived by multiplying the number of ingress interfaces with the execution time of the single starting interface.
As illustrated in
Figure 8, MTBFS demonstrates effective utilization of multi-threaded analysis capabilities across the entire spectrum of dataset sizes. For smaller-scale networks (
), the benefits of parallelization are relatively modest, mainly because thread scheduling and the memory management overhead dominate the comparatively light computational workload. However, as the network scale increases (
), MTBFS exhibits increasingly significant parallel performance advantages, since the substantial computational costs considerably outweigh the overhead associated with a multi-thread overhead. This characteristic explains MTBFS’s ability to achieve near-linear speedup for large-scale networks, which aligns well with the running time results presented above.
8. Discussion
Network Attack Surface Analysis. We focus on analyzing the network exposure surface, assets directly exposed to the Internet. In theory, network assets not directly exposed to the Internet can still be compromised if attackers gain control of exposed assets and use them as entry points. Identifying all exposed assets is thus a fundamental problem in attack surface analysis.
Our approach naturally extends to this problem by defining endpoint interfaces and computing an all-pair reachability matrix. Once established, this matrix enables us to determine which internal hosts are accessible from exposed interfaces, offering a precise view of the network’s attack surface.
Attack Graph Construction. Attack graphs are widely used to model potential attack paths and support security planning. However, many existing methods [
15,
16,
17,
18] assume full internal reachability, overlooking actual network constraints.
The technique proposed in this paper can help address the problem. In particular, the above derived all-pair reachability matrix can be incorporated when building the attack graph, since it provides accurate reachability information. This enhancement can lead to more precise attack graph construction.
9. Conclusions
This paper presents a comprehensive solution to the challenges of analyzing the network exposure surface in complex and large-sale networks through two key contributions. First, we propose a novel multi-level element modeling approach that decouples forwarding and filtering functionalities, enabling precise analysis of modern network devices with virtualized architectures. Second, we develop the MTBFS algorithm that combines multi-threaded parallel processing with optimized breadth-first search, achieving up to 20× speedup over traditional methods when handling multiple starting interfaces in enterprise networks with 7970 nodes. Our experimental evaluation also demonstrates the effectiveness of our approach, showing stable linear scalability up to networks with 7970 nodes.
Author Contributions
Z.W.: conceptualization, methodology, investigation, writing—original draft preparation; M.J.: resources, supervision, project administration, funding acquisition; Y.H.: software, validation, investigation, data curation, visualization; D.S.: software, validation, investigation, writing—original draft preparation; L.Y.: formal analysis, investigation, writing—review and editing; P.C.: project administration, funding acquisition. All authors have read and agreed to the published version of the manuscript.
Funding
This work was supported in part by the Science and Technology Project of State Grid Corporation of China (Grant No. SGSH0000DKJS2400254 and Grant No. 5700-202417382A-3-2-ZX), and in part by the Fundamental Research Funds for the Central Universities of China (Grant No. 20720240049).
Data Availability Statement
The data presented in this study are available on request from the corresponding author due to privacy.
Conflicts of Interest
Authors (Zhihua Wang, Minghui Jin, Youlin Hu) are employed by the company State Grid Shanghai Electric Power Company, Shanghai, China. Authors (Dacheng Shan, Peijun Chen) are employed by the company Nanjing NARI Information and Communication Technology Co., Ltd., Nanjing, China. The authors declare that this study received funding partially from the Science and Technology Project of State Grid Corporation of China. The funder was not involved in the study design, collection, analysis, interpretation of data, the writing of this article or the decision to submit it for publication.
References
- NSFOCUS. Exposed Internet Surface Analysis (EISA). 2025. Available online: https://nsfocusglobal.com/products/exposed-internet-surface-analysis/ (accessed on 20 April 2025).
- TOPSEC. Detection Service for the Internet Surface Exposure. 2025. Available online: https://www.topsecgroup.com/products/Internet-Detectio (accessed on 20 April 2025).
- Microsoft Azure. Internet Exposure Analysis. 2025. Available online: https://learn.microsoft.com/en-us/azure/defender-for-cloud/internet-exposure-analysis (accessed on 20 April 2025).
- Alibaba Cloud. Asset Exposure Analysis. 2025. Available online: https://www.alibabacloud.com/help/en/security-center/user-guide/asset-exposure-analysis (accessed on 20 April 2025).
- Gelernter, N.; Schulmann, H.; Waidner, M. External Attack-Surface of Modern Organizations. In Proceedings of the 19th ACM Asia Conference on Computer and Communications Security, Singapore, 1–5 July 2024; pp. 589–604. [Google Scholar]
- Dhillipan, J.; Vijayalakshmi, N.; Suriya, S. Network monitoring system using ping methodology and GUI. In Recent Trends and Advances in Artificial Intelligence and Internet of Things; Springer: Berlin/Heidelberg, Germany, 2020; pp. 13–22. [Google Scholar]
- Everson, D.; Cheng, L. Network attack surface simplification for red and blue teams. In Proceedings of the 2020 IEEE Secure Development (SecDev), Atlanta, GA, USA, 28–30 September 2020; pp. 74–80. [Google Scholar]
- Mayer, A.; Wool, A.; Ziskind, E. Offline firewall analysis. Int. J. Inf. Secur. 2006, 5, 125–144. [Google Scholar] [CrossRef]
- Nelson, T.; Barratt, C.; Dougherty, D.J.; Fisler, K.; Krishnamurthi, S. The Margrave tool for firewall analysis. In Proceedings of the 24th Large Installation System Administration Conference (LISA 10), San Jose, CA, USA, 7–12 November 2010. [Google Scholar]
- Everson, D.; Cheng, L. A Survey on Network Attack Surface Mapping. Digit. Threat. Res. Pract. 2024, 5, 1–25. [Google Scholar] [CrossRef]
- Sun, K.; Jajodia, S. Protecting enterprise networks through attack surface expansion. In Proceedings of the 2014 Workshop on Cyber Security Analytics, Intelligence and Automation, Scottsdale, AZ, USA, 3 November 2014; pp. 29–32. [Google Scholar]
- Osterweil, E.; McPherson, D.; Zhang, L. The shape and size of threats: Defining a networked system’s attack surface. In Proceedings of the 2014 IEEE 22nd International Conference on Network Protocols, Raleigh, NC, USA, 21–24 October 2014; pp. 636–641. [Google Scholar]
- Zhang, M.; Wang, L.; Jajodia, S.; Singhal, A. Network attack surface: Lifting the concept of attack surface to the network level for evaluating networks’ resilience against zero-day attacks. IEEE Trans. Dependable Secur. Comput. 2018, 18, 310–324. [Google Scholar] [CrossRef]
- Sheyner, O.; Haines, J.; Jha, S.; Lippmann, R.; Wing, J.M. Automated generation and analysis of attack graphs. In Proceedings of the Proceedings 2002 IEEE Symposium on Security and Privacy, Berkeley, CA, USA, 12–15 May 2002; pp. 273–284. [Google Scholar]
- Ou, X.; Govindavajhala, S.; Appel, A.W. MulVAL: A logic-based network security analyzer. In Proceedings of the USENIX Security Symposium, Baltimore, MD, USA, 31 July–5 August 2005; Volume 8, pp. 113–128. [Google Scholar]
- Ou, X.; Boyer, W.F.; McQueen, M.A. A scalable approach to attack graph generation. In Proceedings of the 13th ACM Conference on Computer and Communications Security, Alexandria, VA, USA, 30 October–3 November 2006; pp. 336–345. [Google Scholar]
- Ingols, K.; Chu, M.; Lippmann, R.; Webster, S.; Boyer, S. Modeling modern network attacks and countermeasures using attack graphs. In Proceedings of the 2009 Annual Computer Security Applications Conference, Honolulu, HI, USA, 7–11 December 2009; pp. 117–126. [Google Scholar]
- Zhang, S.; Ou, X.; Homer, J. Effective network vulnerability assessment through model abstraction. In Proceedings of the Detection of Intrusions and Malware, and Vulnerability Assessment: 8th International Conference; DIMVA 2011, Amsterdam, The Netherlands, 7–8 July 2011; Proceedings 8. Springer: Berlin/Heidelberg, Germany, 2011; pp. 17–34. [Google Scholar]
- Binyamini, H.; Bitton, R.; Inokuchi, M.; Yagyu, T.; Elovici, Y.; Shabtai, A. A framework for modeling cyber attack techniques from security vulnerability descriptions. In Proceedings of the 27th ACM SIGKDD Conference on Knowledge Discovery & Data Mining, Virtual, 14–18 August 2021; pp. 2574–2583. [Google Scholar]
- Jin, X.; Katsis, C.; Sang, F.; Sun, J.; Bertino, E.; Kompella, R.R.; Kundu, A. Graphene: Infrastructure Security Posture Analysis with AI-generated Attack Graphs. arXiv 2023, arXiv:2312.13119. [Google Scholar]
- Prapty, R.T.; Kundu, A.; Iyengar, A. Using retriever augmented large language models for attack graph generation. arXiv 2024, arXiv:2408.05855. [Google Scholar]
- Xie, G.G.; Zhan, J.; Maltz, D.A.; Zhang, H.; Greenberg, A.; Hjalmtysson, G.; Rexford, J. On static reachability analysis of IP networks. In Proceedings of the IEEE 24th Annual Joint Conference of the IEEE Computer and Communications Societies, Miami, FL, USA, 13–17 March 2005; Volume 3, pp. 2170–2183. [Google Scholar]
- Bandhakavi, S.; Bhatt, S.; Okita, C.; Rao, P. Analyzing end-to-end network reachability. In Proceedings of the 2009 IFIP/IEEE International Symposium on Integrated Network Management, New York, NY, USA, 1–5 June 2009; pp. 585–590. [Google Scholar]
- Mai, H.; Khurshid, A.; Agarwal, R.; Caesar, M.; Godfrey, P.B.; King, S.T. Debugging the data plane with Anteater. In Proceedings of the ACM SIGCOMM, Toronto, ON, Canada, 15–19 August 2011; pp. 290–301. [Google Scholar]
- Kazemian, P.; Varghese, G.; McKeown, N. Header Space Analysis: Static Checking for Networks. In Proceedings of the USENIX NSDI, San Jose, CA, USA, 25–27 April 2012; pp. 113–126. [Google Scholar]
- Kazemian, P.; Chang, M.; Zeng, H.; Varghese, G.; McKeown, N.; Whyte, S. Real time network policy checking using header space analysis. In Proceedings of the USENIX NSDI, Lombard, IL, USA, 2–5 April 2013; pp. 99–111. [Google Scholar]
- Fogel, A.; Fung, S.; Pedrosa, L.; Walraed-Sullivan, M.; Govindan, R.; Mahajan, R.; Millstein, T. A general approach to network configuration analysis. In Proceedings of the USENIX NSDI, Oakland, CA, USA, 4–6 May 2015; pp. 469–483. [Google Scholar]
- Intentionet. Batfish. 2025. Available online: https://github.com/batfish/batfish (accessed on 20 April 2025).
- You, L.; Zhang, J.; Jin, Y.; Tang, H.; Li, X. Fast Configuration Change Impact Analysis for Network Overlay Data Center Networks. IEEE/ACM Trans. Netw. 2022, 30, 423–436. [Google Scholar] [CrossRef]
- Khurshid, A.; Zou, X.; Zhou, W.; Caesar, M.; Godfrey, P.B. VeriFlow: Verifying Network-Wide Invariants in Real Time. In ACM SIGCOMM Computer Communication Review; Association for Computing Machinery: New York, NY, USA, 2013; pp. 15–27. [Google Scholar]
- Yang, H.; Lam, S.S. Real-time Verification of Network Properties using Atomic Predicates. IEEE/ACM Trans. Netw. 2015, 24, 887–900. [Google Scholar] [CrossRef]
- Bjørner, N.; Juniwal, G.; Mahajan, R.; Seshia, S.A.; Varghese, G. ddnf: An Efficient Data Structure for Header Spaces. In Hardware and Software: Verification and Testing; Springer: Cham, Switzerland, 2016; pp. 49–64. [Google Scholar]
- Horn, A.; Kheradmand, A.; Prasad, M. Delta-net: Real-time network verification using atoms. In Proceedings of the 14th USENIX Conference on Networked Systems Design and Implementation, Boston, MA, USA, 27–29 March 2017; pp. 735–749. [Google Scholar]
- Horn, A.; Kheradmand, A.; Prasad, M.R. A precise and expressive lattice-theoretical framework for efficient network verification. In Proceedings of the IEEE ICNP, Chicago, IL, USA, 7–10 October 2019; pp. 1–12. [Google Scholar]
- Zhang, P.; Liu, X.; Yang, H.; Kang, N.; Gu, Z.; Li, H. APKeep: Realtime Verification for Real Networks. In Proceedings of the USENIX NSDI, Santa Clara, CA, USA, 25–27 February 2020; pp. 241–255. [Google Scholar]
- Guo, D.; Chen, S.; Gao, K.; Xiang, Q.; Zhang, Y.; Yang, Y.R. Flash: Fast, consistent data plane verification for large-scale network settings. In Proceedings of the ACM SIGCOMM, Amsterdam, The Netherlands, 22–26 August 2022; pp. 314–335. [Google Scholar]
- Zeng, H.; Zhang, S.; Ye, F.; Jeyakumar, V.; Ju, M.; Liu, J.; McKeown, N.; Vahdat, A. Libra: Divide and conquer to verify forwarding tables in huge networks. In Proceedings of the USENIX NSDI, Santa Clara, CA, USA, 2–5 February 2014; pp. 87–99. [Google Scholar]
- Xiang, Q.; Huang, C.; Wen, R.; Wang, Y.; Fan, X.; Liu, Z.; Kong, L.; Duan, D.; Le, F.; Sun, W. Beyond a Centralized Verifier: Scaling Data Plane Checking via Distributed, On-Device Verification. In Proceedings of the ACM SIGCOMM, New York, NY, USA, 10–14 September 2023; pp. 152–166. [Google Scholar]
- Chou, K.Y.; Prabhu, S.; Subramanian, G.; Zhou, W.; Nayyar, A.; Godfrey, B.; Caesar, M. Scaling Data Plane Verification with Intent-based Slicing. arXiv 2024, arXiv:2405.20982. [Google Scholar]
- Netgear. Leading Spine and Leaf Networking for Enterprises. 2025. Available online: https://www.netgear.com/hub/business/network/spine-and-leaf-networking/ (accessed on 29 April 2025).
- Networks, V. The Evolution of the Enterprise Access Edge: A Primer on Chassis Models, Stack Technology, and Spine-Leaf Architecture. 2023. Available online: https://versa-networks.com/documents/white-papers/versa-wp-enterprise-access-edge_v2.pdf (accessed on 29 April 2025).
- Andersen, H.R. An Introduction to Binary Decision Diagrams. Lecture notes for 49285 Advanced Algorithms E97, October 1997. Available online: https://www.cs.utexas.edu/~isil/cs389L/bdd.pdf (accessed on 20 April 2025).
- Wen, S.; Abhashkumar, A.; Zhao, C.; Jiang, W. Scaling Data Plane Verification via Parallelization. In Proceedings of the ACM APNET, Sydney, Australia, 3–4 August 2024; pp. 81–87. [Google Scholar]
- Brown, M.; Fogel, A.; Halperin, D.; Heorhiadi, V.; Mahajan, R.; Millstein, T. Lessons from the evolution of the Batfish configuration analysis tool. In Proceedings of the ACM SIGCOMM, New York, NY, USA, 10 September 2023; pp. 122–135. [Google Scholar]
| Disclaimer/Publisher’s Note: The statements, opinions and data contained in all publications are solely those of the individual author(s) and contributor(s) and not of MDPI and/or the editor(s). MDPI and/or the editor(s) disclaim responsibility for any injury to people or property resulting from any ideas, methods, instructions or products referred to in the content. |
© 2025 by the authors. Licensee MDPI, Basel, Switzerland. This article is an open access article distributed under the terms and conditions of the Creative Commons Attribution (CC BY) license (https://creativecommons.org/licenses/by/4.0/).


