Making Autonomous Taxis Understandable: A Comparative Study of eHMI Feedback Modes and Display Positions for Pickup Guidance

 , , , and
Abstract
1. Introduction
- Eye feedback demonstrates superior effectiveness in long-distance scenarios, effectively mitigating critical identification errors while maintaining user engagement and attention.
- Arrow feedback delivers unambiguous directional cues, empowering users to make confident decisions and achieving significant reductions in both error rates and selection deviation during close-range scenarios.
- Number feedback at the top position provides the fastest response times, proving particularly advantageous in time-sensitive situations where the rapid identification of an AT parking locations is required.
- Feedback on the vehicle body typically improves passengers’ accuracy in their perception of autonomous driving intentions, facilitating clearer comprehension of the designated parking space selection.
2. Related Works
2.1. Communication Challenges in Autonomous Traffic Environments
2.2. eHMI as a Solution for External Vehicle Communication
2.3. eHMI Design Variants and Performance
2.4. eHMI Display Positioning and Effectiveness
3. Experimental Design and Implementation
3.1. Design of eHMI Feedback Modes and Display Positions
3.1.1. eHMI Feedback Mode Design
- Eye feedback [3,57]: A length of 0.75 m and height of 0.25 m, with a pupil diameter of 0.05 m and eye frame stroke width of 0.01 m. The pupil and eye frame maintain a coplanar relationship, as defined in Equation (2). This constraint ensures the pupil always moves within the frame plane while tracking the target.
- Base center: ;
- Vertex: ;
- Base radius: ;
- Base normal vector: (unit vector).
- Coplanarity constraint:
- Dynamic projection relationship:where the theoretical intersection point is
- Arrow feedback employs dynamic angle adjustments to maintain precise alignment with the target location. By consistently pointing toward the designated parking position, it provides AT passengers with intuitive directional information about their intended stopping position.
- Number feedback calculates and displays the real-time Euclidean distance (e.g., “20 m”) between the vehicle and its designated parking point. This numerical value updates dynamically as the vehicle approaches, providing passengers with precise information about their remaining distance to the destination.
3.1.2. eHMI Display Position Design
- Body Position [44]: Integrated into the vehicle’s side windows and rear windshield surfaces. The side windows measure 2.28 m in length and 0.406 m in height, while the rear windshield measures 1.3 m in length and 0.325 m in height. This multi-surface placement allows for the feedback information to remain visible from various viewing angles as the vehicle maneuvers, providing continuous communication regardless of the vehicle’s orientation relative to the user.
- Top Position [58]: Mounted on the vehicle roof with dimensions of 0.3 m in length and 1 m in width, consistently facing the user throughout the approach sequence.
3.2. Experimental Settings and Design
3.2.1. Experimental Settings
3.2.2. Independent Variables
- Feedback Mode (three levels): Eye, Arrow and Number.
- Display Position (two levels): body and top.
- Parking Location (four levels): 1, 2, 3, 4.
3.2.3. Experimental Design
3.2.4. Participants and Procedure
- Comprehension Assessment: Evaluation of how effectively combinations of eHMI messages and display positions facilitate understanding of automated vehicles’ intended parking locations [19,23], measured using a 5-point Likert scale (0–4). This assessment provides critical insights into the cognitive clarity of different communication strategies, helping identify optimal configurations that minimize misinterpretation and enhance pedestrian–vehicle interaction safety.
- Decision Confidence Rating: Participants rated their confidence level from 0% to 100%, consistent with measurement approaches established in previous human–machine interaction research [59].
- eHMI Feedback Assessment Scale: A 7-point Likert scale (1–7) questionnaire evaluating users’ perceptions of different feedback modes (Eye, Arrow, and Number) across five core dimensions: safety perception, trust, and communication effectiveness [17]. The final question asks participants to evaluate their overall impressions of different feedback modes [17]. These collected responses aim to provide statistical data for analyzing user preferences and perceptions regarding different eHMI feedback designs.
- –
- Automation: The feedback mode helps me identify whether the vehicle is in autonomous driving mode.
- –
- Intention: The feedback mode helps me understand the vehicle’s driving intentions.
- –
- Trust: The feedback mode improves my trust in the vehicle.
- –
- Attention: The feedback mode makes me feel that the vehicle is aware of my presence.
- –
- Safety: The feedback mode enhances my sense of safety.
- –
- Emotional Response: Please describe your feeling about the feedback mode using one word.
4. Results
4.1. Selection Time, Error Rate, Selection Deviation, and User Behavior Data
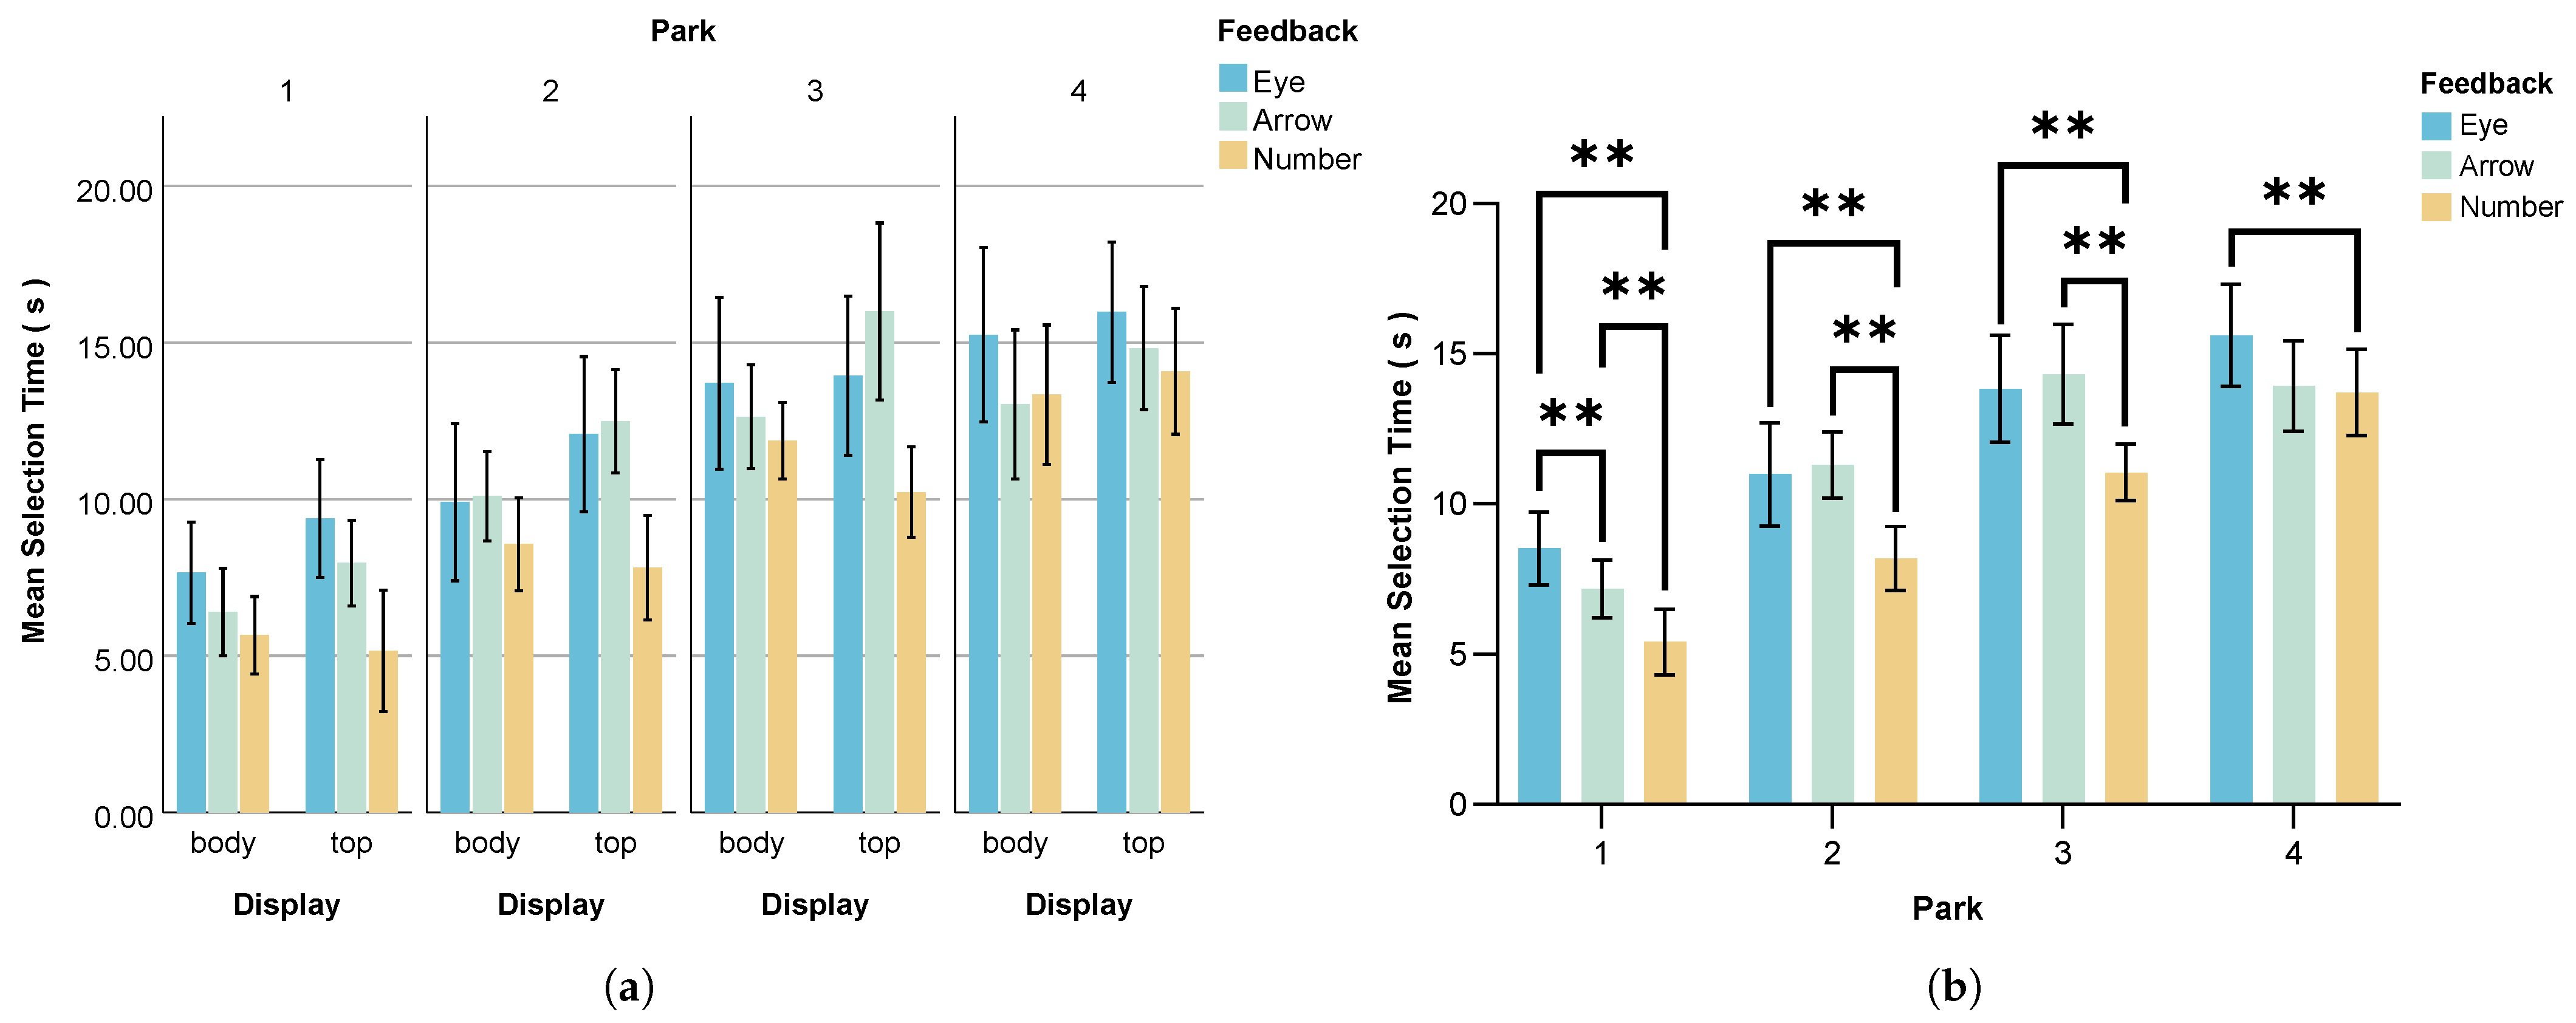
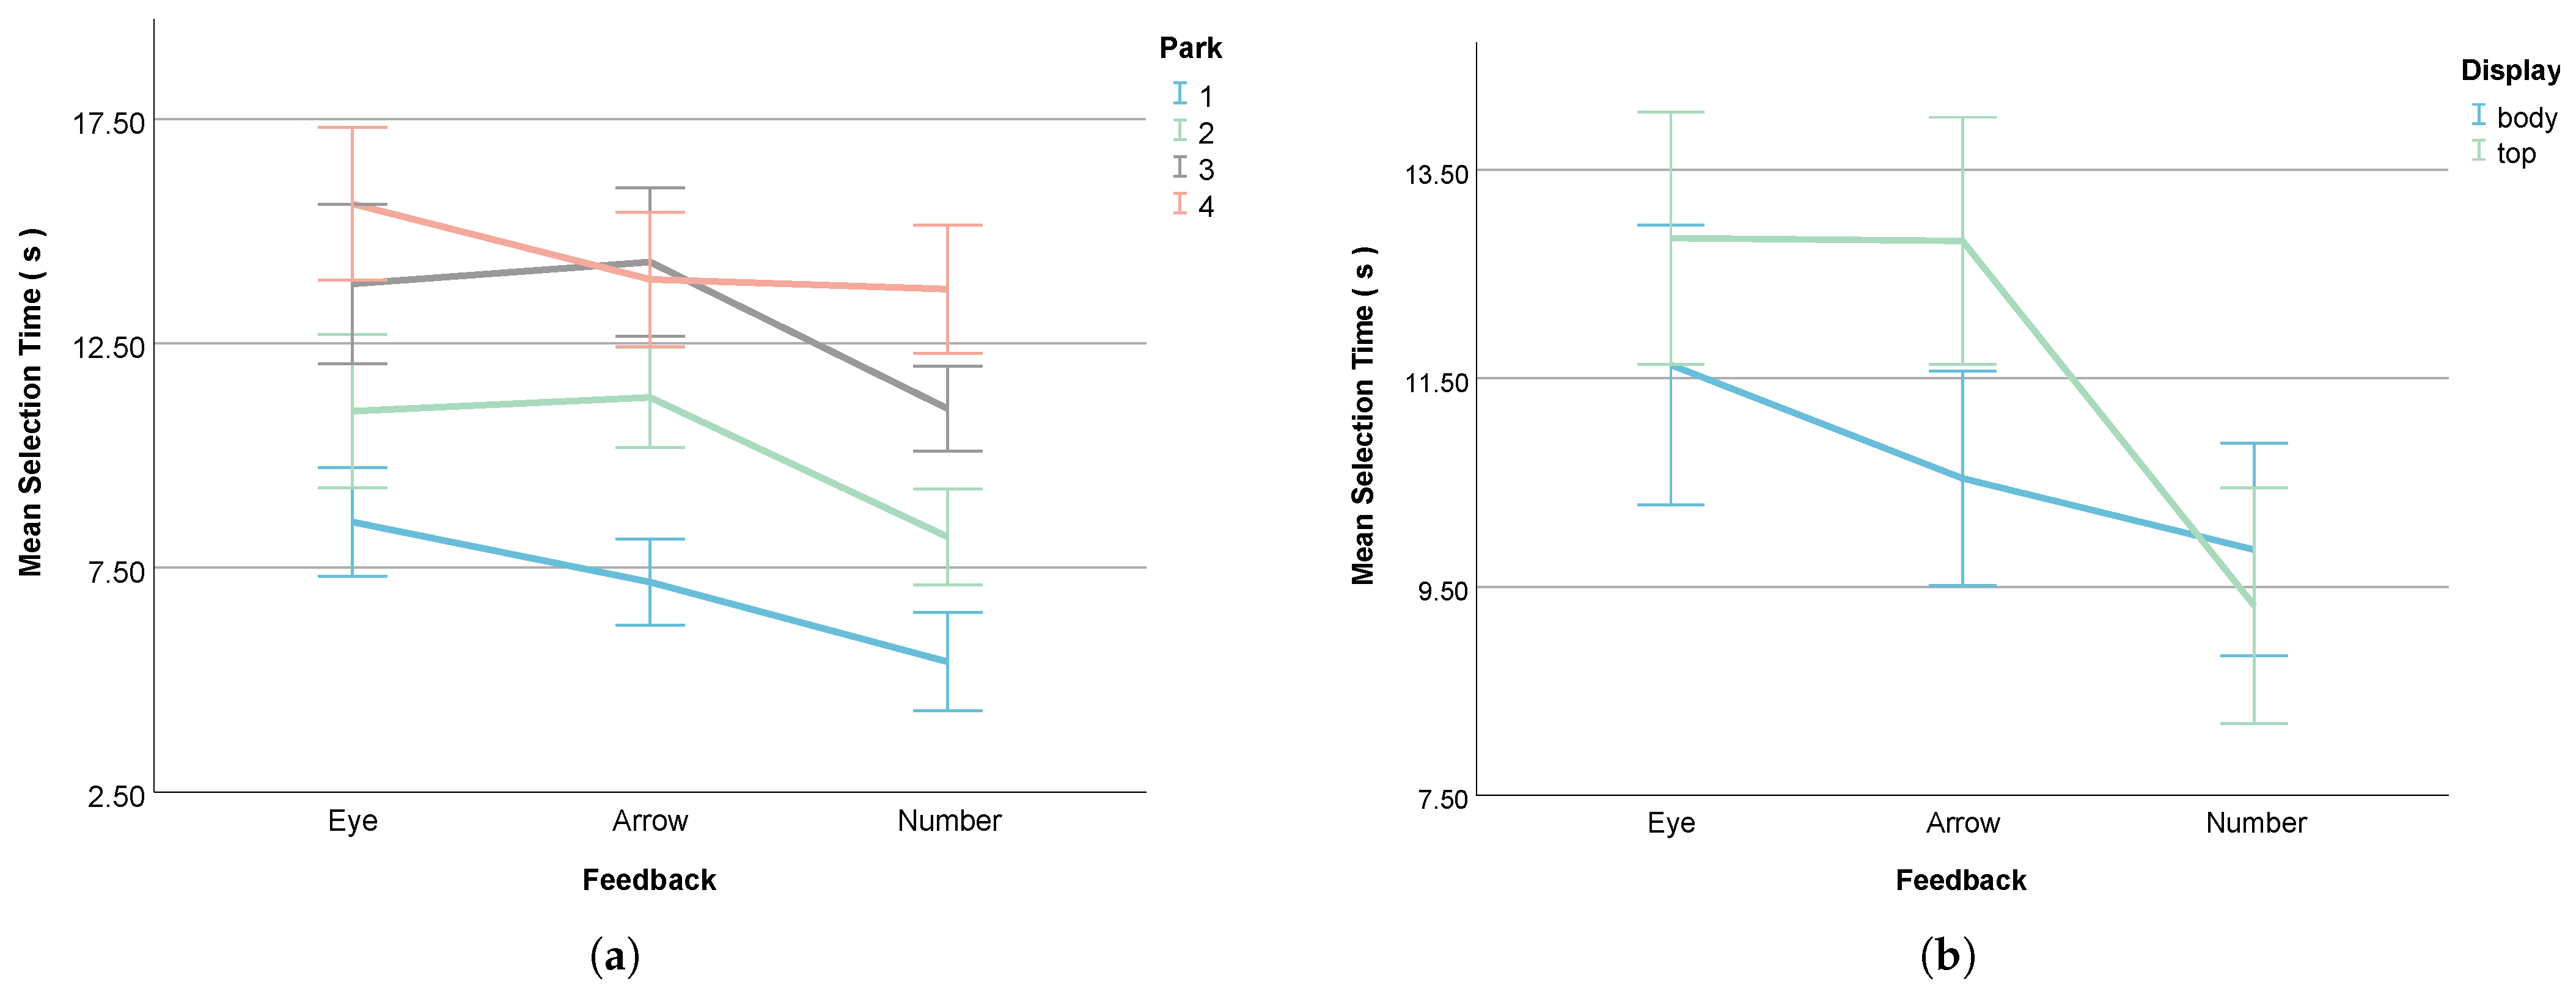
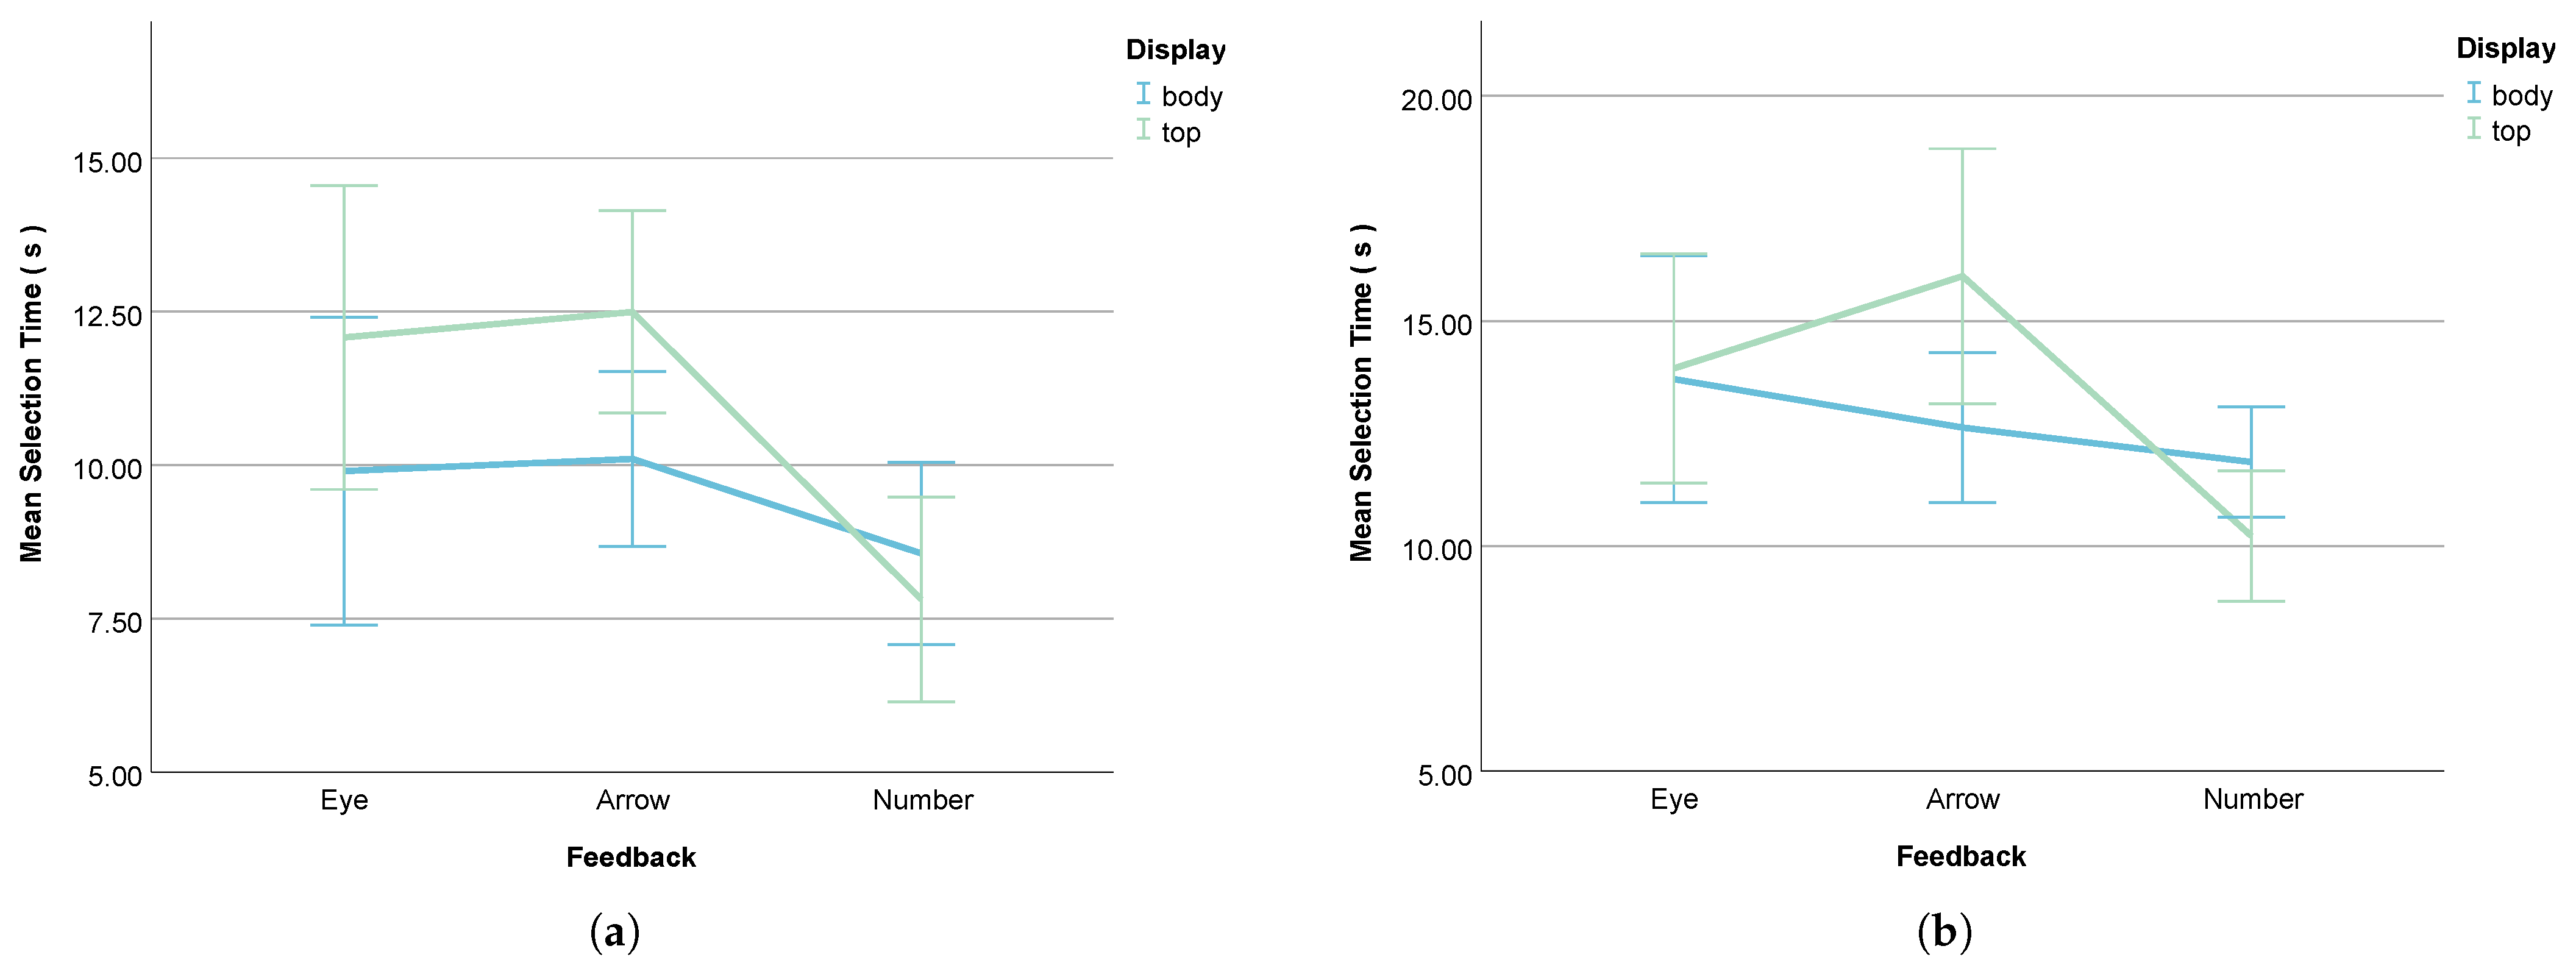
- Selection Time
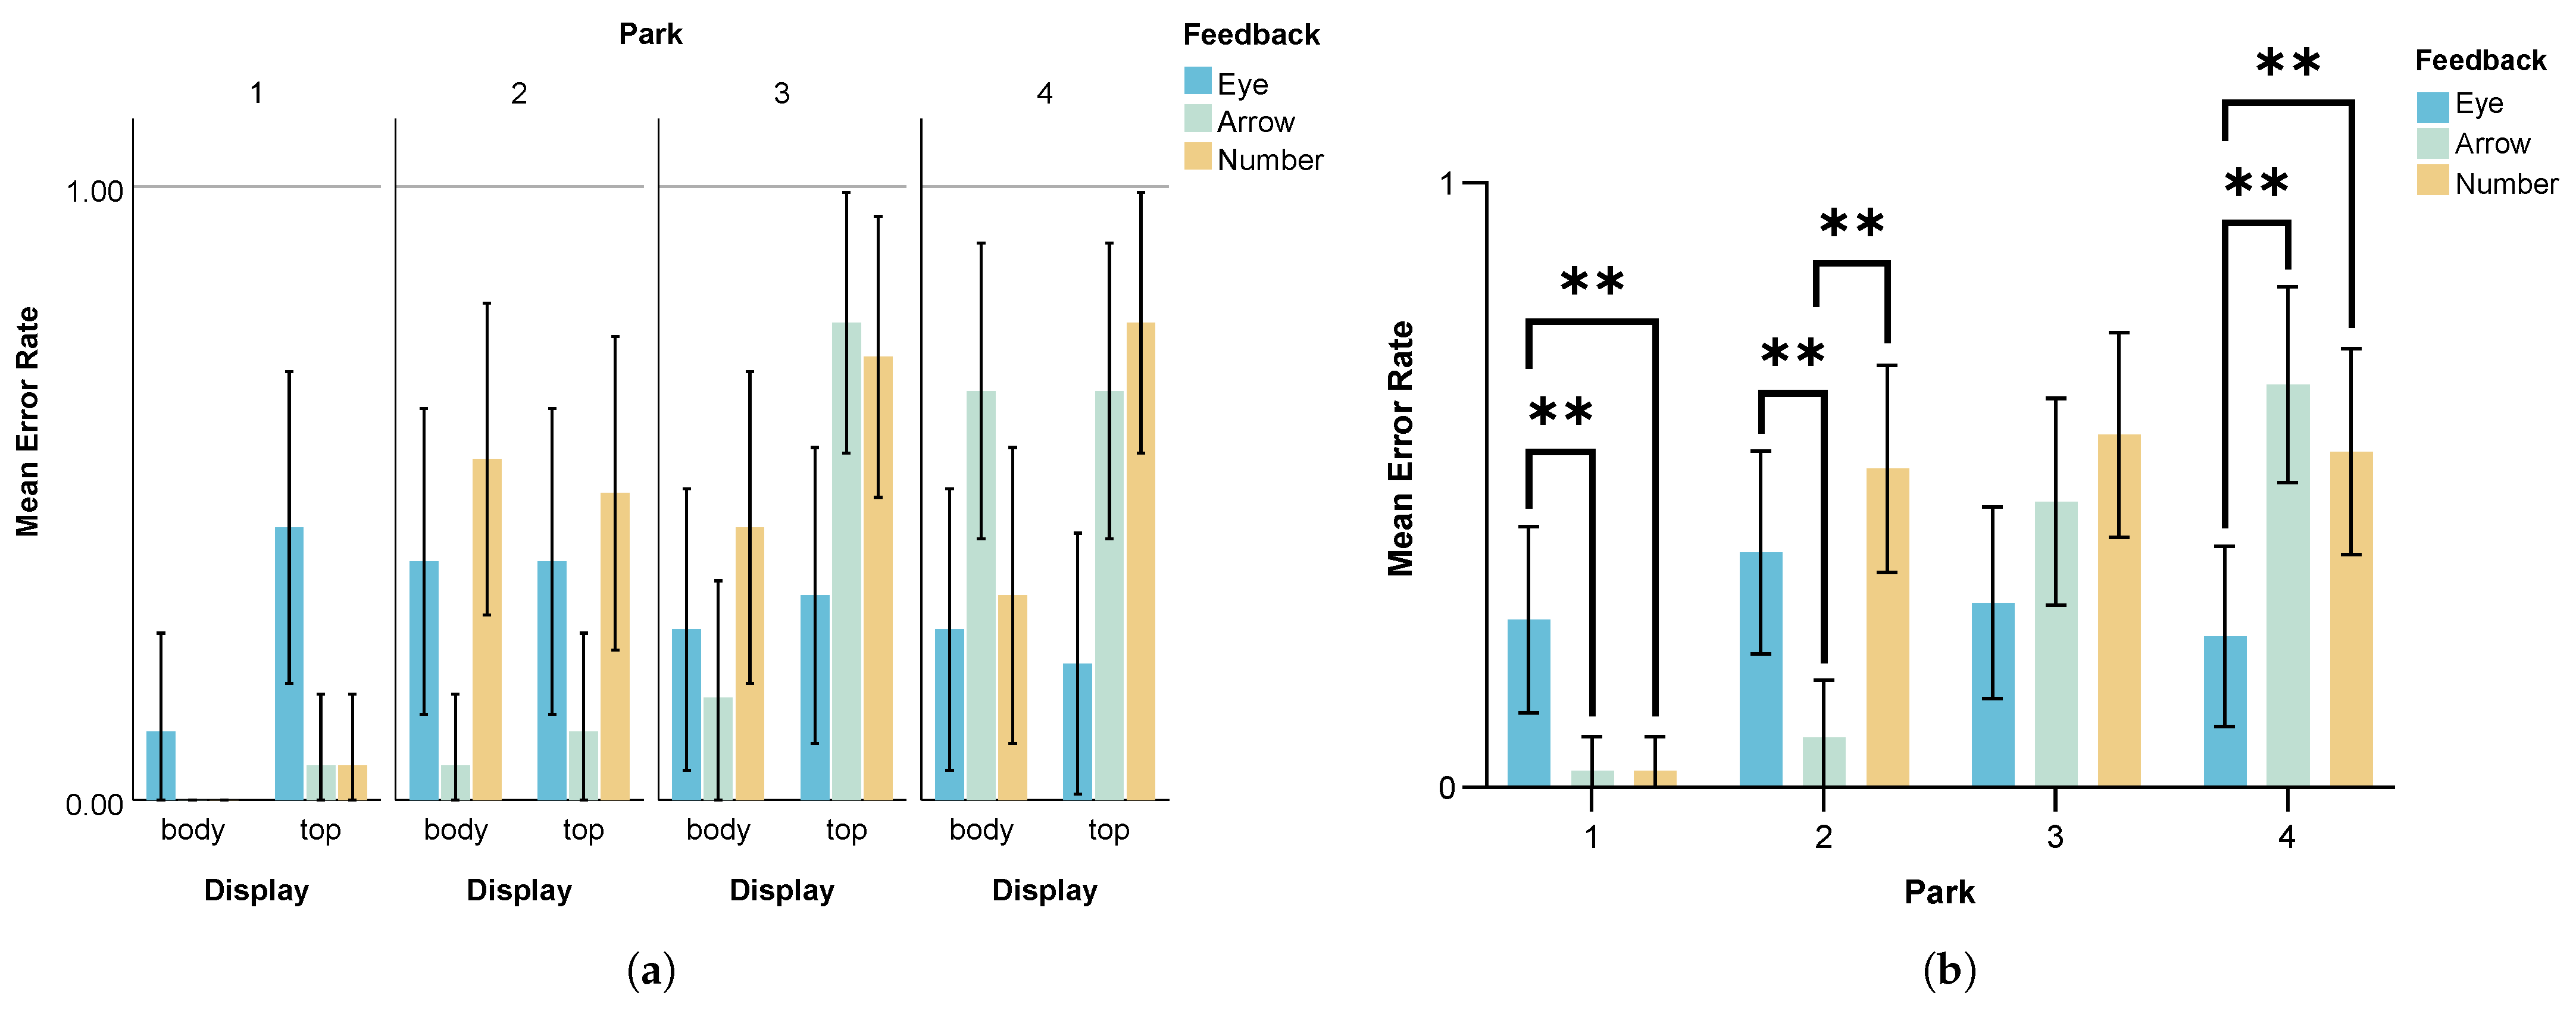
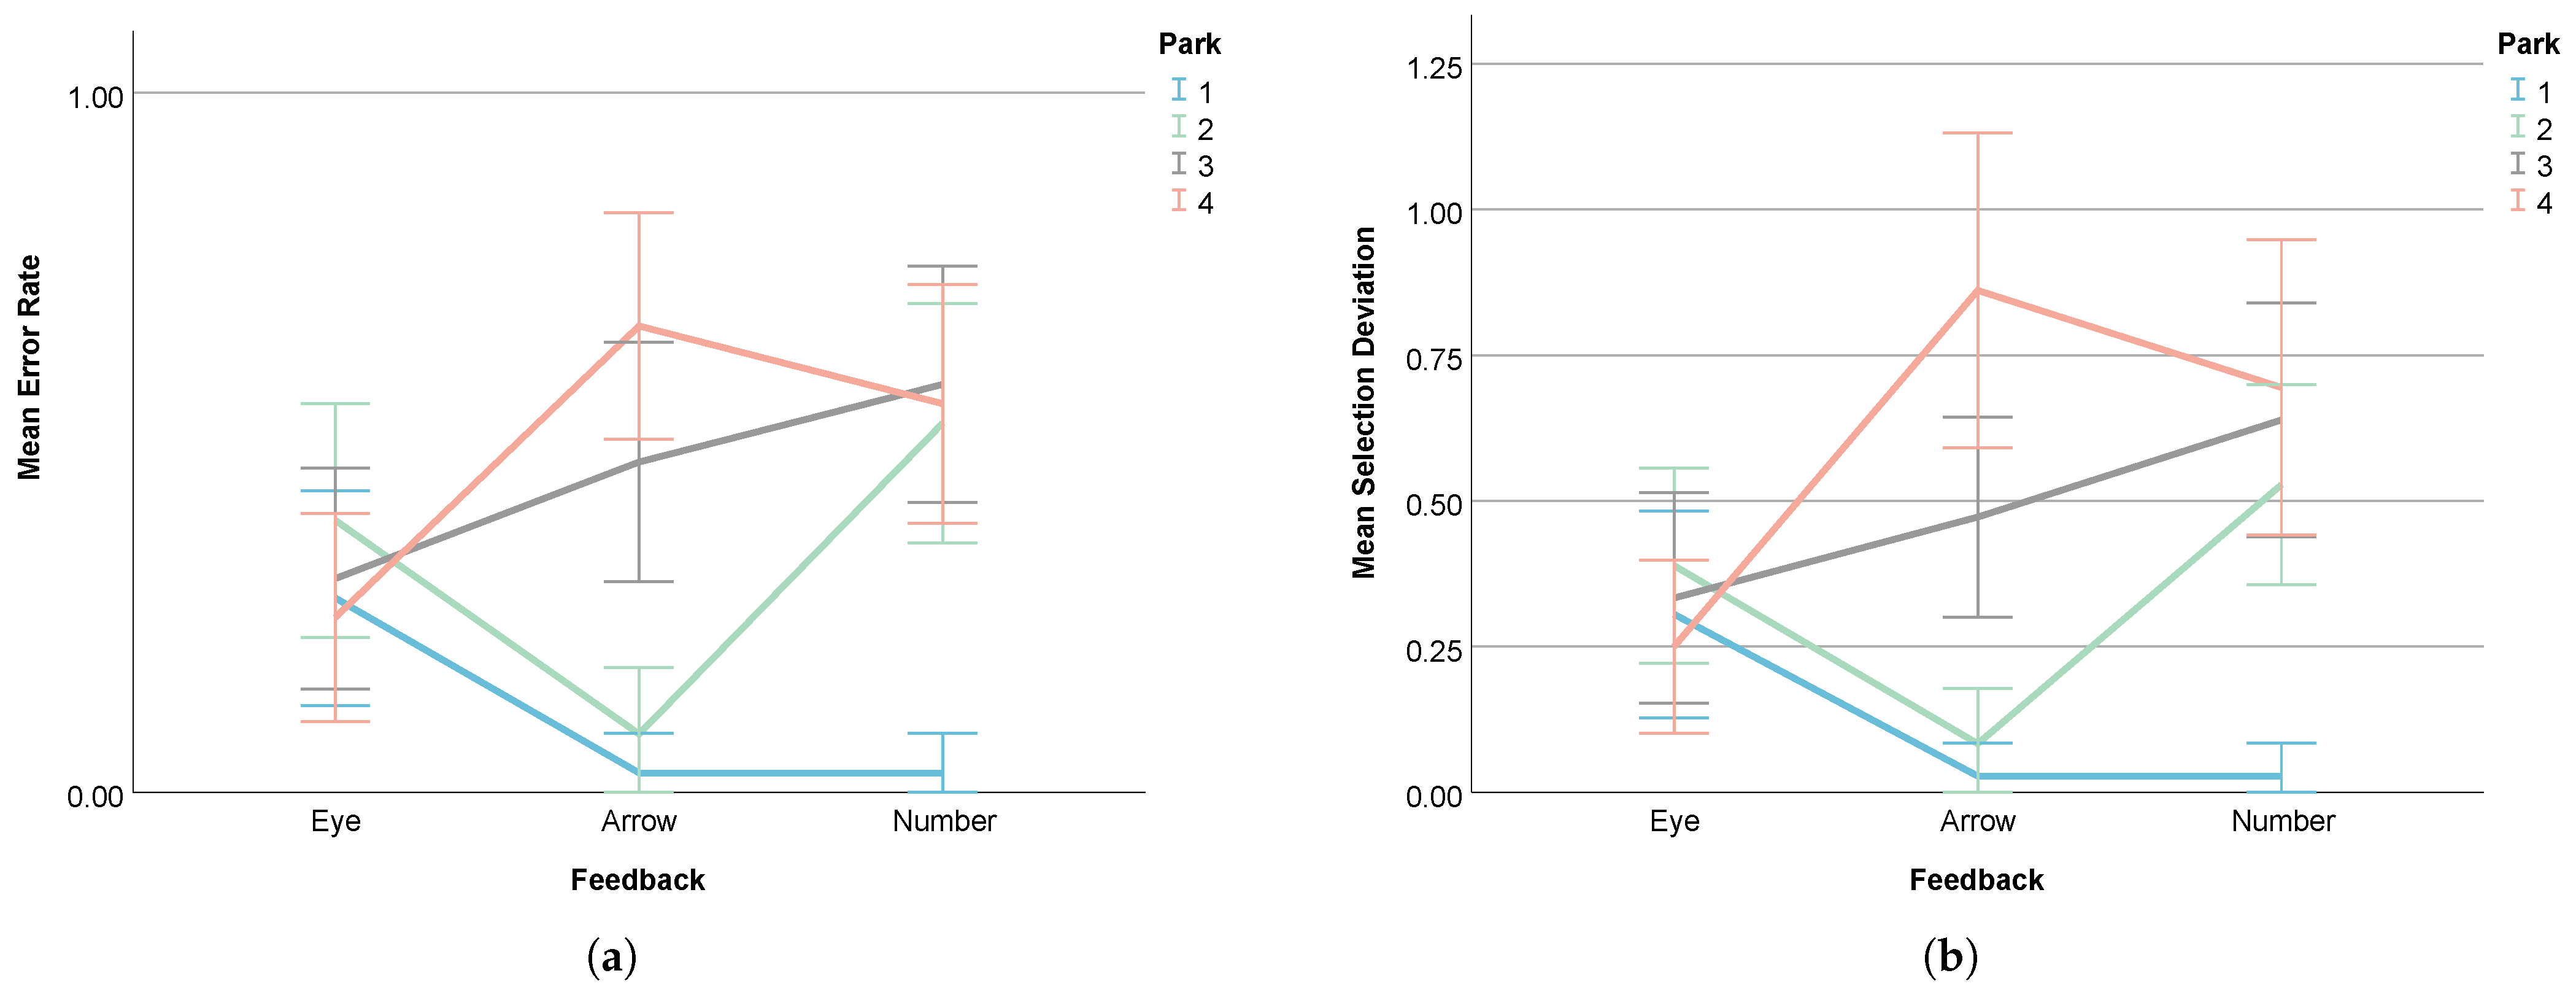
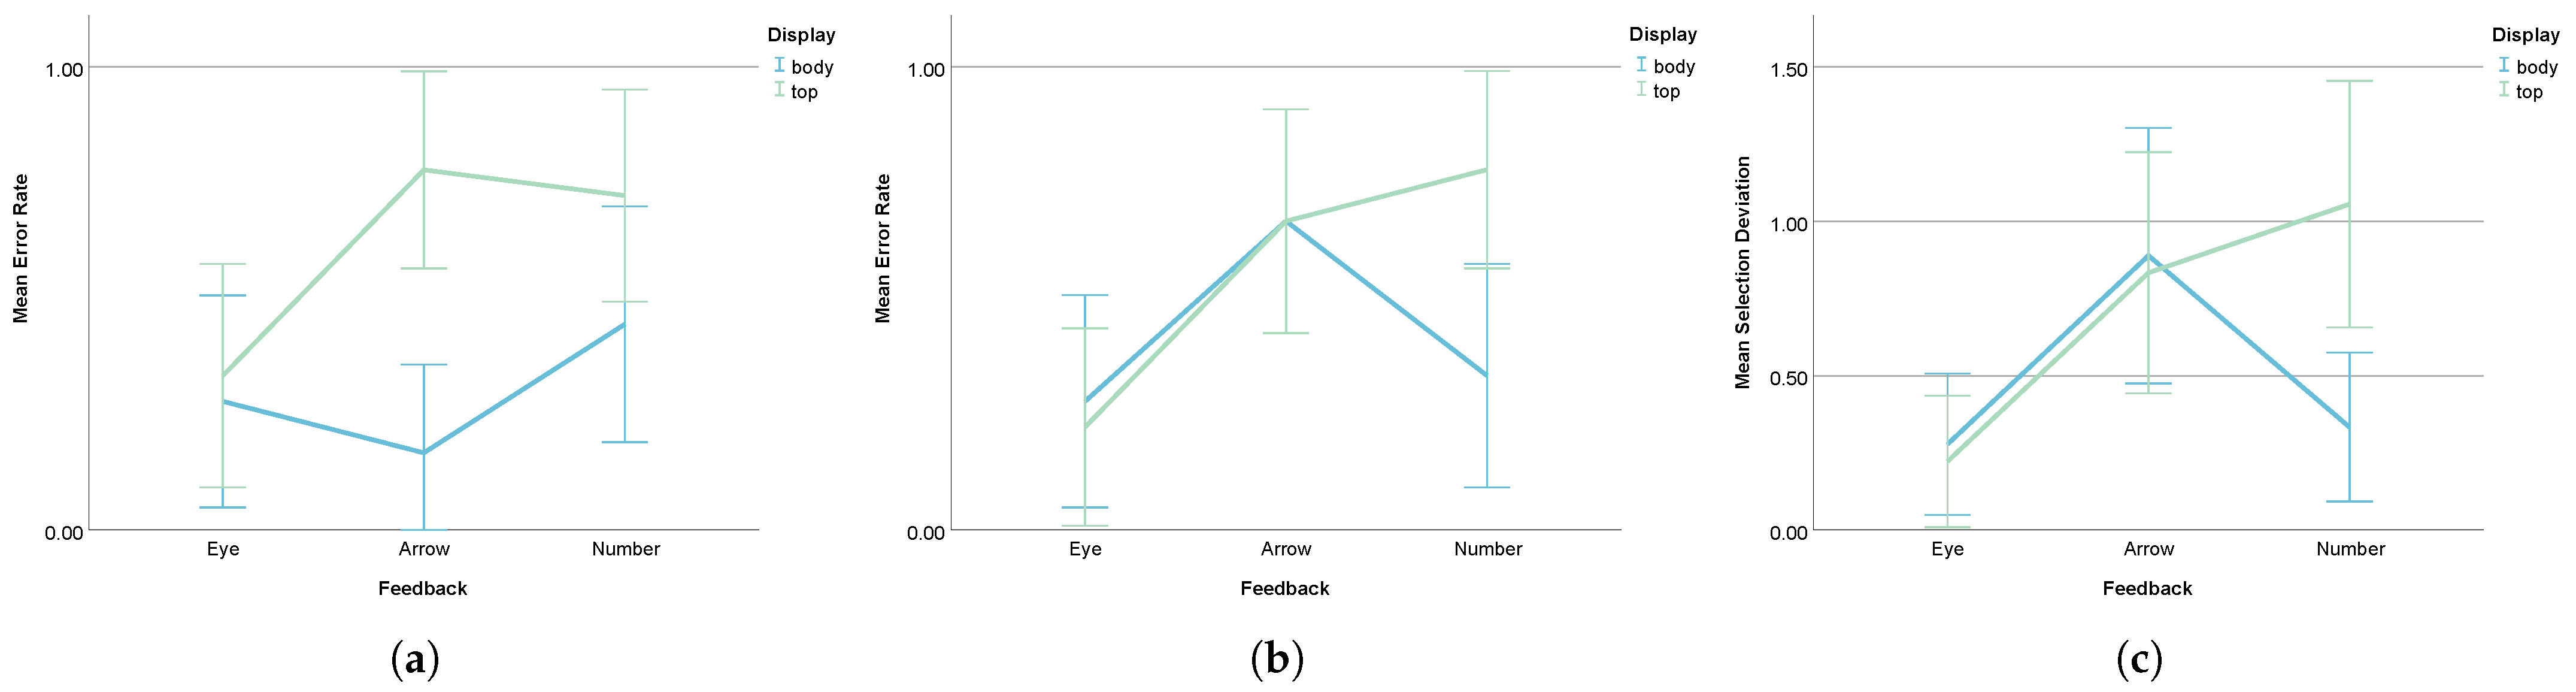
- Error Rate
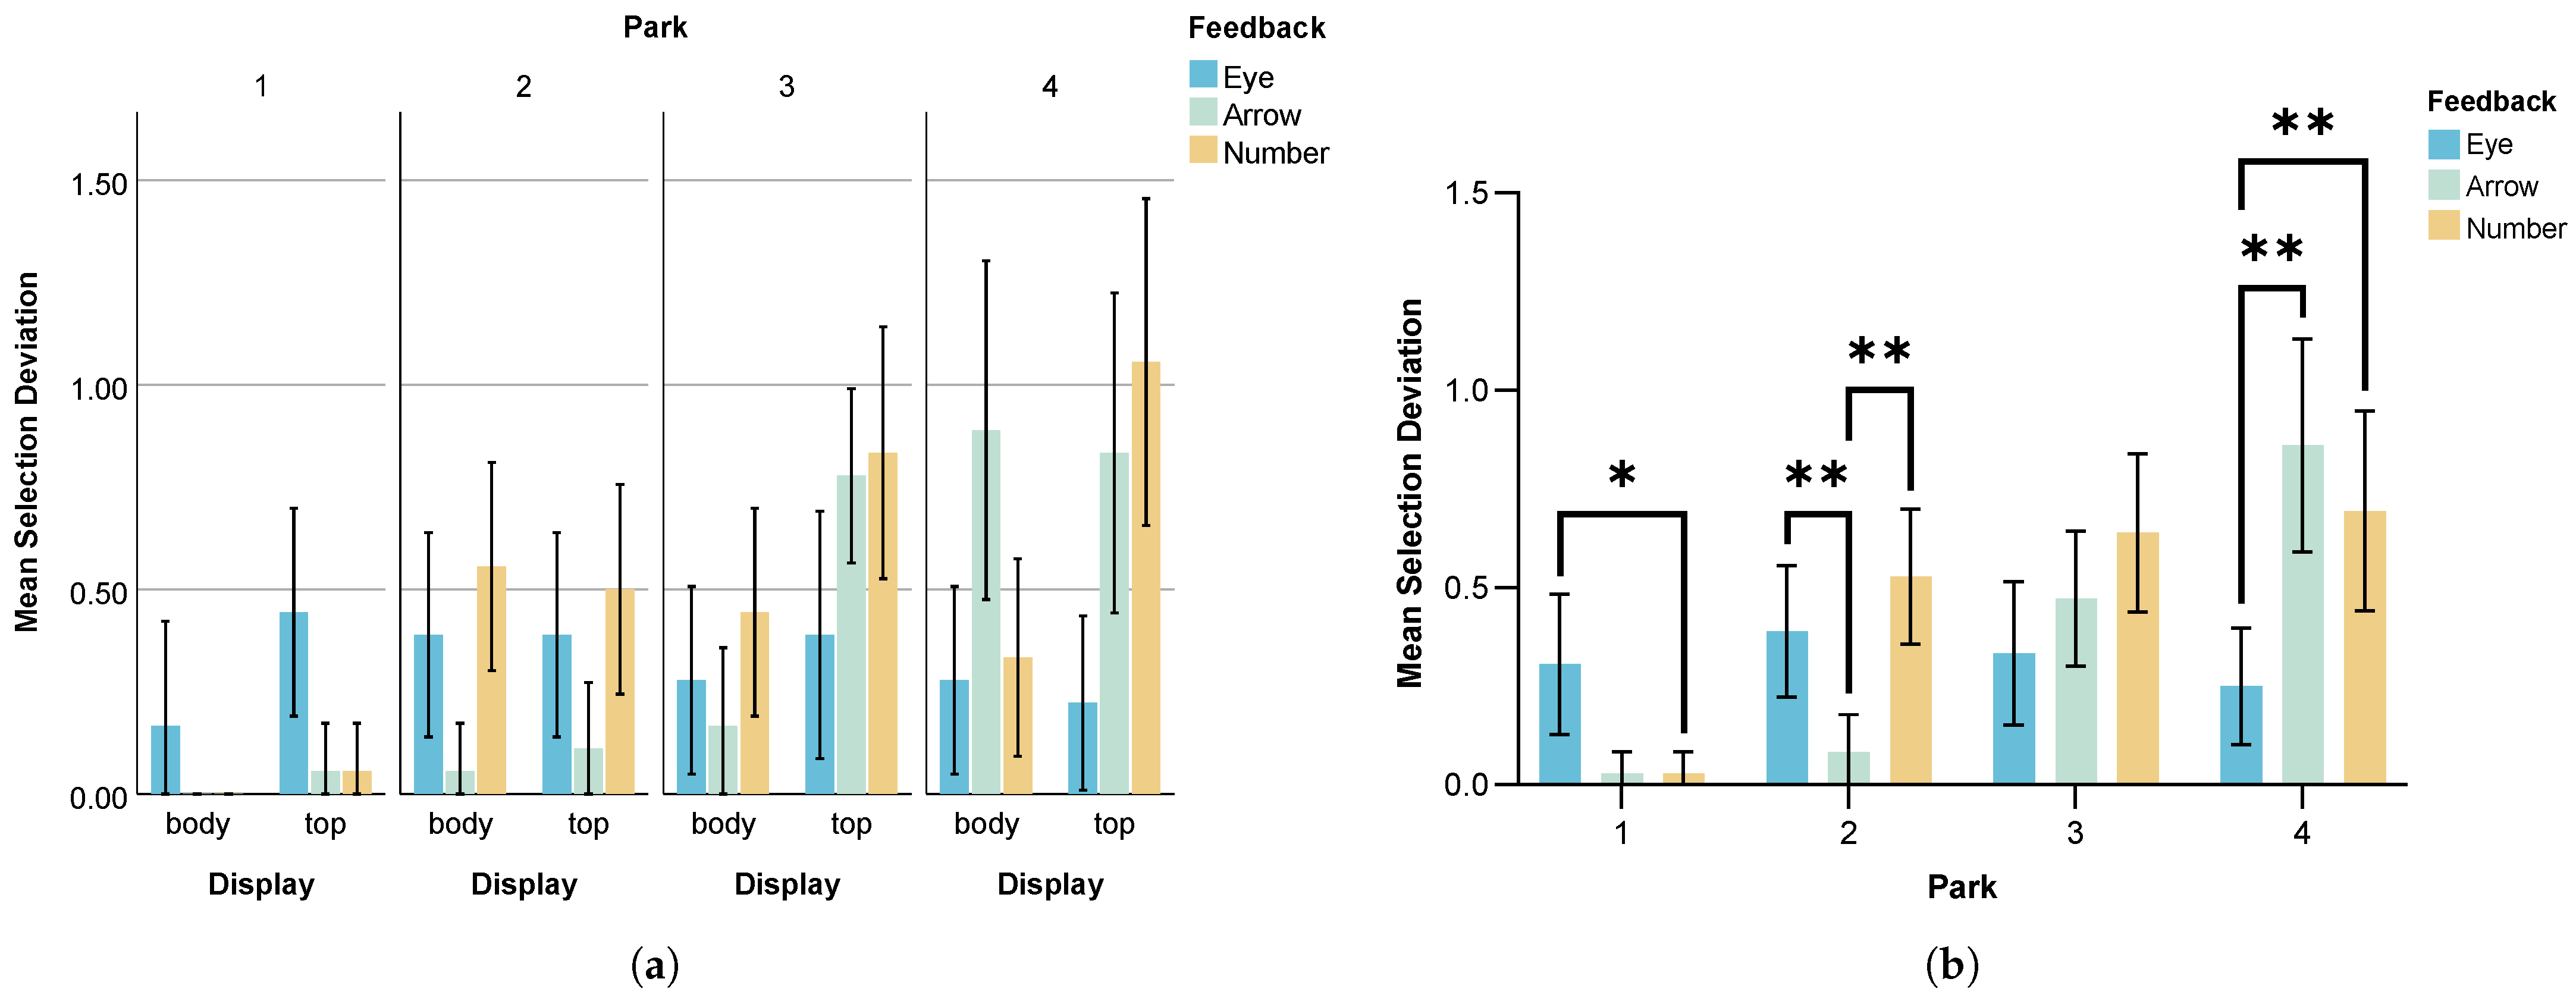
- Selection Deviation
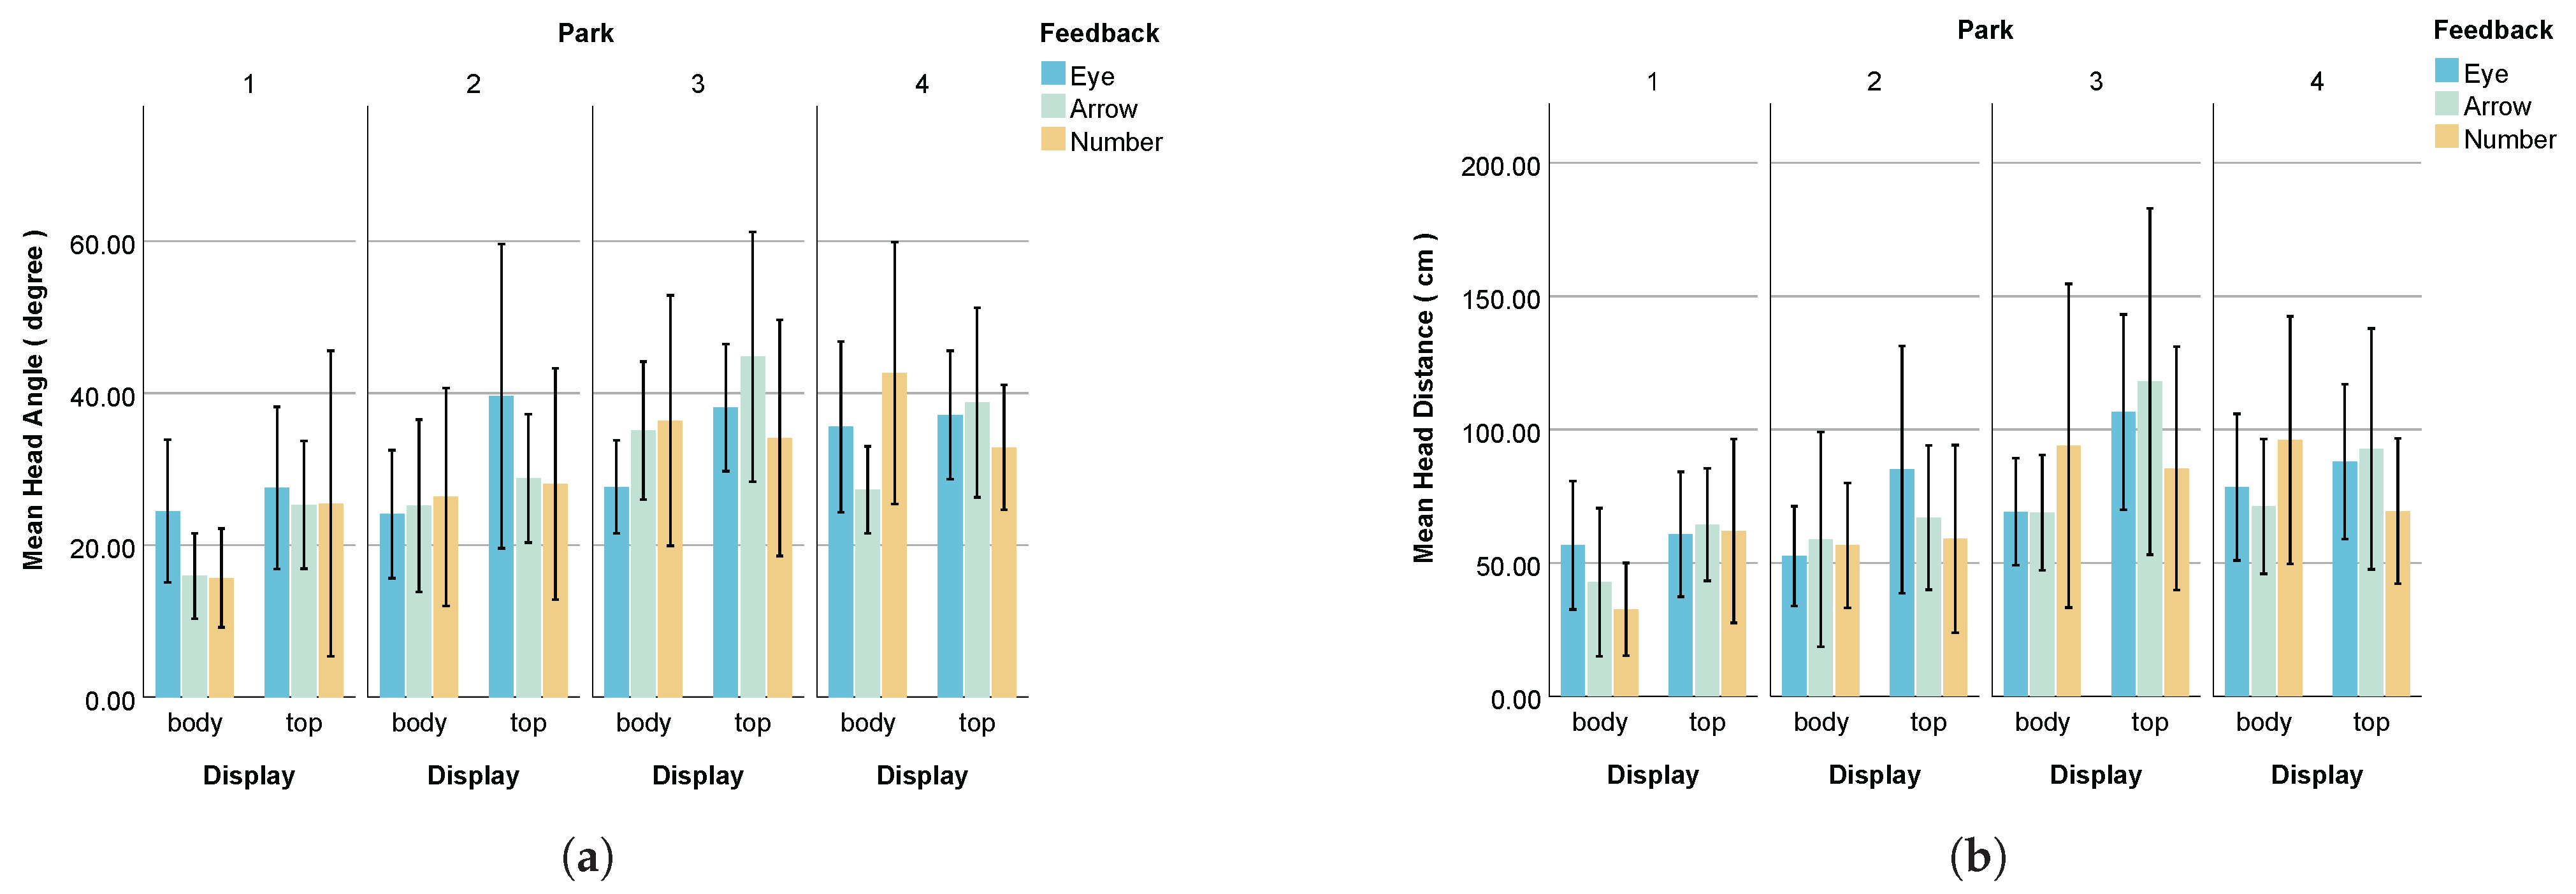
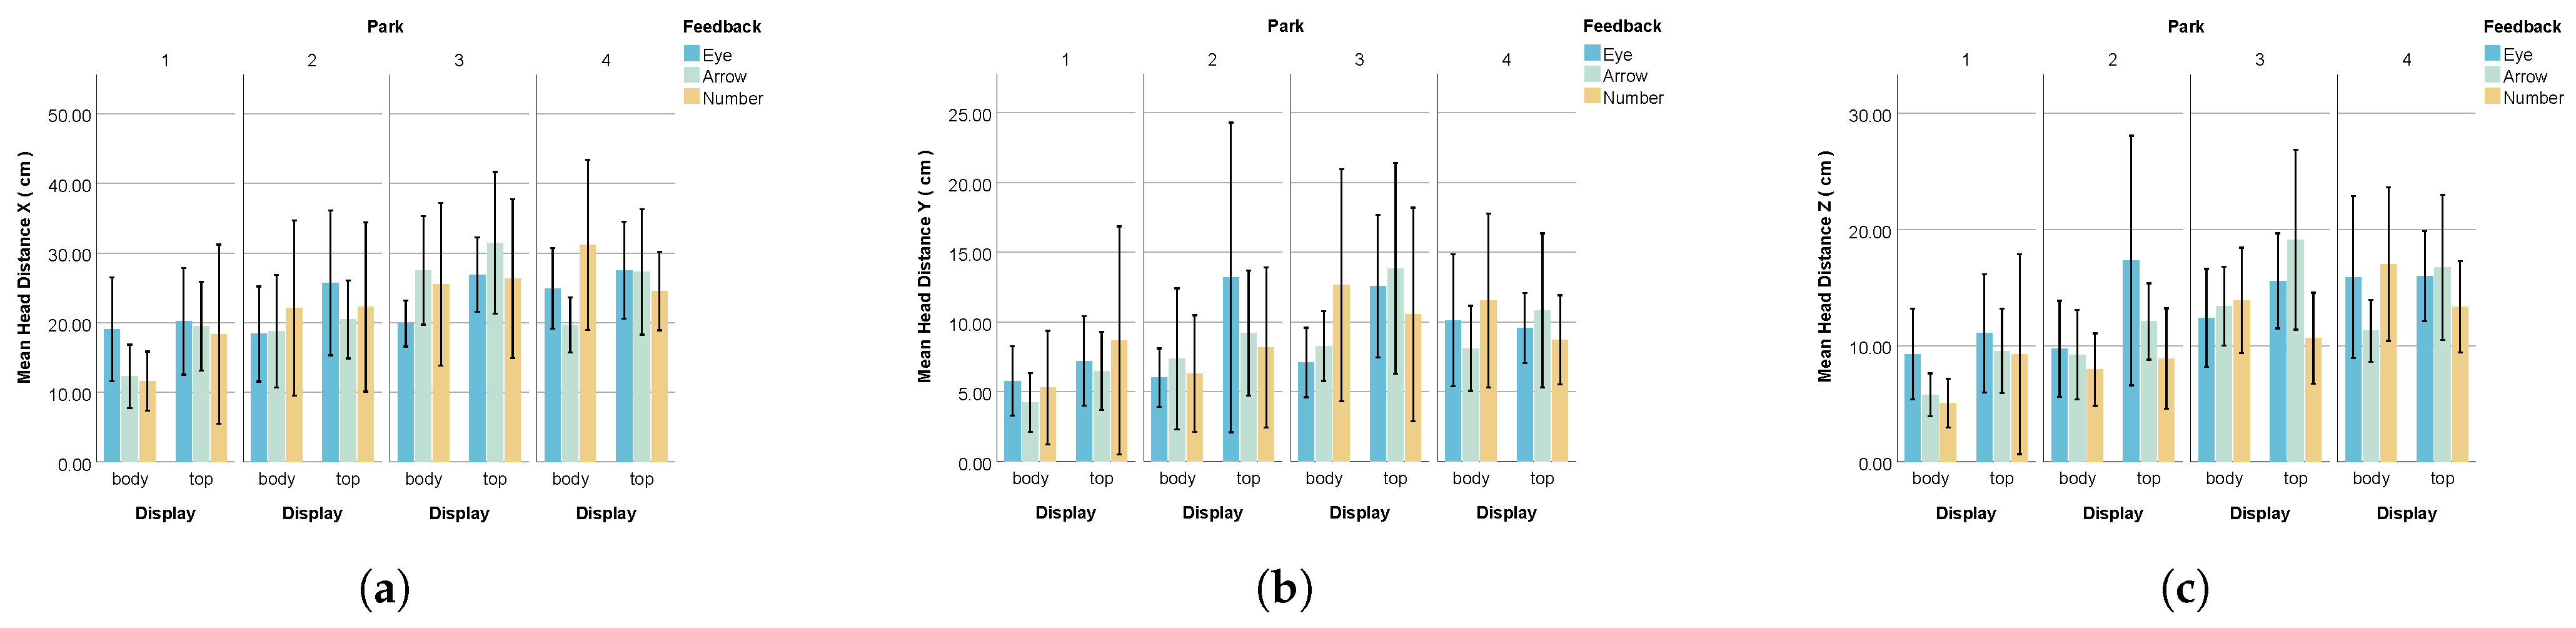
- Head Rotation Angle
- Head Movement Distance
4.2. User Evaluation and Interview
4.2.1. Subjective User Evaluation
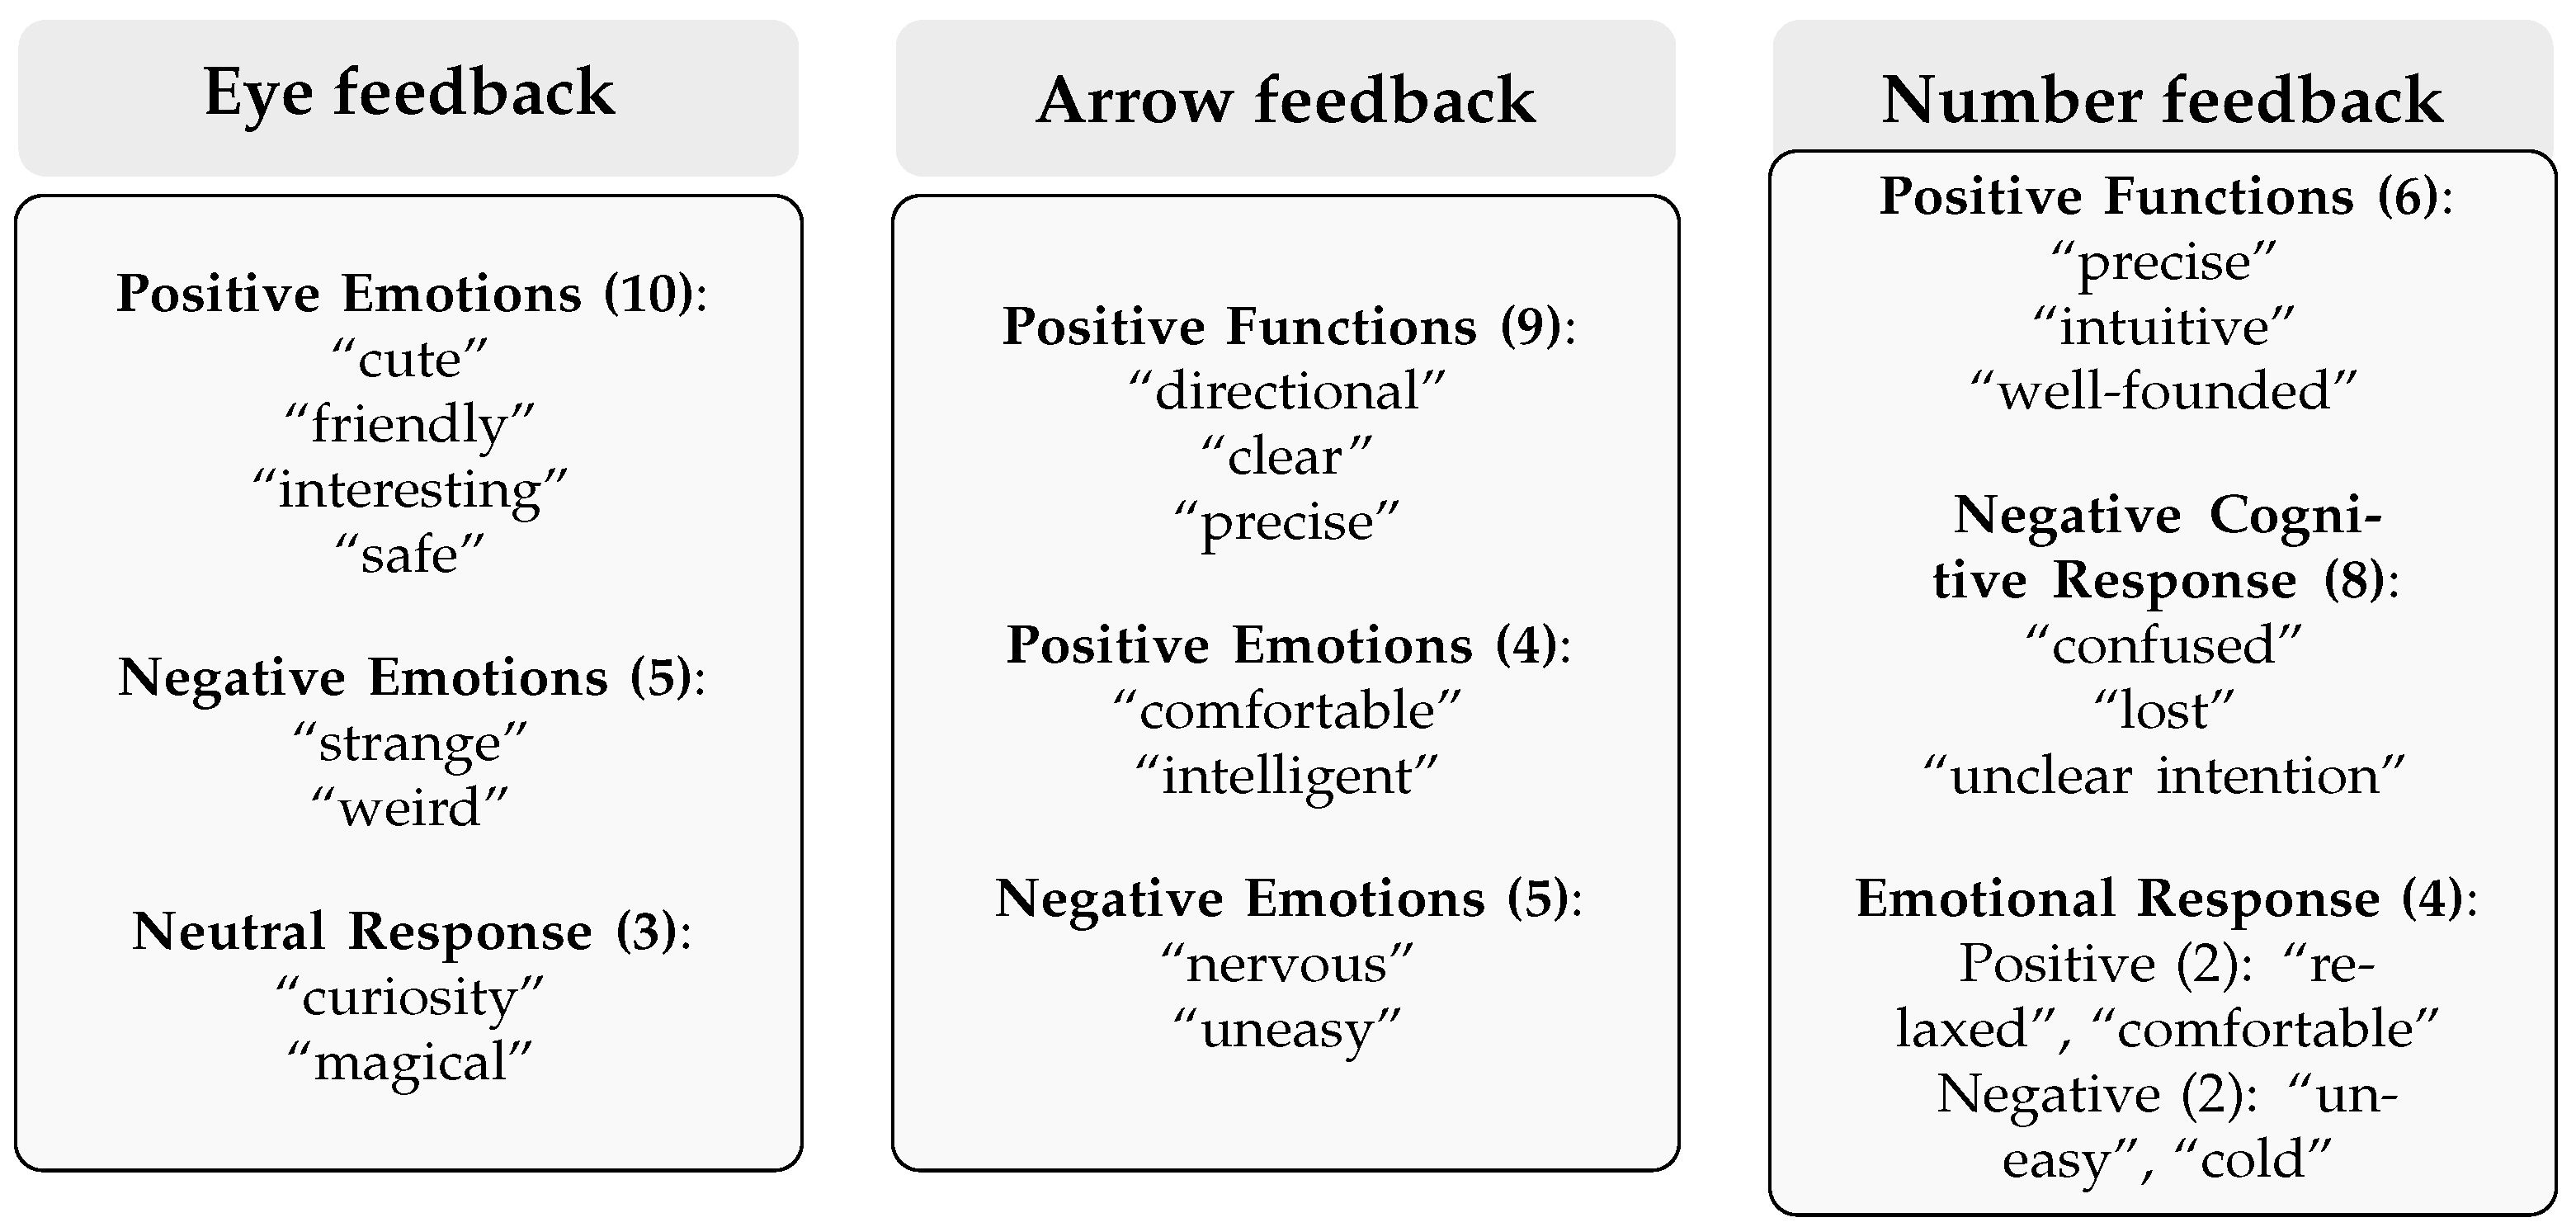
- Eye feedback performed generally positively on the emotional level, with 10 participants giving positive evaluations, significantly more than the 5 who held negative views and 3 who expressed neutral attitudes. This result confirms that anthropomorphic eye feedback can effectively establish emotional connections, although individual differences exist.
- Arrow feedback was primarily recognized for its utility, with nine participants affirming its clear advantages in directional indication, exceeding the five participants who expressed negative emotions. Additionally, four participants reported positive emotional responses to arrow feedback, indicating that while this functional feedback may cause pressure for some users, it is still generally considered a valuable guidance element.
- Attitudes towards Number feedback demonstrated clear differences: although six participants appreciated its precision and clarity, eight participants reported comprehension difficulties, indicating challenges in the understandability of this feedback method. Emotionally, digital feedback elicited fewer strong reactions, with only two participants expressing clearly positive emotions and two expressing negative emotions, reflecting the relatively neutral nature of digital feedback in terms of emotional evocation.
4.2.2. User Interview
5. Discussion
5.1. eHMI Efficiency Across Feedback Modes and Display Positions
5.2. eHMI Accuracy Across Feedback Modes and Display Positions
5.3. Practical Design Guidelines for Effective eHMI in AT Services
- Adopt Eye feedback for distant parking spots to prevent severe errors. Eye feedback effectively reduces error rates and selection deviation when identifying AT parking locations in longer-distance scenarios, preventing severe identification errors while maintaining user engagement and attention. Interaction designers should prioritize eye-based feedback mechanisms when designing eHMI interfaces for longer-range parking spot identification to optimize accuracy and user focus.
- Use Arrow feedback to reduce low-confidence selections. Arrow feedback provides clear directional information that helps users make more confident decisions, significantly reducing error rates and selection deviation when identifying AT parking locations in closer-range scenarios. Interaction designers should incorporate arrow-based visual cues into eHMI design to enhance user confidence and minimize errors when users are identifying which parking spot the AT will occupy.
- Prioritize Number feedback in the top position for quick decisions. Number feedback in the top position leads to the fastest response times. When the rapid identification of an AT’s parking location is critical, Number feedback delivers the shortest response times, particularly for nearby parking spots, with a higher identification accuracy. Interface developers should implement this combination for AT systems requiring the quick identification of parking locations and improved passenger efficiency.
- Position feedback on the vehicle body to improve the accuracy of the perception of autonomous driving intentions. Displaying feedback on the AT’s body reduces errors and selection deviation while improving efficiency in identifying parking location, as users more clearly understand which parking spot the vehicle will occupy. Designers should prioritize this body-located feedback to optimize user experience and comprehension of intentions.
- Implement adaptive feedback to match parking distances and optimize user experience. Display position and feedback mode should adapt to the distance between the user and the parking locations. Arrow feedback works well for closer parking locations, while eye feedback becomes more effective in distant conditions, where users need enhanced depth perception and directional clarity. Interface designers should implement adaptive feedback systems that intelligently switch between modes based on the detected distance to parking locations, optimizing both identification accuracy and user experience.
6. Conclusions
Author Contributions
Funding
Institutional Review Board Statement
Informed Consent Statement
Data Availability Statement
Acknowledgments
Conflicts of Interest
Abbreviations
| AT | Autonomous Taxi |
| AV | Autonomous Vehicle |
| eHMI | external Human–Machine Interface |
| GEE | Generalized Estimating Equations |
References
- Singh, M.K.; Haouari, R.; Papazikou, E.; Sha, H.; Quddus, M.; Chaudhry, A.; Thomas, P.; Morris, A. Examining Parking Choices of Connected and Autonomous Vehicles. Transp. Res. Rec. J. Transp. Board 2023, 2677, 589–601. [Google Scholar] [CrossRef]
- Zeng, T.; Zhang, H.; Moura, S.J.; Shen, Z.J.M. Economic and Environmental Benefits of Automated Electric Vehicle Ride-Hailing Services in New York City. Sci. Rep. 2024, 14, 4180. [Google Scholar] [CrossRef] [PubMed]
- Gui, X.; Javanmardi, E.; Seo, S.H.; Chauhan, V.; Chang, C.M.; Tsukada, M.; Igarashi, T. “text + Eye” on Autonomous Taxi to Provide Geospatial Instructions to Passenger. In Proceedings of the 12th International Conference on Human-Agent Interaction, Swansea, UK, 24–27 November 2024; Association for Computing Machinery: New York, NY, USA, 2024. HAI ’24. pp. 429–431. [Google Scholar] [CrossRef]
- Guéguen, N.; Meineri, S.; Eyssartier, C. A Pedestrian’s Stare and Drivers’ Stopping Behavior: A Field Experiment at the Pedestrian Crossing. Saf. Sci. 2015, 75, 87–89. [Google Scholar] [CrossRef]
- Sucha, M.; Dostal, D.; Risser, R. Pedestrian-Driver Communication and Decision Strategies at Marked Crossings. Accid. Anal. Prev. 2017, 102, 41–50. [Google Scholar] [CrossRef]
- Kim, S.; Chang, J.J.E.; Park, H.H.; Song, S.U.; Cha, C.B.; Kim, J.W.; Kang, N. Autonomous Taxi Service Design and User Experience. Int. J. Hum.-Interact. 2020, 36, 429–448. [Google Scholar] [CrossRef]
- Mahadevan, K.; Somanath, S.; Sharlin, E. Communicating Awareness and Intent in Autonomous Vehicle-Pedestrian Interaction. In Proceedings of the 2018 CHI Conference on Human Factors in Computing Systems, Montreal, QC, Canada, 21–26 April 2018; pp. 1–12. [Google Scholar] [CrossRef]
- Dey, D.; Terken, J. Pedestrian Interaction with Vehicles: Roles of Explicit and Implicit Communication. In Proceedings of the 9th International Conference on Automotive User Interfaces and Interactive Vehicular Applications, Oldenburg, Germany, 24–27 September 2017; Association for Computing Machinery: New York, NY, USA, 2017. AutomotiveUI ’17. pp. 109–113. [Google Scholar] [CrossRef]
- Zheng, N.; Li, J.; Li, N.; Zhang, M.; Cai, J.; Tei, K. Exploring Optimal eHMI Display Location for Various Vehicle Types: A VR User Study. In Extended Abstracts of the CHI Conference on Human Factors in Computing Systems; Association for Computing Machinery: New York, NY, USA, 2024; pp. 1–7. [Google Scholar] [CrossRef]
- Dey, D.; Senan, T.U.; Hengeveld, B.; Colley, M.; Habibovic, A.; Ju, W. Multi-Modal eHMIs: The Relative Impact of Light and Sound in AV-Pedestrian Interaction. In Proceedings of the CHI Conference on Human Factors in Computing Systems, Honolulu, HI, USA, 11–16 May 2024; pp. 1–16. [Google Scholar] [CrossRef]
- Rouchitsas, A.; Alm, H. Ghost on the Windshield: Employing a Virtual Human Character to Communicate Pedestrian Acknowledgement and Vehicle Intention. Information 2022, 13, 420. [Google Scholar] [CrossRef]
- Dey, D.; Van Vastenhoven, A.; Cuijpers, R.H.; Martens, M.; Pfleging, B. Towards Scalable eHMIs: Designing for AV-VRU Communication beyond One Pedestrian. In Proceedings of the 13th International Conference on Automotive User Interfaces and Interactive Vehicular Applications, Leeds, UK, 9–14 September 2021; pp. 274–286. [Google Scholar] [CrossRef]
- Chang, C.M.; Toda, K.; Gui, X.; Seo, S.H.; Igarashi, T. Can Eyes on a Car Reduce Traffic Accidents? In Proceedings of the 14th International Conference on Automotive User Interfaces and Interactive Vehicular Applications, Seoul, Republic of Korea, 17–20 September 2022; Association for Computing Machinery: New York, NY, USA, 2022. AutomotiveUI ’22. pp. 349–359. [Google Scholar] [CrossRef]
- Gui, X.; Toda, K.; Seo, S.H.; Chang, C.M.; Igarashi, T. “I Am Going This Way”: Gazing Eyes on Self-Driving Car Show Multiple Driving Directions. In Proceedings of the 14th International Conference on Automotive User Interfaces and Interactive Vehicular Applications, Seoul, Republic of Korea, 17–20 September 2022; Association for Computing Machinery: New York, NY, USA, 2022. AutomotiveUI ’22. pp. 319–329. [Google Scholar] [CrossRef]
- de Clercq, K.; Dietrich, A.; Núñez Velasco, J.P.; de Winter, J.; Happee, R. External Human-Machine Interfaces on Automated Vehicles: Effects on Pedestrian Crossing Decisions. Hum. Factors 2019, 61, 1353–1370. [Google Scholar] [CrossRef]
- Rettenmaier, M.; Schulze, J.; Bengler, K. How Much Space Is Required? Effect of Distance, Content, and Color on External Human–Machine Interface Size. Information 2020, 11, 346. [Google Scholar] [CrossRef]
- Gui, X.; Toda, K.; Seo, S.H.; Eckert, F.M.; Chang, C.M.; Chen, X.A.; Igarashi, T. A Field Study on Pedestrians’ Thoughts toward a Car with Gazing Eyes. In Extended Abstracts of the 2023 CHI Conference on Human Factors in Computing Systems; Association for Computing Machinery: New York, NY, USA, 2023; pp. 1–7. [Google Scholar] [CrossRef]
- Guo, J.; Yuan, Q.; Yu, J.; Chen, X.; Yu, W.; Cheng, Q.; Wang, W.; Luo, W.; Jiang, X. External Human–Machine Interfaces for Autonomous Vehicles from Pedestrians’ Perspective: A Survey Study. Sensors 2022, 22, 3339. [Google Scholar] [CrossRef]
- Kim, Y.W.; Han, J.H.; Ji, Y.G.; Lee, S.C. Exploring the Effectiveness of External Human-Machine Interfaces on Pedestrians and Drivers. In Proceedings of the 12th International Conference on Automotive User Interfaces and Interactive Vehicular Applications, Virtual, 21–22 September 2020; pp. 65–68. [Google Scholar] [CrossRef]
- Dou, J.; Chen, S.; Tang, Z.; Xu, C.; Xue, C. Evaluation of Multimodal External Human–Machine Interface for Driverless Vehicles in Virtual Reality. Symmetry 2021, 13, 687. [Google Scholar] [CrossRef]
- Alhawiti, A.; Kwigizile, V.; Oh, J.S.; Asher, Z.D.; Hakimi, O.; Aljohani, S.; Ayantayo, S. The Effectiveness of eHMI Displays on Pedestrian–Autonomous Vehicle Interaction in Mixed-Traffic Environments. Sensors 2024, 24, 5018. [Google Scholar] [CrossRef] [PubMed]
- Ackermann, C.; Beggiato, M.; Schubert, S.; Krems, J.F. An Experimental Study to Investigate Design and Assessment Criteria: What Is Important for Communication between Pedestrians and Automated Vehicles? Appl. Ergon. 2019, 75, 272–282. [Google Scholar] [CrossRef]
- Guo, F.; Lyu, W.; Ren, Z.; Li, M.; Liu, Z. A Video-Based, Eye-Tracking Study to Investigate the Effect of eHMI Modalities and Locations on Pedestrian–Automated Vehicle Interaction. Sustainability 2022, 14, 5633. [Google Scholar] [CrossRef]
- Rouchitsas, A.; Alm, H. Smiles and Angry Faces vs. Nods and Head Shakes: Facial Expressions at the Service of Autonomous Vehicles. Multimodal Technol. Interact. 2023, 7, 10. [Google Scholar] [CrossRef]
- Lau, M.; Jipp, M.; Oehl, M. Toward a Holistic Communication Approach to an Automated Vehicle’s Communication with Pedestrians: Combining Vehicle Kinematics with External Human-Machine Interfaces for Differently Sized Automated Vehicles. Front. Psychol. 2022, 13, 882394. [Google Scholar] [CrossRef]
- Fuest, T.; Michalowski, L.; Träris, L.; Bellem, H.; Bengler, K. Using the Driving Behavior of an Automated Vehicle to Communicate Intentions—A Wizard of Oz Study. In Proceedings of the 2018 21st International Conference on Intelligent Transportation Systems (ITSC), Maui, HI, USA, 4–7 November 2018; pp. 3596–3601. [Google Scholar] [CrossRef]
- Pillai, A.K. Virtual Reality Based Study to Analyse Pedestrian Attitude towards Autonomous Vehicles. Master’s Thesis, Aalto University, Espoo, Finland, 2017. [Google Scholar]
- Ezzati Amini, R.; Katrakazas, C.; Antoniou, C. Negotiation and Decision-Making for a Pedestrian Roadway Crossing: A Literature Review. Sustainability 2019, 11, 6713. [Google Scholar] [CrossRef]
- Lee, Y.M.; Madigan, R.; Giles, O.; Garach-Morcillo, L.; Markkula, G.; Fox, C.; Camara, F.; Rothmueller, M.; Vendelbo-Larsen, S.A.; Rasmussen, P.H.; et al. Road Users Rarely Use Explicit Communication When Interacting in Today’s Traffic: Implications for Automated Vehicles. Cogn. Technol. Work 2021, 23, 367–380. [Google Scholar] [CrossRef]
- Jayaraman, S.K.; Creech, C.; Tilbury, D.M.; Yang, X.J.; Pradhan, A.K.; Tsui, K.M.; Robert, L.P. Pedestrian Trust in Automated Vehicles: Role of Traffic Signal and AV Driving Behavior. Front. Robot. AI 2019, 6, 117. [Google Scholar] [CrossRef]
- Holländer, K.; Colley, A.; Mai, C.; Häkkilä, J.; Alt, F.; Pfleging, B. Investigating the Influence of External Car Displays on Pedestrians’ Crossing Behavior in Virtual Reality. In Proceedings of the 21st International Conference on Human-computer Interaction with Mobile Devices and Services, Taipei, Taiwan, 1–4 October 2019; pp. 1–11. [Google Scholar] [CrossRef]
- Epke, M.R.; Kooijman, L.; De Winter, J.C.F. I See Your Gesture: A VR-Based Study of Bidirectional Communication between Pedestrians and Automated Vehicles. J. Adv. Transp. 2021, 2021, 5573560. [Google Scholar] [CrossRef]
- Ackermans, S.; Dey, D.; Ruijten, P.; Cuijpers, R.H.; Pfleging, B. The Effects of Explicit Intention Communication, Conspicuous Sensors, and Pedestrian Attitude in Interactions with Automated Vehicles. In Proceedings of the 2020 CHI Conference on Human Factors in Computing Systems, Honolulu, HI, USA, 25–30 April 2020; Association for Computing Machinery: New York, NY, USA, 2020. CHI ’20. pp. 1–14. [Google Scholar] [CrossRef]
- Lee, Y.M.; Madigan, R.; Uzondu, C.; Garcia, J.; Romano, R.; Markkula, G.; Merat, N. Learning to Interpret Novel eHMI: The Effect of Vehicle Kinematics and eHMI Familiarity on Pedestrian’ Crossing Behavior. J. Saf. Res. 2022, 80, 270–280. [Google Scholar] [CrossRef]
- Tran, T.T.M.; Parker, C.; Yu, X.; Dey, D.; Martens, M.; Bazilinskyy, P.; Tomitsch, M. Evaluating Autonomous Vehicle External Communication Using a Multi-Pedestrian VR Simulator. Proc. ACM Interact. Mob. Wearable Ubiquitous Technol. 2024, 8, 130:1–130:26. [Google Scholar] [CrossRef]
- Colley, M.; Belz, J.H.; Rukzio, E. Investigating the Effects of Feedback Communication of Autonomous Vehicles. In Proceedings of the 13th International Conference on Automotive User Interfaces and Interactive Vehicular Applications, Leeds, UK, 9–14 September 2021; pp. 263–273. [Google Scholar] [CrossRef]
- Colley, M.; Bajrovic, E.; Rukzio, E. Effects of Pedestrian Behavior, Time Pressure, and Repeated Exposure on Crossing Decisions in Front of Automated Vehicles Equipped with External Communication. In Proceedings of the CHI Conference on Human Factors in Computing Systems, New Orleans, LA, USA, 29 April–5 May 2022; pp. 1–11. [Google Scholar] [CrossRef]
- Hensch, A.C.; Neumann, I.; Beggiato, M.; Halama, J.; Krems, J.F. How Should Automated Vehicles Communicate?—Effects of a Light-Based Communication Approach in a Wizard-of-Oz Study. In Advances in Human Factors of Transportation; Stanton, N., Ed.; Springer International Publishing: Cham, Switzerland, 2020; Volume 964, pp. 79–91. [Google Scholar] [CrossRef]
- Nguyen, T.T.; Holländer, K.; Hoggenmueller, M.; Parker, C.; Tomitsch, M. Designing for Projection-Based Communication Between Autonomous Vehicles and Pedestrians. In Proceedings of the 11th International Conference on Automotive User Interfaces and Interactive Vehicular Applications, Utrecht, The Netherlands, 21–25 September 2019; pp. 284–294. [Google Scholar] [CrossRef]
- Haimerl, M.; Colley, M.; Riener, A. Evaluation of Common External Communication Concepts of Automated Vehicles for People with Intellectual Disabilities. Proc. ACM Hum.-Comput. Interact. 2022, 6, 1–19. [Google Scholar] [CrossRef]
- Faas, S.M.; Baumann, M. Light-Based External Human Machine Interface: Color Evaluation for Self-Driving Vehicle and Pedestrian Interaction. Proc. Hum. Factors Ergon. Soc. Annu. 2019, 63, 1232–1236. [Google Scholar] [CrossRef]
- Bazilinskyy, P.; Dodou, D.; De Winter, J. External Human-Machine Interfaces: Which of 729 Colors Is Best for Signaling ‘Please (Do Not) Cross’? In Proceedings of the 2020 IEEE International Conference on Systems, Man, and Cybernetics (SMC), Toronto, ON, Canada, 11–14 October 2020; pp. 3721–3728. [Google Scholar] [CrossRef]
- Colley, M.; Walch, M.; Gugenheimer, J.; Askari, A.; Rukzio, E. Towards Inclusive External Communication of Autonomous Vehicles for Pedestrians with Vision Impairments. In Proceedings of the 2020 CHI Conference on Human Factors in Computing Systems, Honolulu, HI, USA, 25–30 April 2020; pp. 1–14. [Google Scholar] [CrossRef]
- Lim, D.; Kwon, Y. How to Design the eHMI of AVs for Urgent Warning to Other Drivers with Limited Visibility? Sensors 2023, 23, 3721. [Google Scholar] [CrossRef] [PubMed]
- Li, Y.; Dikmen, M.; Hussein, T.G.; Wang, Y.; Burns, C. To Cross or Not to Cross: Urgency-Based External Warning Displays on Autonomous Vehicles to Improve Pedestrian Crossing Safety. In Proceedings of the 10th International Conference on Automotive User Interfaces and Interactive Vehicular Applications, Toronto, ON, Canada, 23–25 September 2018; pp. 188–197. [Google Scholar] [CrossRef]
- Zhanguzhinova, S.; Makó, E.; Borsos, A.; Sándor, Á.P.; Koren, C. Communication between Autonomous Vehicles and Pedestrians: An Experimental Study Using Virtual Reality. Sensors 2023, 23, 1049. [Google Scholar] [CrossRef] [PubMed]
- Eisele, D.; Kraus, J.; Schlemer, M.M.; Petzoldt, T. Should Automated Vehicles Communicate Their State or Intent? Effects of eHMI Activations and Non-Activations on Pedestrians’ Trust Formation and Crossing Behavior. Multimed. Tools Appl. 2024. [Google Scholar] [CrossRef]
- Chang, C.M.; Toda, K.; Sakamoto, D.; Igarashi, T. Eyes on a Car: An Interface Design for Communication between an Autonomous Car and a Pedestrian. In Proceedings of the 9th International Conference on Automotive User Interfaces and Interactive Vehicular Applications, Oldenburg, Germany, 24–27 September 2017; pp. 65–73. [Google Scholar] [CrossRef]
- Löcken, A.; Golling, C.; Riener, A. How Should Automated Vehicles Interact with Pedestrians?: A Comparative Analysis of Interaction Concepts in Virtual Reality. In Proceedings of the International Conference on Automotive User Interfaces and Interactive Vehicular Applications, Utrecht, The Netherlands, 22–25 September 2019. [Google Scholar]
- Faas, S.M.; Mathis, L.A.; Baumann, M. External HMI for Self-Driving Vehicles: Which Information Shall Be Displayed? Transp. Res. Part F Traffic Psychol. Behav. 2020, 68, 171–186. [Google Scholar] [CrossRef]
- Dey, D.; Habibovic, A.; Löcken, A.; Wintersberger, P.; Pfleging, B.; Riener, A.; Martens, M.; Terken, J. Taming the eHMI Jungle: A Classification Taxonomy to Guide, Compare, and Assess the Design Principles of Automated Vehicles’ External Human-Machine Interfaces. Transp. Res. Interdiscip. Perspect. 2020, 7, 100174. [Google Scholar] [CrossRef]
- Eisma, Y.B.; Van Bergen, S.; Ter Brake, S.M.; Hensen, M.T.T.; Tempelaar, W.J.; De Winter, J.C.F. External Human–Machine Interfaces: The Effect of Display Location on Crossing Intentions and Eye Movements. Information 2019, 11, 13. [Google Scholar] [CrossRef]
- Schmidt-Wolf, M.; Feil-Seifer, D. Vehicle-to-Pedestrian Communication Feedback Module: A Study on Increasing Legibility, Public Acceptance and Trust. In Proceedings of the International Conference on Software Reuse, Montpellier, France, 15–17 June 2022. [Google Scholar]
- Tiesler-Wittig, H. Functional Application, Regulatory Requirements and Their Future Opportunities for Lighting of Automated Driving Systems; No. 2019-01-0848; SAE International: Warrendale, PA, USA, 2019. [Google Scholar] [CrossRef]
- Dey, D.; Habibovic, A.; Pfleging, B.; Martens, M.; Terken, J. Color and Animation Preferences for a Light Band eHMI in Interactions between Automated Vehicles and Pedestrians. In Proceedings of the 2020 CHI Conference on Human Factors in Computing Systems, Honolulu, HI, USA, 25–30 April 2020; pp. 1–13. [Google Scholar] [CrossRef]
- Carmona, J.; Guindel, C.; Garcia, F.; De La Escalera, A. eHMI: Review and Guidelines for Deployment on Autonomous Vehicles. Sensors 2021, 21, 2912. [Google Scholar] [CrossRef]
- Singh, P.; Chang, C.M.; Igarashi, T. I See You: Eye Control Mechanisms for Robotic Eyes on an Autonomous Car. In Proceedings of the 14th International Conference on Automotive User Interfaces and Interactive Vehicular Applications, Seoul, Republic of Korea, 17–20 September 2022; pp. 15–19. [Google Scholar] [CrossRef]
- Bindschädel, J.; Krems, I.; Kiesel, A. Two-Step Communication for the Interaction between Automated Vehicles and Pedestrians. Transp. Res. Part F Traffic Psychol. Behav. 2022, 90, 136–150. [Google Scholar] [CrossRef]
- Schömbs, S.; Pareek, S.; Goncalves, J.; Johal, W. Robot-Assisted Decision-Making: Unveiling the Role of Uncertainty Visualisation and Embodiment. In Proceedings of the 2024 CHI Conference on Human Factors in Computing Systems, Honolulu, HI, USA, 11–16 May 2024; Association for Computing Machinery: New York, NY, USA, 2024. CHI ’24. pp. 1–16. [Google Scholar] [CrossRef]
- Hanley, J.A. Statistical Analysis of Correlated Data Using Generalized Estimating Equations: An Orientation. Am. J. Epidemiol. 2003, 157, 364–375. [Google Scholar] [CrossRef] [PubMed]
- Ballinger, G.A. Using Generalized Estimating Equations for Longitudinal Data Analysis. Organ. Res. Methods 2004, 7, 127–150. [Google Scholar] [CrossRef]
- Chen, J.; Li, N.; Shi, Y.; Du, J. Cross-Cultural Assessment of the Effect of Spatial Information on Firefighters’ Wayfinding Performance: A Virtual Reality-Based Study. Int. J. Disaster Risk Reduct. 2023, 84, 103486. [Google Scholar] [CrossRef]
- Nummenmaa, L.; Calder, A.J. Neural Mechanisms of Social Attention. Trends Cogn. Sci. 2009, 13, 135–143. [Google Scholar] [CrossRef]
- Yin, X. Influences of Eye Gaze Cues on Memory and Its Mechanisms: The Function and Evolution of Social Attention. Front. Psychol. 2022, 13, 1036530. [Google Scholar] [CrossRef] [PubMed]
- Visser, T.A.W.; Roberts, A. Automaticity of Social Cues: The Influence of Limiting Cognitive Resources on Head Orientation Cueing. Sci. Rep. 2018, 8, 10288. [Google Scholar] [CrossRef]


| Application Scenario | Feedback Mode | Display Position | References |
|---|---|---|---|
| Pedestrian Crossing | Anthropomorphic Eyes | Front Headlights | [13,14] |
| Front Windshield | [17] | ||
| Arrows/Symbols | Bumper and Radiator Grille | [16] | |
| Roof | [18] | ||
| Front Windshield | [20,21] | ||
| Grille, Windshield and Roof | [23] | ||
| Text Messages | Bumper and Radiator Grille | [16] | |
| Roof | [18] | ||
| Front Windshield | [20,21] | ||
| Grille, Windshield and Roof | [23,52] | ||
| Above Wheels, Road Projection | [52] | ||
| Light Effects | Windshield, Bumper | [9] | |
| Headlights, Front Grille | [15] | ||
| AT Pickup | Eye and Text | Front Windshield | [3] |
| Feedback Mode | Display Position | Theoretical Advantage |
|---|---|---|
| Eye | Body | Emotional engagement + Natural viewing |
| Top | Emotional engagement + Attention capture | |
| Arrow | Body | Directional clarity + Natural viewing |
| Top | Directional clarity + Attention capture | |
| Number | Body | Precision + Natural viewing |
| Top | Precision + Attention capture |
| Characteristics | Statistics |
|---|---|
| All Participants | 18 |
| Male | 9 |
| Female | 9 |
| Age (SD) | 23.83 (1.54) |
| Driving Experience | Number of Users |
| 0 years | 6 |
| 1–5 years | 9 |
| >5 years | 3 |
| Location | Feedback Mode | Improvement (%) | ||||
|---|---|---|---|---|---|---|
| Eye | Arrow | Number | Number vs. Eye | Number vs. Arrow | Arrow vs. Eye | |
| Overall | 11.90 | 11.22 | 9.04 | 24.03% | 19.43% | - |
| Park 1 | 8.48 | 7.14 | 5.40 | 36.32% | 24.37% | 15.80% |
| Park 2 | 10.94 | 11.23 | 8.18 | 25.23% | 27.16% | - |
| Park 3 | 13.83 | 14.21 | 11.02 | 20.32% | 22.45% | - |
| Park 4 | 15.61 | 13.90 | 13.70 | 12.24% | - | - |
| Location | Display Position | Improvement (%) | |
|---|---|---|---|
| Body | Top | Body vs. Top | |
| Overall | 10.22 | 11.09 | 7.84% |
| Park 1 | 6.52 | 7.24 | 9.94% |
| Park 2 | 9.50 | 10.56 | 10.04% |
| Park 4 | 13.84 | 14.94 | 7.36% |
| Feedback Mode | Display Position | Park Location | |||
|---|---|---|---|---|---|
| 1 | 2 | 3 | 4 | ||
| Eye | body | 7.65 | 9.90 | 13.71 | 15.26 |
| top | 9.39 | 12.08 | 13.95 | 15.97 | |
| Arrow | body | 6.40 | 10.10 | 12.63 | 13.03 |
| top | 7.96 | 12.49 | 16.00 | 14.83 | |
| Number | body | 5.66 | 8.56 | 11.87 | 13.34 |
| top | 5.15 | 7.81 | 10.22 | 14.08 | |
| Metric | Eye | Arrow | Number | Comparison | Improvement (%) |
|---|---|---|---|---|---|
| Comprehension | 2.67 | 2.92 | 2.07 | Arrow vs. Number | 41.06% |
| Intention | 5.40 | 5.65 | 4.00 | Arrow vs. Number Eye vs. Number | 41.25% 35.00% |
| Attention | 4.65 | 2.95 | 2.75 | Eye vs. Arrow Eye vs. Number | 57.63% 69.09% |
| Metric | Location | Feedback Mode | Improvement (%) | ||||
|---|---|---|---|---|---|---|---|
| Eye | Arrow | Number | Arrow vs. Eye | Arrow vs. Number | Number vs. Eye | ||
| Error Rate | Park 1 | 0.24 | 0.01 | 0.01 | 95.83% | - | 95.83% |
| Park 2 | 0.39 | 0.08 | 0.53 | 79.5% | 84.91% | - | |
| Selection Deviation | Park 1 | 0.26 | 0.02 | 0.02 | - | - | 92.31% |
| Park 2 | 0.39 | 0.08 | 0.53 | 79.49% | 84.91% | - | |
| Metric | Location | Feedback Mode | Improvement (%) | |||
|---|---|---|---|---|---|---|
| Eye | Arrow | Number | Eye vs. Arrow | Eye vs. Number | ||
| Error Rate | Park 4 | 0.25 | 0.67 | 0.57 | 62.69% | 56.14% |
| Selection Deviation | Park 4 | 0.25 | 0.86 | 0.59 | 70.93% | 57.63% |
| Feedback Mode | Display Position | Park Location | |||
|---|---|---|---|---|---|
| 1 Total (D1, D2, D3) | 2 Total (D1, D2, D3) | 3 Total (D1, D2, D3) | 4 Total (D1, D2, D3) | ||
| Eye | body | 2 (1,1,0) | 7 (7,0,0) | 5 (5,0,0) | 5 (5,0,0) |
| top | 8 (8,0,0) | 7 (7,0,0) | 6 (5,1,0) | 4 (4,0,0) | |
| Arrow | body | 0 (0,0,0) | 1 (1,0,0) | 3 (3,0,0) | 12 (9,2,1) |
| top | 1 (1,0,0) | 2 (2,0,0) | 14 (14,0,0) | 12 (10,1,1) | |
| Number | body | 0 (0,0,0) | 10 (10,0,0) | 8 (8,0,0) | 6 (6,0,0) |
| top | 1 (1,0,0) | 9 (9,0,0) | 13 (11,2,0) | 14 (10,3,1) | |
| Metric | Location | Display Position | Improvement (%) | |
|---|---|---|---|---|
| Body | Top | Body vs. Top | ||
| Error Rate | Overall | 0.20 | 0.38 | 47.37% |
| Park 1 | 0.01 | 0.13 | 92.31% | |
| Park 3 | 0.29 | 0.62 | 53.23% | |
| Selection Deviation | Overall | 0.19 | 0.31 | 38.71% |
| Park 3 | 0.27 | 0.63 | 57.14% | |
| Feedback Mode | Display Position | Confidence Level | Extreme Values | |||
|---|---|---|---|---|---|---|
| Low (0–49%) | Medium (50–89%) | High (90–100%) | 0% Count | 100% Count | ||
| Eye | body | 3 | 13 | 2 | 0 | 0 |
| top | 4 | 12 | 2 | 1 | 1 | |
| Arrow | body | 1 | 11 | 6 | 0 | 1 |
| top | 1 | 13 | 4 | 0 | 1 | |
| Number | body | 5 | 11 | 2 | 1 | 2 |
| top | 3 | 13 | 2 | 0 | 1 | |
Disclaimer/Publisher’s Note: The statements, opinions and data contained in all publications are solely those of the individual author(s) and contributor(s) and not of MDPI and/or the editor(s). MDPI and/or the editor(s) disclaim responsibility for any injury to people or property resulting from any ideas, methods, instructions or products referred to in the content. |
© 2025 by the authors. Licensee MDPI, Basel, Switzerland. This article is an open access article distributed under the terms and conditions of the Creative Commons Attribution (CC BY) license (https://creativecommons.org/licenses/by/4.0/).
Share and Cite
Ren, G.; Huang, Z.; Zhu, Y.; Lin, W.; Huang, T.; Wang, G.; Lee, J. Making Autonomous Taxis Understandable: A Comparative Study of eHMI Feedback Modes and Display Positions for Pickup Guidance. Electronics 2025, 14, 2387. https://doi.org/10.3390/electronics14122387
Ren G, Huang Z, Zhu Y, Lin W, Huang T, Wang G, Lee J. Making Autonomous Taxis Understandable: A Comparative Study of eHMI Feedback Modes and Display Positions for Pickup Guidance. Electronics. 2025; 14(12):2387. https://doi.org/10.3390/electronics14122387
Chicago/Turabian StyleRen, Gang, Zhihuang Huang, Yaning Zhu, Wenshuo Lin, Tianyang Huang, Gang Wang, and Jeehang Lee. 2025. "Making Autonomous Taxis Understandable: A Comparative Study of eHMI Feedback Modes and Display Positions for Pickup Guidance" Electronics 14, no. 12: 2387. https://doi.org/10.3390/electronics14122387
APA StyleRen, G., Huang, Z., Zhu, Y., Lin, W., Huang, T., Wang, G., & Lee, J. (2025). Making Autonomous Taxis Understandable: A Comparative Study of eHMI Feedback Modes and Display Positions for Pickup Guidance. Electronics, 14(12), 2387. https://doi.org/10.3390/electronics14122387