1. Introduction
Urban underground pipelines are vital infrastructure and the “lifeline” for ensuring the operation of cities. Among them, communication pipelines play a crucial role in ensuring information security and promoting the development of the digital economy. At the same time, urban manholes are widely distributed on sidewalks and non-motorized vehicle lanes, and the inspection covers over these pipelines have a significant impact on the safety of pedestrians and non-motorized vehicles. Investigations into safety incidents in recent years have shown that inspection covers, during normal service operations, are frequently subjected to a large number of abnormal damage events, such as overweight vehicles passing at high speeds, pedestrians jumping, malicious vandalism, and theft through cutting. Therefore, structural health monitoring (SHM) is necessary, and many methods of nondestructive testing have been discussed by Kosova, F. et al. [
1]. In such situations, especially in open areas that concern personal safety, sensors need to be installed on inspection covers to detect abnormal events. These sensors can be of many different types, but their essential characteristic is the active detection of vibration signals. When rigidly connected to the inspection cover, the vibration sensors can perfectly capture the vibrations caused by abnormal events, making them more reliable than acoustic sensors or other similar types of sensors.
Similar to the fault detection of rotating machinery, the detection of abnormal events in manhole covers also requires monitoring the vibration signals collected from sensors placed at various locations on the surface of the manhole cover to evaluate the condition of the equipment. Vibration faults involve the extraction and pattern recognition of fault features. However, unlike the fault modes and characteristic representations of rotating machinery systems, the features of the abnormal fault state of the manhole cover discussed in this paper can generally be classified as large-scale mechanical structures, low-frequency vibration modes, and identifiable frequency band fault categories. For example, Xu et al. developed a flexible dynamic model considering unbalanced forces and verified the influence of unbalanced mass on the nonlinear vibration of the flexible system by comparing the displacement and shaft orbit of flexible and rigid rotor systems [
2]. It takes into account the directional linear vibration generated by the unbalanced mass on different nodes and fully demonstrates the multi-dimensional variability and continuous variability of vibration signals in rotating machinery faults. However, in the manhole cover fault vibration studied in this paper, what needs to be studied is the instantaneous, high-intensity energy-concentrated free vibration. The vibration signal type is roughly rich in frequency components, and the characteristic frequency bands of different types of faults are relatively obvious, which is similar to the speed multiplication nature of rotating machinery faults. At the same time, the time-varying nature of the manhole cover fault signal is similar to the situation in which rotating machinery changes with the working conditions in real industrial application scenarios [
3]. Similarly, time, frequency, and time–frequency domain analysis can be applied to extract vibration response features in vibration damage [
4]. Time–domain analysis has been widely applied in fault diagnosis for devices operating in a linear manner. However, due to the simplicity of this method and its inability to effectively address issues caused by parameter fluctuations due to varying operating conditions, it faces many challenges when used in scenarios with variable working conditions or excessive changes in domain parameters [
5]. At the same time, there are also many very important studies in frequency domain and time–frequency domain detection methods. For instance, Wang et al. applied short-time Fourier transform and independent component analysis techniques in the time–frequency domain to enhance the anti-interference capability of nonlinear operating equipment in strong background noise [
6].
Due to the limitations of traditional signal processing methods and the rapid development of deep learning technology in recent years, along with its demonstrated superior performance, many researchers have applied deep learning to structural health condition monitoring. In the early stages, a single deep learning (DL) model, such as a convolutional neural network (CNN) [
7,
8,
9,
10], recurrent neural network (RNN) [
11,
12,
13,
14,
15], and autoencoder (AE) [
16,
17], was used for fault diagnosis by verifying data in a time series. With deeper research into models, the advancement of big data and intelligent sensing technologies has led to the emergence of more powerful models. For example, Konar and others researched feature selection and usage to evaluate the efficiency of learning models [
18].
Although there are various neural network-based fault diagnosis systems and models, with the increase in data complexity, the requirement for accuracy, the need for anti-interference performance, etc., the structure of existing neural networks is gradually unable to meet the actual industrial production requirements, and low computing efficiency and speed have become problems that need to be urgently solved in previous models. Therefore, Zhang et al. first proposed the ShuffleNet network in 2017. Its unique design concept and high computing efficiency make it a leader in lightweight computing networks. Its overall architecture is based on the residual network. Through the innovative introduction of group convolution and channel rearrangement, the information interaction efficiency under a certain number of MACs and structural quantities is significantly improved, and the computing efficiency is greatly improved [
19]. In the following time, a large number of scholars further improved the performance by learning the design ideas of this model. For example, Megvii Inc further developed the V2 version of the model based on ShuffleNet. It further balanced the optimal state between computational efficiency and model accuracy by introducing channel rearrangement and improving the structure and number of group convolutions. This model is widely used in various fault identification fields [
20]. For example, Luo et al. used complementary integrated empirical mode decomposition to denoise the signal, used ShuffleNet V2 to quickly and accurately identify the target, and used the improved linear unit activation function to avoid network necrosis, and the model efficiency was significantly improved [
21]. However, a large amount of interference information will appear in actual industrial applications, which will significantly reduce the recognition progress of various models. Therefore, Wang et al. used the VMD-Hilbert and ShffleNet V2 networks to extract a large number of interference signals in the electrical system and identified them through sensitive IMF discrimination algorithms. Experiments show that the model has high recognition accuracy [
22].
In practical engineering applications, obtaining a large number of fault samples requires significant time for testing and production, which is both difficult and expensive. Additionally, the number of samples for different fault types may vary, and within the same domain, samples may have various potential deviations [
23]. As a result, continuing to use traditional models may face issues such as sample scarcity and insufficient feature extraction depth, leading to the model being unable to fully learn and understand fault patterns [
24]. Therefore, one of the problems to solve is to develop an efficient and sufficiently generalized structural vibration model while maintaining high accuracy and robustness. In the vibration signal analysis of inspection covers or similar structures, numerous researchers have conducted extensive studies on the resonance signals when the equipment is in an abnormal state. However, there is currently no research in the literature regarding the impact of changes in equipment joint conditions during long-term operation of static devices, particularly concerning the impact load on inspection covers caused by moving wheels when there is a height difference between the cover and surrounding structures. That is, no analysis model exists to calculate the stress load and high-impact shock caused by moving wheels on the inspection cover. At the same time, the means of adapting the detection method to the prediction model refer to the new model for AC strain estimation developed by Plati, C et al. and the empirical equations, such as that for tensile strain, used in its application [
25]. To address the limitations and challenges faced by existing diagnostic systems in the context of urban intelligent infrastructure, particularly concerning the safety of road inspection covers, this paper proposes a novel approach based on an advanced diagnostic model and optimized loss functions to enhance the accuracy and robustness of fault detection systems [
26]. The proposed method includes several key innovations:
In this study, we design a hybrid architecture that integrates continuous wavelet transform (CWT) with the advanced lightweight network ShuffleNet. Through joint optimization of forward and backward propagation paths, as well as improvements to the loss function, we developed a deep domain adaptation network named EDDNET. By leveraging wavelet analysis to process structural vibration signals with non-stationary components, we extract higher-quality and more discriminative fault features. A loss function optimization strategy based on wavelet characteristics is proposed, which more closely aligns with the waveform of actual fault signals. Unlike traditional models based on convolutional neural networks (CNNs), our model is built upon ShuffleNet V2, offering enhanced robustness and sensitivity to unique waveform patterns in fault signals. This design also significantly improves domain adaptation effectiveness, enabling more accurate diagnosis of inspection cover faults in urban pipeline networks.
The main contributions of this paper are summarized as follows:
Development of a lightweight sensing system based on micro-MEMS vibration sensors, capable of capturing subtle real-time vibration signals to detect a wide range of abnormal damage events and to build a representative dataset;
Proposal of a novel fault classification algorithm (EDDNET) tailored to miniature networks, combining wavelet transforms with advanced adversarial learning methods to extract deep features from vibration signals;
Enhancement of model performance on imbalanced data by optimizing the loss function in adversarial domain adaptation learning, thereby improving the model’s generalization ability;
Validation and optimization of the algorithm through the design of a six-degree-of-freedom vibration model and a modal vibration analysis model to ensure accurate identification of real-world fault features.
By deploying our self-developed intelligent sensors on urban pipeline inspection covers and collecting real-world vibration data, we conducted both simulation and field tests. Comparative experiments with multiple contemporary algorithms demonstrated that our method achieves superior accuracy and proves to be more effective than existing approaches. The model architecture designed in this study is presented in
Figure 1.
2. Materials and Methods
2.1. Overview of Pipeline Gallery Manhole Cover
Unlike rotating machinery or other fixed mechanical devices, the parameters that need to be considered in the fault analysis of structural vibrations for inspection covers in urban pipe networks are the overall structural design, material, and the elastic support relationship between the supporting surface and support elements. These factors all influence the vibration components when the inspection cover is subjected to impact. Currently, most inspection covers are made of ductile iron, with a load-bearing capacity ranging from 400 to 900 kN. In practice, severe damage to inspection covers is rare in engineering applications. Therefore, the focus is on two situations: vibrations caused by normal operational loads and abnormal vibrations caused by malicious theft, vandalism, or impact.
During road construction, a significant portion of the inspection cover installation process may face technical and process limitations, leading to a considerable height difference between the inspection cover and the surrounding pavement, with settlement exceeding normal ranges [
27,
28]. These are important causes of abnormal impact vibrations on the inspection cover and its supporting structures. When vehicles, especially heavy trucks, pass over uneven inspection covers and the surrounding road, the inspection cover experiences substantial vibrations and deformation. Such abnormal impacts accelerate the collision between the inspection cover and surrounding structures, further worsening the height difference between the cover and the pavement. The road surface’s flatness continues to degrade, the impact increases, and a vicious cycle is formed [
29,
30]. It can be seen that abnormal impact loads are a major factor contributing to the damage of the inspection cover and road surface flatness, but this situation is unavoidable.
2.2. Modeling Inspection Cover Vibration
Therefore, a numerical analysis method was chosen for this study to establish a three-dimensional vehicle–joint–inspection cover system theoretical model at the uneven ground connection. In this study, to simplify the calculations, the focus was placed on the affected load, and the model of a heavy-duty truck was significantly simplified. Relevant studies have shown that a 1/2 truck model is feasible for analyzing impact loads. As a result, a 1/2 truck model was established, and the situation of a vehicle passing over the inspection cover was simplified [
27,
31,
32,
33]. As shown in
Figure 2, this process can be divided into four stages: entering the area of the surrounding fixtures of the inspection cover from the normal road surface → the region of the inspection cover → the road surface around the inspection cover → the normal road surface.
In the dynamic modeling of this paper, the focus of the study is the impact of the manhole cover surface caused by the height difference of the road surface. Therefore, the settlement of the manhole cover and the surrounding road surface is simplified to the unbalanced excitation of “D1”, and it is assumed that the road surface around the manhole cover is flat and does not change during the simulation. At the same time, it is assumed that the polarization excitation of the cover surface only fluctuates slightly in the vertical axis; that is, the possible rotational dynamic behavior is ignored here. At the same time, due to the particularity of the mechanical structure of the manhole cover, the manhole cover is simplified as a rigid disk, and the appropriate shock-absorbing properties are selected according to the carbon–iron alloy ductile iron material of the manhole cover. The relative friction between the cover surface and the tire and the offset of the impact direction and point are not considered in the simulation process. Now, a six-degree-of-freedom truck load vibration model is established [
34,
35,
36], as shown in
Figure 3. The parameter symbols and their meanings are listed in
Table 1. When the truck passes over the joint and the inspection cover area, the height difference, as well as the deformation and vibration of the inspection cover, will have a significant impact on the truck’s vibration. The impact generated during this process is the focus of this study, and its peak value is of great importance.
To establish the corresponding mathematical model, commonly used motion differential equations include Newton’s method and the Lagrangian equation method. For the six-degree-of-freedom dynamic model designed in
Figure 3, Newton’s method is used to establish the mathematical model. As a result, the following equations can be obtained: (1)–(8).
The “” in the above equation represents the offset of the truck cargo relative to the overall center of mass of the truck. However, in this study, the lateral offset of this component does not significantly affect the final results and is therefore omitted, so . In other words, by statistical averaging, the center of mass of the truck’s cargo is placed along the central axis of the coordinate system, which is the axis.
There are many methods to solve Equations (1)–(6). In this paper, the transfer matrix method is used, as it is simple to calculate, has a wide range of applicability, and maintains high accuracy.
Assume a displacement–velocity vector, as shown in Equation (7):
At the same time, applying the transfer matrix method to derive Equations (1)–(7) leads to the following Equation (8):
In the formula, matrix describes the dynamic characteristics of the system: . In matrix , is the unit matrix, and is the mass matrix of the system, which includes the vehicle itself, the mass of the vehicle cargo, the mass of each mass block, and the moment of inertia . is the equivalent stiffness matrix, which reflects the coupling effect of each spring element on each degree of freedom in the system, including , , , , , and . is the equivalent damping matrix, which contains the damping coefficients of each part: , , , , , and . In matrix , .
When the vehicle passes through the inspection cover area, the impact load is calculated using Equation (9).
When using the model for analysis and calculation, the corresponding truck model parameters are determined based on relevant literature and field test data.
2.3. Propagation Impact of Abnormal Events on Inspection Cover Structures
In the actual field research and investigation, we found that when inspection covers experience abnormal events or severe damage, the fault or damage points on the inspection cover are always random. Therefore, to better simulate real fault conditions and study the impact of the distribution of vibration points on signal generation and propagation, as well as to investigate whether the installation location of fault monitoring devices affects the monitoring effectiveness, a coupled vibration model of the urban pipeline inspection cover was constructed. This model will use the experimental data and structural parameters of the inspection cover obtained in the experiment of the six-degree-of-freedom impact simulation model designed in the previous section to analyze the tensile stress, compressive stress, and shear stress characteristics of the inspection cover. Here, the inspection parameters used are similar to the non-destructive testing (NDT) methods and detection parameters used by Artagan, S.S. et al. [
34].
The structural model of the inspection cover was designed in AutoCAD 2018. Since real inspection covers have features such as drainage grooves, drainage holes, and friction grooves on the surface, which are not relevant to this study, these components were omitted. Vibration analysis was performed using ANSYS Workbench 2024 R2. The inspection cover is made of cast iron and has the following properties: Poisson’s ratio of 0.26, density of 7200 kg/m3, and Young’s modulus ranging from 110 to 180 GPa.
In this study, ANSYS Workbench 2024 R2 is used to identify the main resonance frequencies under external random excitation through modal analysis, as well as to analyze the vibration response characteristics under random vibrations. ANSYS is renowned in finite element analysis for its powerful computational capabilities, precise analytical abilities, and user-friendly interface, especially in simulating structural dynamics and vibrations.
The meshing process of the inspection cover involves creating a finite element model to represent the geometry of its structure. As shown in
Figure 4, the inspection cover is discretized into 70,767 elements and 122,098 nodes.
2.4. ShuffleNet V2 Network Model Based on CNN and Domain Adversarial Transfer Network (DANN)
The core design concept of convolutional neural networks (CNNs) is composed of local receptive fields, shared weights, and pooling operations. By taking advantage of local receptive fields, this connection method significantly reduces the number of parameters in the deep architecture of large models, while also greatly reducing the difficulty of training the network. CNNs extract task features by stacking a series of repetitive components and layers. As shown in
Figure 5, a typical CNN architecture integrates convolution operations, batch normalization (BN), and the ReLU activation function in a convolutional module.
However, to apply the aforementioned convolutional neural network (CNN) in engineering, a large dataset and labeled data are required to train the model. Such idealized engineering is typically only feasible in a laboratory setting or requires significant time and financial investment. To address the shortage of datasets and the domain shift between the test data and the training data, some research in the academic community has started to explore transfer learning (TL) [
37].
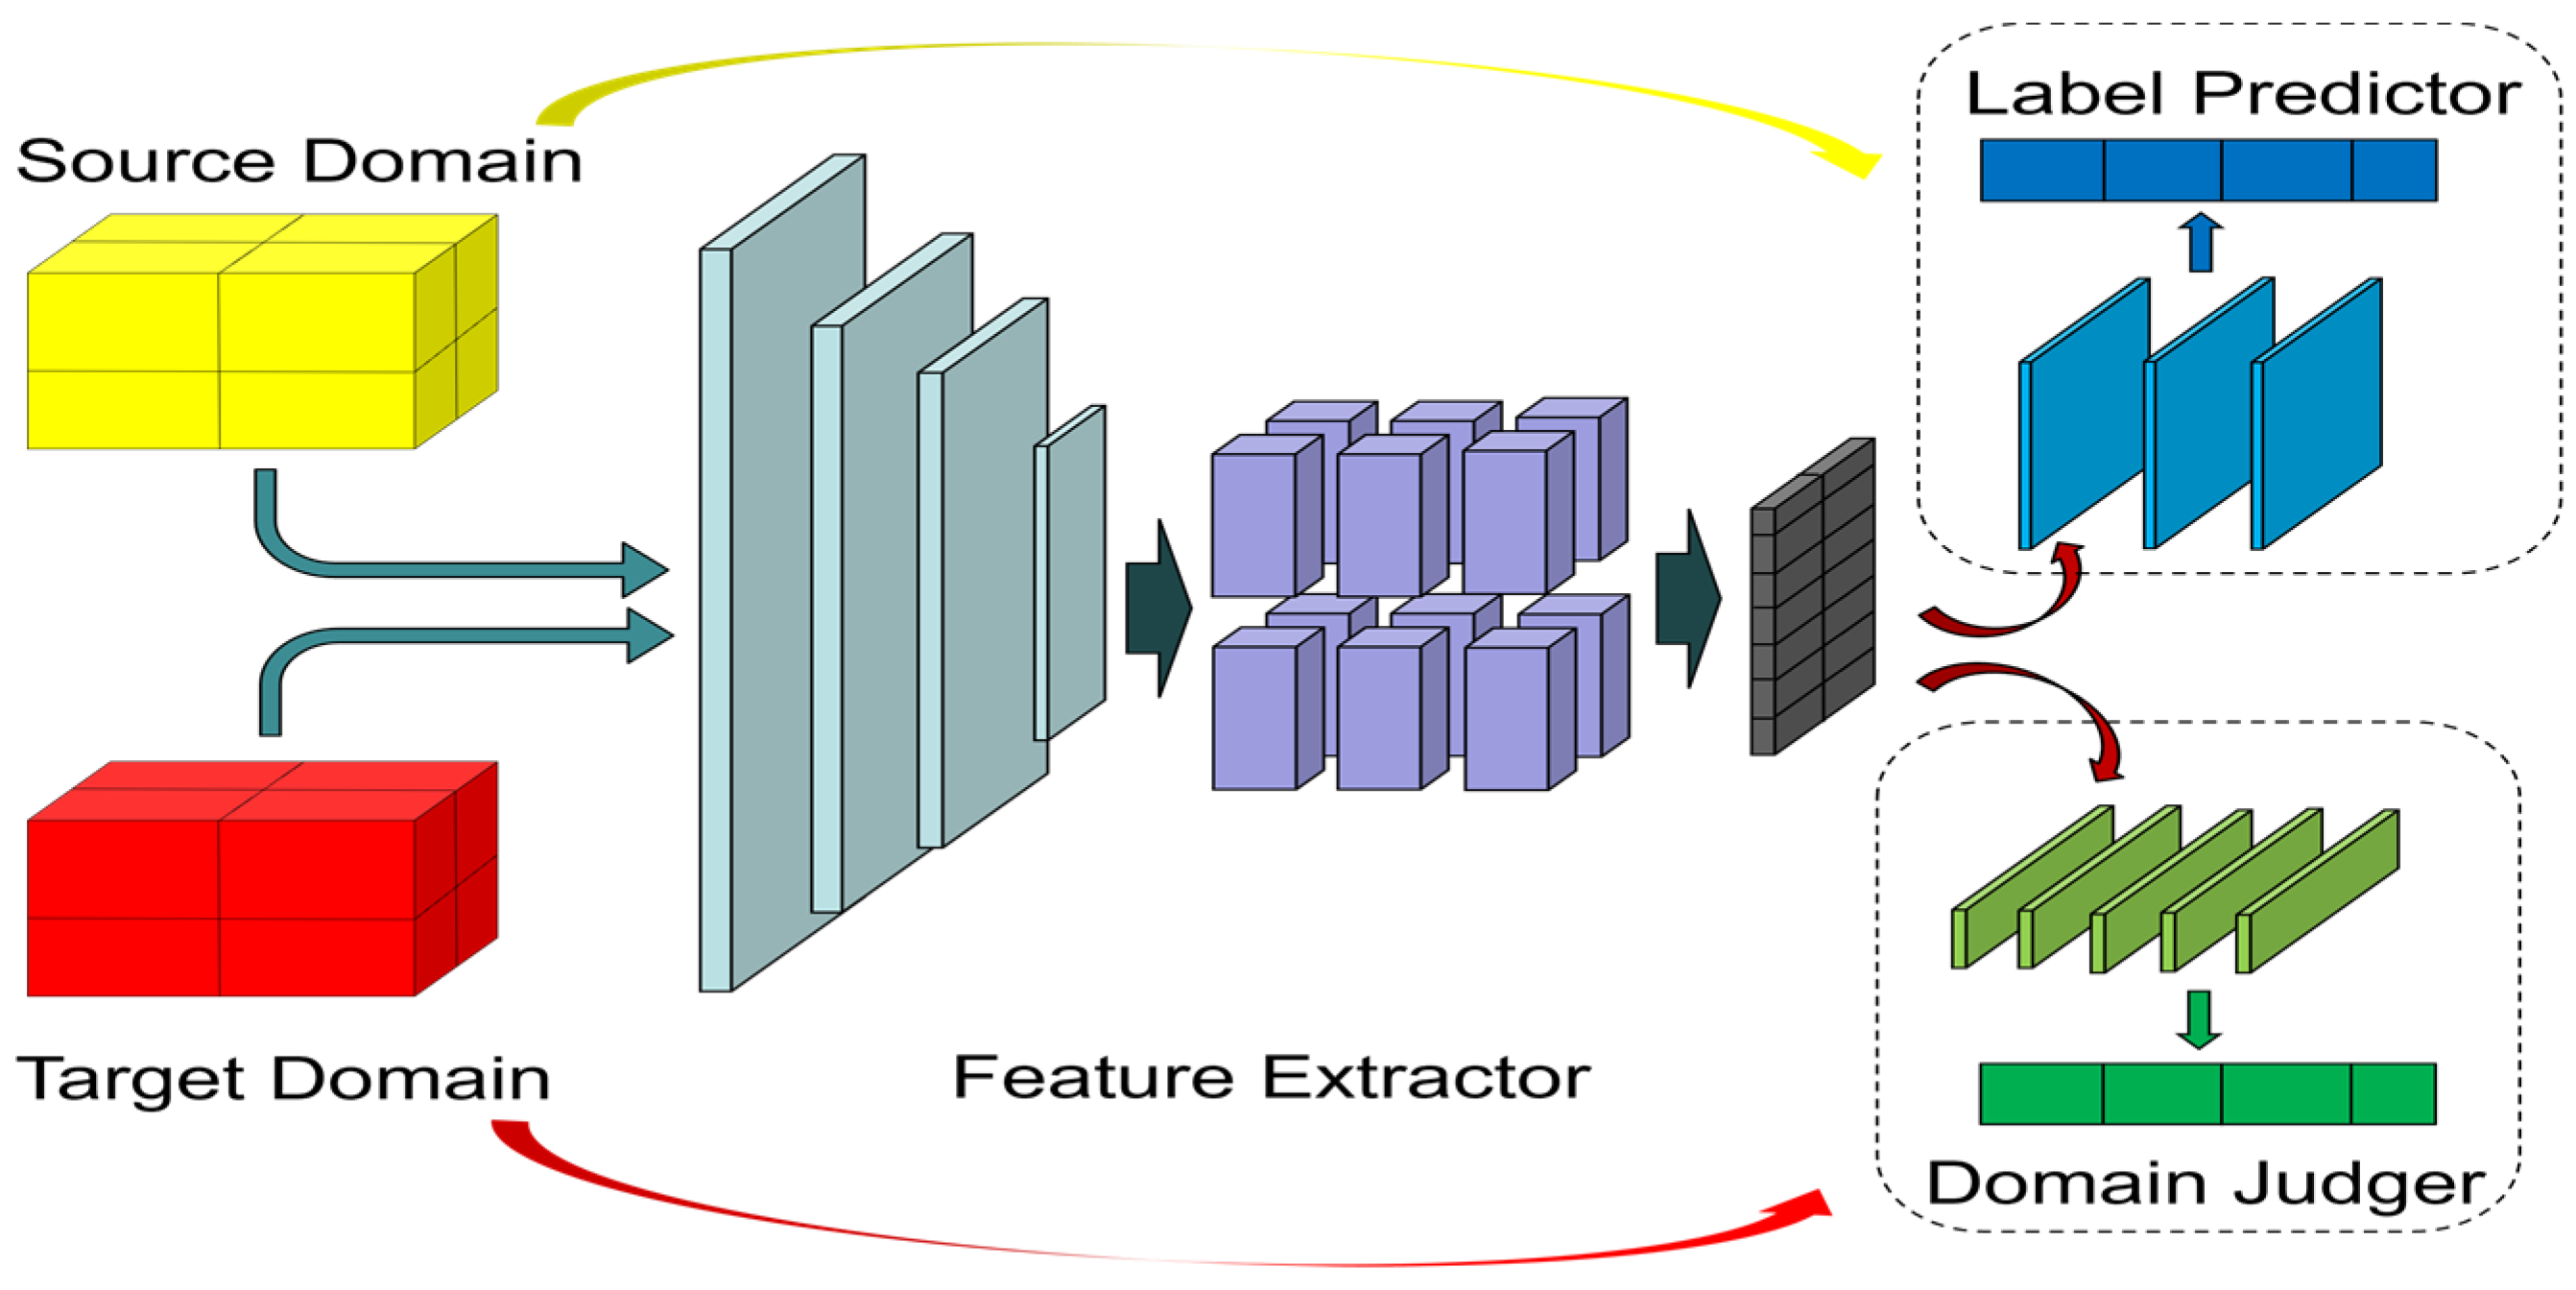
The domain-adversarial neural network (DANN) architecture comprises three key components: a feature extraction module, a label prediction module, and a domain classification module, as illustrated below. The feature extractor forwards its output to the domain classifier, whose role is to distinguish whether the input originates from the source or target domain while computing the associated domain loss. During training, the model simultaneously optimizes two objectives. Firstly, minimizing the label predictor’s classification error on annotated source-domain samples to maintain discriminative performance. Secondly, reducing the domain classifier’s loss across both source and target domains to promote feature alignment. This adversarial training mechanism effectively diminishes the distributional divergence between domains, thereby enhancing the model’s generalizability on target-domain data [
37]. Successful domain adaptation is achieved when the domain classifier can no longer reliably differentiate between the two domains, indicating that the learned representations are domain-invariant [
38]. As shown in
Figure 6.
The loss function is defined as follows:
where
is the sum of classification losses.
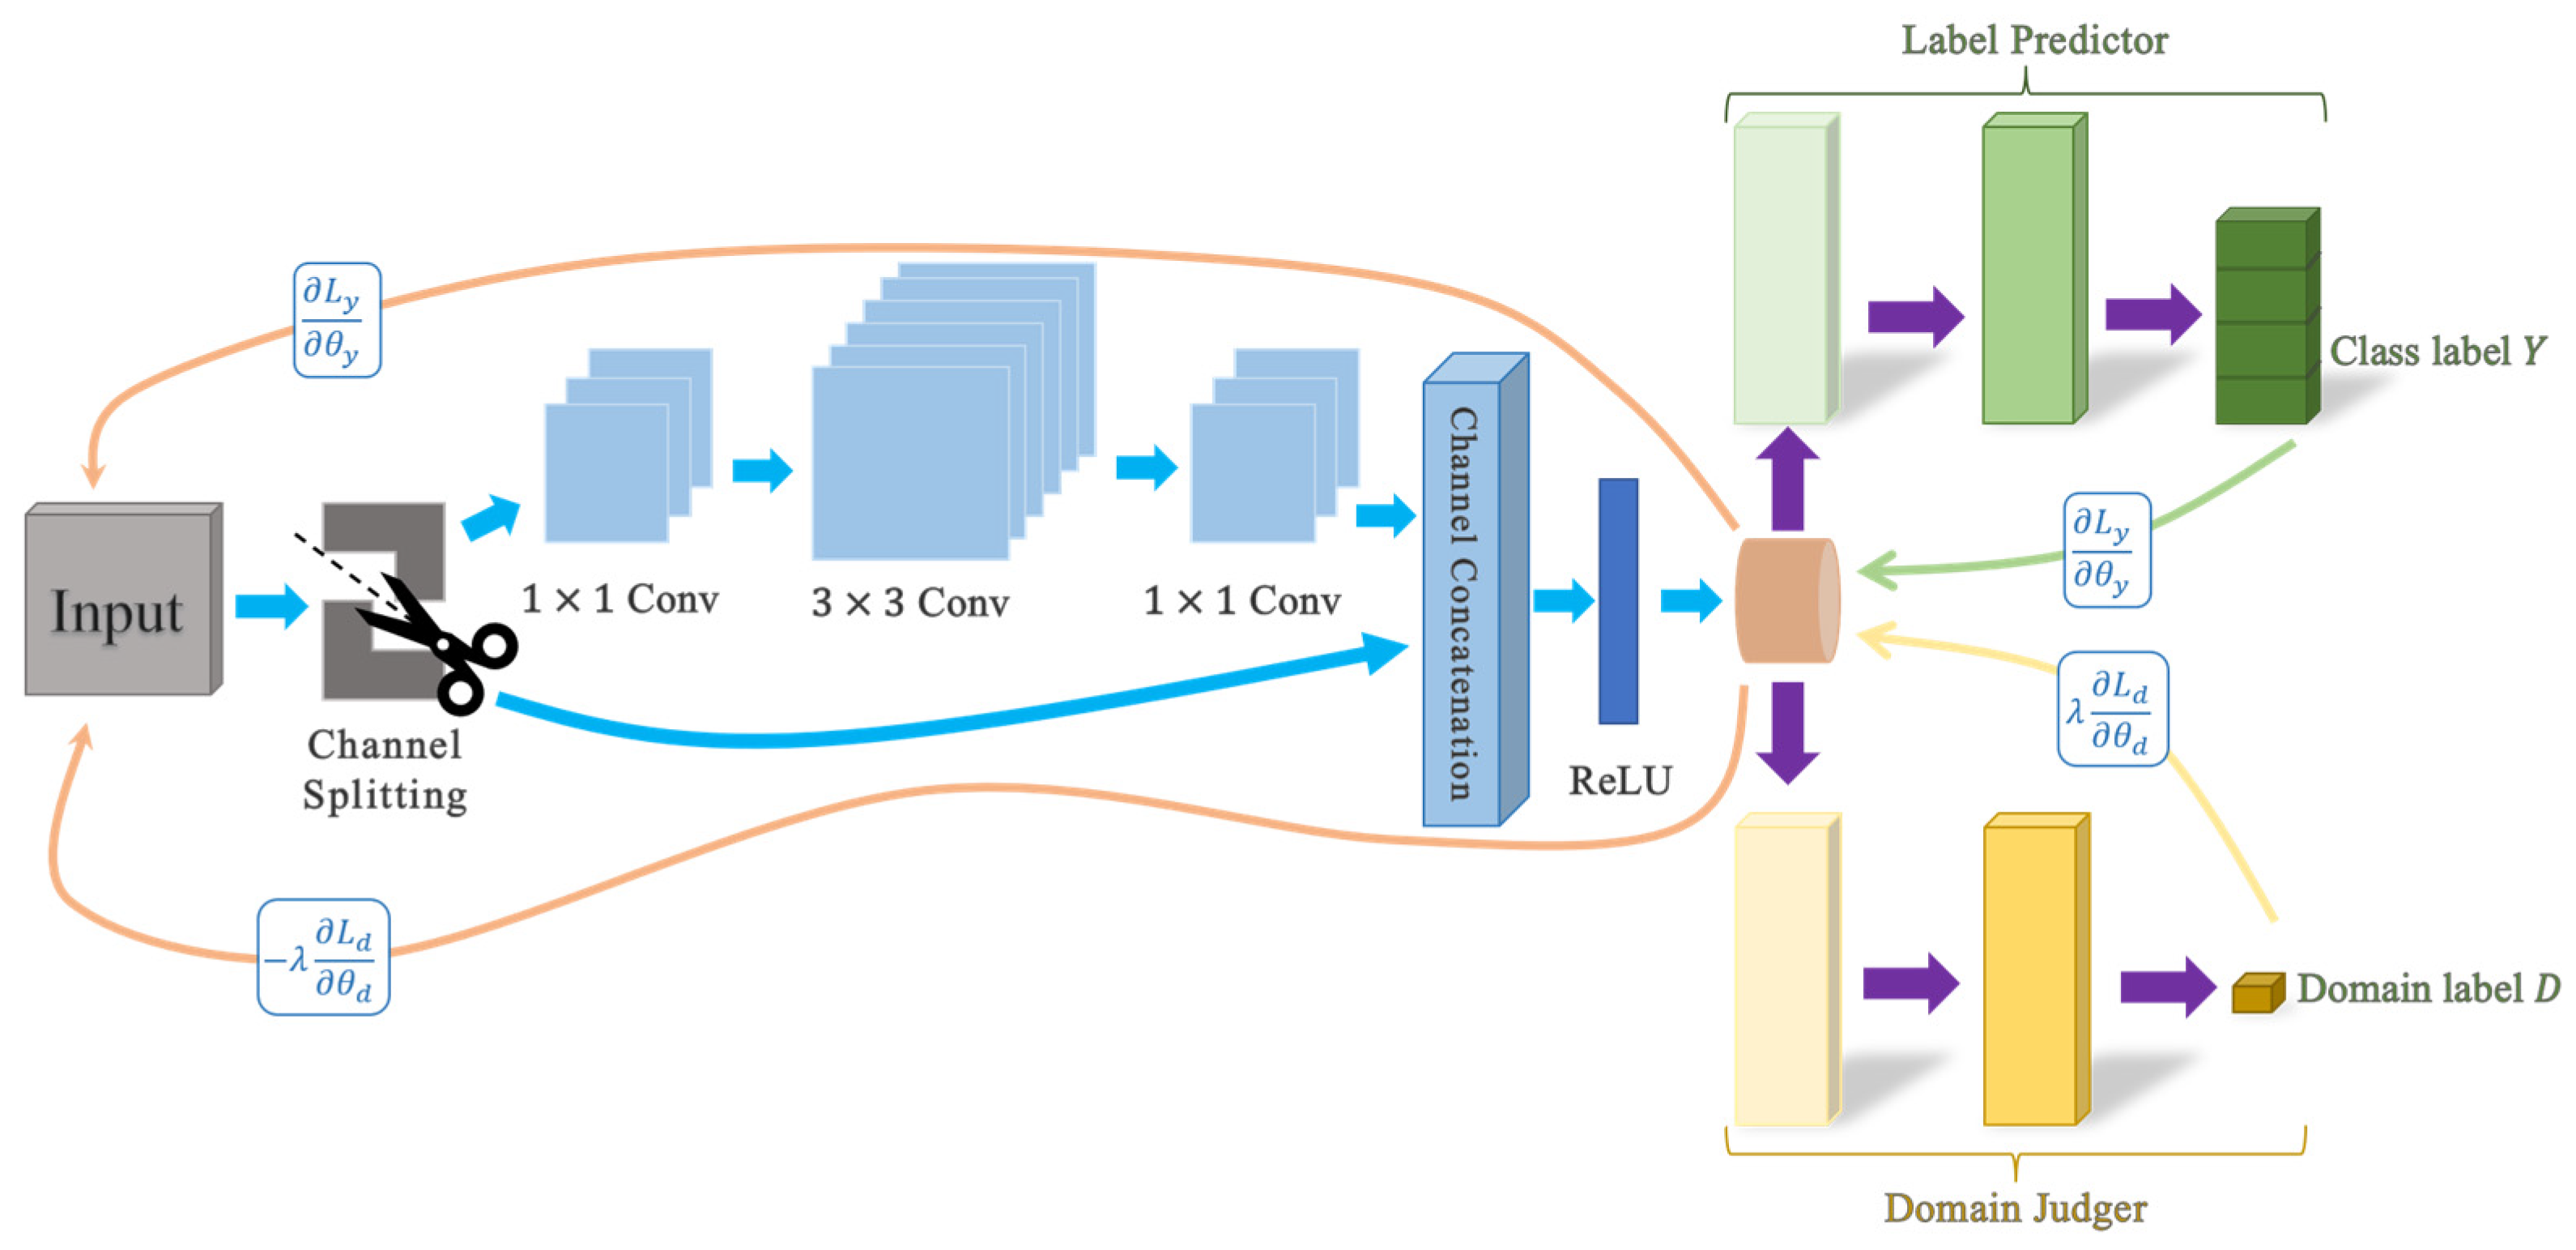
The ShuffleNet V2 network architecture is a lightweight convolutional neural network that is known for reducing the computational complexity of the model while maintaining high detection accuracy. At the same time, its low complexity and light MAC occupation make it deployable on a large number of mobile devices. The core of the ShuffleNet V2 network model structure consists of two components, namely channel shuffle and sub-convolution element-by-element operation. In the channel shuffle introduced in unit S1 of the V2 model, the input channel features are divided into two branches, each branch occupies half the number of channels, and three convolutions with a stride of 1 are introduced in one branch to keep the number of input and output channels the same. Finally, the two branches are connected at the channel level and feature fusion is performed, and finally, the channel shuffle operation is used to make the channels that were initially split interact with each other. Such a channel splitting operation avoids the loss of reduced parallelism caused by network fragmentation. In another unit, S2 of the V2 structure, the channel splitting operation is deleted, and the input feature map directly enters the two branches. The two branches perform 3 × 3 DWConv at the same time, and an additional 1 × 1 convolution layer is added before the global average pooling to enhance the fusion between features and reduce the channel expansion caused by not performing channel splitting. By mixing S1 and S2 units, the feature extraction capability of the V2 model is significantly improved, as shown in
Figure 7.
2.5. Vibration State Recognition Method: Deep Domain Adaptation Network EDDNET
Generally, transfer learning and adversarial domain learning are mainly applied to situations where there is sufficient labeled record data and the source domain dataset is large, while the target domain dataset has some supplementary needs. Additionally, it requires that the feature space and label space of the source and target domains be consistent. However, adversarial domain learning faces the high complexity difference and diversity between the source domain and the target domain, which will make it limited in such applications.
Our proposed network model, EDDNet, is composed of four distinct modules: a data preprocessing module, a feature decoder, a channel attention mechanism module, and a domain adaptation module. To effectively process the acquired sensor signals, we designed a preprocessing module based on continuous wavelet transform (CWT) at the very front of the EDDNet model. This module segments the collected sensor vibration signals into equal-length fragments. Each segment undergoes CWT to accurately localize the signal in both time and frequency domains. By using a Morlet wavelet—a sinusoidal wave modulated by a complex Gaussian window—as the base wavelet, the one-dimensional time-series signals are transformed into two-dimensional spectrograms.
In the feature recognition decoder, we integrate the ShuffleNet V2 architecture, known for its efficiency in rapid feature extraction. Two modules of ShuffleNet V2 are combined in a specific order, and the decoder leverages modules with different stride values to enable deeper and more effective feature decoding. The input spectrograms are first compressed via convolution and pooling, then passed through one downsampling operation via the S2 module and a predefined number of deep feature extraction operations via the S1 module, as shown in
Figure 7. Depthwise grouped convolutions and channel shuffle operations are employed to enhance feature saliency. The final output is connected to a fully connected (FC) layer, which maps the high-dimensional features and generates class-specific feature relevance scores. Channel attention mechanism module: Given the large number of signals collected by the sensors, we incorporate a channel attention mechanism into the EDDNet model to reduce computational burden and improve efficiency. Specifically, we adopt the CBAM (convolutional block attention module) to adaptively weight the channel responses of DWConv layers in the feature decoder, thereby enhancing the ability of the S1 and S2 modules to focus on critical features. In this section, the channel attention and spatial attention sub-modules are combined into the CBAM module and injected after each DWConv layer in both the S1 and S2 modules.
Domain adaptation module: Due to the inherent data imbalance in industrial environments, it is crucial to incorporate a domain adaptation mechanism to maintain classification accuracy across different domains. To this end, we freeze the last FC layer in the feature decoder and use the output of the penultimate FC layer as the input to the domain adaptation module. This module consists of a label predictor and a domain discriminator.
Additionally, the model incorporates a modified loss function designed to minimize inter-domain discrepancies, thereby improving domain adaptation performance.
Conventional approaches often require extensive real-world operational data to accurately capture marginal distribution shifts across domains. To address this limitation, we introduce a statistically driven domain adaptation framework [
39], which reduces reliance on large-scale training datasets.
As an established measure for domain divergence [
40], MMD evaluates distributional discrepancies by mapping source and target domain samples into a shared feature space. Specifically, it computes the squared difference between their empirical means in this space, facilitating alignment of their underlying distributions.
The loss function integrates the maximum mean discrepancy (MMD) metric to jointly optimize classification accuracy and domain alignment during model training. This dual optimization strategy forces the network to concurrently minimize both task-specific prediction errors and inter-domain distributional divergence [
39]. As the MMD term reduces the statistical distance between the source and target domains, their feature distributions become increasingly similar, thereby improving transfer learning performance. The MMD is shown in Equation (11).
Maximum mean discrepancy (MMD) operates as a non-parametric metric that evaluates the discrepancy between probability distributions by comparing their statistical moments across all orders. In contrast, correlation alignment (CA) specifically focuses on matching second-order moments (covariance structures) through nonlinear feature space transformations. The mathematical formulation of this alignment can be expressed as follows:
In order to achieve the goal of enhancing transfer learning capabilities and improving the scope of domain adaptation, this paper proposes a novel metric, CMD, which combines the maximum mean discrepancy (MMD) and covariance alignment (CA) measures. CMD is embedded as a regularization term into the EDDNET network to reduce the distribution mismatch caused by the heterogeneous distribution of samples. Through the integration of CA and MMD, the capacity for domain confusion is augmented, and the suitability for the target task is enhanced.
The representation function of CMD is as follows:
where
is the number of classes.
is the indicator function, where = 1 if the true class of sample is , and = 0 otherwise.
is the probability that sample belongs to class .
The specific working steps of the designed EDDNET model are shown in
Figure 8.
These domain-invariant features subsequently serve as input to an adversarial network architecture that jointly optimizes two objectives: (1) minimizing prediction error through the label classifier and (2) reducing domain shift via the domain discriminator. Training continues until convergence, at which point the optimized parameters are preserved for transfer.
During the adaptation phase, the pre-trained model undergoes fine-tuning using available target-domain samples to improve domain-specific representation learning. This parameter adjustment enhances the model’s capacity to handle distributional differences between domains. The final phase deploys the adapted model for fault classification in the target domain, establishing a robust bearing fault diagnostic system capable of maintaining accuracy across varying operational conditions.
The work conducted in this paper is developed based on lightweight models for the actual needs of industrial sites and is deployed in distributed processing equipment or micro servers by adapting to actual applications. This operation scheme is also adopted in the actual tests and data collection carried out in this paper. By deploying the model in NVIDIA micro servers, it can cover a small range of manhole cover fault detection systems. Using local offline computing at the near end, the actual engineering requirements of reducing latency, reducing bandwidth costs, and supporting local offline operation are achieved.
3. Experiment
3.1. Experimental Design
To better demonstrate the outstanding classification accuracy of the proposed EDDNET network in scenarios with limited datasets, this study employs multiple datasets to test performance, conduct model simulation experiments, and integrate simulation with real-world experiments to validate the superiority of the model. The specific approach is as follows:
Step 1: The Case Western Reserve University (CWRU) dataset (Loparo 2012) is used for standard model-related performance analysis, testing, and optimization. This dataset is publicly available on the CWRU website and is widely recognized in the field of vibration model analysis. Many models have been trained and tested using this dataset, allowing for comparisons with external research to validate the superiority of the proposed model.
Step 2: Since the CWRU dataset consists of vibration data for rotating bearing faults, it differs from the inspection cover anomaly analysis studied in this paper. Therefore, a number of self-developed intelligent vibration sensors were installed beneath inspection covers in urban pipeline corridors in Beijing. Through this approach, real-world data were collected from various events, including pedestrians walking, vehicles passing over, and intentional vandalism, to validate the model’s performance in engineering applications.
Step 3: MATLAB R2021a Simulink was used to simulate the six-degree-of-freedom coupled vibration model of a truck passing over an inspection cover. The simulation focused on analyzing the impact load caused by the height difference between the road surface and the inspection cover, which is one of the main sources of damage in abnormal events. The resulting load curves were used for further analysis.
Step 4: ANSYS Workbench 2024 R2 was utilized to conduct random vibration analysis and stress characteristic analysis under specific loads. This simulation aimed to study stress responses and vibration characteristics at various distributed points during abnormal events.
Step 5: The data obtained from (3) and (4) were combined with the real-world data collected in (2) for training and analysis using the proposed EDDNET model. The model’s performance was validated with real data, while the simulated data further substantiated the reliability of the experimental results.
3.2. CWRU Bearing Vibration Dataset Test
In the experimental data collection, four different sampling frequencies were used, but this paper only uses two kinds of typical data, namely, at 12 KHz and 48 KHz, to simulate four fault states by creating operating defects on the rotating equipment. A large number of samples of different working conditions were collected by changing variables such as speed, load size, and continuous operation time. This paper uses normal data with 1 to 3 horsepower load and drive end bearing fault data with a sampling frequency of 48 kHz. The specific CWRU partial data files used are shown in
Table 2.
In this section, the experimental benchmark algorithms are divided into two categories: one is to replace the ShuffleNet V2 network with other baseline networks by replacing the backbone network and verify it on the target dataset at the same time. In the other, the DANN model of this paper is compared with the baseline model using the migration network on the CWRU dataset at the same time.
- (1)
Comparison of domain adaptation algorithm results with different convolutional neural networks:
Figure 9 presents the experimental evaluation of cross-domain bearing fault diagnosis across six distinct operational scenarios. We use data from two working modes to evaluate the accuracy of the domain adaptation algorithm. In this comparison, the detection situation from T1 to T2 means that the model is trained on the data of the first working mode (source domain), the migration network is optimized, and the optimization is fine-tuned in the dataset of the second working mode (target domain). Finally, the accuracy classification is judged by using part of the dataset divided for testing in the target domain. In the figure, the vertical axis represents the average accuracy. At the same time, the comparison of multi-target domain data detection tasks can directly prove the improvement of the model discussed in this paper compared with other methods. The iteration curves of each model used in the experiment are shown in
Figure 10.
The results demonstrate that our ShuffleNet V2-based core architecture achieves consistently superior performance across all transfer tasks, maintaining an average accuracy of 95.23%. Comparative analysis reveals the proposed network’s significant advantage over alternative neural network approaches, exhibiting 10.2% higher mean accuracy with substantially reduced performance variance (p < 0.01). This enhanced stability under varying operational conditions confirms the architectural robustness of our design.
- (2)
Performance comparison between our algorithm and the baseline adaptive algorithm
Figure 11 presents a systematic comparison of four domain adaptation approaches for cross-domain bearing fault diagnosis. Similar to the experimental method conducted in Method 1, the algorithm studied in this paper will be directly compared with the two widely used domain adaptation algorithms, DDC and DANN, and the CNN algorithm without transfer learning. The experimental conditions are the same, and the optimization training and fault diagnosis are still performed separately under different working condition datasets. As shown in
Figure 12, it describes the iterative curve of the accuracy of each model in the experiment.
The non-adaptive approach (direct transfer from source to target domain without adaptation) demonstrates the poorest diagnostic accuracy, with an average performance degradation of 8% across all tasks. This significant performance drop (p < 0.001) confirms the substantial negative impact of domain shift on fault diagnosis reliability.
The DANN architecture outperforms DDC by 10.2% in final accuracy (p < 0.05), demonstrating its superior capability in handling domain shift through adversarial training. However, DDC’s MMD-based adaptation achieves faster convergence, reaching 90% of its maximum accuracy by epoch 50. This efficiency comes at the cost of reduced final accuracy. Our EDDNET algorithm establishes new state-of-the-art performance via the following:
Achieving domain alignment 15% faster than DANN (reaching stable performance by epoch 35);
Improving mean accuracy by 10.2% over DDC and 9% over DANN (p < 0.01);
Maintaining superior stability (σ = 5%) across all transfer tasks.
The visualizations in
Figure 11 further confirm EDDNet’s enhanced domain-invariant feature learning capability, with source and target domains exhibiting near-perfect overlap in the latent space.
3.3. Real-World Pipe Gallery Inspection Cover Dataset and Its Experiments
In certain inspection covers managed by Beixin Company within Beijing, we installed a significant number of intelligent sensors to collect vibration data along the Z-axis. These self-developed intelligent sensors integrate high-precision MEMS vibration sensors and wireless transmission modules. Additionally, a specially designed fastening mechanism minimizes noise caused by gaps, as shown in
Figure 13.
During data collection, the sensors were mounted beneath the center of standard inspection covers in utility tunnels, precisely at the geometric center of the circular cover. By simulating real-world scenarios such as pedestrian passage, pedestrian stepping, and vehicle traversal, we obtained a dataset comprising 104,878 sample points. Some micro sensors will be disturbed by the on-site electromagnetic environment and the vibration signals of surrounding facilities during the data collection stage. Therefore, this article performs corresponding data cleaning and preprocessing on this part of the collected data. In this part, in order to suppress the interference of high-frequency noise on the vibration signal, this article uses a Butterworth-type low-pass filter to process the original data. The Butterworth filter is widely used in vibration and structural signal analysis because of its extremely flat magnitude response (maximally flat magnitude response) in the passband. It is suitable for retaining low-frequency effective signals while filtering out high-frequency noise components. In use, the parameters of the filter are set after the time domain and frequency domain of the collected signal are studied. The cutoff frequency of the filter is set to 10 kHz. Since the signal power of the abnormal state signal is significantly attenuated in the frequency range above 15 kHz, the noise accounts for a high proportion, and the actual effective signal is mainly concentrated in the range of 8–10 kHz. In order to avoid phase distortion during the filtering process, this paper adopts a two-way zero-phase filtering method; that is, the signal is filtered twice in the forward and reverse directions through the filtfilt function to ensure that the phase of the signal remains unchanged after filtering. In this study, the low-pass filter adopts a fourth-order design, and its order makes a trade-off between ensuring the steepness of the frequency response and the stability of the system. At the same time, in order to more intuitively see the impact of changes on the waveform and perform simple preprocessing, further improve the stability of the signal, and reduce the influence of local fluctuations on feature extraction and visualization results, this paper applies sliding average smoothing to the filtered signal. The sliding average method is a non-parametric smoothing method. Its core idea is to average the signal amplitude in a time window of fixed length, thereby suppressing rapid fluctuations on a short time scale. The sliding window length selected in this paper is 10 points (corresponding to a time span of about 210 μs), which is mainly used to weaken the residual high-frequency disturbances while retaining the main trends and local extreme value characteristics of the original signal as much as possible. Compared with other smoothing methods such as Gaussian filters or Savitzky–Golay filters, the sliding average method has the advantages of simple implementation and high computational efficiency. This method is an extremely low-order FIR filter whose impulse response is a rectangular window of fixed width, which is suitable for smoothing and suppressing the non-periodic noise studied in this paper. This paper establishes a filtering and smoothing program in MATLAB R2021a to preliminarily process the collected data and display some representative signals of various abnormal states. Sample oscillation plots for certain events are shown in
Figure 14 and
Figure 15, where characteristic peaks have been analyzed and labeled.
Meanwhile, we performed a Fourier transform on the feature signal segments, marked the characteristic frequency bands of the abnormal signals, and displayed the data in a time–frequency diagram, as shown in
Figure 16.
We utilized the collected and labeled dataset to train and test the proposed EDDNet model along with various mainstream classification models to evaluate classification performance. Analysis of the confusion matrix indicates that in non-anomalous event classification, there is little difference in classification accuracy among various models. For events with strong vibration signals, such as vehicle traversal, all models demonstrated relatively high classification accuracy. However, EDDNet outperformed other models in classifying these events, achieving the highest accuracy of 88.23%. Through data analysis, the thermal chaos matrix was obtained, further proving the superiority of the validated model, as shown in
Figure 17.
3.4. Inspection Cover Structure Load Simulation Experiment
In this section of the experiment, pre-defined impact and load data were used, which were derived from long-term statistical records of inspection cover damage collected by Beixin Company.
First, a modal analysis was conducted on a standard inspection cover under no-load conditions to determine its natural frequency characteristics. In this analysis, no defects occurred in the inspection cover structure, and analytical data were obtained through a 10th-order calculation process. Extensive experimental data and results fully demonstrate that the structural vibration peak occurs at 20,479 Hz, with a maximum displacement of 946.58 mm. Additionally, the results from modal analysis indicate that under 10th-order frequency vibrations, the inspection cover structure undergoes significant deformation, reaching the threshold of structural tolerance. A large amount of field observation data also confirms that the impact amplitude cannot cause the natural frequency of the inspection cover to exceed this value. The modal analysis data are shown in
Figure 18 and
Figure 19.
Furthermore, a preset impact load of 0.94 MPa was applied to the inspection cover to analyze its total deformation, equivalent stress, and directional deformation. The recorded data were compared with the results of the vibration coupling model. The findings show that the amplitude curve corresponds to that obtained from the coupled vibration model, demonstrating the accuracy of the designed vibration model. This also verifies that the self-vibration response of the inspection cover to vibration signals matches the designed model. The stress contour diagram is shown in
Figure 20.
3.5. Analysis of Six-Degree-of-Freedom Vibration Coupling Model
When a vehicle moves from the sidewalk onto the surface of the inspection cover, the impact load coefficient “
“ is used to analyze the effect of heavy loads on the inspection cover at a certain driving speed. The calculation formula for the impact load coefficient is shown in Equation (15).
Both and are measured in .
After performing the computational analysis in MATLAB R2021a, we obtained the time-series curve of the impact load coefficient ”
”. As shown in
Figure 21, the impact load coefficient exhibits a significant mutation under the excitation caused by the height difference between the road surface and the inspection cover. The curve clearly demonstrates two distinct transition phases.
When the vehicle enters the sidewalk area but has not yet reached the inspection cover surface, slight weight fluctuations occur due to road unevenness, causing the value to gradually decrease until it reaches a minimum value of 0.392 at 0.15 s. When the truck crosses the uneven gap between the road and the inspection cover, it experiences a downward impact response, leading to a significant increase in . This process continues until the wheels leave the inspection cover surface, reaching a peak value of 1.35 at 0.227 s. From the data, we can conclude that heavy-load vehicles generate a substantial impact load when crossing the joint between the inspection cover and the pedestrian road, which can result in inspection cover damage.
Accordingly, this paper compares and analyzes the impact waveform obtained by the six-degree-of-freedom vehicle vibration model in the simulation experiment with the experimental data conducted in a real scene. In the experiment conducted on site, the relevant data of the vehicle are the same as that in the model, and the speed of the vehicle is controlled by the same variables as those used in the simulation. The comparison results are shown in
Figure 22. By comparing the spectra of the waveforms obtained from the two experiments, it is found that both have significant impact spectrum characteristics. In the abnormal state of the vehicle passing through the height of the manhole cover, there is a significant impact main frequency in the signal characteristics. At the same time, it is found that the frequency band of the impact main frequency is the same, the frequency value peak occurs in the range of 2000–3000 Hz, and the peak value is also similar. Additionally, the impact data closely match the peak values of the real-world vibration signals collected on site, further validating the authenticity of the dataset used in this study.
4. Conclusions
When deep learning methods are applied to the task of diagnosing vibration signals from pipe corridor manhole covers exhibiting various abnormal fault states, improving diagnostic accuracy and monitoring efficiency becomes crucial, especially under conditions where fault samples are scarce and fault types are diverse. This paper adopts the lightweight ShuffleNet V2 architecture as the core of the proposed model, modifies the order of its two primary modules to better suit the problem setting, and integrates the CBAM attention mechanism to enhance the model’s focus on both spatial and channel-wise features. A domain adaptation strategy is employed by designing a label predictor and a domain discriminator, aiming to enhance the model’s generalization capability through adversarial training. In addition, the transfer performance is further improved by minimizing the maximum mean discrepancy (MMD) between domains. Given that ShuffleNet V2 offers low computational complexity, the model is suitable for deployment on edge devices, thus improving the system’s overall reliability and real-time monitoring capability.
Through on-site investigations of inspection cover damage and a large number of abnormal events that cause damage, it was found that the primary cause of damage is the high-impact load generated when vehicles pass over height differences caused by inspection cover settlement or construction defects. When vehicles pass over the gap between the inspection cover and the road surface, which has a certain height difference, the impact load reaches a maximum value of 1.22. This peak value is similar to the peak obtained from the dynamic impact load simulation in the structural vibration analysis of the inspection cover, indicating that vehicles passing over uneven gaps generate significant impact loads on the inspection cover, leading to strong vibration response signals.
By installing signal acquisition devices on the inspection cover, real vibration data were collected. The proposed EDDNet network was used to validate performance on this dataset. Under conditions of limited sample size and domain imbalance, the model achieved a classification accuracy of 95.23% for diagnosing three types of abnormal inspection cover events, surpassing other neural network-based classification methods and demonstrating the superiority of the proposed model. This study verifies the effectiveness and necessity of installing an abnormal vibration analysis system on urban utility inspection covers through theoretical analysis, field investigation, simulation validation, data collection, algorithm model design and optimization, as well as data testing. The developed algorithm model demonstrates sufficient accuracy to provide early warnings for inspection cover damage events in real-world engineering applications. Our vision is to deploy as many devices as possible in critical and necessary locations to collect extensive data, thereby enhancing the system’s ability to identify previously undetected faults and ultimately reducing incidents that cause personal injury and property loss.


 ,
, 


