Article

Multimodal Pathological Image Segmentation Using the Integration of Trans MMY Net and Patient Metadata

1
State key Laboratory of Extreme Environment Optoelectronic Dynamic Measurement Technology and Instrument, North University of China, Taiyuan 030051, China
2
Shanxi Key Laboratory of Intelligent Detection Technology & Equipment, North University of China, Taiyuan 030051, China
*
Authors to whom correspondence should be addressed.
Electronics 2025, 14(12), 2369; https://doi.org/10.3390/electronics14122369
Submission received: 24 April 2025 / Revised: 22 May 2025 / Accepted: 5 June 2025 / Published: 10 June 2025
(This article belongs to the Section Artificial Intelligence)

Abstract

In recent years, the utilization of artificial intelligence methodologies in computer vision has markedly propelled the advancement of intelligent healthcare. A multimodal medical image segmentation algorithm is proposed by combining patient metadata with a segmentation network, improving its performance and attaining more accuracy in the final diagnostic results. A fusion method utilizing a transformer backbone network is presented to enhance the efficacy of fusion processes for various modalities of medical data. A channel-level cross-fusion module (channel trans) is incorporated during the fusion phase of two modalities to mitigate interference from extraneous elements in the integrated information. The SMESwin UNet backbone network combines vision transformers and convolutional neural networks to produce multi-scale semantic features and attention mechanisms. It simultaneously collects information from global and local perspectives while minimizing model parameters. Exceptional experimental results were obtained on two publicly accessible glandular pathology datasets, with the Dice segmentation performance index reaching 91.41% on Dataset A and 80.6% on Dataset B. This indicates that utilizing a channel transformer to merge the two modalities effectively generalizes, and the combination of convolutional neural networks with vision transformers improves the ability to extract features in medical images.

1. Introduction

The diagnosis of cancer by physicians requires many investigations, including ocular ultrasound (B-ultrasound), fundus imaging, magnetic resonance imaging (MRI), computed tomography (CT), and a live tissue analysis. Performing biopsies on patients and creating pathological sections, which are then analyzed by pathologists to determine tumor types, is essential for diagnosis and treatment planning, and it is considered the “gold standard” for patient diagnosis.
The procedure of examining and diagnosing pathological specimens by pathologists is arduous; they first evaluate the overall morphology and structure of the tissue, assess the normalcy of cellular components, identify tumors or other atypical cell morphologies, and scrutinize the cellular arrangement within the tissue for abnormalities. Pathologists will conduct a thorough examination of pathological sections, analyzing features such as cellular morphology, size, nuclear morphology, staining properties, and cytoplasmic morphology to determine the kind and severity of the disease. It is crucial to determine the kind, grade, degree of infiltration, and metastasis of a tumor. Pathologists often study several pathological sections, examine tissue samples from multiple angles, and compare diverse sections to provide an accurate diagnosis of the ailment. Pathologists will ultimately combine the observed pathological features with the patient’s medical history and supplementary clinical data to establish a definitive diagnosis. This role relies significantly on the subjective knowledge of pathologists, lacks an objective basis, and requires specialized skills and accurate judgment from them. Moreover, the number of pathologists in any country is constrained, and the pressure on physicians is considerable. Thus, effective and reliable supplementary methods can provide patients with credible and objective diagnostic evidence while alleviating the burden and deficit of pathologists.
The use of artificial intelligence techniques in healthcare has advanced at a slower pace than in other industries, despite increasing pressure on healthcare systems and the urgent demand for high-quality, personalized care [1,2,3]. The realm of artificial intelligence in healthcare and medicine has been extensively analyzed via several surveys, covering a diverse array of topics. This includes extensive uses of deep learning in healthcare and image-focused methodologies [4,5,6]. Evaluations have been performed particularly in certain areas, such as those concentrating on the thoracic region [7,8,9]. In the field of multimodal applications, several studies have conducted thorough evaluations, while others have concentrated primarily on medical areas such as oncology and cardiology [10,11,12]. Subsequent investigations have focused on the amalgamation of other medical imaging modalities, such as MRI, CT, and PET [13,14,15]. Furthermore, other assessments have compared models, architectures, and optimization techniques, either generally or specifically within healthcare contexts [16,17,18,19]. Further assessments have focused on the emerging field of self-supervised learning, examining its development and applications [20,21,22].
The convergence of several critical factors, such as improved accessibility and institutional endorsement of digital slide scanning, rapid progress in artificial intelligence research, increased availability of large datasets, and substantial high-performance computing resources [23,24,25]. Researchers have employed deep learning with varying effectiveness to address numerous tasks, including cancer subtyping, metastasis detection and grading, survival and treatment response prediction, tumor origin prediction, mutation forecasting, and biomarker screening, among others [26,27,28]. Moreover, general-purpose vision-encoder models, trained on large datasets of unlabeled histopathology images and serving as versatile task-agnostic model backbones, are driving progress in numerous computational pathology tasks, improving both performance and label efficiency [29,30].
Gu et al. [31] investigated the trials of MMY Net and found that the integration of patient metadata into the segmentation network improves its precision. The study analyzed the applied fusion strategies by simply aggregating the feature vectors of the two modalities along the channel dimension, without a thorough evaluation of the effectiveness and generalizability of the fusion methods. The backbone network of MMY Net is based on a CNN and fails to learn the hierarchical structure of visual information in diseased pictures, suggesting opportunities for improvement in diagnostic efficacy.
This article introduces Trans MMY Net, which integrates a channel transformer module during the fusion process to address these issues. This module may dynamically adjust each channel during feature fusion, hence improving the integration of diverse features. The experiment has significantly improved the precision of this procedure, demonstrating the effectiveness and applicability of this fusion approach. This article improved the backbone network of MMY Net by merging a CNN with a ViT (vision transformer). The improved network can more efficiently identify the characteristics of anomalous pictures by combining the advantages of both a CNN and a ViT, hence enhaMCAncing the diagnostic effectiveness.
The experimental results of this work demonstrate that Trans MMY Net has markedly improved compared to MMY Net, hence confirming the effectiveness and relevance of these updated techniques, which will produce superior outcomes in pathological picture segmentation and diagnosis.
Moreover, it is crucial to underscore that the primary emphasis of this article’s study is a semantic segmentation issue. Neural networks may attain substantial segmentation results even with just image modal data. Metadata function as an ancillary component in the research undertaking of this article, aimed at augmenting its effectiveness.

2. Related Works

CNNs and transformers are pivotal in medical picture segmentation, delineating areas such as tissues, organs, blood arteries, and malignancies for diagnostic and therapeutic purposes. Traditional methods, like CNNs, require manual feature extraction, while deep learning methods, like CNNs, automatically learn features. Multimodal medical images are rapidly developing, and deep learning methods based on multimodal fusion are expected to become mainstream.

2.1. Medical Image Segmentation Based on UNet

UNet, a semantic segmentation network based on convolutional neural networks, has been widely used in medical picture segmentation since its introduction in 2015. Numerous segmentation networks, including UNet++, Res UNet, AttUNet, R2U Net, Fully Dense UNet, and UNet3+, have been implemented for diverse applications. UNet++, introduced in 2018, enhances performance and reliability by integrating encoder and decoder components at various depths, facilitating the partial sharing of encoders, and enhancing network efficiency through deep supervision [32,33,34,35,36,37]. UNet++ also restructures skip connections to emphasize elements of varying semantic scales inside the decoder subnetwork. This feature ensures a loss function at each stage of the training process, guiding the model’s learning and improving the network’s robustness and generalization ability. By building multiple subnetworks, UNet3+ captures fine-grained details and coarse-grained semantics at each scale, enabling a more accurate segmentation. This enables UNet3+ to better handle organ segmentation tasks at different scales, such as the liver and heart [38]. Tahir et al. [39] introduced the Dense Channel Spatial Semantic Guidance Attention UNet (DCSSGA-UNet) architecture, which incorporates DenseNet201 as the foundational encoder and employs attention methods to improve segmentation efficacy.

2.2. Medical Image Segmentation Method Based on Vision Transformer (ViT)

Recently, the emergence of ViTs [40] in image segmentation tasks has led to the development of novel segmentation network variations, including TransUNet [41], UCTransNet [42], TopFormer [43], and Swin UNet [44], all of which have demonstrated exceptional performance in medical picture segmentation.
Numerous medical picture semantic segmentation techniques frequently utilize the UNet architecture characterized by an encoder–decoder configuration. To examine the efficacy of features at varying sizes in UNet for enhancing semantic segmentation, Wang et al. [42] introduced the UCTransNet architecture, which incorporates a CTrans module to supplant the skip connections in UNet. The CCT submodule of CTrans employs multi-scale channel cross-fusion technology to enhance the model’s performance. The submodule CCA facilitates the efficient integration of multi-scale channel information with decoder features to reduce ambiguity and enhance the segmentation performance.
Han et al. [44] introduced a novel image segmentation technique named Swin UNet. Swin UNet is constructed utilizing the Swin transformer [45] architecture in conjunction with the UNet framework. Tahir et al. [46] suggested an architecture that utilizes a feature fusion technique to combine the local feature extraction advantages of CNNs with the global dependency modeling skills of transformers.
The Swin transformer, an innovative transformer architecture, has made considerable enhancements in model training and inference velocity. It minimizes computational expenses and memory usage by implementing cross-layer connections and windowed grouped convolutions. UNet, a convolutional neural network, is integrated with the Swin transformer to improve image segmentation outcomes. This architecture offers superior computing efficiency, compact model dimensions, enhanced interpretability, and scalability, making it a promising solution for various image segmentation tasks.

2.3. Multimodal Medical Image Segmentation Method Combining Metadata

While several multimodal medical image segmentation networks have been introduced, including HyperDense Net [47] and MultiResUNet [48], the majority of these studies concentrate on the analysis of images from two distinct imaging modalities, such as CT and MRI, with only a limited number addressing both metadata and image modalities in multimodal medical image segmentation.
LesaNet [49] conducts metadata mining on training labels inside radiology records for the purpose of lesion labeling. DoubleUNet [50] developed a metadata branch that extracts glandular diagnostic traits by integrating metadata and visual elements at varying scales to offer high-level insights into glandular shape. The process consists of two stages, with the classification data acquired in the initial stage serving as textual information for enhanced segmentation accuracy.
Payne et al. [51] introduced a comprehensive prediction system utilizing a displacement vector field, with the objective of enhancing segmentation outcomes for intracerebral hemorrhages. They employed a technique of augmenting metadata and visual features by integrating patient metadata with visual features at the base of the encoder to enhance the model’s performance. Nonetheless, the efficacy of this approach requires additional validation, as the strict multiplication of two modal features does not ensure superior performance compared to merely incorporating image features.
Höhn et al. [52] assessed the significance of patient clinical metadata and determined that gender is more critical than other characteristics. This outcome may influence future research by underscoring the significance of clinical metadata in medical imaging processing. However, this sorting outcome may exert varying effects on distinct datasets and disorders.
Chen et al. [53] explored the impact of combining patient metadata information with a CNN in the binary classification task of pathological images of melanomas and melanomas in their study to determine whether combining patient metadata with a CNN will improve the classification performance through these methods.
Meng et al. [54] used a dataset of pathological images of melanocytic nevi and melanomas that included patient age, gender, and lesion anatomical location metadata. The CNN performance was analyzed, revealing interesting conclusions. While pure image networks achieved the highest classification performance, incorporating patient metadata into the classification process improved the performance on pathological images with low accuracy. This suggests that patient metadata may be useful for challenging image samples.

3. Methodology

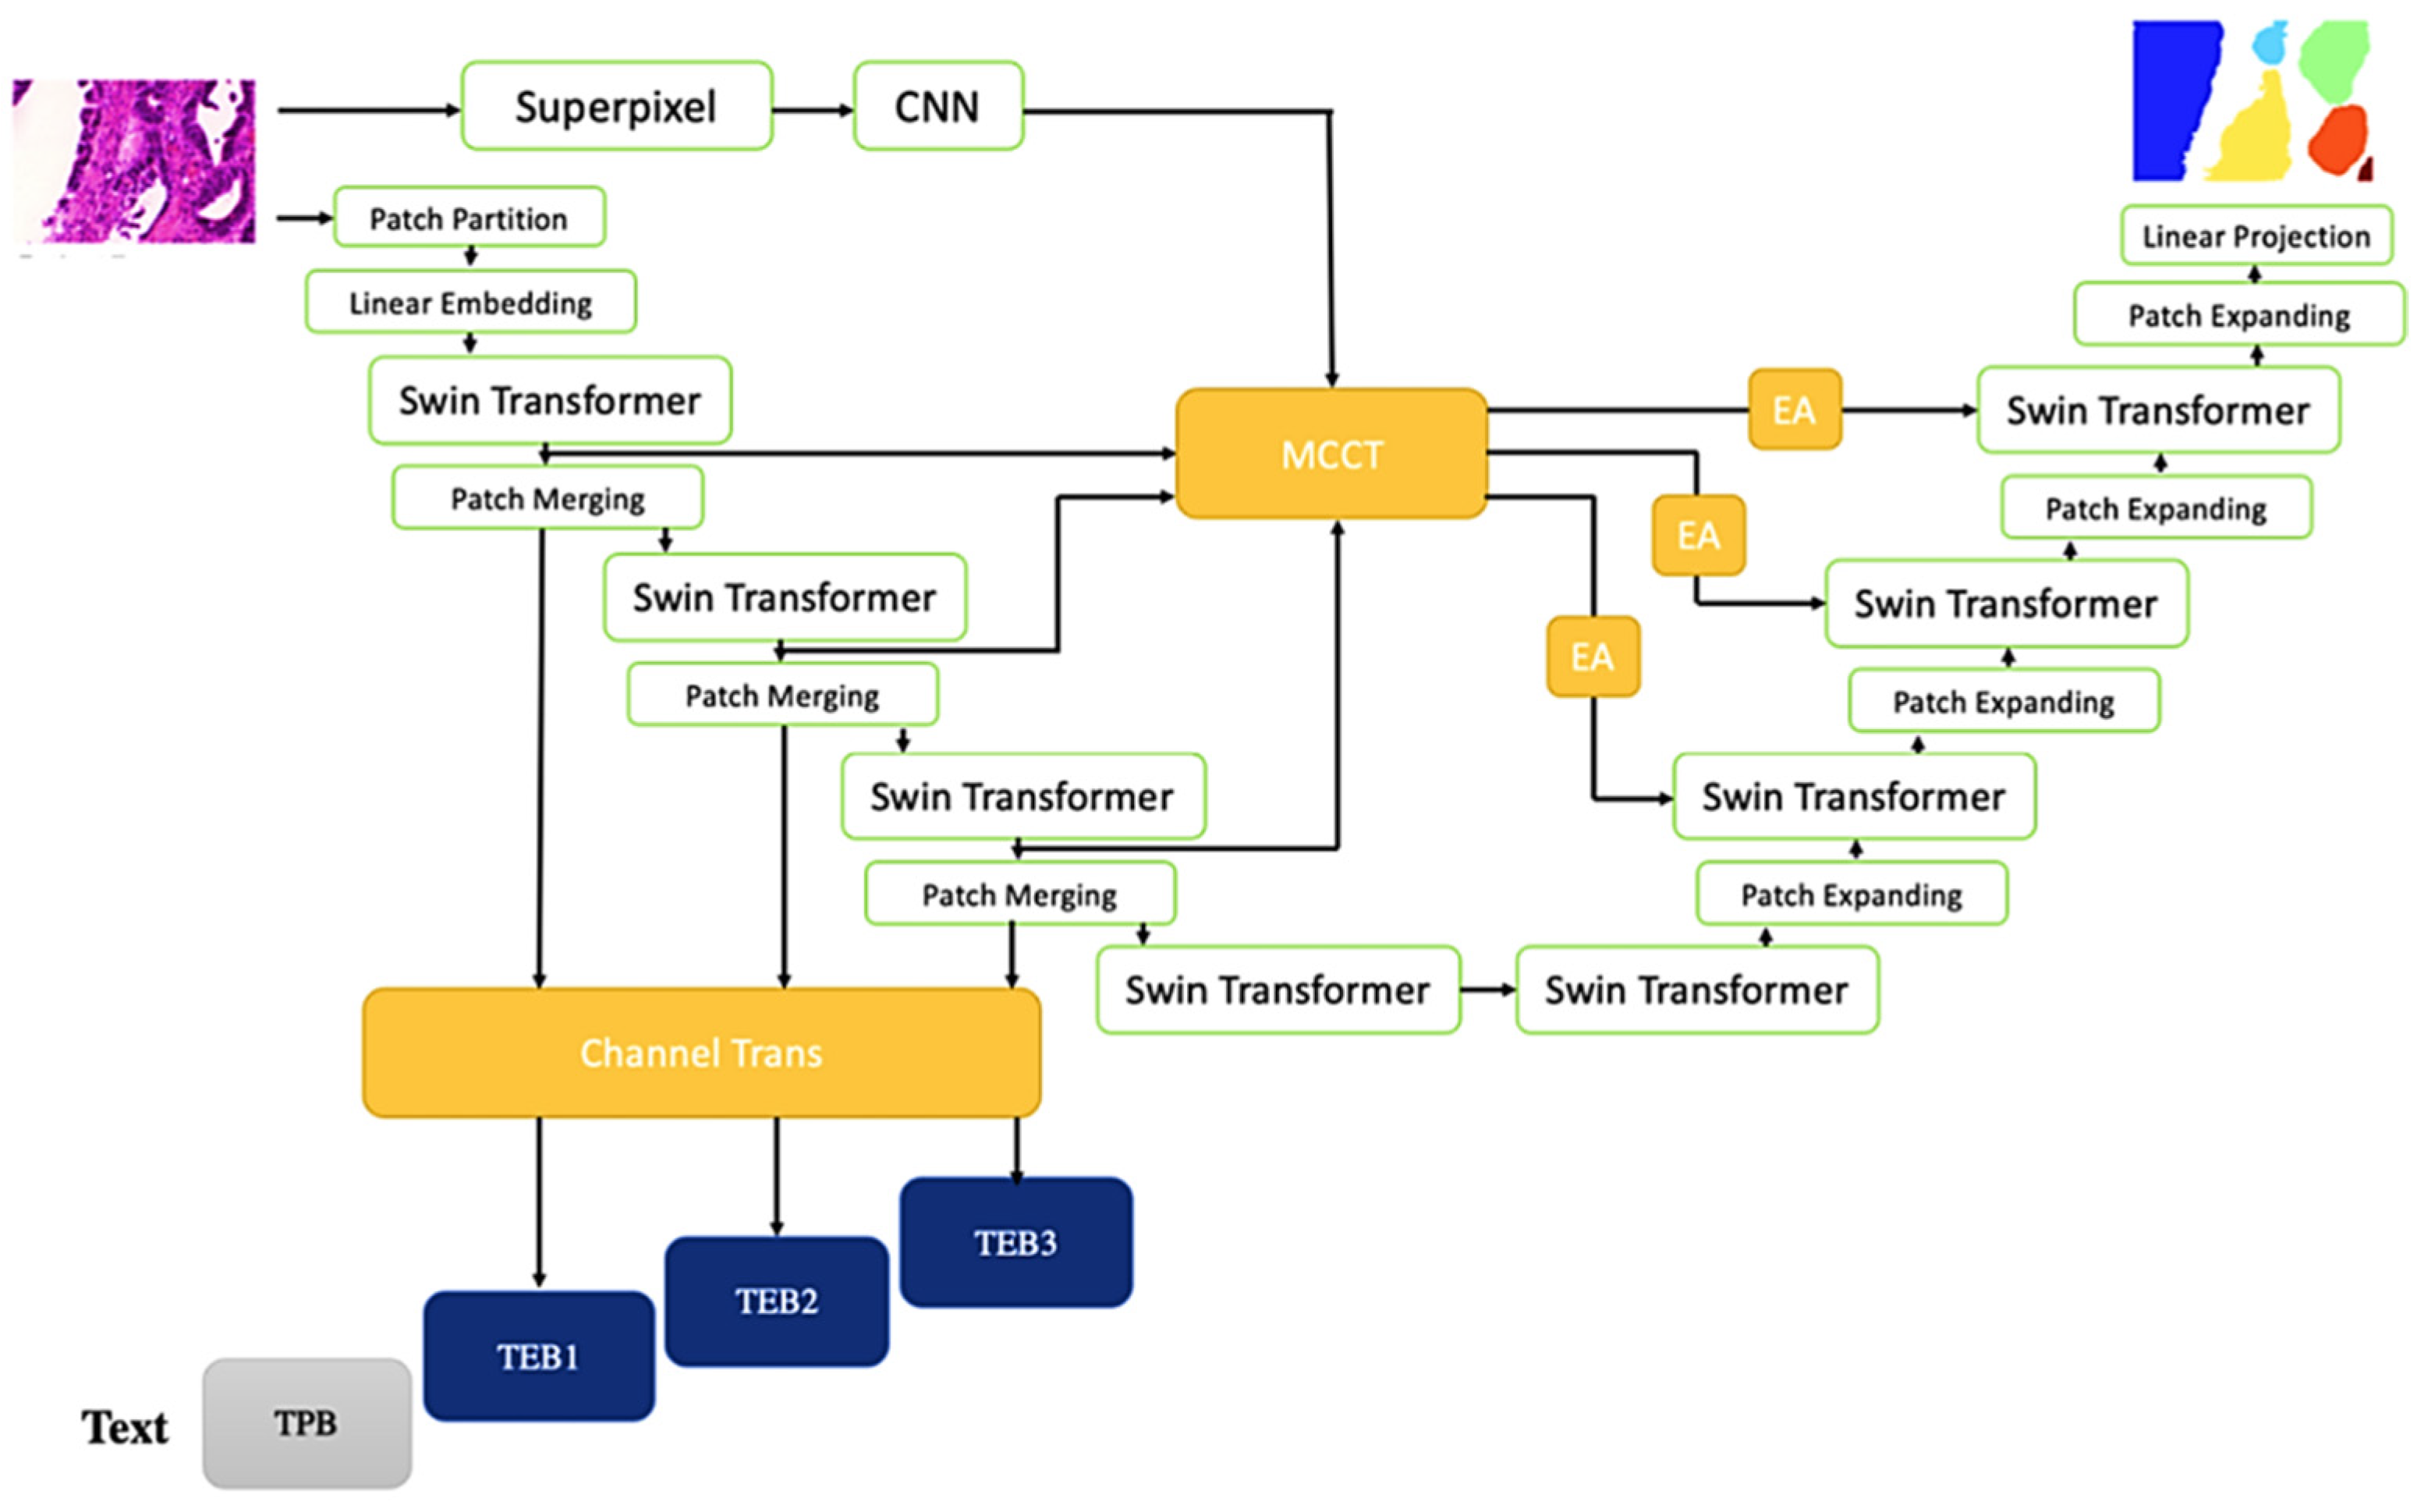
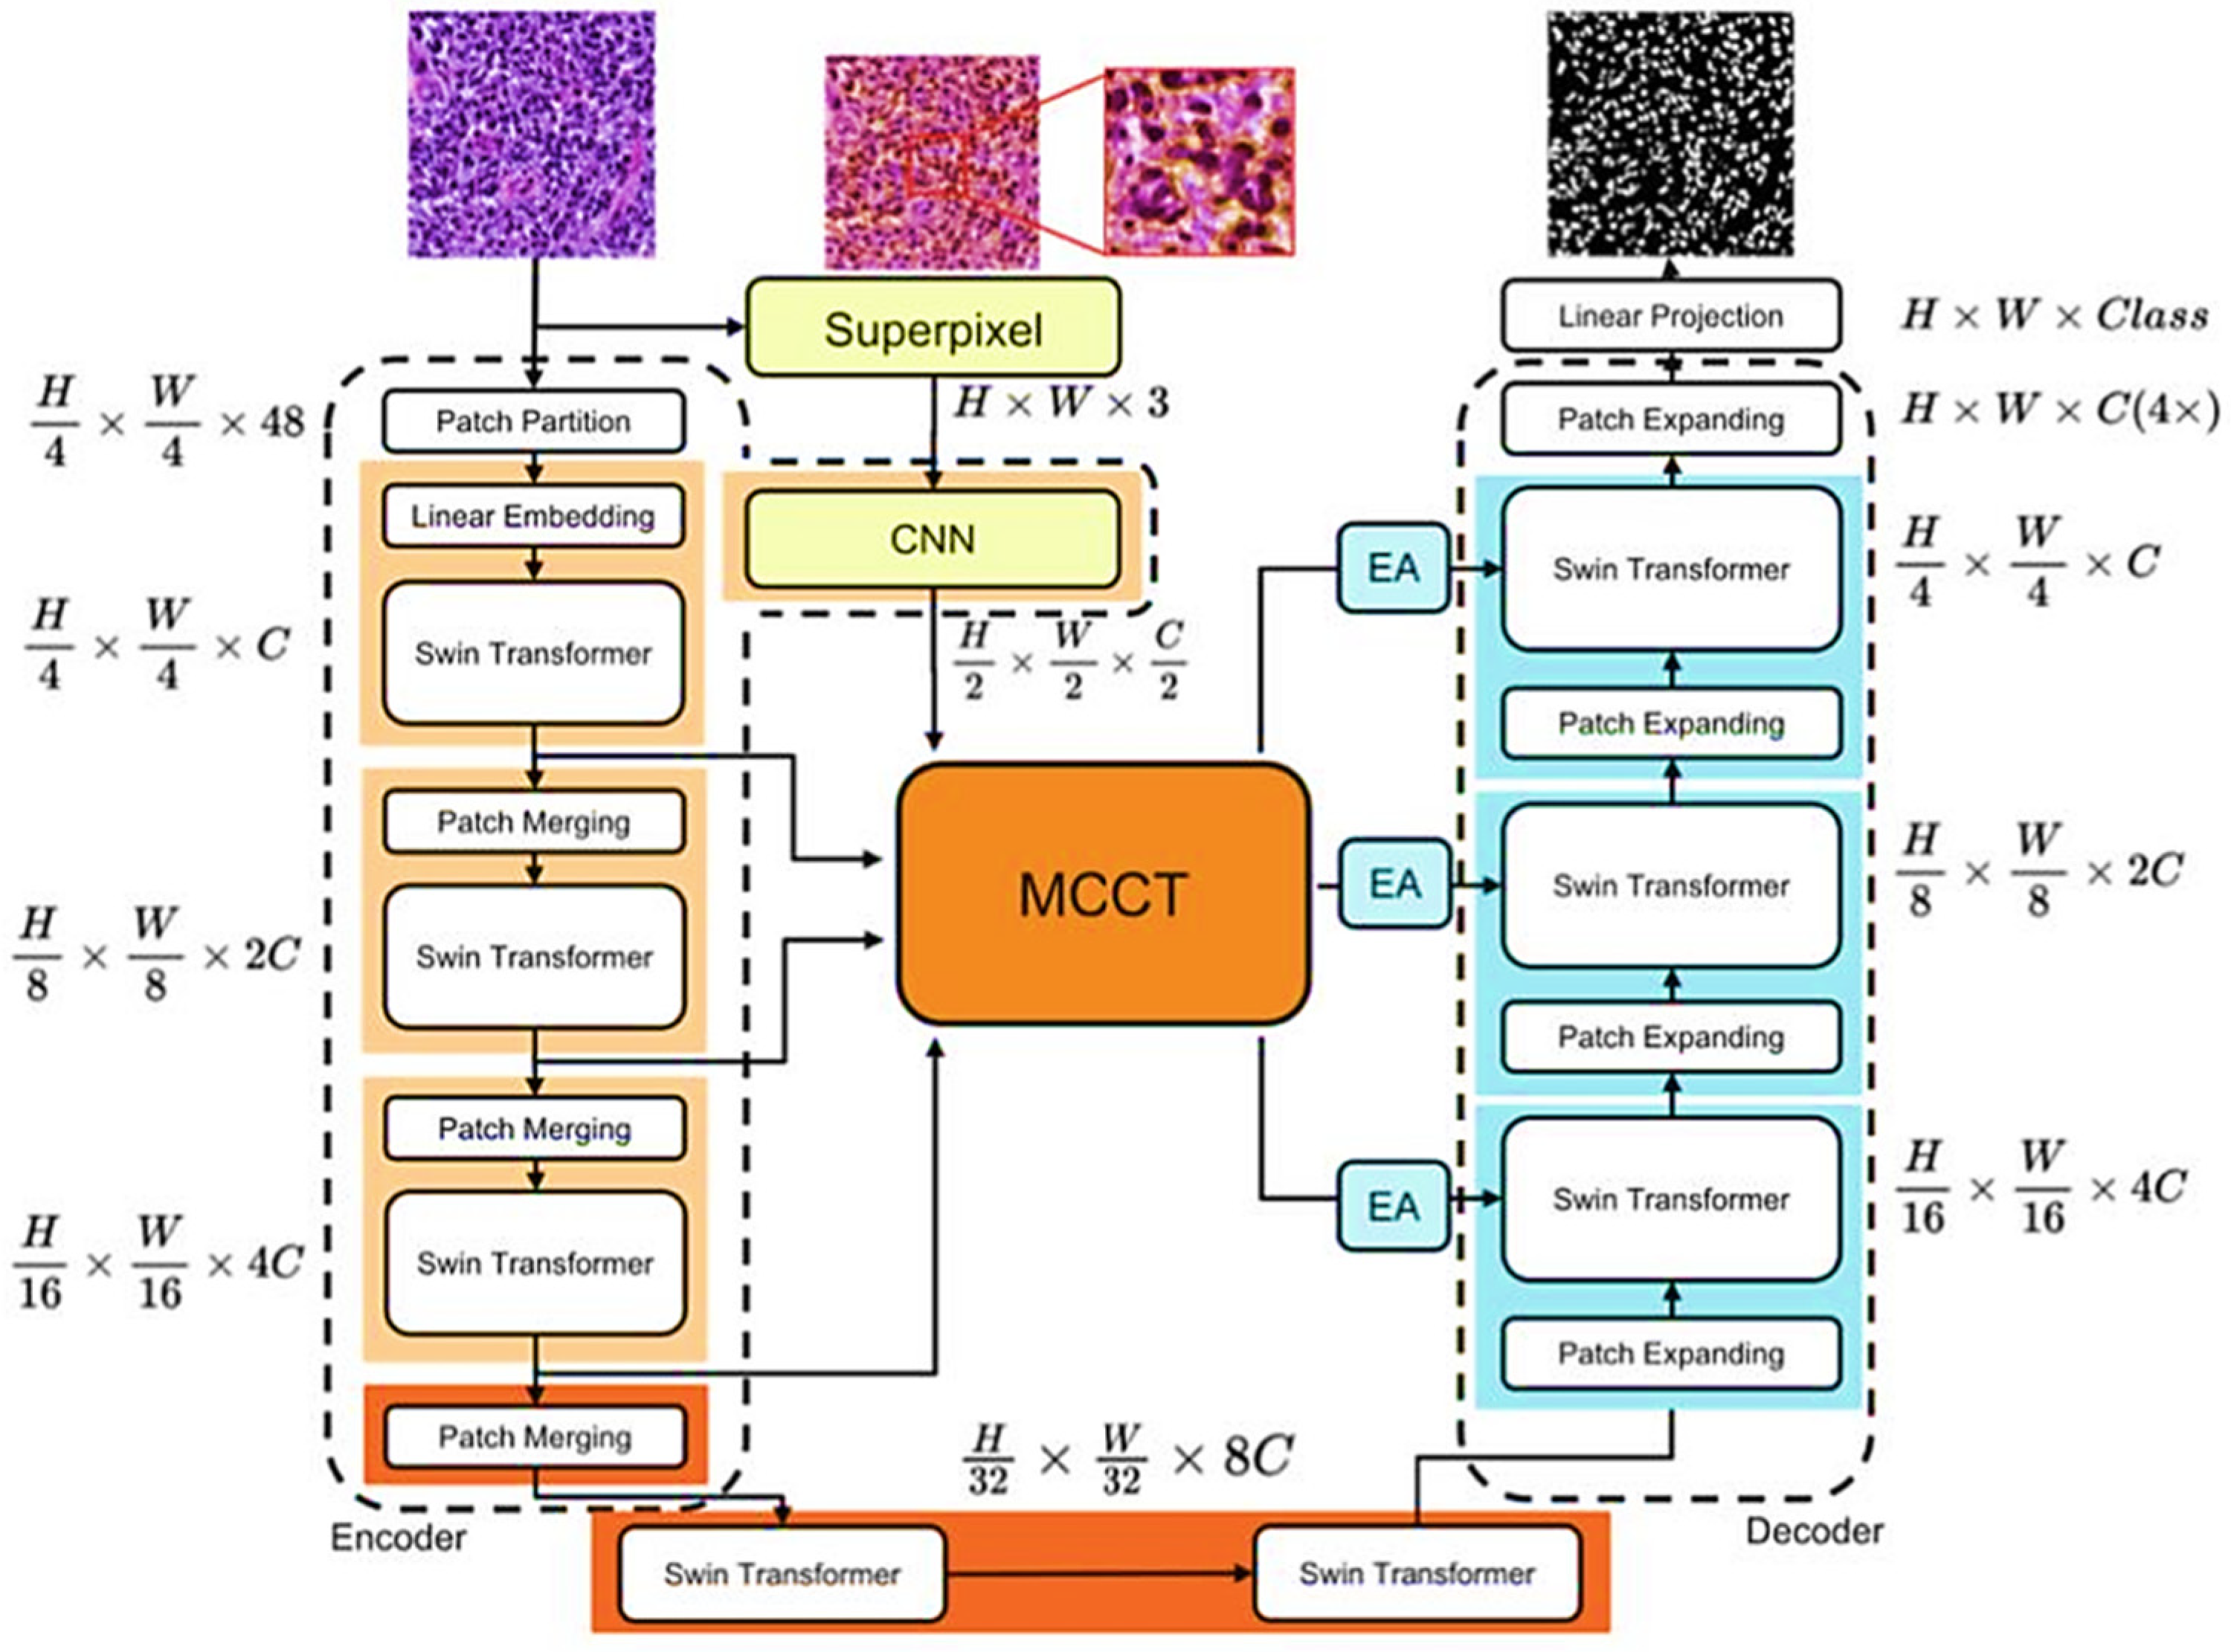
3.1. Design of Trans MMY Net

The channel trans module improves the multimodal fusion by dynamically modifying channel-wise features during the integration of image and metadata modalities. This method substitutes basic channel stacking with a transformer-based framework, utilizing layer normalization (LN) to standardize features and minimize redundancy. The MCA mechanism calculates cross-modal attention through multiple heads, allowing the model to concentrate on pertinent features and diminish noise. MCA generates query, key, and value vectors from fused tokens, effectively capturing intricate dependencies between modalities and enhancing the alignment of semantic information. This leads to a more efficient integration of global (ViT) and local (CNN) features, which is essential for pathology image segmentation.
This research work proposes a network framework called Trans MMY Net, aimed at improving the design of the MMY Net framework. The design feature of Trans MMY Net is the use of a channel transformer module to replace the channel stacking fusion method in MMY Net when fusing patient metadata information and images. This new fusion method can make the effective information more effective and the ineffective information more ineffective during the fusion process, thereby further improving the fusion effect. In addition, Trans MMY Net not only improved the original fusion strategy but also optimized the original backbone network to further enhance the network performance. In summary, Trans MMY Net has an innovative network design with enormous potential for multimodal segmentation combining metadata and medical images. The structure of Trans MMY Net is shown in Figure 1.

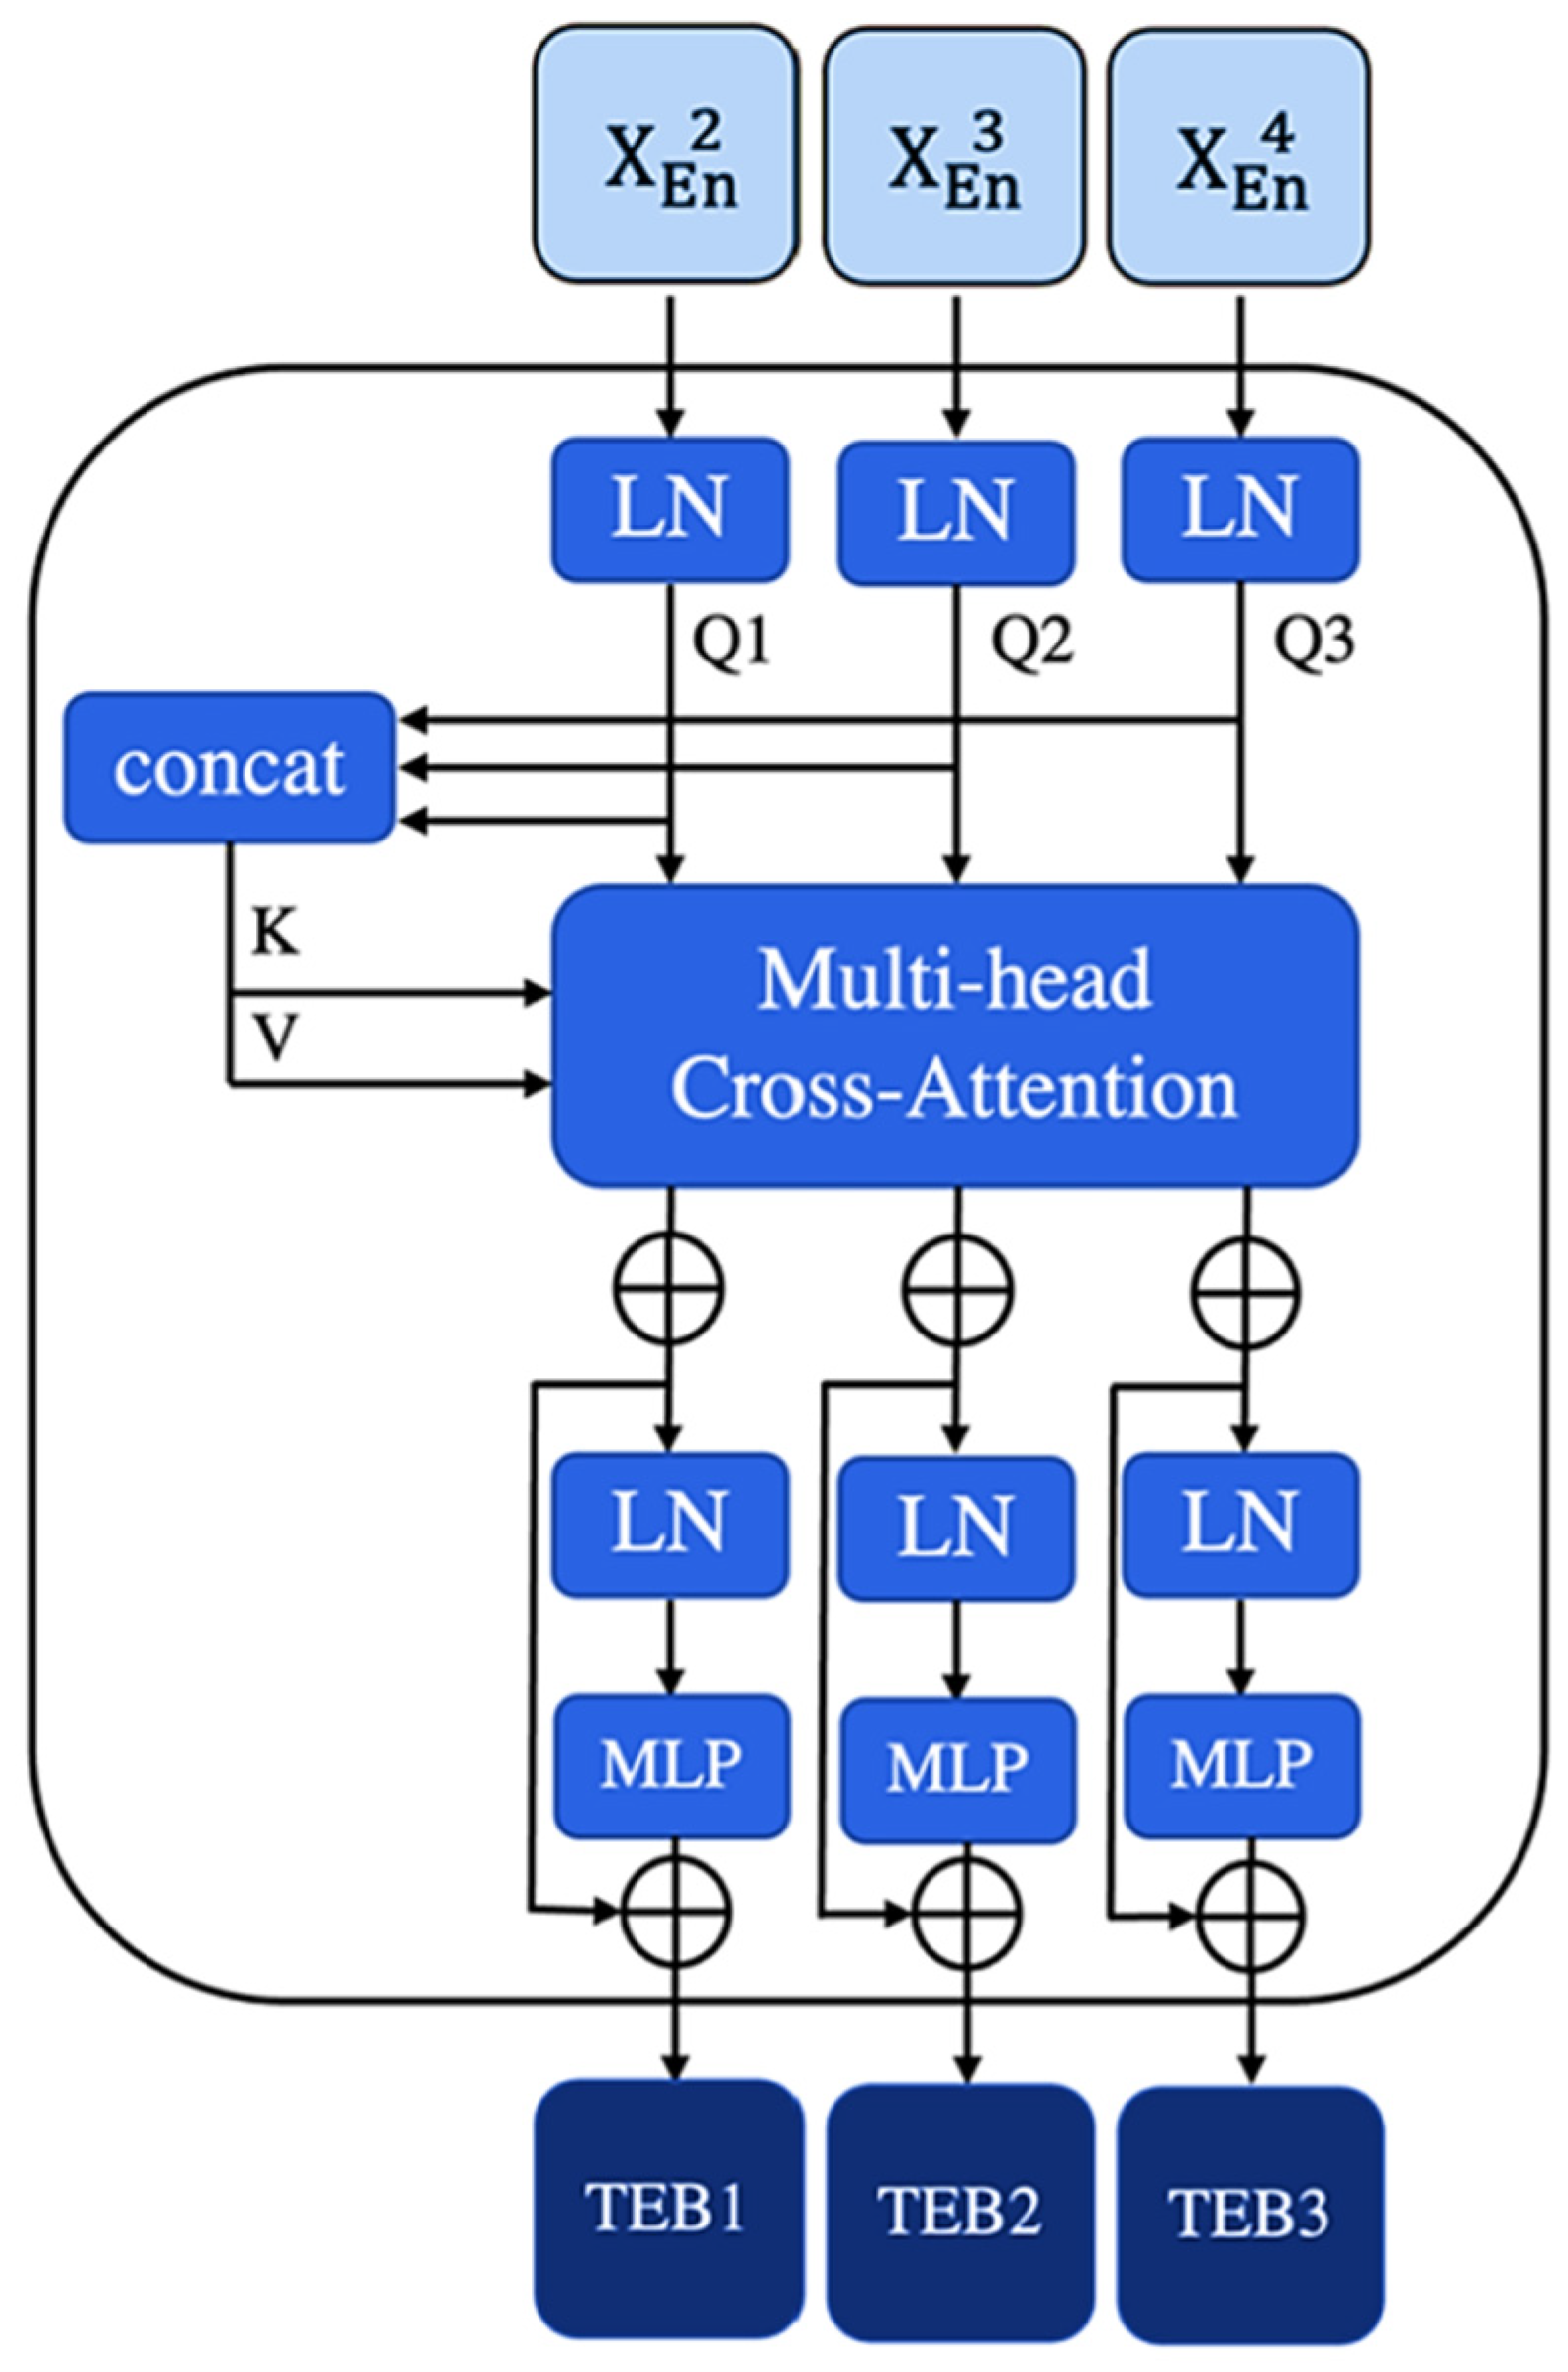
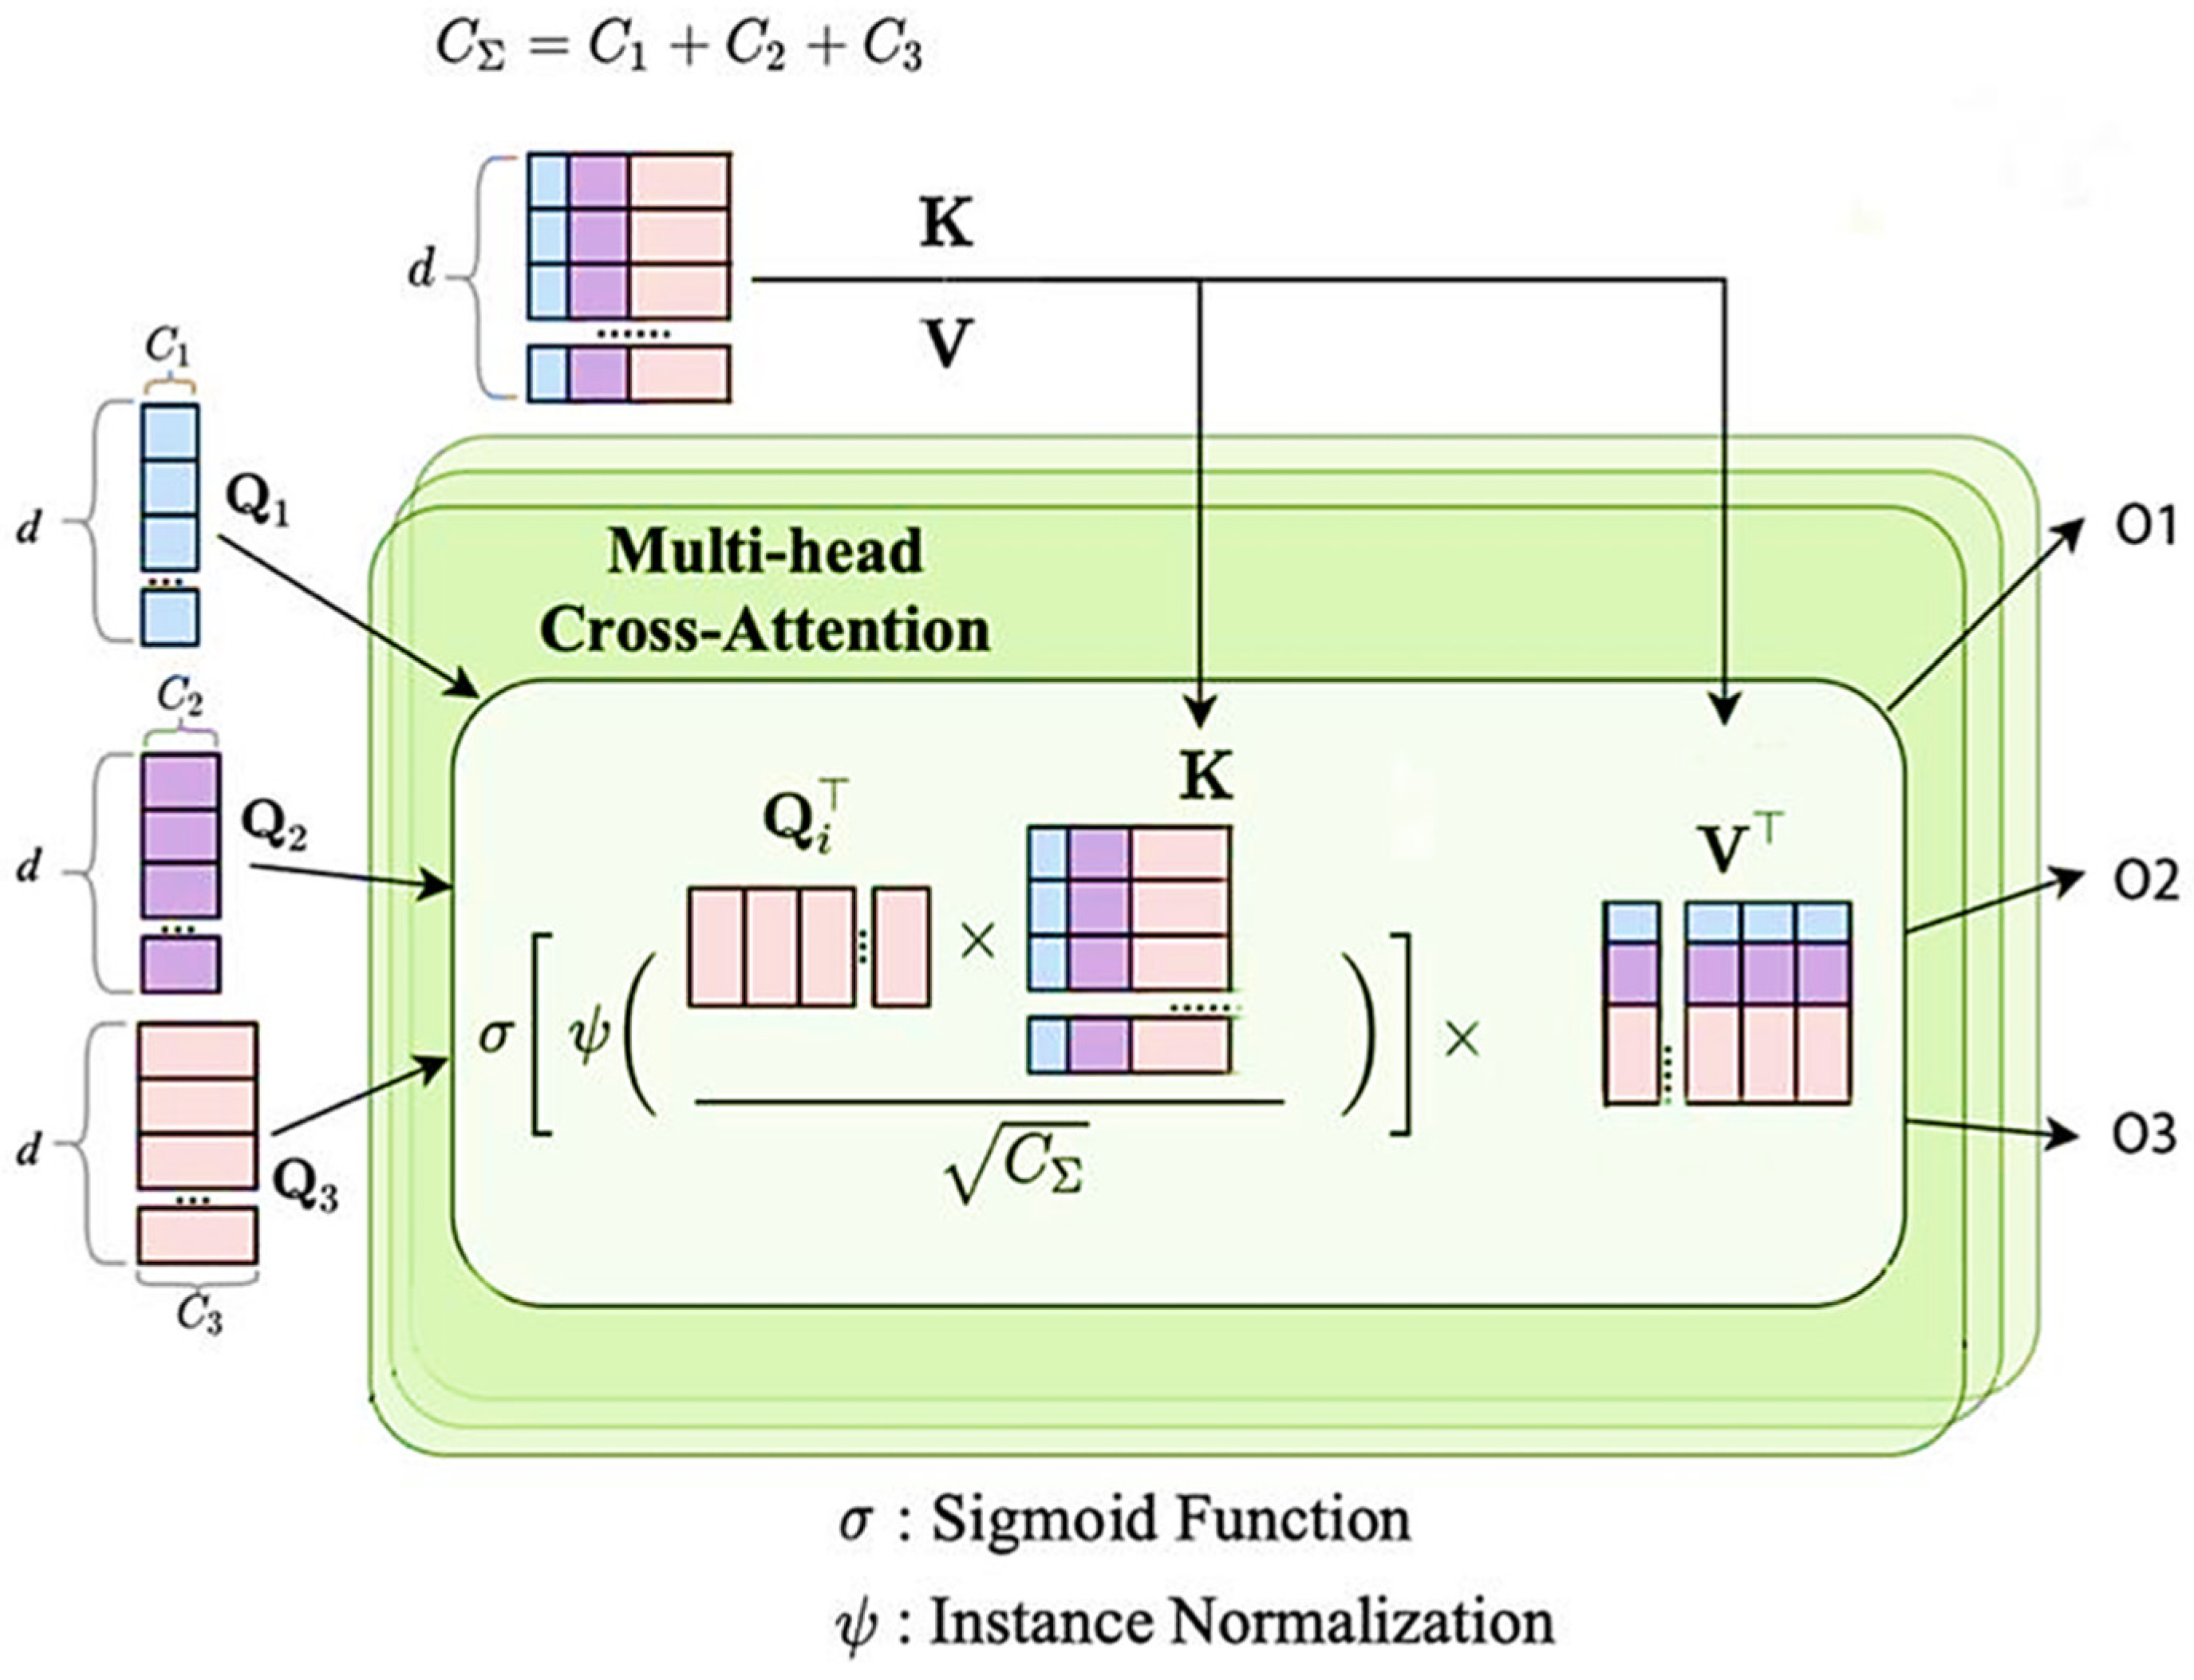
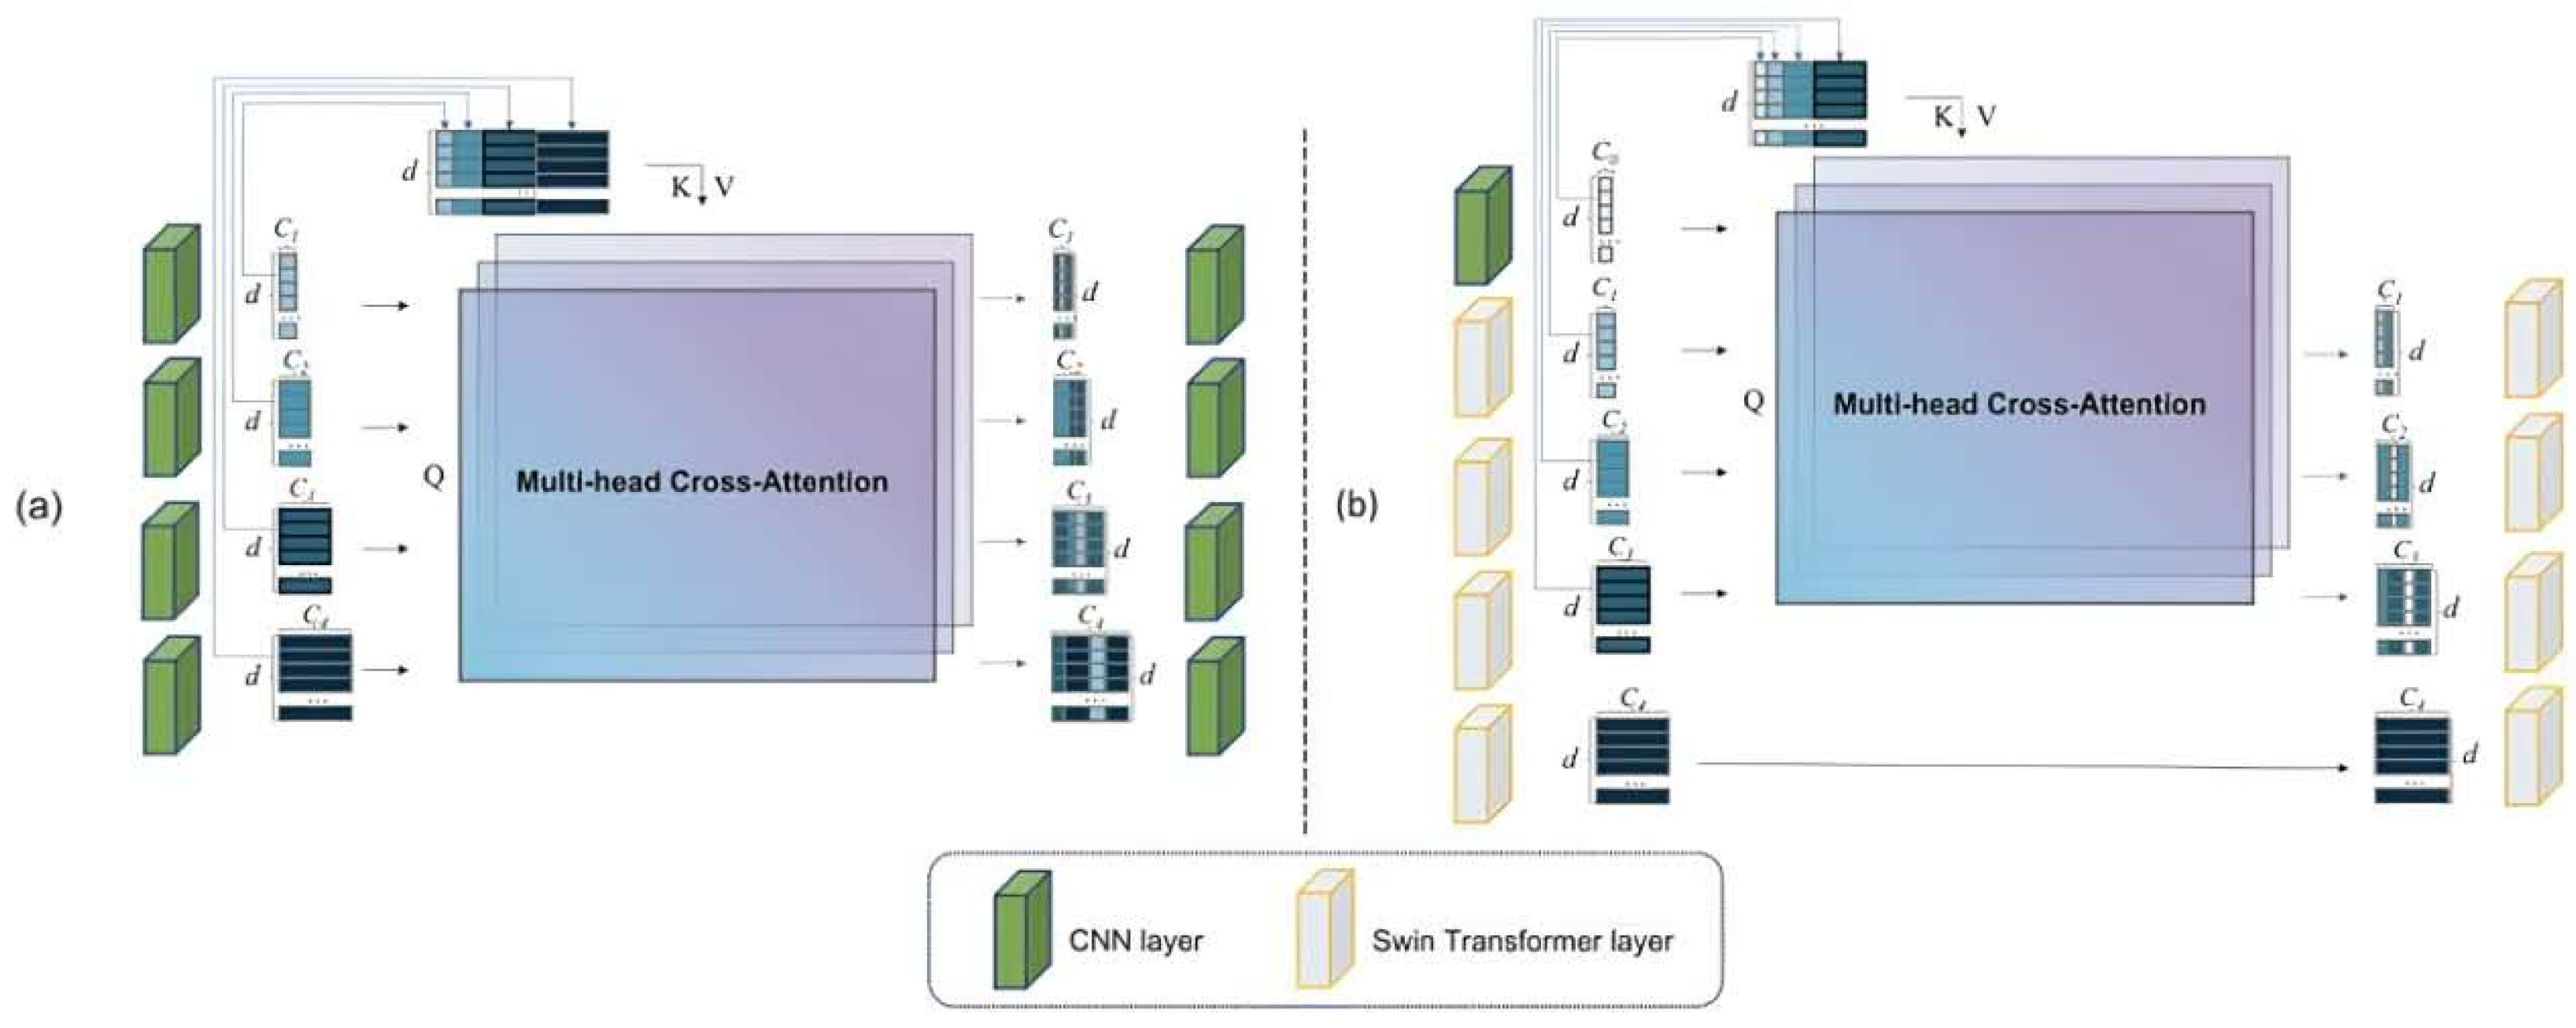
3.2. Channel Trans Module Design

In MMY Net, the method of fusing different modal data is achieved by stacking metadata and image feature channels from multiple TEB (transformer-based encoder block) modules. It is speculated that this is because the pure channel full feature stacking fusion makes the information redundant, and the effective weights between different pieces of information are different. Therefore, to better integrate metadata and image information at different scales, this article introduces the channel trans module, as shown in Figure 2. This module can more effectively extract and utilize metadata and image information at different scales, thereby improving the performance of the model.
Specifically, the three modules of X E n 2 ,     X E n 3 , and X E n 4 will output image features separately. The image feature outputs of these three modules will serve as the three inputs for the channel trans module. To better handle these three inputs, perform layer normalization (LN) on them first.
Layer normalization is a normalization technique commonly used in neural networks to alleviate gradient vanishing or exploding problems and accelerate the training process in deep neural networks. Different from the common batch normalization (BN), layer normalization is not based on the statistical information of each batch but rather standardizes on each feature dimension of each sample. As shown in Figure 3, for each feature dimension in each sample, LN calculates the mean and variance of that feature dimension and then normalizes all values of that feature dimension to a mean of 0 and a standard deviation of 1. This can make the values of the same feature dimension in different samples have similar distributions, making the model easier to learn. Instance normalization (IN) is the independent normalization of the features of each sample. For a convolutional layer output with C channels, instance normalization normalizes the feature maps of each channel; that is, it normalizes each channel of each sample. This can effectively reduce the correlation between features, making it easier for the model to learn the differences in samples, and can improve the model’s generalization performance.
After standardizing the three inputs separately, three tokens are obtained, which are T 1 , T 2 ,   and   T 3 . Stacking these three vectors together forms T Σ , and the query vector Q , key vector K, and value vector V, required by the transformer, can be obtained from Equation (1). W Q i R c i × d , W K R C Σ × d , and W V R C Σ × d , where d is the length of the sequence, C i represents the number of channels, and   i = 1 ,   2 ,   3 .
Q i = T i W Q i , K = T Σ W K , V = T Σ W V
In Equation (1), Q, K, and V represent the query, key, and value vectors, respectively. L is the length of the sequence, and C represents the number of channels.
The MCA module is shown in Figure 4, which accepts 5 inputs, namely Q 1 , Q 2 , Q 3 , K ,   and   V . The attention operation of each head can be represented by Equation (2), where ψ   ( · ) is the instance normalization process (IN), and σ   ( · ) is the softmax activation function. It is easy to calculate the attention of multi-heads using Equation (3), and this article sets the number of heads to 4. After applying M L P and residual operation again, the output O i obtained is shown in Equation (4).
C A i = σ ψ Q i K C Σ V = σ ψ W Q i T i T Σ W K C Σ W V T Σ
M C A i = C A i 1 + C A i 2 + C A i 3 + C A i 4 4
O i = M C A i + M L P Q i + M C A i
In Equation (2), IN denotes the instance normalization process, and softmax is the softmax activation function. In Equation (3), the multi-head attention operation is performed using the query, key, and value vectors. In Equation (4), the output of the MCA module is obtained after applying the attention operation and residual connection.
Three O i are used as the image modality inputs Xi for the new three TEB modules, allowing each TEB module to extract useful visual and metadata feature matches from the image data. By fusing the outputs of the three TEB modules with the data of the patient metadata, more comprehensive information of the image and metadata can be captured. This fusion can help the model more accurately understand and describe the semantic relationship between images and metadata, thereby improving the fusion effect. The above process is the core step of the channel trans module and an important core for implementing multimodal learning in Trans MMY Net.

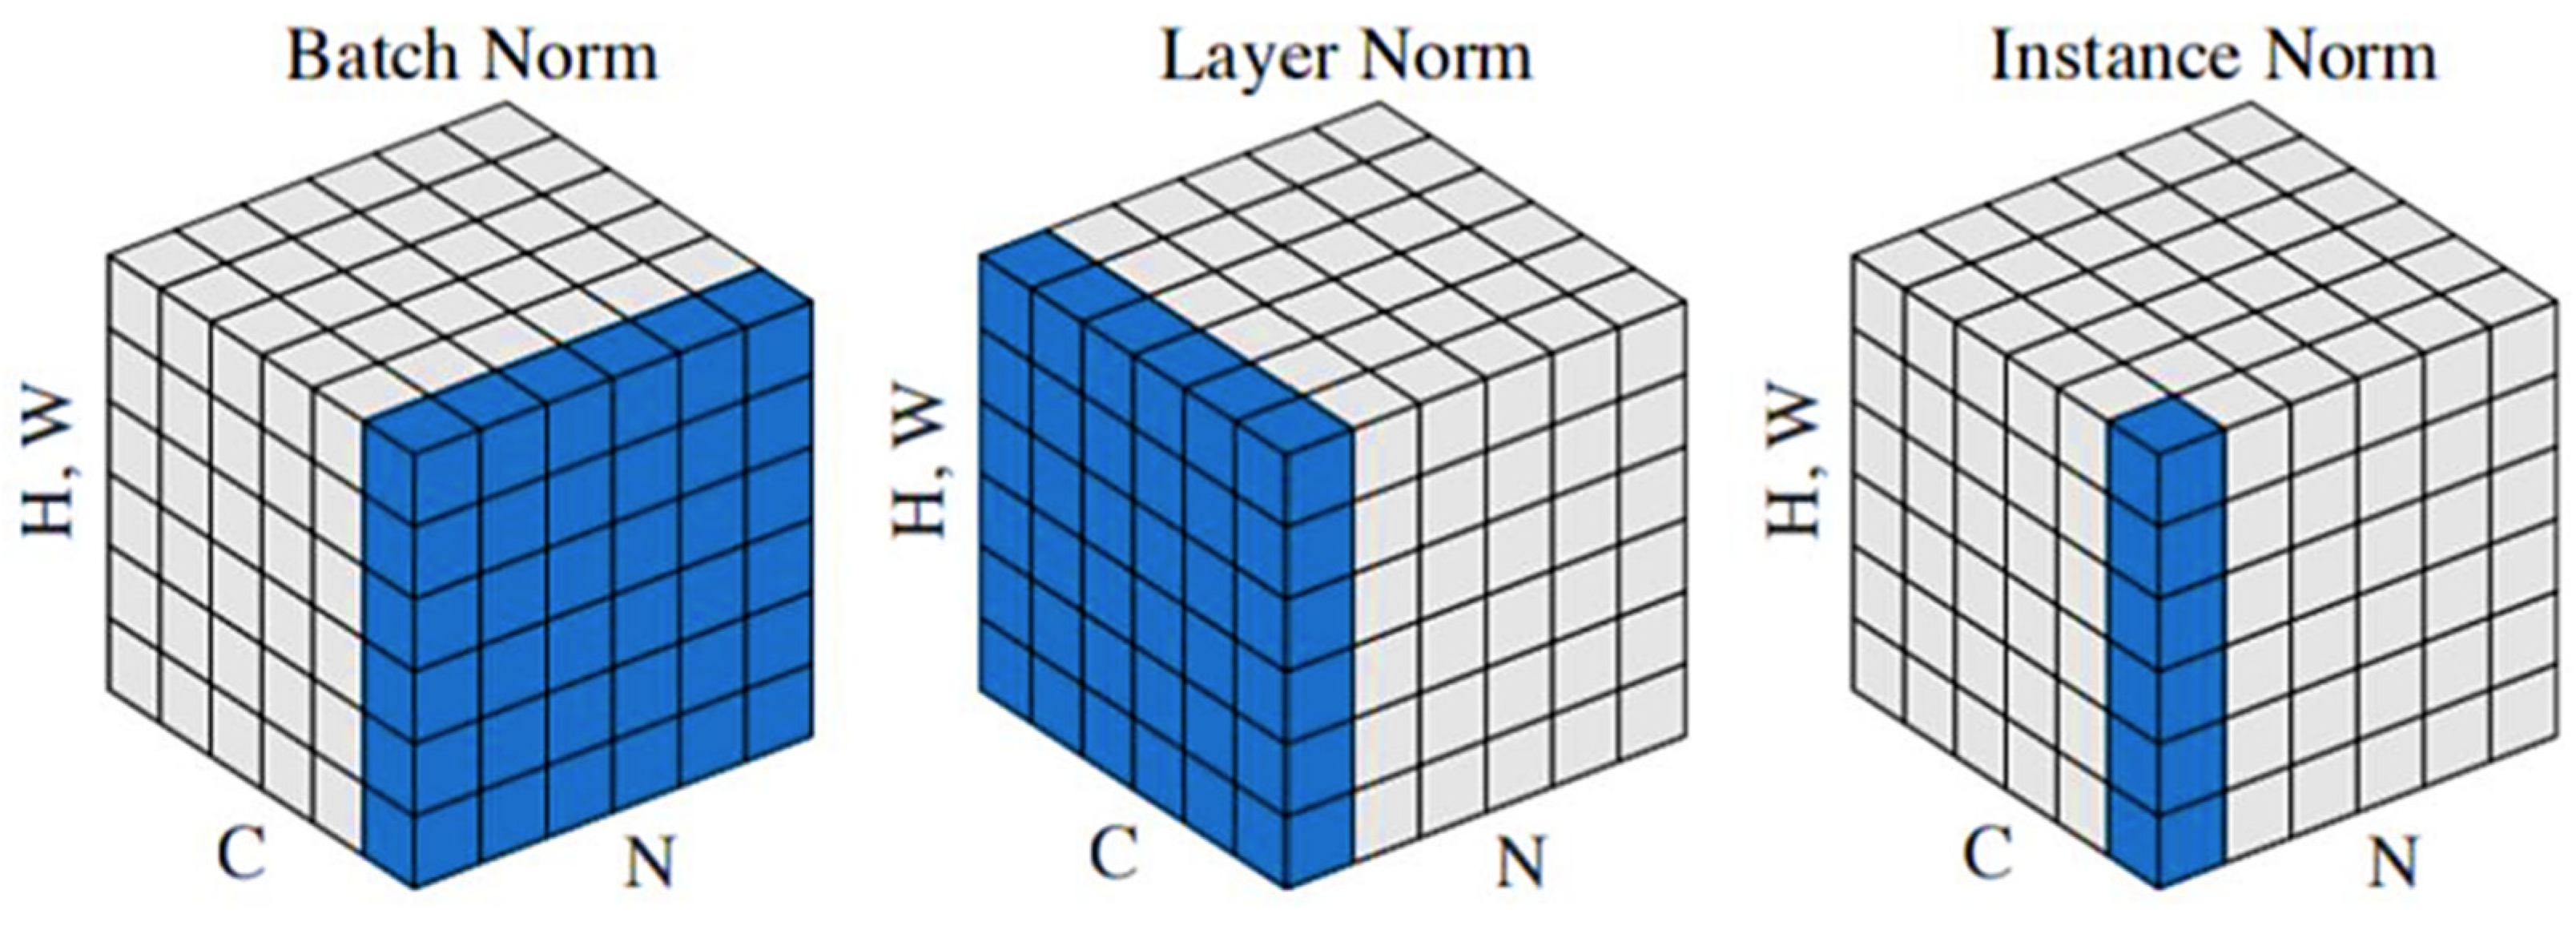
3.3. Optimization of Backbone Network

MMY Net is a neural network model used for medical image segmentation, which adopts UNet3+ as the backbone network. Although it has been proven in the previous text that MMY Net combined with metadata can exhibit better performance than using image modal data alone, it still relies on CNNs and only considers locally adjacent information, lacking the ability to model long-range dependencies.The structure is shown in Figure 5 below.
With the successful application of the transformer in fields such as natural language processing, its use in visual tasks is also increasing. However, a ViT has drawbacks, such as high computational complexity, sensitivity to location information, and a lack of pretrained models, which still pose certain challenges in applying them to medical image segmentation tasks.
Therefore, when improving the backbone network, this article adopts SMESwin UNet [42] as the new backbone network. SMESwin UNet uses Swin UNet as the basic U-shaped encoder–decoder network architecture and combines the CCT module proposed in UCTransNet to propose a composite structure MCCT module of a CNN and a ViT, which integrates multi-scale semantic features and attention, optimizes skip connections, and reconstructs Swin UNet. Additionally, by dividing pixel-level features into region levels to introduce superpixels, interference from meaningless parts in the image is avoided. External attention (EA) is also used to consider the correlation between all data samples, further reducing the limitations of small datasets.
The MCCT module, as shown in Figure 6, combines a CNN and a ViT, which has better detail capture capability. Compared with the CCT module in UCTransNet, it has less computational complexity. The main difference between them can be seen from the figure where the first connection in MCCT is connected to a CNN, and the original fourth connection is deleted. Figure 6 illustrates two different neural network architectures that incorporate multi-head cross-attention mechanisms, labeled as (a) and (b)
The role of the EA module is to fully apply correlations to small sample datasets, enhance useful features, and weaken useless features. This dynamic adjustment can improve the flexibility and adaptability of the model, enabling it to better handle different tasks and datasets. It consists of a cascade of two linear layers and two normalization layers. The output of the MCCT module is F i , using different storage units, M k and M v , as keys and values. The output of the EA module can be represented by Equations (5) and (6).
A i = N o r m F i M k i
O i = A i M v i

4. Results and Discussion

This article tested the performance of Trans MMY Net, MMY Net, and current mainstream segmentation networks on Dataset A, and the experimental results showed that Trans MMY Net has better performance than MMY Net on Dataset A. In addition, the same validation experiments were conducted on Dataset B in this article, and the results showed that Trans MMY Net has good generalizability on different datasets.

4.1. Performance Comparison of Different Segmentation Networks

The experiment in this section first optimized the multimodal data fusion method of MMY Net and used a new method—channel trans to replace the channel stacking method in MMY Net. As shown in Table 1, after training with Dataset A, the Dice coefficient was 0.9107, and the IoU coefficient was 0.8360. Compared with the original channel stacking method in MMY Net, using a channel trans improved the Dice coefficient by 0.0071 and the IoU coefficient by 0.0038, indicating that using a transformer for data fusion on channels can better guide the network for segmentation and improve the performance of the model. This result also demonstrates that multimodal data fusion is an effective method for improving model accuracy, and the use of new fusion methods can further enhance model performance.
Further experimental research combined the TPB, TEB, and channel trans modules in the metadata branch with the advanced backbone network SMESwin UNet to form a new multimodal feature fusion network, Trans MMY Net. On Dataset A and Dataset B, this paper conducted experimental evaluations on Trans MMY Net and compared it with the MMY Net proposed earlier. The experimental results are presented in Table 1 and Table 2, indicating that Trans MMY Net outperforms MMY Net in all evaluation metrics. This indicates that Trans MMY Net can better integrate multimodal feature data, fully utilize various feature information, and improve the performance of image processing and analysis. In comparison to conventional UNet variations (e.g., UNet++), SMESwin UNet attains superior Dice scores (91.41% against 90.11% for Swin UNet on Dataset A) by using hierarchical visual information and reducing parameter costs. This further validates the superiority and effectiveness of Trans MMY Net, providing innovative ideas and methods for future multimodal image processing and analysis. The segmentation performance of Trans MMY Net on Dataset are shown in Figure 7. Purple color is used to stain the cell nuclei. Hematoxylin is a common stain that binds to the DNA in the nucleus, making it appear pink or blue. The color pink is used to stain the cytoplasm and extra cellular matrix. Eosin is another common stain that binds to proteins and other structures within the cell, given them a pink hue.

4.2. Ablation Experiment

This article conducts experimental research on fusion methods and compares three fusion methods on Dataset A, namely the following: (1) bottom fusion method; (2) input fusion method; and (3) channel trans fusion method. As the purpose of this experiment is to compare the performance of fusion methods, the experimental results of image modality data on a U-shaped backbone network were selected as the baseline for comparison.
The bottom fusion method, as shown in Figure 8, extracts the metadata feature vectors and multiplies them with the feature vectors of the image modality at the bottom of the encoder–decoder to obtain the final encoding vector, which is then input into the decoder for training.
The Blue and Purple lines represent the flow of data or feature maps through the network. The Yellow arrows might represent the direction of data flow or the transformation of data from one layer to another. The red lines signify a different type of connection or a special process such as skip connections, which are often used in architectures like U-Nets to help with feature propagation and reduce the vanishing gradient problem. The pink box labeled “ISSA” might represent a specific module or algorithm within the network that performs a unique function, such as attention or feature selection. The Grey boxes likely represent layers within the network, such as convolutional layers, pooling layers, or fully connected layers. The numbers inside these boxes (e.g., 64, 128, 256) probably indicate the number of filters or neurons in that layer.
The input fusion method adjusts the extracted vector of metadata information to be the same width and height as the input image. After the channels are stacked, they are used as new fusion feature vectors and input into the U-shaped backbone network for training.
According to the ablation experiment results in Table 3, the three fusion methods have an impact on the final image segmentation results. From the table, all three fusion methods have increased metadata. Among them, except for the bottom fusion method, which has a slightly lower IoU than the pure image segmentation backbone network by 0.002 (from 0.8255 to 0.8253), all other indicators have improved. Especially, the improvement of the channel trans fusion method on Dice and IoU exceeds that of the bottom fusion method and input fusion method. Compared to pure image backbone network segmentation, the Dice of the channel trans fusion method increased by 0.0116 (from 0.8959 to 0.9075), and the IoU increased by 0.0126 (from 0.8255 to 0.8381), making it the most effective fusion method among the three. This is because the channel trans fusion method can solve the problem of incompatible feature sets for different modal information, effectively improving the accuracy of image segmentation.
There are many ways to embed metadata in the MMY Net network. This article investigates the impact of different metadata embedding methods on the final segmentation results and compares their effectiveness.
Due to the fixed metadata combination for each image in Dataset B and Dataset A, firstly, this article uses digital quantization methods to embed metadata. For example, for Dataset A, benign is encoded as “0”, malignant is encoded as “1”, and the five differentiation levels are represented by numbers from 1 to 5. This method is referred to as digital quantification in this article.
The bottom fusion approach integrates metadata at the encoder–decoder interface by feature multiplication. Constrained by static fusion, resulting in minor performance declines (IoU: 0.8253 compared to a baseline of 0.8255). The input fusion approach integrates information with pictures at an early stage but overlooks modality interactions, resulting in minor improvements (Dice: 0.9006). The channel trans technique dynamically readjusts channel weights by transformer attention, attaining exceptional outcomes (Dice: 0.9075, IoU: 0.8381). The benefits of channel trans include the mitigation of incompatible feature sets, the reduction in redundancy, and the enhancement of modality alignment.
In addition, this article also attempted to extract word feature vectors from text data using methods such as BERT, ELMO, Word2Vec [53], GloVe [54], etc., only changing the language model while keeping the rest of the network the same and comparing the results.
As shown in Table 4, the method of extracting features from metadata vectors using the BERT model performs the best. The BERT method can outperform the method without metadata on Dice by 0.01484 and on IoU by 0.01721, while some language models, such as ELMO and GloVe, perform worse than the segmentation method without metadata.
BERT surpasses ELMO, Word2Vec, and GloVe owing to its contextual embeddings that include semantic linkages (e.g., tumor grades, differentiation levels) by pretraining on 3.3 billion words. High-dimensional vector sparse representations like Word2Vec and GloVe obscure subtle clinical details. BERT demonstrates superior robustness to low-frequency phrases, effectively managing uncommon medical terminology compared to Word2Vec.
ELMO’s bidirectional LSTM exhibits limitations in scalability, while GloVe is deficient in contextual awareness. The findings indicate that clinical information enhances performance through rich, context-aware representations, evidenced by BERT’s Dice score of 0.9141 compared to 0.8959 without metadata. This underscores the need to utilize sophisticated language models for the clinical literature in multimodal activities.
The experimental results of embedding metadata using the digital quantization method and the Word2Vec method, although they can surpass the method without metadata, are not as effective as BERT. It is speculated that digital quantization will weaken the semantic connections between metadata, leading to a decrease in performance. Word2Vec may not handle low-frequency words well because there is often insufficient context training.
The ELMO model is based on bidirectional LSTM, which performs better in generating context-sensitive embedding vectors but may have poor scalability for metadata types. However, the GloVe model cannot process contextual information, like some context-based word vectors, and may not capture the details of some language phenomena.
Figure 9 shows the visualization results on some language models, where (a) and (b) represent the original image and corresponding annotations, (c) represents the use of a metadata-free method, (d) represents the use of the ELMO language model, (e) represents the use of the digital quantization method, and (f) represents the use of the BERT method. It can be clearly seen from the figure that the BERT method makes the final segmentation result more accurate. Therefore, this article uses the BERT model to extract feature vectors from metadata.
In addition, this article also separately visualized the output features of the word vectors extracted by BERT in the TPB module, as shown in Figure 10.

5. Conclusions

This article enhances the fusion mechanism and backbone network utilized in the previously proposed MMY Net and introduces Trans MMY Net. The design concept of this network model is to enhance the integration of metadata and pictures using the channel trans module, hence improving the model’s performance and reliability. Simultaneously, implementing a backbone network that integrates a ViT and a CNN may significantly enhance the feature extraction efficacy and augment the model’s complexity and variety, hence improving the model’s generalization capability. The article’s experiment further investigates the influence of fusion techniques, language models, and vision transformers on the efficacy of network models. The test findings demonstrate that the channel trans module introduced in Trans MMY Net can efficiently integrate metadata and pictures, hence optimizing the fusion performance. Simultaneously, the backbone network integrating the ViT and CNN significantly enhances the model’s feature extraction capability, hence augmenting its generalization and resilience. This article’s study and discussion suggest that Trans MMY Net possesses significant application potential and promotional value in areas like medical imaging.

Author Contributions

Conceptualization, A.M.R.; Methodology, A.M.R.; Writing—original draft, A.M.R.; Writing—review & editing, K.L.; Supervision, K.L. and P.C.; Funding acquisition, P.C. All authors have read and agreed to the published version of the manuscript.

Funding

This work is supported in part by the National Natural Science Foundation of China (U23A20285, 62471442, 62201520, 62301508, 62301507 and 52406199), the Fundamental Research Program of Shanxi Province (202303021222095, 202403021223006, 202303021211149, 202303021222096, 202203021222052, 202403021212022), and the State Key Laboratory of Extreme Environment Optoelectronic Dynamic Measurement Technology and Instrument (2024-SYSJJ-03), and Shanxi key laboratory of Intelligent Detection Technology & Equipment (2023-006).

Data Availability Statement

All the data are available on the paper.

Conflicts of Interest

The authors declare no conflicts of interest.

References

  1. Kirch, D.G.; Petelle, K. Addressing the Physician Shortage. JAMA 2017, 317, 1947. [Google Scholar] [CrossRef] [PubMed]
  2. Topol, E.J. High-Performance Medicine: The Convergence of Human and Artificial Intelligence. Nat. Med. 2019, 25, 44–56. [Google Scholar] [CrossRef] [PubMed]
  3. Golden, J.A. Deep Learning Algorithms for Detection of Lymph Node Metastases from Breast Cancer. JAMA 2017, 318, 2184. [Google Scholar] [CrossRef]
  4. Akay, A.; Hess, H. Deep Learning: Current and Emerging Applications in Medicine and Technology. IEEE J. Biomed. Health Inform. 2019, 23, 906–920. [Google Scholar] [CrossRef]
  5. Piccialli, F.; Somma, V.D.; Giampaolo, F.; Cuomo, S.; Fortino, G. A Survey on Deep Learning in Medicine: Why, How and When? Inf. Fusion 2021, 66, 111–137. [Google Scholar] [CrossRef]
  6. Agarwal, A.; Kumar, R.; Gupta, M. Review on Deep Learning Based Medical Image Processing. In Proceedings of the 2022 IEEE International Conference on Current Development in Engineering and Technology (CCET), Bhopal, India, 23–24 December 2022. [Google Scholar] [CrossRef]
  7. Bizopoulos, P.; Koutsouris, D. Deep Learning in Cardiology. IEEE Rev. Biomed. Eng. 2019, 12, 168–193. [Google Scholar] [CrossRef]
  8. Elshennawy, N.M.; Ibrahim, D.M. Deep-Pneumonia Framework Using Deep Learning Models Based on Chest X-Ray Images. Diagnostics 2020, 10, 649. [Google Scholar] [CrossRef]
  9. Krittanawong, C.; Johnson, K.W.; Rosenson, R.S.; Wang, Z.; Aydar, M.; Baber, U.; Min, J.K.; Tang, W.H.W.; Halperin, J.L.; Narayan, S.M. Deep Learning for Cardiovascular Medicine: A Practical Primer. Eur. Heart J. 2019, 40, 2058–2073. [Google Scholar] [CrossRef]
  10. Acosta, J.N.; Falcone, G.J.; Rajpurkar, P.; Topol, E.J. Multimodal Biomedical AI. Nat. Med. 2022, 28, 1773–1784. [Google Scholar] [CrossRef]
  11. Liu, Y.; Sheng, Z.; Shen, H.-L. Guided Image Deblurring by Deep Multi-Modal Image Fusion. IEEE Access 2022, 10, 130708–130718. [Google Scholar] [CrossRef]
  12. Kline, A.; Wang, H.; Li, Y.; Dennis, S.; Hutch, M.; Xu, Z.; Wang, F.; Cheng, F.; Luo, Y. Multimodal Machine Learning in Precision Health: A Scoping Review. Npj Digit. Medicine 2022, 5, 171. [Google Scholar] [CrossRef] [PubMed]
  13. Azam, M.A.; Khan, K.B.; Salahuddin, S.; Rehman, E.; Khan, S.A.; Khan, M.A.; Kadry, S.; Gandomi, A.H. A Review on Multimodal Medical Image Fusion: Compendious Analysis of Medical Modalities, Multimodal Databases, Fusion Techniques and Quality Metrics. Comput. Biol. Med. 2022, 144, 105253. [Google Scholar] [CrossRef] [PubMed]
  14. Basu, S.; Singhal, S.; Singh, D. A Systematic Literature Review on Multimodal Medical Image Fusion. Multimed. Tools Appl. 2023, 83, 15845–15913. [Google Scholar] [CrossRef]
  15. Zhou, T.; Cheng, Q.; Lu, H.; Li, Q.; Zhang, X.; Qiu, S. Deep Learning Methods for Medical Image Fusion: A Review. Comput. Biol. Med. 2023, 160, 106959. [Google Scholar] [CrossRef]
  16. Ayesha, S.; Hanif, M.K.; Talib, R. Performance Enhancement of Predictive Analytics for Health Informatics Using Dimensionality Reduction Techniques and Fusion Frameworks. IEEE Access 2022, 10, 753–769. [Google Scholar] [CrossRef]
  17. Behrad, F.; Saniee Abadeh, M. An Overview of Deep Learning Methods for Multimodal Medical Data Mining. Expert Syst. Appl. 2022, 200, 117006. [Google Scholar] [CrossRef]
  18. Safari, M.; Fatemi, A.; Archambault, L. MedFusionGAN: Multimodal Medical Image Fusion Using an Unsupervised Deep Generative Adversarial Network. BMC Med. Imaging 2023, 23, 203. [Google Scholar] [CrossRef]
  19. Stahlschmidt, S.R.; Ulfenborg, B.; Synnergren, J. Multimodal Deep Learning for Biomedical Data Fusion: A Review. Brief. Bioinform. 2022, 23, bbab569. [Google Scholar] [CrossRef]
  20. Fei, N.; Lu, Z.; Gao, Y.; Yang, G.; Huo, Y.; Wen, J.; Lu, H.; Song, R.; Gao, X.; Xiang, T.; et al. Towards Artificial General Intelligence via a Multimodal Foundation Model. Nat. Commun. 2022, 13, 3094. [Google Scholar] [CrossRef]
  21. Krishnan, R.; Rajpurkar, P.; Topol, E.J. Self-Supervised Learning in Medicine and Healthcare. Nat. Biomed. Eng. 2022, 6, 1346–1352. [Google Scholar] [CrossRef]
  22. Weng, Y.; Zhang, Y.; Wang, W.; Dening, T. Semi-Supervised Information Fusion for Medical Image Analysis: Recent Progress and Future Perspectives. Inf. Fusion 2024, 106, 102263. [Google Scholar] [CrossRef]
  23. Shmatko, A.; Ghaffari Laleh, N.; Gerstung, M.; Kather, J.N. Artificial Intelligence in Histopathology: Enhancing Cancer Research and Clinical Oncology. Nature Cancer 2022, 3, 1026–1038. [Google Scholar] [CrossRef] [PubMed]
  24. Nguyen, P.T.H.; Sudholt, D. Memetic Algorithms Outperform Evolutionary Algorithms in Multimodal Optimisation. Artif. Intell. 2020, 287, 103345. [Google Scholar] [CrossRef]
  25. Waqas, A.; Tripathi, A.; Ramachandran, R.P.; Stewart, P.A.; Rasool, G. Multimodal Data Integration for Oncology in the Era of Deep Neural Networks: A Review. Front. Artif. Intell. 2024, 7, 1408843. [Google Scholar] [CrossRef]
  26. Dasgupta, P. Re: Artificial Intelligence for Diagnosis and Gleason Grading of Prostate Cancer: The PANDA Challenge. Eur. Urol. 2022, 82, 571. [Google Scholar] [CrossRef]
  27. Chen, R.J.; Lu, M.Y.; Shady, M.; Lipkova, J.; Chen, T.; Williamson, D.F.; Joo, B.; Mahmood, F. Abstract PO-002: Pan-Cancer Integrative Histology-Genomic Analysis via Interpretable Multimodal Deep Learning. Clin. Cancer Res. 2021, 27, PO-002. [Google Scholar] [CrossRef]
  28. Amgad, M.; Hodge, J.M.; Maha, A.T.E.; Bodelon, C.; Puvanesarajah, S.; Gutman, D.A.; Siziopikou, K.P.; Goldstein, J.A.; Gaudet, M.M.; Teras, L.R.; et al. A Population-Level Digital Histologic Biomarker for Enhanced Prognosis of Invasive Breast Cancer. Nat. Med. 2023, 30, 85–97. [Google Scholar] [CrossRef]
  29. Huang, Z.; Shao, W.; Han, Z.; Alkashash, A.M.; De la Sancha, C.; Parwani, A.V.; Nitta, H.; Hou, Y.; Wang, T.; Salama, P.; et al. Artificial Intelligence Reveals Features Associated with Breast Cancer Neoadjuvant Chemotherapy Responses from Multi-Stain Histopathologic Images. Npj Precis. Oncol. 2023, 7, 14. [Google Scholar] [CrossRef]
  30. Lan, L.; Zhang, Y.; Li, X.; Wang, K. Deep Learning-Based Prediction Model for Predicting the Tumor Origin of Cancers of Unknown Primary. J. Clin. Oncol. 2023, 41, e13562. [Google Scholar] [CrossRef]
  31. Gu, R.; Zhang, Y.; Wang, L.; Chen, D.; Wang, Y.; Ge, R.; Jiao, Z.; Ye, J.; Jia, G.; Wang, L. Mmy-Net: A Multimodal Network Exploiting Image and Patient Metadata for Simultaneous Segmentation and Diagnosis. Multimed. Syst. 2024, 30, 72. [Google Scholar] [CrossRef]
  32. Ronneberger, O.; Fischer, P.; Brox, T. U-Net: Convolutional Networks for Biomedical Image Segmentation. Lect. Notes Comput. Sci. 2015, 9351, 234–241. [Google Scholar]
  33. Zhou, Z.; Siddiquee, M.M.R.; Tajbakhsh, N.; Liang, J. UNet++: Redesigning Skip Connections to Exploit Multiscale Features in Image Segmentation. IEEE Trans. Med. Imaging 2019, 39, 1856–1867. [Google Scholar] [CrossRef]
  34. Diakogiannis, F.I.; Waldner, F.; Caccetta, P.; Wu, C. ResUNet-a: A Deep Learning Framework for Semantic Segmentation of Remotely Sensed Data. ISPRS J. Photogramm. Remote Sens. 2020, 162, 94–114. [Google Scholar] [CrossRef]
  35. Zhu, J.-Y.; Park, T.; Isola, P.; Efros, A.A. Unpaired Image-To-Image Translation Using Cycle-Consistent Adversarial Networks. In Proceedings of the 2017 IEEE International Conference on Computer Vision (ICCV), Venice, Italy, 22–29 October 2017. [Google Scholar]
  36. Alom, M.Z.; Yakopcic, C.; Taha, T.M.; Asari, V.K. Nuclei Segmentation with Recurrent Residual Convolutional Neural Networks Based U-Net (R2U-Net). In Proceedings of the NAECON 2018-IEEE National Aerospace and Electronics Conference, Dayton, OH, USA, 23–26 July 2018. [Google Scholar]
  37. Guan, S.; Khan, A.; Sikdar, S.; Chitnis, P. Fully Dense UNet for 2D Sparse Photoacoustic Tomography Artifact Removal. IEEE J. Biomed. Health Inform. 2019, 24, 568–576. [Google Scholar] [CrossRef]
  38. Huang, H.; Lin, L.; Tong, R.; Hu, H.; Zhang, Q.; Iwamoto, Y.; Han, X.; Chen, Y.-W.; Wu, J. UNet 3+: A Full-Scale Connected UNet for Medical Image Segmentation. In Proceedings of the ICASSP 2020-2020 IEEE International Conference on Acoustics, Speech and Signal Processing (ICASSP), Barcelona, Spain, 4–8 May 2020. [Google Scholar]
  39. Hussain, T.; Shouno, H.; Mohammed, M.A.; Marhoon, H.A.; Alam, T. DCSSGA-UNet: Biomedical Image Segmentation with DenseNet Channel Spatial and Semantic Guidance Attention. In Knowledge-Based Systems; Elsevier: Amsterdam, The Netherlands, 2025; Volume 314, p. 113233. [Google Scholar] [CrossRef]
  40. Rehman, M.U.; Nizami, I.F.; Ullah, F.; Hussain, I. IQA Vision Transformed: A Survey of Transformer Architectures in Perceptual Image Quality Assessment. IEEE Access 2024, 12, 183369–183393. [Google Scholar] [CrossRef]
  41. Dosovitskiy, A.; Beyer, L.; Kolesnikov, A.I.; Weissenborn, D.; Zhai, X.; Unterthiner, T.; Dehghani, M.; Minderer, M.; Heigold, G.; Gelly, S.; et al. An Image Is Worth 16x16 Words: Transformers for Image Recognition at Scale. arXiv 2020, arXiv:2010.11929. [Google Scholar]
  42. Wang, H.; Cao, P.; Wang, J.; Zaiane, O.R. UCTransNet: Rethinking the Skip Connections in U-Net from a Channel-Wise Perspective with Transformer. In Proceedings of the AAAI Conference on Artificial Intelligence; AAAI Press: Washington, DC, USA, 2022; Volume 36, pp. 2441–2449. [Google Scholar]
  43. PENG, D.; KAMEYAMA, W. Structural Relation Multi-Class Token Transformer for Weakly Supervised Semantic Segmentation. In IEICE Transactions on Information and Systems; IEICE: Tokyo, Japan, 2024. [Google Scholar]
  44. Han, K.; Wang, Y.; Chen, H.; Chen, X.; Guo, J.; Liu, Z.; Tang, Y.; Xiao, A.; Xu, C.; Xu, Y.; et al. A Survey on Vision Transformer. In IEEE Transactions on Pattern Analysis and Machine Intelligence; IEEE: New York, NY, USA, 2022; Volume 45, pp. 87–110. [Google Scholar]
  45. Hussain, T.; Shouno, H.; Hussain, A.; Hussain, D.; Ismail, M.; Mir, T.H.; Hsu, F.R.; Alam, T.; Akhy, S.A. EFFResNet-ViT: A Fusion-Based Convolutional and Vision Transformer Model for Explainable Medical Image Classification. IEEE Access 2025, 13, 54040–54068. [Google Scholar] [CrossRef]
  46. Liu, Z.; Lin, Y.; Cao, Y.; Hu, H.; Wei, Y.; Zhang, Z.; Lin, S.; Guo, B. Swin Transformer: Hierarchical Vision Transformer Using Shifted Windows. In Proceedings of the 2021 IEEE/CVF International Conference on Computer Vision (ICCV), Montreal, QC, Canada, 10–17 October 2021. [Google Scholar]
  47. Dolz, J.; Gopinath, K.; Yuan, J.; Lombaert, H.; Desrosiers, C.; Ayed, I.B. HyperDense-Net: A Hyper-Densely Connected CNN for Multi-Modal Image Segmentation. In IEEE Transactions on Medical Imaging; IEEE: New York, NY, USA, 2019; Volume 38, pp. 1116–1126. [Google Scholar]
  48. Ibtehaz, N.; Rahman, M.S. MultiResUNet: Rethinking the U-Net Architecture for Multimodal Biomedical Image Segmentation. Neural Netw. 2020, 121, 74–87. [Google Scholar] [CrossRef]
  49. Hellmann, F.; Ren, Z.; Andre, E.; Schuller, B.W. Deformable Dilated Faster R-CNN for Universal Lesion Detection in CT Images. In Proceedings of the 2021 43rd Annual International Conference of the IEEE Engineering in Medicine & Biology Society (EMBC), Guadalajara, Mexico, 1–5 November 2021; pp. 2896–2902. [Google Scholar]
  50. Solley, K.; Turner, C. Prevalence and Correlates of Clinically Significant Body-Focused Repetitive Behaviors in a Non-Clinical Sample. Compr. Psychiatry 2018, 86, 9–18. [Google Scholar] [CrossRef]
  51. Payne, S.; Józsa, T.I.; El-Bouri, W.K. Review of in Silico Models of Cerebral Blood Flow in Health and Pathology. Prog. Biomed. Eng. 2023, 5, 022003. [Google Scholar] [CrossRef]
  52. Höhn, J.; Krieghoff-Henning, E.; Jutzi, T.B.; Kalle, C.V.; Utikal, J.S.; Meier, F.; Gellrich, F.F.; Hobelsberger, S.; Hauschild, A.; Schlager, J.G.; et al. Combining CNN-Based Histologic Whole Slide Image Analysis and Patient Data to Improve Skin Cancer Classification. Eur. J. Cancer 2021, 149, 94–101. [Google Scholar] [CrossRef] [PubMed]
  53. Chen, J.-N.; Sun, S.; He, J.; Torr, P.; Yuille, A.; Bai, S. TransMix: Attend to Mix for Vision Transformers. In Proceedings of the 2022 IEEE/CVF Conference on Computer Vision and Pattern Recognition (CVPR), New Orleans, LA, USA, 18–24 June 2022. [Google Scholar]
  54. Meng, W.; Liu, S.; Wang, H. AFC-Unet: Attention-Fused Full-Scale CNN-Transformer Unet for Medical Image Segmentation. Biomed. Signal Process. Control. 2025, 99, 106839. [Google Scholar] [CrossRef]
Figure 1. Trans MMY Net framework.
Electronics 14 02369 g001
Figure 2. Channel trans module.
Electronics 14 02369 g002
Figure 3. Differences between BN, LN, and IN.
Electronics 14 02369 g003
Figure 4. Multi-head cross-attention (MCA) module.
Electronics 14 02369 g004
Figure 5. SMESwin UNet structure.
Electronics 14 02369 g005
Figure 6. Comparison of CCT and MCCT structures.
Electronics 14 02369 g006
Figure 7. The segmentation performance of Trans MMY Net on Dataset B. (a) Example 1. (b) The segmentation results of Trans MMY Net on (a) image. (c) Example 2. (d) The segmentation results of the (c) graph using Trans MMY Net.
Electronics 14 02369 g007
Figure 8. Bottom fusion method.
Electronics 14 02369 g008
Figure 9. Visualization of segmentation results for different languages models on Dataset A.
Electronics 14 02369 g009
Figure 10. Visualization of metadata information corresponding to Dataset A images by BERT.
Electronics 14 02369 g010
Table 1. Segmentation results of different networks on Dataset A.
MethodDiceIoU
DeepLabv30.87490.7776
CENet0.89020.8021
SegFormer0.89730.8137
SETR-PUP0.88750.7978
Swin UNet0.90110.8279
MMY-Net0.90360.8322
SMESwin UNet0.90660.8292
Trans MMY-Net (channel trans)0.91070.836
Trans MMY-Net0.91410.8419
(Note: Dice and IoU are unitless similarity coefficients ranging from 0 to 1.).
Table 2. Segmentation results of different networks on Dataset B.
MethodmPAmIoUmDice
MMY-Net0.78910.65910.7931
Trans MMY-Net0.80650.68040.8085
Table 3. Ablation experiment of the fusion method.
MethodDiceIoU
Backbone0.89590.8255
Bottom fusion method0.90010.8253
Input fusion method0.90060.8275
Channel trans fusion method0.90750.8381
(Note: Dice and IoU are unitless similarity coefficients ranging from 0 to 1.).
Table 4. Segmentation results of different language models on Dataset A.
MethodDiceIoU
No metadata0.895890.82546
Digital quantification method0.90745 ↑0.83809 ↑
ELMO0.89084 ↓0.81541 ↓
Word2Vec0.90133 ↑0.82825 ↑
GloVe0.89514 ↓0.81911 ↓
BERT0.91073 ↑0.84267 ↑
(Note: Dice and IoU are unitless similarity coefficients ranging from 0 to 1 and presented as a ratio.).
Disclaimer/Publisher’s Note: The statements, opinions and data contained in all publications are solely those of the individual author(s) and contributor(s) and not of MDPI and/or the editor(s). MDPI and/or the editor(s) disclaim responsibility for any injury to people or property resulting from any ideas, methods, instructions or products referred to in the content.

