1. Introduction
In rail systems, train management plays an important role in maintaining the operability and punctuality of daily operations. While most train operation centers have separately dedicated tools for monitoring, planning, and evaluating their train network systems, very few have an integrated platform that can both monitor real-time train delays and evaluate the impact of service disruptions on the train networks through a 3D visualization. Such platforms could greatly assist train operators in understanding the impacts of service disruptions and enabling timely response for rapid recovery. To this end, several main challenges need to be addressed, including tracking real-time train movements, knowing current and future passenger flows, simulating service disruptions, and visualizing real-time train movements and delays. Consequently, the potential solutions require a multidisciplinary approach in which a range of technologies are collectively employed, including IoT remote sensing, real-time data processing, passenger flow prediction, traffic simulation, and 3D visualization.
This research addresses the above challenges by proposing a digital twin platform which features passenger flow prediction and traffic simulation. The proposed platform is comprised of the following four key components: (1) a data feed that connects to real-time train geographical location data, (2) a traffic simulation engine to simulate service disruptions and estimate the delays of impacted trains, (3) a deep learning-based prediction model that predicts train passenger flow, and (4) an interactive user interface with a 3D visualization of real-time train/passenger movements. The above four components work together collectively. The data feed retrieves the real-time train geographical location data collected by the GPS devices installed on the train vehicles. By comparing the real-time train movements against scheduled timetable, the information of each individual train’s delay is obtained, which serves the function of real-time train delay monitoring. To evaluate service disruption impact, the simulation engine takes the real-time train movements as input and outputs the impacted trains and their delays for a given incident. The prediction model trained on historical passenger flow data can provide predictions of future passenger flows. Using the simulation results of train delays and the predicted passenger flow results, the impact of a given incident is then identified and visualized on the user interface in terms of delays and affected passengers.
To the best of our knowledge, this is a pioneering work in the area of rail digital twins powered by deep learning, simulation, and visualization technologies. Following the proposed methodology, we carry out a case study developing a digital twin for the rail network in Sydney, Australia.
The rest of this paper is organized as follows:
Section 2 presents a literature review on a number of cross-disciplinary research problems related to this study;
Section 3 summarizes the main contributions of this work;
Section 4 introduces our proposed four-layer digital twin architecture, then formulates the passenger flow prediction problem and prediction modeling approach based on deep learning;
Section 5 presents our real-life case study applied over the Sydney rail network along with performance evaluations in different scenarios; finally, conclusions and future directions are discussed in
Section 6.
2. Related Work
2.1. Digital Twins
A digital twin is a digital replicate of a physical asset, process or system. The digital twin concept has started to gain a great deal of momentum and interest across the world due to the high need to consolidate existing heterogeneous data sources into a single model that can be used for purposes such as maintenance, inspection, upgrade, scenario testing, and prediction. The applications of digital twins cover a spectrum including agriculture, energy, manufacturing, constructions, cities, healthcare, aerospace, waste, water, transport, and automotive uses (see Figure 4 in [
1]).
Several review papers [
2,
3,
4,
5,
6] have reported the evolution of digital twins from their inception to the current state-of-the-art technologies while also highlighting the ongoing challenges in the field. According to the literature, the widely accepted definition of digital twin was introduced in [
7], which defines a digital twin in aerospace domain as follows: “A Digital Twin is an integrated multiphysics, multiscale, probabilistic simulation of an as-built vehicle or system that uses the best available physical models, sensor updates, fleet history, etc., to mirror the life of its corresponding flying twin.” In the past decades, various digital twin models have been proposed. A highly cited digital twin model is the digital twin model presented in [
8], which consists of three key components: (a) physical objects in real space, (b) virtual objects in virtual space, and (c) the communication channels connecting these real and virtual objects. Other models have subsequently been proposed based on the above three-part model. One example is the five-part model presented in [
3], consisting of a physical entity, a virtual entity, digital twin data, services, and their connections. The literature [
9] also includes a proposal for a five-part model composed of a physical system, a digital system, an updating engine, a prediction engine, and an optimization engine.
The benefits of building digital twins are manifold, including reduced operating costs thanks to increased productivity, improved safety of the system for all employees using it on a regular basis, optimization of asset management to improve sustainability, predictive maintenance to reduce downtime and maintenance cost, and enhanced decision-making allowing for more informed and faster decisions.
However, there are also a number of challenges in the large-scale adoption of digital twins at operational levels, among which we cite the large amount of multi-source data requiring integration, the increasing amount of detailed data required to construct digital twins, the global interdependencies between different stakeholders, and the enabling technologies for advanced digital twin modeling.
2.2. Maturity Levels in Digital Twins
The literature [
10] divides digital twins into five groups in terms of maturity. Currently, the majority of digital twins are at maturity levels 0–2, with some at level 3. Level 3 indicates the start of integration with real-time data streams to address the challenges of data mapping, cleaning, filtering, real-time processing, and device malfunctions which can create anomalies or missing data points. In this work the digital twin that we build is at Level 3 maturity and aims to reach Level 4, as it integrates a static network layout, a 3D city model, real-time train movement updated every 10 s, a deep learning prediction model for passenger flow, and a traffic simulation engine. This high level of maturity allows for improved situational awareness on the part of train operation centers and testing of various scenarios for incident management.
2.3. Rail Digital Twins
In railway digital twins modeling, the initial steps involve the asset management space via digital renderings of component parts, assemblies, and fixtures. Dassault Systems [
11] has taken this to a new level by integrating virtual reality with 3D rendering of the system. While major achievements have been obtained to date for industrial and production plants, new modeling progress is being pushed for track inspection upgrades and decision-making. Among the main challenges for railway digital twins involve track maintenance issues such as derailments, rail breaks, sleeper breaks, fastener failure, excessive rail wear, poor ride quality, and vibration. Alstom, one of the largest transport providers in Europe [
12], has started to develop a rail network digital twin for railway yard design and predictive fleet maintenance. Their digital twin uses AnyLogic simulation software embedding 3D simulation modeling for operational research and asset management maintenance.
In addition to asset management issues, challenges appear regarding real-time operations and movement of trains in realistic 3D digital twin networks. Research scientists are being left behind by several industry leaders, which are moving towards detailed simulation modeling of the transport system without considering important research questions about the ability of such systems powered by big data and artificial intelligence.
Although only a limited number of studies reported in the literature focus on leveraging artificial intelligent in railway digital twin systems, these few efforts have demonstrated its potential to augment both predictive capabilities and real-time decision-making processes. A recent study reported in [
13] employed artificial intelligence to predict short-term inbound and outbound passenger flows in urban rail transit within a digital framework, resulting in improved predictive accuracy. Our work differs from the above study in several key aspects. First, our study proposes a four-layer system architecture for developing digital twins at the level of an entire rail network, while the above work studied individual train stations. Second, the digital twin presented in our work is based on the combination of multiple technologies, including prediction, simulation, and visualization, with the purpose of evaluating the impact of service disruptions. The previous study was primarily focused on passenger flow prediction and identification of influencing factors. Third, our work actually implements the proposed digital twin in order to validate and showcase our approach.
2.4. Passenger Flow Prediction
In the context of passenger flow prediction, recent studies have explored the application of various machine learning and deep learning approaches implemented both independently and in hybrid configurations. For example, the authors of [
14] applied a combination of Support Vector Regression (SVR) and Long Short-Term Memory (LSTM) models, while the authors of [
15] similarly opted for LSTM modeling but with seasonality analysis via the Holt–Winter method. In the same trend, the authors of [
16,
17] opted to combine Deep Neural Networks (DNN) with Stacked Auto-Encoders (SAE). A multitude of papers have studied other models or combinations, such as Convolutional Neural Networks (CNNs) [
18], ARIMA [
19], Generalized Auto-Regressive Conditional Heteroskedasticity (GARCH) [
20], Gated Recurrent Unit Neural Networks (GRUNNs), Radial Basis Function Neural Networks (RBFNNs) [
21], and more. There have been a number of attempts to integrate graph-based predictions for traffic flow prediction, as presented in [
22,
23]; however, these were applied for motorways, not railway systems.
Table 1 provides a summary of the approaches, data sources, and application domains of the above studies.
It is worth mentioning that time series prediction approaches used in other domains may also be employed in passenger flow prediction, such as the physics-guided TL-LSTM network [
24] and transformer-based forecasting models [
25,
26,
27].
With regard to the data used for predicting passenger flows, the majority of studies [
28,
29] have used passenger tap-on or tap-off systems provided by train operation centers. While such datasets are extremely useful for cities where the entries at each train platforms are monitored regardless of whether or not they are an interchange, this approach can be problematic for cities where the train network only consists of main entries and exits and where interchanges inside the stations are not tracked. This raises significant problems, especially when more than one transfer can take place from any origin to any destination or when multiple possibilities exist for individual train platforms inside stations. This issue helps to motivate our current hybrid digital twin modeling approach, which uses data from one of the major mobile data providers in Australia. These data provide us with fine-grained information on peoples’ movement between stations and transfers. The work reported in this paper represents a continuation of our previous work, which studied the problem of dynamic train demand estimation and passenger assignment [
30] as well as the impact of COVID-19 on the public transportation network of Sydney, Australia [
31].
2.5. Incident Disruption Impact Modeling
Modeling the incident disruption impacts on transport systems is a non-trivial problem. Previous attempts have looked into traffic simulation modeling and machine learning integration for predicting future demand growth under disruption scenarios [
32,
33,
34] as well as at methods for predicting the duration of non-recurring incidents [
35,
36,
37]. Again, however, these have mainly been applied for regular road transportation systems and multi-objective optimization problems.
3. Contributions
To the best of our knowledge, this is a pioneering work around railway digital twin modeling powered by fusion of multiple advanced technologies. Moreover, we have not found any previous studies integrating train movements together with passenger movements in an attempt to understand the impact of service disruptions. Specifically, our research addresses the existing gaps in the literature from the following key perspectives:
From a digital twin perspective, we propose a four-layer system architecture for developing digital twins that model an entire rail network rather than focusing on individual stations. The proposed multidisciplinary approach is underpinned by real-time data processing, passenger flow prediction, traffic simulation, and 3D visualization. This provides the capabilities with regard to both forecasting and what-if analysis, enabling train operation centers to predict passenger flows as well as to evaluate the potential impact of service disruptions. This dual functionality supports more informed decision-making and strategic planning within complex network environments. A case study of the Sydney rail network has been implemented, demonstrating the practical utility and effectiveness of our approach in a real-world context.
From a deep learning perspective, this work addresses several major research gaps in the current literature, including the following: (1) most deep learning models aim at regular time series prediction without considering the graph structure of the network or the impact of disruptions on passenger flows, and (2) current models mostly rely on tap-on/tap-off data, which do not contain sufficiently fine-grained information with regard to transfer activities in interchanges. To address this, our proposed approach uses mobile data to capture the fine-grained information of passenger transfers within stations. In addition, our research is specifically designed to evaluate the impact of service disruptions. The robustness of the proposed approach is evidenced by its performance in a case study on the impacts of COVID-19 restrictions where the scenario is characterized by limited data availability.
4. Methodology
4.1. Digital Twin System Architecture
The digital twin system architecture is shown in
Figure 1. It mainly consists of four layers, including the data connection layer, data services layer, analytics layer, and visualization layer. The architecture is summarized below:
1. Data connection layer: Designed to connect to three different types of data sources, each of which is handled by a specific category of data connectors: (a) data API clients connect to the data provided by data APIs; (b) data importers import the data in common formats such as CSV, XML, and JSON; and (c) data crawlers regular scan various web pages on the internet. Data collected by API clients and crawlers mainly consist of real-time train movement and incident alert data, while those from data importers mainly consist of static data on train stations, railway tracks, and timetables.
2. Data service layer: Responsible for data management, including data parsing, preprocessing, storage, and querying. The raw data collected by data connection layer need to be parsed and preprocessed before being passed on to the next layer. The normalized and noise-free data are saved by the system in one of two formats, database tables or JSON files, depending on their characteristics and intended use.
3. Analytics layer: This layer represents the engine that powers the proposed system. This layer includes a range of components used to undertake different tasks. The map-matching component aligns different datasets by matching their geographic coordinates (normally, latitude and longitude), for instance by matching real-time train position data to railway track data. The delay analysis component analyzes train delays against schedule timetables and identifies delay patterns, while the trip distribution component is used for passenger assignment. There are also components for predicting passenger flow and incident duration by using historical and current train situation data, respectively. Finally, the incident simulation component is able to simulate a specified incident at a train station to help operators understand the impact on the network for response scenario planning purposes.
4. Visualization layer: This layer provides a visible interface that enables users to interact with the system. The proposed system uses a 3D map as the base, then overlays different datasets on top of the map, including railway networks, real-time train movements, and incident scenario simulation. Notably, the system visualizes the data by layering multiple datasets onto a base map. This mechanism can facilitate seamless integration of additional data sources in the future, such as commuter car parking data, roadway traffic, and air quality monitoring data.
4.2. Formulation of the Passenger Flow Prediction Problem
As the context of passenger flow prediction in this study is the train passengers in a railway network, we first define the prediction problem and its context.
Railway Network: A railway network consists of train stations and an adjacency matrix in which each element indicates a connection (link) between two train stations along with its distance. A railway network with
m train stations can be denoted as
in which
is a train station and
A is the adjacency matrix containing the distance between any two stations.
Passenger Flow: In a given railway network
, let
and
be the number of passengers entering and exiting a station
at time
t, respectively. The passenger flow in the railway network
R at time
t is denoted as
Passenger Flow Prediction Problem: Our goal is to build a model
that predicts
based on
:
where
and the size of
is varying.
4.3. Passenger Flow Prediction Using Deep Learning
Deep learning is usually relied on to learn high-dimensional functions via sequences of semi-affine nonlinear transformations. A recent detailed literature review can be found in [
38], where different deep learning algorithms are detailed along with their structures and characteristics. Due to its capability to find spatial–temporal relations between features, we leverage deep learning to build the passenger flow prediction models in this study. Using time series data collected from mobile devices along with the network graph structure, we leverage three deep learning algorithms based on CNN [
39], LSTM [
15], and a Diffusion Convolutional Recurrent Neural Network (DCRNN) [
40]. We evaluate their performance against other baseline models, including Linear Regression (LR) [
41] and SVR [
42], then select the winner as the final model for passenger flow prediction. These three deep learning models are summarized below.
1. Long Short-Term Memory models are a special type of Recurrent Neural Network (RNN). LSTM models are well-suitable for time series data, as they are better at dealing with the issue of vanishing gradients than traditional RNNs. During training, LSTM recognizes when the gradient values become extremely small, then prevents the weights from changing their values and ends further learning.
Figure 2 showcases the structure of the LSTM model that we developed in this work for passenger flow prediction. An LSTM unit is typically comprised of three gates: the forget gate
, input gate
, and output gate
. An LSTM model is a sequence of LSTM units, in which the output of one unit is consumed as input by the following unit. The output of the last unit feeds into a fully connected layer, which makes the the final prediction. For our given passenger flow time series
, the above three gates can be trained using the following equations:
where
is the unit input,
is the unit state,
is the output,
is the sigmoid activation function,
is the tanh activation function,
stands for the weight matrices, and
represents the bias vectors.
Overall, in our application we have a time series of passenger flow vectors for all stations. For each time step from the past horizon , an LSTM unit accepts the vector as input and outputs a hidden state vector and output vector of equal length. The hidden state is passed to the next unit . The last output vector is connected to the fully-connected layer in order to obtain the final result.
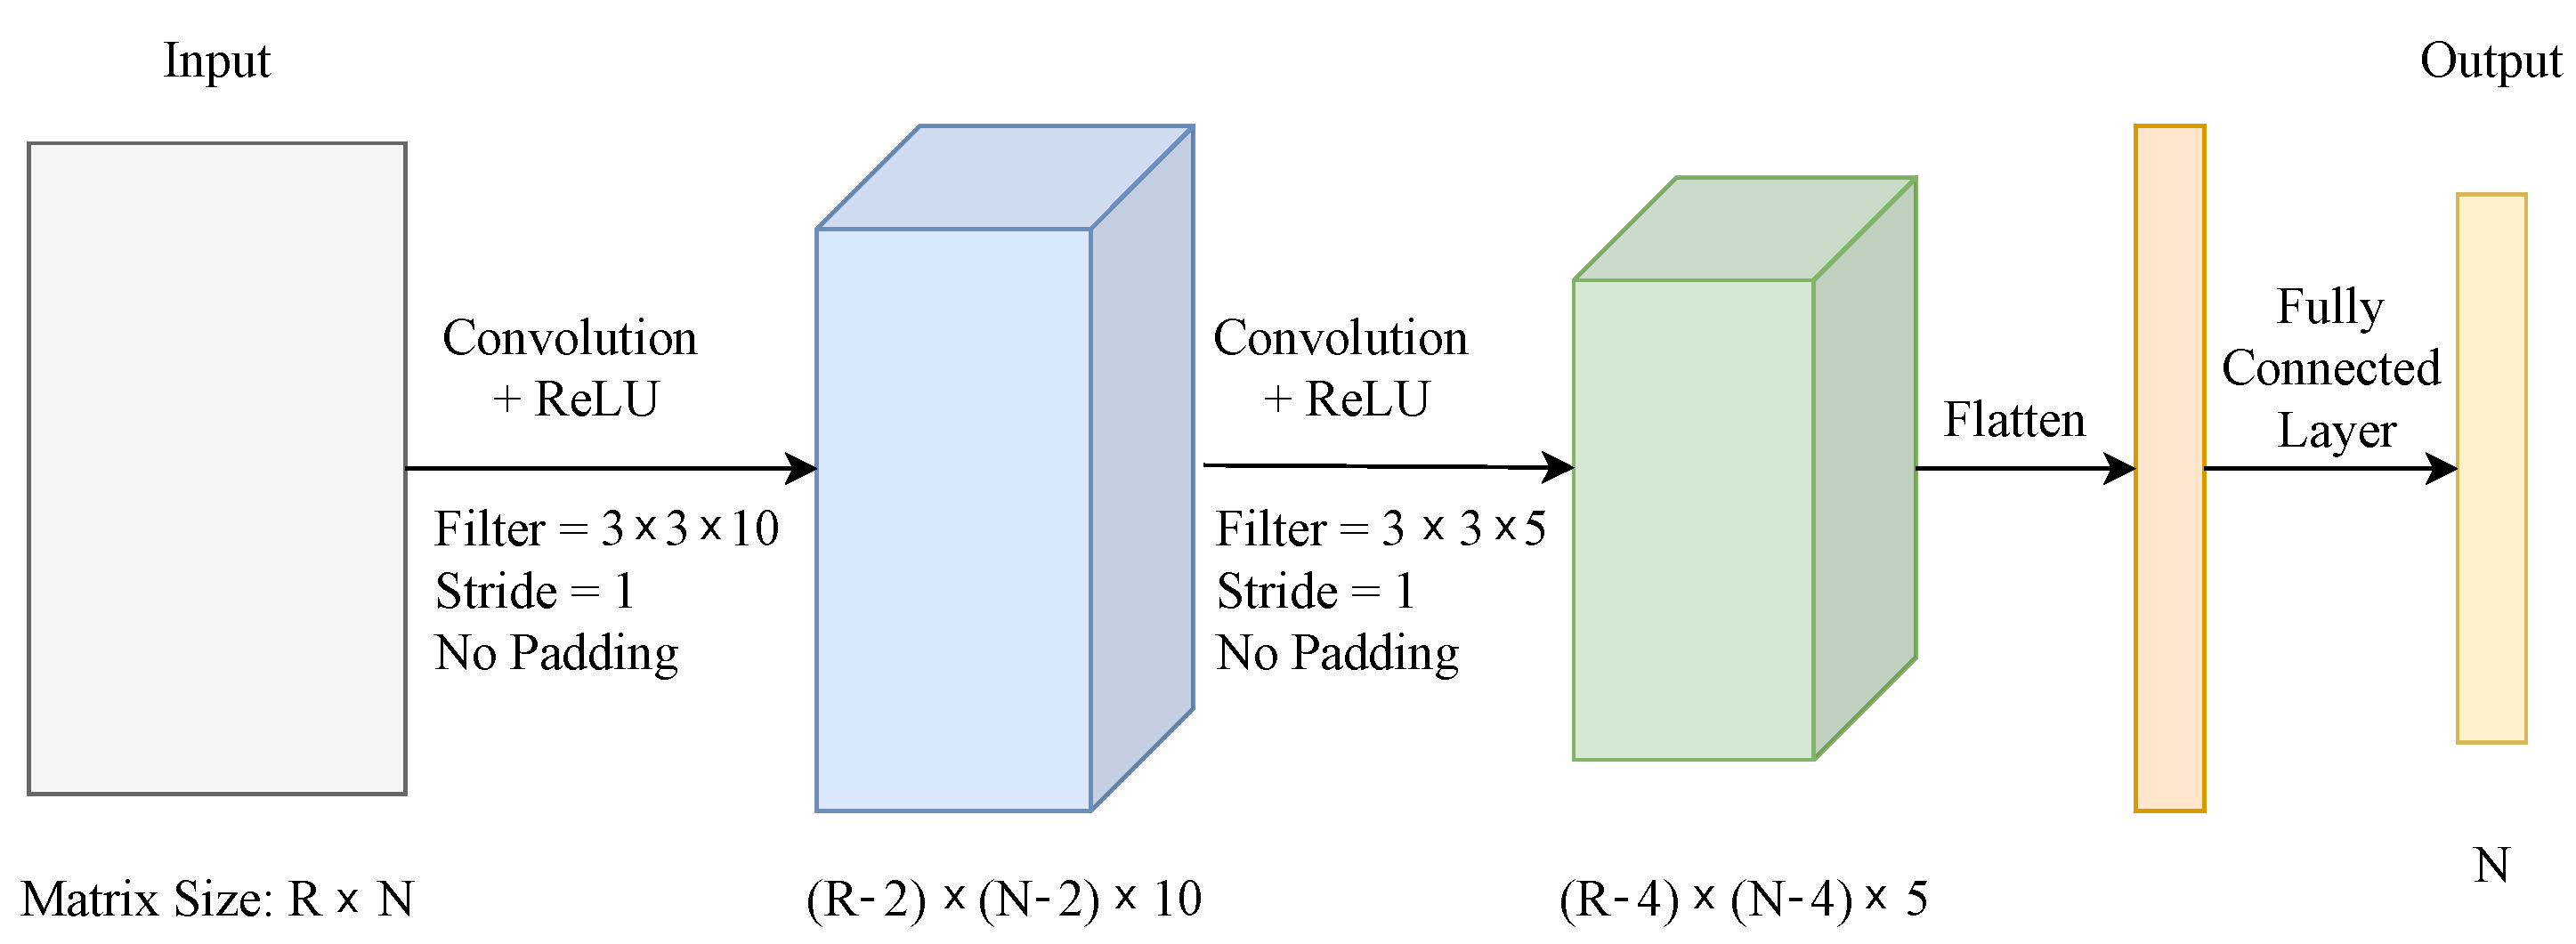
2. Convolutional Neural Networks are bio-inspired models which have been widely applied for image processing and time series prediction [
39]. For our study, we construct a fully-connected CNN structure, as presented in
Figure 3, which accepts as input the matrix with passenger flows as vector columns. The two-dimensional input is passed through two convolutional layers and two ReLU (rectified linear activation unit) functions, then flattened as a one-dimensional vector to be sent through a fully-connected layer which outputs the final results.
3. Diffusion Convolutional Recurrent Neural Networks are powerful graph-oriented deep learning models [
40] which incorporate both spatial and temporal dependency in the traffic flow. Specifically, a DCRNN captures spatial dependencies using bidirectional random walks on the graph and captures temporal dependencies through an encoder–decoder architecture with scheduled sampling.
Figure 4 presents the diagram of the DCRNN employed in this study, which ingests the passenger flow vectors for all stations, passes them on via an encoder–decoder based on Diffusion Convolutional Recurrent (DCR) layers and ReLU functions, and finally predicts the output.
The performance metrics used to evaluate the models include MAE, RMSE, SMAPE, and
[
43]. The evaluation results under different traffic condition scenarios, including before and during the COVID-19 pandemic, are reported in
Section 5.
4.4. Incident Simulation
In order to understand the delay propagation across the rail network and identify the impacted passengers, the digital twin has a traffic simulation engine built on top of an open source traffic simulation package called SUMO [
44]. The simulation engine simulates incidents occurring in the railway network and outputs the affected trains and passengers along with the accumulated delay during and after the incidents.
5. Case Study
5.1. Sydney Railway Digital Twin
In this research, we have developed a digital twin for the railway network of Sydney, Australia as a case study to demonstrate the system architecture proposed in
Section 4.1. A screenshot of the platform is shown in
Figure 5.
The digital twin consists of 175 stations and 8 train lines, as shown in
Figure 6. There are around 3000 train services per day in a typical weekday over the entire network.
The digital twin includes a passenger flow prediction component which can predict passenger flow in the network. The prediction model is trained using an anonymous cell phone mobility dataset containing information on passenger movement within the railway network. The digital twin also contains a traffic simulation engine for incident simulation. Given an incident in the network, the simulation engine takes the above predicted passenger flow as input and output the affected trains and passengers as well as the delay during and after the incident, as shown in
Figure 7. These results provide useful insights to train management centers, allowing for fast decision making.
5.2. Passenger Flow Prediction Performance
The passenger flow prediction performance was evaluated under different travel scenarios in order to test the robustness of our deep learning model when new incoming data are received. One scenario covered the COVID-19 pandemic scenario, which saw travel restrictions across Sydney’s public transportation system in 2020. In this scenario, we evaluated the model’s passenger prediction performance before and during the COVID-19 pandemic.
Scenario 1—Pre-COVID-19: This scenario used two months of mobility dataset from June to July 2019 with a one-hour frequency. The dataset was divided into two subsets for use in training and testing. The training dataset covered June 2019, while the testing dataset covered July 2019.
Figure 8 showcases the SMAPE results across all models (DCRNN, CNN, LSTM, LR, and SVR) in ascending order for a selection of major stations in the network. It can be observed that the deep learning algorithms achieve better performance than LR and SVR, almost halving the SMAPE error to about
for Central Station. For this reason, the performance metrics of both LR and SVR are excluded from the following results due to their low accuracy. Overall, LSTM outperforms even the other DL models; DCRNN significantly outperforms LSTM, but only for a limited subset of station (for instance, Ashfield reaches a very low SMAPE of
, while Blacktown and Mascot have SMAPE scores between 14–15%).
By analyzing the LSTM performance more closely,
Figure 9 shows the passenger flow prediction and ground truth for four selected major stations. It can be seen that the predictions follow the real data trends very closely, with minor deviations during night time when passenger flows are usually lower in the CBD area. Similarly,
Figure 10 shows the
results (majority above
) to further identify the number of non-performing data points that might affect the results. Of these datapoints, a handful are either over- or under-predicted, while the majority are predicted along the regression line.
To further evaluate the robustness of CNN, LSTM and DCRNN, we trained 300 models for each type. their SMAPE values are illustrated in
Figure 11 by violin plots. A violin plot is a hybrid of a box plot and a kernel density plot, which helps to visualize the distribution of numerical data. The results again indicate that the LSTM is more robust, achieving tighter SMAPE distribution plots (majority below
), while the DCRNN has the largest deviation in its distribution violins, indicating lower overall performance in comparison to the CNN and LSTM along with higher fluctuation from one run to another. For this reason, the results for the subsequent Scenario 2 focus on the better-performing CNN and LSTM models.
Scenario 2—Passenger Prediction During COVID-19: The COVID-19 pandemic saw a significant drop in the number of passengers across the Sydney public transport network, mainly due to travel restrictions and restricted seated capacity. Consequently, this scenario requires higher robustness from the prediction models in order to handle the challenge of data sparsity. We further trained and tested our best-performing DL models (CNN and LSTM) and evaluated their performance using the new incoming datasets from June to July 2020.
Figure 12 showcases the SMAPE results for the CNN and LSTM models across the two training datasets. Overall, the models perform well, with SMAPE errors below
for the ten most important stations during the COVID-19 pandemic.
Figure 13 and
Figure 14 respectively showcase the RMSE and MAE results for both the CNN and LSTM across the two training datasets. To summarize, while slightly better performance is recorded for the period prior to the COVID-19 pandemic when travel patterns were more stable, the DL models still provide good accuracy during the COVID-19 pandemic period, demonstrating that the proposed architecture remains viable under differing circumstances.
6. Conclusions
This paper has presented a pioneering work to develop digital twins for rail transportation. The proposed approach can be used to evaluate the impact of service disruptions on railway networks by integrating digital twin, deep learning, and traffic simulation technologies. We propose a four-layer system architecture containing a passenger flow prediction model powered by deep learning. A case study using a digital twin developed for the Sydney, Australia railway network was conducted, with the results showcasing the advantages of our approach. The proposed framework offers real-time and granular insights that can help rail operation centers to understand and evaluate the impact of service disruptions through a 3D visualization.
A major limitation of our study is that we had only limited data for use in training our prediction model (two months of data for the pre-COVID-19 period and two months of data for the period during the COVID-19 pandemic). The prediction performance could be improved if more data were available.
Future work to improve the proposed rail digital twin framework could include considering other transport modes such as buses that represent alternatives to the disrupted service.
Author Contributions
Conceptualization, Y.O., A.-S.M. and A.E.; methodology, Y.O. and A.-S.M.; software, Y.O. and T.M.; validation, Y.O., A.-S.M., A.E., S.L., T.M. and F.C.; formal analysis, Y.O. and A.-S.M.; investigation, Y.O. and A.-S.M.; data curation, Y.O. and A.E.; writing—original draft preparation, Y.O.; writing—review and editing, A.-S.M.; visualization, Y.O.; supervision, F.C. All authors have read and agreed to the published version of the manuscript.
Funding
This research received no external funding.
Data Availability Statement
The original railway network, timetable, and real-time train movement data presented in this study are openly available from the NSW Transport Open Data Hub (
https://opendata.transport.nsw.gov.au/), accessed on 1 February 2025. The mobile data were obtained from DSpark Australia.
Conflicts of Interest
Author Adrian Ellison was employed by the company DSpark Australia. The remaining authors declare that the research was conducted in the absence of any commercial or financial relationships that could be construed as a potential conflict of interest.
References
- Qi, Q.; Tao, F.; Hu, T.; Anwer, N.; Liu, A.; Wei, Y.; Wang, L.; Nee, A. Enabling technologies and tools for digital twin. J. Manuf. Syst. 2021, 58, 3–21. [Google Scholar] [CrossRef]
- Wu, J.; Yang, Y.; Cheng, X.; Zuo, H.; Cheng, Z. The Development of Digital Twin Technology Review. In Proceedings of the 2020 Chinese Automation Congress (CAC), Shanghai, China, 6–8 November 2020; pp. 4901–4906. [Google Scholar] [CrossRef]
- Thelen, A.; Zhang, X.; Fink, O.; Lu, Y.; Ghosh, S.; Youn, B.D.; Todd, M.D.; Mahadevan, S.; Hu, C.; Hu, Z. A comprehensive review of digital twin—Part 1: Modeling and twinning enabling technologies. Struct. Multidiscip. Optim. 2022, 65, 354. [Google Scholar] [CrossRef]
- Zhang, L.; Liu, J.; Zhuang, C. Digital twin modeling enabled machine tool intelligence: A review. Chin. J. Mech. Eng. 2024, 37, 47. [Google Scholar] [CrossRef]
- Botín-Sanabria, D.M.; Mihaita, A.S.; Peimbert-García, R.E.; Ramírez-Moreno, M.A.; Ramírez-Mendoza, R.A.; Lozoya-Santos, J.d.J. Digital twin technology challenges and applications: A comprehensive review. Remote Sens. 2022, 14, 1335. [Google Scholar] [CrossRef]
- Semeraro, C.; Lezoche, M.; Panetto, H.; Dassisti, M. Digital twin paradigm: A systematic literature review. Comput. Ind. 2021, 130, 103469. [Google Scholar] [CrossRef]
- Glaessgen, E.; Stargel, D. The digital twin paradigm for future NASA and US Air Force vehicles. In Proceedings of the 53rd AIAA/ASME/ASCE/AHS/ASC Structures, Structural Dynamics and Materials Conference 20th AIAA/ASME/AHS Adaptive Structures Conference 14th AIAA, Honolulu, HI, USA, 23–26 April 2012; p. 1818. [Google Scholar]
- Grieves, M. Digital Twin: Manufacturing Excellence Through Virtual Factory Replication. Digital Twin White Paper. 2014. Available online: https://www.3ds.com/fileadmin/PRODUCTS-SERVICES/DELMIA/PDF/Whitepaper/DELMIA-APRISO-Digital-Twin-Whitepaper.pdf (accessed on 1 February 2025).
- Bing, Z.; Enyan, M.; Amu-Darko, J.N.O.; Issaka, E.; Hongyu, L.; Junsen, R.; Xinxing, Z. Digital twin on concepts, enabling technologies, and applications. J. Braz. Soc. Mech. Sci. Eng. 2024, 46, 420. [Google Scholar] [CrossRef]
- Exans, S.; Savian, C.; Burns, A.; Cooper, C. Digital Twins for the Build Environment, an Introduction to the Opportunities, Benefits, Challenges and Risks; Report P-24; The Institution of Engineering and Technology: London, UK, 2018. [Google Scholar]
- Systems, D. BEYOND DIGITAL TWIN: Small and Medium-Sized Manufacturers Enjoy Big-Enterprise Benefits and ROI with Virtual Twin Experience on the Cloud; Report P-18; Dassault: Vélizy-Villacoublay, France, 2021. [Google Scholar]
- Anylogic. Alstom Develops a Rail Network Digital Twin for Railway Yard Design and Predictive Fleet Maintenance. Available online: https://www.anylogic.com/resources/case-studies/digital-twin-of-rail-network-for-train-fleet-maintenance-decision-support/ (accessed on 1 February 2025).
- Song, Q.; Chen, X.; Chen, Y. Prediction of Short-Term Passenger Flow of Urban Rail Transit Based on Digital Twin Technology. In Proceedings of the International Conference on Traffic and Transportation Studies; Springer: Berlin/Heidelberg, Germany, 2024; pp. 34–42. [Google Scholar]
- Guo, J.; Xie, Z.; Qin, Y.; Jia, L.; Wang, Y. Short-Term Abnormal Passenger Flow Prediction Based on the Fusion of SVR and LSTM. IEEE Access 2019, 7, 42946–42955. [Google Scholar] [CrossRef]
- Zhao, Y.; Ma, Z.; Yang, Y.; Jiang, W.; Jiang, X. Short-Term Passenger Flow Prediction With Decomposition in Urban Railway Systems. IEEE Access 2020, 8, 107876–107886. [Google Scholar] [CrossRef]
- Liu, L.; Chen, R.C. A novel passenger flow prediction model using deep learning methods. Transp. Res. Part C Emerg. Technol. 2017, 84, 74–91. [Google Scholar] [CrossRef]
- Nagaraj, N.; Gururaj, H.L.; Swathi, B.H.; Hu, Y.C. Passenger flow prediction in bus transportation system using deep learning. Multimed. Tools Appl. 2022, 81, 12519–12542. [Google Scholar] [CrossRef]
- Ke, J.; Zheng, H.; Yang, H.; Chen, X.M. Short-Term Forecasting of Passenger Demand under On-Demand Ride Services: A Spatio-Temporal Deep Learning Approach. arXiv 2017, arXiv:1706.06279. [Google Scholar] [CrossRef]
- Williams, B.; Hoel, L. Modeling and Forecasting Vehicular Traffic Flow as a Seasonal ARIMA Process: Theoretical Basis and Empirical Results. J. Transp. Eng. 2003, 129, 664–672. [Google Scholar] [CrossRef]
- Ding, C.; Duan, J.; Zhang, Y.; Wu, X.; Yu, G. Using an ARIMA-GARCH Modeling Approach to Improve Subway Short-Term Ridership Forecasting Accounting for Dynamic Volatility. IEEE Trans. Intell. Transp. Syst. 2018, 19, 1054–1064. [Google Scholar] [CrossRef]
- Gu, Y.; Lu, W.; Xu, X.; Shao, Z.; Zhang, H. An Improved Bayesian Combination Model for Short-Term Traffic Prediction With Deep Learning. IEEE Trans. Intell. Transp. Syst. 2019, 21, 1332–1342. [Google Scholar] [CrossRef]
- Mihaita, A.S.; Papachatgis, Z.; Rizoiu, M.A. Graph modelling approaches for motorway traffic flow prediction. In Proceedings of the 2020 IEEE 23rd International Conference on Intelligent Transportation Systems (ITSC), Rhodes, Greece, 20–23 September 2020; pp. 1–8. [Google Scholar]
- Mihaita, A.S.; Li, H.W.; He, Z.; Rizoiu, M.A. Motorway Traffic Flow Prediction using Advanced Deep Learning. In Proceedings of the 2019 IEEE Intelligent Transportation Systems Conference (ITSC), Auckland, New Zealand, 27–30 October 2019; pp. 1683–1690. [Google Scholar]
- Liu, Q.; Shang, Z.; Lu, S.; Liu, Y.; Liu, Y.; Yu, S. Physics-guided TL-LSTM network for early-stage degradation trajectory prediction of lithium-ion batteries. J. Energy Storage 2025, 106, 114736. [Google Scholar] [CrossRef]
- Zeng, A.; Chen, M.; Zhang, L.; Xu, Q. Are transformers effective for time series forecasting? In Proceedings of the AAAI Conference on Artificial Intelligence, Washington, DC, USA, 7–14 February 2023; Volume 37, pp. 11121–11128. [Google Scholar] [CrossRef]
- Wen, Q.; Zhou, T.; Zhang, C.; Chen, W.; Ma, Z.; Yan, J.; Sun, L. Transformers in time series: A survey. In Proceedings of the Thirty-Second International Joint Conference on Artificial Intelligence, IJCAI ’23, Macao, China, 19–25 August 2023. [Google Scholar] [CrossRef]
- Wang, C.; Wang, Z.; Dong, H.; Lauria, S.; Liu, W.; Wang, Y.; Fadzil, F.; Liu, X. Fusionformer: A novel adversarial transformer utilizing fusion attention for multivariate anomaly detection. IEEE Trans. Neural Netw. Learn. Syst. 2025. Early Access. [Google Scholar] [CrossRef]
- Wei, Z.; Shan, X. Research on forecast method of railway passenger flow demand in pre-sale period. IOP Conf. Ser. Mater. Sci. Eng. 2019, 563, 052080. [Google Scholar] [CrossRef]
- Li, W.; Sui, L.; Zhou, M.; Dong, H. Short-term passenger flow forecast for urban rail transit based on multi-source data. EURASIP J. Wirel. Commun. Netw. 2021, 2021, 1499–1687. [Google Scholar] [CrossRef]
- Ou, Y.; Mihaita, A.S.; Chen, F. Dynamic Train Demand Estimation and Passenger Assignment. In Proceedings of the 2020 IEEE 23rd International Conference on Intelligent Transportation Systems (ITSC), Rhodes, Greece, 20–23 September 2020; pp. 1–6. [Google Scholar] [CrossRef]
- Ou, Y.; Mihaita, A.; Chen, F. Big Data Processing and Analysis on the Impact of COVID-19 on Public Transport Delay. In Data Science for COVID-19; Kose, J., Gupta, D., de Albuquerque, V.H.C., Khanna, A., Eds.; Elsevier: Oxford, UK, 2021. [Google Scholar]
- Shafiei, S.; Mihaita, A.; Nguyen, H.; Bentley, C.D.B.; Cai, C. Short-Term Traffic Prediction under Non-Recurrent Incident Conditions Integrating Data-Driven Models and Traffic Simulation. In Proceedings of the Transportation Research Board 99th Annual Meeting, Washington, DC, USA, 12–16 January 2020; Available online: https://opus.lib.uts.edu.au/handle/10453/138721 (accessed on 1 February 2025).
- Shafiei, S.; Mihăiţă, A.S.; Nguyen, H.; Cai, C. Integrating data-driven and simulation models to predict traffic state affected by road incidents. Transp. Lett. 2021, 14, 629–639. [Google Scholar] [CrossRef]
- Wen, T.; Mihăiţă, A.S.; Nguyen, H.; Cai, C.; Chen, F. Integrated Incident Decision-Support using Traffic Simulation and Data-Driven Models. Transp. Res. Rec. 2018, 2672, 247–256. [Google Scholar] [CrossRef]
- Shaffiei, S.M.A.; Cai, C. Demand Estimation and Prediction for Short-term Traffic Forecasting in Existence of Non-recurrent Incidents. In Proceedings of the ITS World Congress 2019 (ITSWC2019), Singapore, 21–25 October 2019; Available online: http://hdl.handle.net/10453/138724 (accessed on 1 February 2025).
- Mao, T.; Mihăită, A.S.; Chen, F.; Vu, H.L. Boosted Genetic Algorithm Using Machine Learning for Traffic Control Optimization. IEEE Trans. Intell. Transp. Syst. 2021, 23, 7112–7141. [Google Scholar] [CrossRef]
- Mihaita, A.S.; Liu, Z.; Cai, C.; Rizoiu, M.A. Arterial incident duration prediction using a bi-level framework of extreme gradient-tree boosting. arXiv 2019, arXiv:1905.12254. [Google Scholar]
- Kumar, N.; Raubal, M. Applications of deep learning in congestion detection, prediction and alleviation: A survey. Transp. Res. Part C Emerg. Technol. 2021, 133, 103432. [Google Scholar] [CrossRef]
- Zhang, J.; Zheng, Y.; Qi, D. Deep Spatio-Temporal Residual Networks for Citywide Crowd Flows Prediction. In Proceedings of the AAAI Conference on Artificial Intelligence, San Francisco, CA, USA, 4–9 February 2017. [Google Scholar]
- Li, Y.; Yu, R.; Shahabi, C.; Liu, Y. Diffusion Convolutional Recurrent Neural Network: Data-Driven Traffic Forecasting. arXiv 2018, arXiv:1707.01926. [Google Scholar]
- Ottaviani, F.M.; Marco, A.D. Multiple Linear Regression Model for Improved Project Cost Forecasting. Procedia Comput. Sci. 2022, 196, 808–815. [Google Scholar] [CrossRef]
- Pisner, D.A.; Schnyer, D.M. Chapter 6—Support vector machine. In Machine Learning; Mechelli, A., Vieira, S., Eds.; Academic Press: Cambridge, MA, USA, 2020; pp. 101–121. [Google Scholar] [CrossRef]
- Vandeput, N. Forecast KPIs: RMSE, MAE, MAPE and Bias. 2019. Available online: https://www.linkedin.com/pulse/forecast-kpi-rmse-mae-mape-bias-nicolas-vandeput (accessed on 1 February 2025).
- SUMO. Simulation of Urban MObility. 2022. Available online: https://eclipse.dev/sumo/ (accessed on 1 February 2025).
| Disclaimer/Publisher’s Note: The statements, opinions and data contained in all publications are solely those of the individual author(s) and contributor(s) and not of MDPI and/or the editor(s). MDPI and/or the editor(s) disclaim responsibility for any injury to people or property resulting from any ideas, methods, instructions or products referred to in the content. |
© 2025 by the authors. Licensee MDPI, Basel, Switzerland. This article is an open access article distributed under the terms and conditions of the Creative Commons Attribution (CC BY) license (https://creativecommons.org/licenses/by/4.0/).


 ,
, 


