Article

Recognition of Dense Goods with Cross-Layer Feature Fusion Based on Multi-Scale Dynamic Interaction

1
School of Electronic Information and Electrical Engineering, Yangtze University, Jingzhou 434023, China
2
School of Computer Science, Yangtze University, Jingzhou 434023, China
3
School of Computer Science, Central South University, Changsha 410083, China
4
School of Electronic Information, Central South University, Changsha 410004, China
*
Author to whom correspondence should be addressed.
These authors contributed equally to this work.
Electronics 2025, 14(11), 2303; https://doi.org/10.3390/electronics14112303
Submission received: 23 April 2025 / Revised: 27 May 2025 / Accepted: 4 June 2025 / Published: 5 June 2025
(This article belongs to the Special Issue Deep Learning-Based Object Detection/Classification)

Abstract

:
To enhance the accuracy of product recognition in non-store retail sales and address misidentification and missed detection caused by occlusion in densely placed goods, we propose an improved YOLOv8-based network: Dense-YOLO. We first introduce an enhanced multi-scale feature extraction module (EMFE) in the feature extraction layer and employ a lightweight feature fusion strategy (LFF) in the feature fusion layer to improve the network’s performance. Next, to enhance the performance of dense product recognition, particularly when handling small and multi-scale objects in complex settings, we propose a novel multi-scale dynamic interaction attention mechanism (MDIAM). This mechanism combines dynamic channel weight adjustment and multi-scale spatial convolution to emphasize crucial features, while avoiding overfitting and enhancing model generalization. Finally, a cross-layer feature interaction mechanism is introduced to strengthen the interaction between low- and high-level features, further improving the model’s expressive power. Using the public COCO128 dataset and over 2000 daily smart retail cabinet product images compiled in our laboratory, we created a dataset covering 50 product categories for ablation and comparison experiments. The experimental results indicate that the accuracy under MDIAM is improved by 1.6% compared to other top-performing models. The proposed algorithm achieves an mAP of 94.9%, which is a 1.0% improvement over the original model. The enhanced algorithm not only significantly improves the recognition accuracy of individual commodities but also effectively addresses the issues of misdetection and missed detection when multiple commodities are recognized simultaneously.

1. Introduction

With the rapid advancement of Internet of Things (IoT) and artificial intelligence (AI) technologies, product recognition methods have found widespread applications in the retail industry. Product recognition can be employed in unmanned convenience stores to automatically identify items purchased by customers, providing self-checkout services. Compared to traditional retail, this new retail model offers higher levels of automation, lower costs, more efficient services, and an enhanced user experience. As machine vision continues to evolve, product identification has become increasingly refined. Using imaging technology for product recognition can enhance automation, reduce costs, and improve operational efficiency.
In recent years, the advancement of computational power and the proliferation of large-scale datasets have led to the widespread adoption of deep learning-based object detection algorithms [1] in product recognition. These algorithms can be primarily categorized into two types: two-stage detection algorithms, such as the CNN series [2,3,4,5], and single-stage detection algorithms, including SSD [6] and the YOLO series [7]. While two-stage detection algorithms achieve high detection accuracy, their detection speed lags behind that of single-stage algorithms. Single-stage algorithms, by contrast, offer superior frames per second (FPS), providing high performance in terms of both speed and accuracy, making them more suitable for product recognition [8]. Building on this foundation, Sun et al. proposed PG-DCDAN [9], which enhances cross-domain generalization through dual classifiers and pseudo-label guidance. However, its optimization remains insufficient in addressing the misdetection and missed detection of densely packed objects. Similarly, Zhao et al. [10] proposed a fuzzy broad neural evolutionary network based on a multi-objective evolutionary algorithm, aiming to optimize both the architecture and performance of the network. However, the model demonstrates limitations in effectively capturing features of densely packed small objects. In another study, Chen et al. [11] developed a dual-scale complementary spatial–spectral joint model, which enhances the representational capacity for hyperspectral image classification through multi-scale fusion. Nevertheless, their approach falls short in addressing critical challenges in dense product recognition, such as bounding box overlap and complex background interference. The YOLOv7 object detection algorithm proposed by Wang et al. [12] introduced group convolutions to increase the cardinality of added features, enabling it to capture richer feature information while maintaining efficient real-time detection, thus enhancing detection performance. YOLOv8 [13] built upon this by incorporating an improved version of CSPDarknet53 [14] as the backbone network, enhancing feature extraction efficiency, and introducing the RepVGG module [15] to optimize both computation and performance. While versions from YOLOv9 to YOLOv11 [16,17,18] have been released, these models are often too complex and lack practical validation, exhibiting issues such as slower inference speed and unstable bounding box localization in dense product recognition scenarios. YOLOv8, being more lightweight, incorporates a mature attention mechanism and automatic architecture optimization, delivering better recognition performance in complex environments. Recent advances in small and densely packed object detection suggest that current methodologies remain inadequate for tackling the challenges posed by complex visual scenes. To enhance detection performance under such conditions, researchers have explored a variety of strategies aimed at optimizing multi-scale feature extraction, feature fusion, and attention mechanisms. Architectures such as FPN [19], PANet [20], and BiFPN [21] have improved the representational capacity for small objects by constructing top–down and bottom–up feature pathways. Fusion strategies like ASFF [22] and NAS-FPN [23] have achieved notable gains in the efficiency of information integration. Moreover, attention mechanisms such as CBAM [24] and SE [25] have strengthened the model’s ability to focus on salient object regions. Nonetheless, several critical challenges remain unresolved:
  • In densely populated product scenarios, feature extraction modules often exhibit limited scale adaptability to small objects, resulting in feature information loss or redundancy. Furthermore, existing fusion strategies such as ASFF and NAS-FPN, while effective in aggregating multi-scale information, incur high computational costs when handling high-density targets. This trade-off between real-time performance and accuracy exacerbates the risk of false positives and missed detections.
  • Current attention mechanisms, such as CBAM and SE, exhibit limited sensitivity to small-object regions in densely populated scenes, lacking dynamic scale interaction and adaptive feature reweighting. As a result, they struggle to effectively enhance the representation of target areas. Concurrently, conventional loss functions such as IoU are insufficient for optimizing localization accuracy in high-density small-object scenarios, particularly under conditions of significant occlusion or background clutter. These limitations impair both the convergence stability and the precision of object localization in complex detection environments.
To address the aforementioned challenges, this study proposes a systematic enhancement of YOLOv8 under the paradigm of collaborative optimization. First, we introduce Dense-YOLO, a novel architecture that constructs a unified, high-resolution, multi-scale feature foundation through the synergistic integration of an enhanced multi-scale feature extraction (EMFE) module and a lightweight feature fusion strategy (LFF) in the frontend. This design simultaneously captures fine-grained details while suppressing redundant computations. In the intermediate layers, a multi-scale dynamic interaction attention mechanism (MDIAM) directly leverages the enriched features, employing dynamic weighting and cross-scale interactions to emphasize confusing regions, thereby improving semantic separation of small and overlapping objects. At the backend, an Adaptive Weighted IoU loss function (AWIoU) incorporates saliency cues from MDIAM into the localization objective, adaptively magnifying critical localization errors in dense regions while suppressing less consequential deviations. Together, these four modules form a cohesive, end-to-end optimization pipeline linking the following: feature representation → attention focusing → regression refinement. This pipeline effectively targets the core challenges of false positives, missed detections, and real-time constraints. The proposed method demonstrates robust performance in real-world retail scenarios, achieving precise and efficient recognition of high-density, multi-scale products.
Section 2 provides a comprehensive overview of the algorithm, presenting the overall flowchart and explaining the underlying theory behind each component. Section 3 details the experimental data and model configuration, further validating the effectiveness of our method through comparative experiments. Finally, Section 4 summarizes the findings of this study and offers insights into potential future research directions.

2. Methodology

The algorithmic process of this study can be divided into three parts: Part A involves feature extraction through the enhanced multi-scale feature extraction module, followed by the application of a lightweight feature fusion strategy. Part B combines dynamic channel attention mechanisms, multi-scale spatial attention mechanisms, and multi-level feature interactions to enhance the features. Part C applies the AWIoU loss function for dynamic weight adjustment and local density correction of the target bounding boxes. The algorithmic flow is illustrated in Figure 1.

2.1. Dense-YOLO Feature Extraction Network

This study improves upon the Darknet53 network [26], as it offers a favorable balance between speed and accuracy, making it more suitable for practical applications. Its residual structure effectively alleviates the gradient vanishing problem in deep networks, ensuring more stable feature extraction. Compared to other networks, Darknet53 demonstrates stronger robustness for small-object detection and complex backgrounds, aligning well with the needs of dense product recognition. However, in addressing challenges such as small-object detection, poor adaptation to complex backgrounds, and high memory consumption in dense product recognition, Darknet53 shows limitations in multi-scale feature extraction and feature fusion. Additionally, its heavy reliance on large datasets and parameter tuning increases the risk of overfitting and poor environmental adaptability. To overcome these issues, we introduce the EMFE and LFF modules, enhancing the network’s ability to perceive small objects, reducing computational complexity and overfitting risks, and improving robustness and deployment adaptability in complex environments, thus addressing the limitations of the original model in dense scenes.

2.1.1. Enhanced Multi-Scale Feature Extraction Module (EMFE)

The EMFE module addresses the limitations of Darknet53 in handling objects at different scales by adding pooling layers of varying sizes after the output of each residual block to capture multi-scale information. This multi-path pooling strategy enables the network to extract more detailed feature representations of small objects. The feature extraction process is represented as follows:
F e m f e = i = 1 N P o o l i ( F r e s ) F r e s
Here, F e m f e denotes the feature map extracted via the EMFE module, while P o o l i represents pooling operations at different scales—specifically, a weighted combination of max pooling (MaxPool) and average pooling (AvgPool) with a ratio of 0.6:0.4, assigning greater emphasis to MaxPool. N denotes the number of pooling operations; in this study, N = 3, corresponding to pooling kernel sizes of 2 × 2, 4 × 4, and 8 × 8. F r e s refers to the output of the residual block. The symbol ⊕ denotes channel-wise feature concatenation. Given an input tensor with the shape [B, C, H, W]—where B is the batch size, C is the number of channels, and H and W represent the height and width, respectively—N pooled feature maps are generated. These are concatenated along the channel dimension, resulting in an output tensor of the shape [B, N·C, H, W]. The spatial resolution of each feature map is governed by the corresponding pooling kernel size. A subsequent 1 × 1 convolution layer is applied for dimensionality reduction, restoring the final output feature map to C channels.
This improvement not only enhances the network’s ability to perceive small objects but also reduces its dependence on large datasets and fine-tuned parameters, effectively mitigating the issue of model overfitting.
To visually demonstrate the workflow of the EMFE module, panel a of Figure 1 illustrates the process of multi-scale pooling and feature concatenation. After the pooling layers capture features at different scales, the concatenation operation forms enhanced features, which are then reduced in dimensionality through a 1 × 1 convolutional layer, generating a more concise and informative feature representation.

2.1.2. Lightweight Feature Fusion Strategy (LFF)

In the feature fusion layer, Dense-YOLO employs the lightweight feature fusion strategy (LFF) to reduce the network’s computational complexity and enhance the efficiency of feature fusion. The LFF module replaces traditional convolution operations with depthwise separable convolutions, significantly reducing both the number of parameters and the computational load. The fusion process is represented as follows:
F l f f = C o n v 1 × 1 j = 1 M D W C o n v j ( F s c a l e )
Here, F l f f denotes the feature map fused by the LFF module, while D W C o n v j refers to the depthwise separable convolution operation, which comprises a depthwise convolution using a 3 × 3 kernel with stride 1, followed by a pointwise convolution with a 1 × 1 kernel. F s c a l e represents feature maps at different spatial scales, and M denotes the number of input multi-scale feature maps; in this study, M = 3, corresponding to small, medium, and large scale representations. The symbol ⊕ indicates concatenation along the channel dimension. Each input F s c a l e tensor has a shape of [B, C j , H j , W j ], where B is the batch size, and C j , H j , and W j denote the number of channels, height, and width of the j-th scale feature map, respectively. Given the variation in spatial resolutions across scales, all F s c a l e tensors are first resampled—via upsampling or downsampling—to a unified resolution of [H, W] prior to the depthwise separable convolution. The adjusted tensor shape becomes [B, C j , H, W]. Following convolution, the number of channels remains unchanged, and the resulting feature maps are concatenated, yielding a tensor of the shape [B, j = 1 M c j , H, W]. A subsequent 1 × 1 convolution layer ( C o n v 1 × 1 ) is applied for dimensionality reduction and feature compression, followed by a fully connected layer to project the feature map to a fixed output channel dimension C o u t . In this study, C o u t is set to 256 to balance model complexity with representational capacity. The final output tensor thus has the shape [B, C o u t , H, W].
This lightweight design not only reduces memory consumption, making Dense-YOLO more suitable for deployment in resource-constrained systems, but also simplifies parameter tuning, enhancing the model’s reproducibility and practicality.
Part a of Figure 1 illustrates the detailed structure of the LFF module. From the input multi-scale feature maps to depthwise separable convolutions, followed by concatenation and compression through fully connected layers, the LFF module achieves efficient feature fusion through a multi-step optimization process.

2.2. Feature Enhancement Based on MDIAM

To address the challenges of small-object feature neglect and poor model performance in complex backgrounds and multi-scale object scenarios in dense product recognition, we propose a novel attention mechanism—Multi-scale Dynamic Interactive Attention Mechanism (MDIAM). This mechanism combines dynamic channel weight adjustment, multi-scale spatial convolutions, and multi-level feature interactions to enhance the focus on important features, while preventing overfitting and improving the model’s generalization ability. The MDIAM model consists of three components: (1) dynamic channel attention mechanism; (2) multi-scale spatial attention mechanism; and (3) multi-level feature interaction mechanism. Part b of Figure 1 illustrates the overall process of the MDIAM module.
In the traditional CBAM, channel weights are statically computed through global average pooling and maximum pooling. However, this approach lacks dynamism and fails to fully adapt to the variations across different scenarios in dense product recognition. To address this, MDIAM introduces a dynamic channel attention mechanism that combines the feature representations from global average pooling and maximum pooling while dynamically adjusting the weight of each channel. Specifically, for the input feature map X R C × H × W , the calculation of the dynamic channel attention is as follows:
M c = σ W 1 · ( AvgPool ( X ) ) + W 2 · ( MaxPool ( X ) )
Here, M c denotes the channel attention weights, represented as a tensor of the shape [B, C, 1, 1], which are used to adaptively reweight each channel of the input feature map. The input feature map X has a shape of [B, C, H, W], where B is the batch size, C is the number of channels (set to 512 in this study, corresponding to the output dimension of Darknet-53), and H and W are the spatial height and width, respectively. The symbol σ denotes the sigmoid activation function, which normalizes attention weights to the range [0, 1]. To extract global contextual information, both global average pooling (AvgPool) and global max pooling (MaxPool) operations are applied to X across its spatial dimensions, resulting in pooled descriptors of the shape [B, C, 1, 1]. These tensors, AvgPool(X) and MaxPool(X), capture complementary statistics of each channel. Two learnable weight matrices, W 1 and W 2 , each of the shape [C, C], are used to model inter-channel dependencies. These matrices perform linear transformations on the pooled features via matrix multiplication (·), preserving the tensor shape as [B, C, 1, 1]. The transformed outputs from both pooling pathways are then summed and passed through the sigmoid function to produce the final channel attention weights M c .
To address the challenge of multi-scale object feature extraction in dense product recognition, MDIAM introduces the Multi-scale Spatial Attention Mechanism. This mechanism combines convolutional kernels of different scales (e.g., 3 × 3, 5 × 5, and 7 × 7) to simultaneously capture spatial features of objects at multiple scales, thereby enhancing the model’s ability to recognize objects of varying sizes. This approach enables the model to effectively distinguish and focus on key features in dense scenes, addressing misidentifications and missed detections in dense product recognition, particularly in scenarios where objects exhibit significant size differences. Specifically, the calculation process for spatial attention is as follows:
M s = σ Concat f 3 × 3 ( X ) , f 5 × 5 ( X ) , f 7 × 7 ( X )
The spatial attention map, denoted as M s , is a tensor of the shape [B, 1, H, W] that encodes the importance of different spatial locations in the input feature map. The input feature map X has a shape of [B, C, H, W], where B, C, H, and W denote the batch size, number of channels, height, and width, respectively, consistent with the channel attention module. To capture spatial dependencies at multiple receptive field sizes, three convolutional operations with different kernel sizes— f 3 × 3 , f 5 × 5 , and f 7 × 7 —are applied in parallel to the input X. Each convolution projects the input from C channels to a single-channel feature map, yielding outputs of the shape [B, 1, H, W]. The results of these convolutions, f 3 × 3 ( X ) , f 5 × 5 ( X ) , and f 7 × 7 ( X ) , are then concatenated along the channel dimension to form a combined tensor of the shape [B, 3, H, W]. This concatenated tensor is passed through a sigmoid activation function σ , which produces the final spatial attention weights M s . By aggregating information across multiple kernel sizes, this mechanism enables the model to more effectively capture features at different spatial scales, thereby enhancing its ability to recognize objects of varying sizes.
MDIAM introduces a multi-level feature interaction mechanism between the channel attention and spatial attention modules, aiming to enhance the interplay between low-level and high-level features and thereby improve the model’s representational capacity. Low-level features primarily capture fine-grained details, while high-level features encode global contextual information; thus, their effective fusion can significantly boost model performance. To address the spatial resolution and semantic representation discrepancies between low-level features X l and high-level features X h , we incorporate a feature alignment strategy into the cross-layer interaction. Specifically, we first employ upsampling via bilinear interpolation to adjust the spatial resolution of X h to match that of X l . Subsequently, a 1 × 1 convolution is applied to map both feature sets into a shared semantic space, followed by feature concatenation and weighted fusion. The computation process of cross-layer feature interaction is as follows:
M C R O S S = σ ( W 3 · Concat ( Conv 1 × 1 ( X l ) , Conv 1 × 1 ( Upsample ( X h ) ) ) )
The tensor M C R O S S represents the cross-level attention weights and has the shape [B, C o u t , H l , W l ]. Two sources of features are involved: the low-level feature map X l R [ B , C l , H l , W l ] and the high-level feature map X h R [ B , C h , H h , W h ] . The high-level features are first upsampled to the spatial resolution of the low-level features, yielding [ H l , W l ]. A 1 × 1 convolution ( Conv 1 × 1 ) is then applied to both branches to achieve semantic alignment and to standardize the channel dimensionality at C o u t = 256, a choice that balances computational cost with representational capacity. The aligned feature maps are concatenated along the channel axis, producing a tensor of the shape [B, 2· C o u t , H l , W l ]. To fuse the concatenated representation, a learnable weight matrix X 3 R [ C out , 2 · C out ] performs a linear transformation via matrix multiplication (·), reducing the channel dimension back to C o u t and yielding a tensor of the shape [B, C o u t , H l , W l ]. Finally, a sigmoid activation σ is applied to normalize the values to the range [0, 1], producing the cross-level attention map M C R O S S . By employing the feature alignment strategy, MDIAM effectively harmonizes the semantic and spatial information of low-level and high-level features, thereby enhancing the efficacy of cross-layer feature interaction. This, in turn, strengthens the model’s capability to recognize multi-scale objects in densely packed commodity scenes. The workflow of the multi-level feature interaction mechanism’s submodules is illustrated in Figure 2.

2.3. Loss Function

To address the issues of misidentifications and missed detections caused by objects being too close or overlapping in dense product recognition, we propose the Adaptive Wise-IoU (AWIoU) loss function. This algorithm combines an adaptive dynamic weighting mechanism with a local density adjustment strategy. It dynamically adjusts the loss value based on the object’s density and bounding box quality, while also incorporating a boundary box position offset correction term to reduce errors during the regression process. The goal is to improve the model’s accuracy in detecting high-density small objects and optimize detection performance in dense product recognition scenarios. Compared to existing loss functions such as CIoU [27], EIoU [28], and Wise-IoU [29], AWIoU significantly enhances recognition accuracy in complex environments, particularly in high-density and high-dynamic scenarios, through its adaptive dynamic adjustment mechanism and density optimization. Compared to CIoU, AWIoU demonstrates a significantly improved sensitivity to small objects; compared to Wise-IoU, it is more suitable for dense scenarios, effectively reducing missed and false detections. Although AWIoU introduces additional computational complexity, it results in a substantial performance improvement, particularly exhibiting strong advantages in high-density product recognition.
To address the issue of error accumulation during bounding box regression, we introduce the position offset correction term L l o c :
L l o c = d 2 c 2 · 1 exp | x x g t | + | y y g t | w g t + h g t
Here, d represents the Euclidean distance between the predicted and ground truth bounding box centers. c denotes the diagonal length of the minimal enclosing box. x , y and x g t , y g t are the coordinates of the predicted and ground truth center points, respectively. w g t and h g t are the width and height of the ground truth box. Correcting the center point offset of the bounding box effectively reduces the accumulation of errors during the bounding box regression process.
To improve the recognition of dense small objects, we introduce the local density loss term L d e n s :
L d e n s = log 1 + N d e n s e N t o t a l · 1 1 + e κ ( I o U τ )
Here, N d e n s e represents the number of dense objects within the current local region, while N t o t a l denotes the total number of objects. K is a smoothing parameter that controls the dynamic adjustment range of the IoU. τ is the IoU threshold used to distinguish between high-quality and low-quality bounding boxes. The loss value is dynamically adjusted, making the model more sensitive to small objects in highly dense regions, thereby reducing missed detections. The loss value for low-quality bounding boxes is appropriately suppressed to reduce false detections.
The core formula of Adaptive Wise-IoU (AWIoU) is as follows:
L A W I o U = α · L I o U + β · L l o c + γ · L d e n s
Here, L I o U denotes the traditional Intersection over Union (IoU) loss term, which measures the overlap between the predicted bounding box and the ground truth box. It is defined as L IoU = 1 IoU ; L l o c is the bounding box position offset correction term, aimed at correcting biases during the regression process; and L d e n s is the local density loss term, which dynamically adjusts the loss value in dense regions. α , β , and γ are weight parameters, whose specific values are dynamically determined based on the object’s density and bounding box quality.
The formula for dynamic weight calculation is as follows:
α = 1 1 + e λ ( I o U 0.5 ) β = d c γ = log 1 + N d e n s e N t o t a l
Here, λ is a tuning parameter that governs the rate at which the weighting factor α varies; in this study, it is set to 5 on the basis of empirical optimization, ensuring that α remains sensitive to changes in IoU without becoming excessively steep. Because I o U [ 0 , 1 ] , the resulting α ( 0 , 1 ] . Thus, as IoU approaches 1, α tends towards 1, increasing the contribution of L I o U ; when IoU drops below 0.5, α approaches 0, thereby diminishing the influence of L I o U . The term β = d c [ 0 , 1 ] (with d and c defined as in Lloc) captures the geometric deviation between the predicted and ground truth boxes: larger deviations yield a higher weight for L l o c . Finally, N d e n s e and N t o t a l represent the local density parameters used elsewhere in the loss formulation.

3. Experiment Results and Analysis

3.1. Experimental Platform

The experimental platform used in this study is as follows: operating system: Windows 11; graphics card: NVIDIA GeForce RTX 4060 Ti (NVIDIA Corporation, Santa Clara, CA, USA); and processor: Intel(R) Core(TM) i7-12650H (Intel Corporation, Santa Clara, CA, USA). The network model was built using the PyTorch v1.12.1 deep learning framework and Python v3.8.13.

3.2. Dataset Introduction

The experimental data used in this study were derived from the publicly available COCO128 dataset, released by the Ultralytics team in 2020, as well as more than 2000 images of daily smart retail cabinet products compiled in our laboratory.
To assess the model’s generalization ability and enhance the reliability of the results, we utilized the public COCO128 dataset, which includes 80 object categories, such as people, cars, and animals. The image size is 640 × 480, and the training and test sets are split in an 80:20 ratio. The image sizes are all 640 × 480, and the ratio of the training set and test set division is 8:2.
Due to the complexity of real-world retail scenarios and the absence of human–object interactions in existing open-source datasets, the performance of current algorithms in practical retail applications remains uncertain. To ensure the adaptability of our algorithm to real-world retail environments, we constructed a custom dataset. This dataset was created by simulating automated vending machine scenarios, capturing images of various commodities under controlled conditions. Specifically, we utilized an existing refrigerated vending machine and mounted a camera above it. The camera was used to capture multi-angle images of physical products under well-illuminated conditions, ensuring diverse and representative data collection. The products were removed from the shelf and rotated 360 degrees to simulate customer interactions with the product display. Each rotation took 30 s, during which 10 images were captured by the camera per full rotation, with a resolution of 1280 × 720. This system can capture and analyze over 50 types of products. By taking multiple images from different angles, we ensure more accurate recognition. Figure 3 shows the number of images for some commodities in the dataset. Figure 4 shows some sample images from our dataset.
To further validate the suitability of the custom dataset for evaluating models designed to detect small and densely arranged products, we conducted a statistical analysis of object size distribution (expressed as the proportion of object area relative to the image) and inter-object spacing. Figure 5 illustrates the distributions of product sizes and spatial separations. As shown in Figure 5, in terms of object size, 58.0% of product instances occupy less than 1% of the image area, 33.0% fall between 1% and 5%, and only 9.0% occupy 5% or more. This distribution indicates that the dataset is predominantly composed of small-sized products, reflecting the typical characteristics of retail shelf environments. Regarding inter-object spacing, 89.0% of the products exhibit zero spacing—indicative of tightly packed arrangements—while only 11.0% represent isolated product scenarios. This distribution confirms that the dataset is well suited for assessing model performance in the context of small, densely packed product detection tasks.
A complete dataset includes product images and corresponding annotation documents. For network training, to facilitate readability, the annotation information in the JSON document must share the same name as the associated image, with only the prefix differing. In our study, we set the ratio of training, validation, and test samples to 8:1:1. The images in the dataset were categorized based on the number of items they contained, as summarized in Table 1.

3.3. Parameter Settings

To achieve optimal performance in dense commodity recognition, the pooling kernel size of the EMFE module was set to 5 × 5 to enhance small-object feature extraction. The adjustment parameter λ for AWIoU was set to 5, the IoU threshold τ was set to 0.5, and the smoothing parameter k was set to 0.3. The model was trained for 100 epochs with a batch size of 4, while the learning rates for both the generator and discriminator were fixed at 0.01.

3.4. Evaluation Index

The performance of the network model is evaluated using four key metrics: Average Precision (AP), mean Average Precision at IoU = 0.5 (mAP50), mean Average Precision across IoU thresholds from 0.5 to 0.95 (mAP50-95), and the average inference time. The evaluation methodology is as follows:
P = T P T P + F P × 100 % R = T P T P + F N × 100 % A P = P ( R ) d R
Here, TP represents the number of correctly identified objects by the model; FP denotes the number of incorrectly identified objects; and FN refers to the number of misidentified and missed objects. The area under the Precision–Recall (P-R) curve represents the Average Precision (AP) for a given class. Precision measures the proportion of true positive samples among the predicted positive samples, reflecting how accurate the model’s predictions are—the higher the precision, the more accurate the model. mAP is the average of AP across all classes. mAP50 refers to the Average Precision at an IoU threshold greater than 0.5, while mAP50-95 represents the average mAP at varying IoU thresholds (ranging from 0.5 to 0.95), with higher values indicating greater accuracy. The average inference time refers to the mean duration required for the model to complete a single object detection task, typically measured in milliseconds (ms). This metric serves as an indicator of computational efficiency, where lower values signify faster inference speed.

3.5. Ablation Study

3.5.1. Loss Function Optimization Study

To demonstrate the effectiveness of applying AWIoU to commodity recognition, as well as its contribution to improving prediction accuracy and robustness, this study integrates individual modules into the baseline algorithm and conducts experiments using the publicly available COCO128 dataset. Furthermore, to validate the training stability and convergence of the AWIoU loss function, we perform controlled experiments under the following settings: the model is trained for 500 epochs with a batch size of 4, an initial learning rate of 0.01, and AWIoU parameters set to λ = 5 , τ = 0.5 , and k = 0.3 . The experimental results are summarized in Table 2, while the training and validation loss curves are illustrated in Figure 6.
According to Table 2, CIoU achieves an mAP50 of only 81.5%, and an mAP50-95 of just 60.0%, indicating suboptimal performance across different IoU thresholds. EIoU significantly outperforms CIoU, with an mAP50 of 85.6% and an mAP50-95 of 68.1%. Compared to CIoU, the EIoU loss function demonstrates better adaptability across a wider range of IoU thresholds, likely due to its more effective handling of the shape discrepancy between the predicted and ground truth boxes, thereby improving the model’s recognition accuracy. Wise-IoUv1 achieves an mAP50 of 85.0% and an mAP50-95 of 68.0%. While its mAP50 is slightly lower than EIoU, its performance in mAP50-95 is nearly identical. Combining the results of these two loss functions, Wise-IoUv1 performs similarly to EIoU in overall metrics, though it may slightly underperform at certain IoU thresholds. The proposed AWIoU in this study outperforms all other metrics, achieving an mAP50 of 86.5% and an mAP50-95 of 70.1%. Compared to other loss functions, our method demonstrates outstanding performance across a broad range of IoU thresholds, indicating that it not only effectively improves recognition accuracy but also maintains stability under more stringent evaluation standards. This also highlights the higher robustness and superior overall performance of the proposed method in addressing position and shape errors in detection boxes.
As illustrated in Figure 6, the training loss of AWIoU exhibits a rapid decline during the initial 50 epochs, after which it gradually stabilizes. This suggests that the model efficiently optimizes bounding box regression, classification, and distribution-focused loss during training. A similar downward trend is observed in the validation loss, which, despite notable fluctuations in the early stages, ultimately converges to a stable state. To quantitatively assess training stability, we computed the standard deviation of the total loss fluctuations over the first 20 epochs. The standard deviation of the total training loss is 2.37, while that of the validation loss is 2.15. These results indicate that AWIoU introduces some degree of fluctuation in the early training phase; however, as training progresses, the loss stabilizes, demonstrating strong convergence. This stability reinforces the reliability of AWIoU in practical applications.

3.5.2. Performance Evaluation of the Multi-Scale Dynamic Interactive Attention Module

To evaluate the improvement in recognition capability provided by the Multi-scale Dynamic Interactive Attention Mechanism, we compared the proposed attention mechanism with other existing mechanisms. Specifically, we compared the Channel Attention (SE) model, the Efficient Channel Attention (ECA) model, the Convolutional Block Attention Module (CBAM) model, and the Multi-scale Dynamic Interactive Attention Mechanism (MDIAM). The experiments were conducted on the publicly available COCO128 dataset, with the results presented in Table 2.
According to Table 2, the introduction of SE and ECA modules resulted in mAP@50 scores of 83.5% and 83.2%, respectively. In contrast, CBAM, which integrates both channel and spatial attention mechanisms, led to a more substantial improvement, achieving an mAP@50 of 84.6%. Notably, the proposed MDIAM module—by incorporating dynamic channel weight adjustment, multi-scale spatial convolutions, and hierarchical feature interactions—further elevated performance, yielding the highest mAP@50 of 86.2%. These results underscore the effectiveness of our attention mechanism in capturing multi-scale features and long-range dependencies, thereby significantly enhancing both accuracy and recognition capability.
As shown in Table 2, the introduction of the EMFE module yields an mAP@50 of 82.8%, representing improvements of 1.4% and 0.3% over the BiFPN and NAS-FPN models, respectively. Building upon this, the integration of the LFF module leads to a reduction in average inference time. When all proposed modules and loss functions are incorporated, the model achieves its highest recognition accuracy, reaching an mAP of 86.7%, with only a marginal increase in inference time. These results underscore the model’s ability to substantially enhance recognition performance while maintaining computational efficiency.

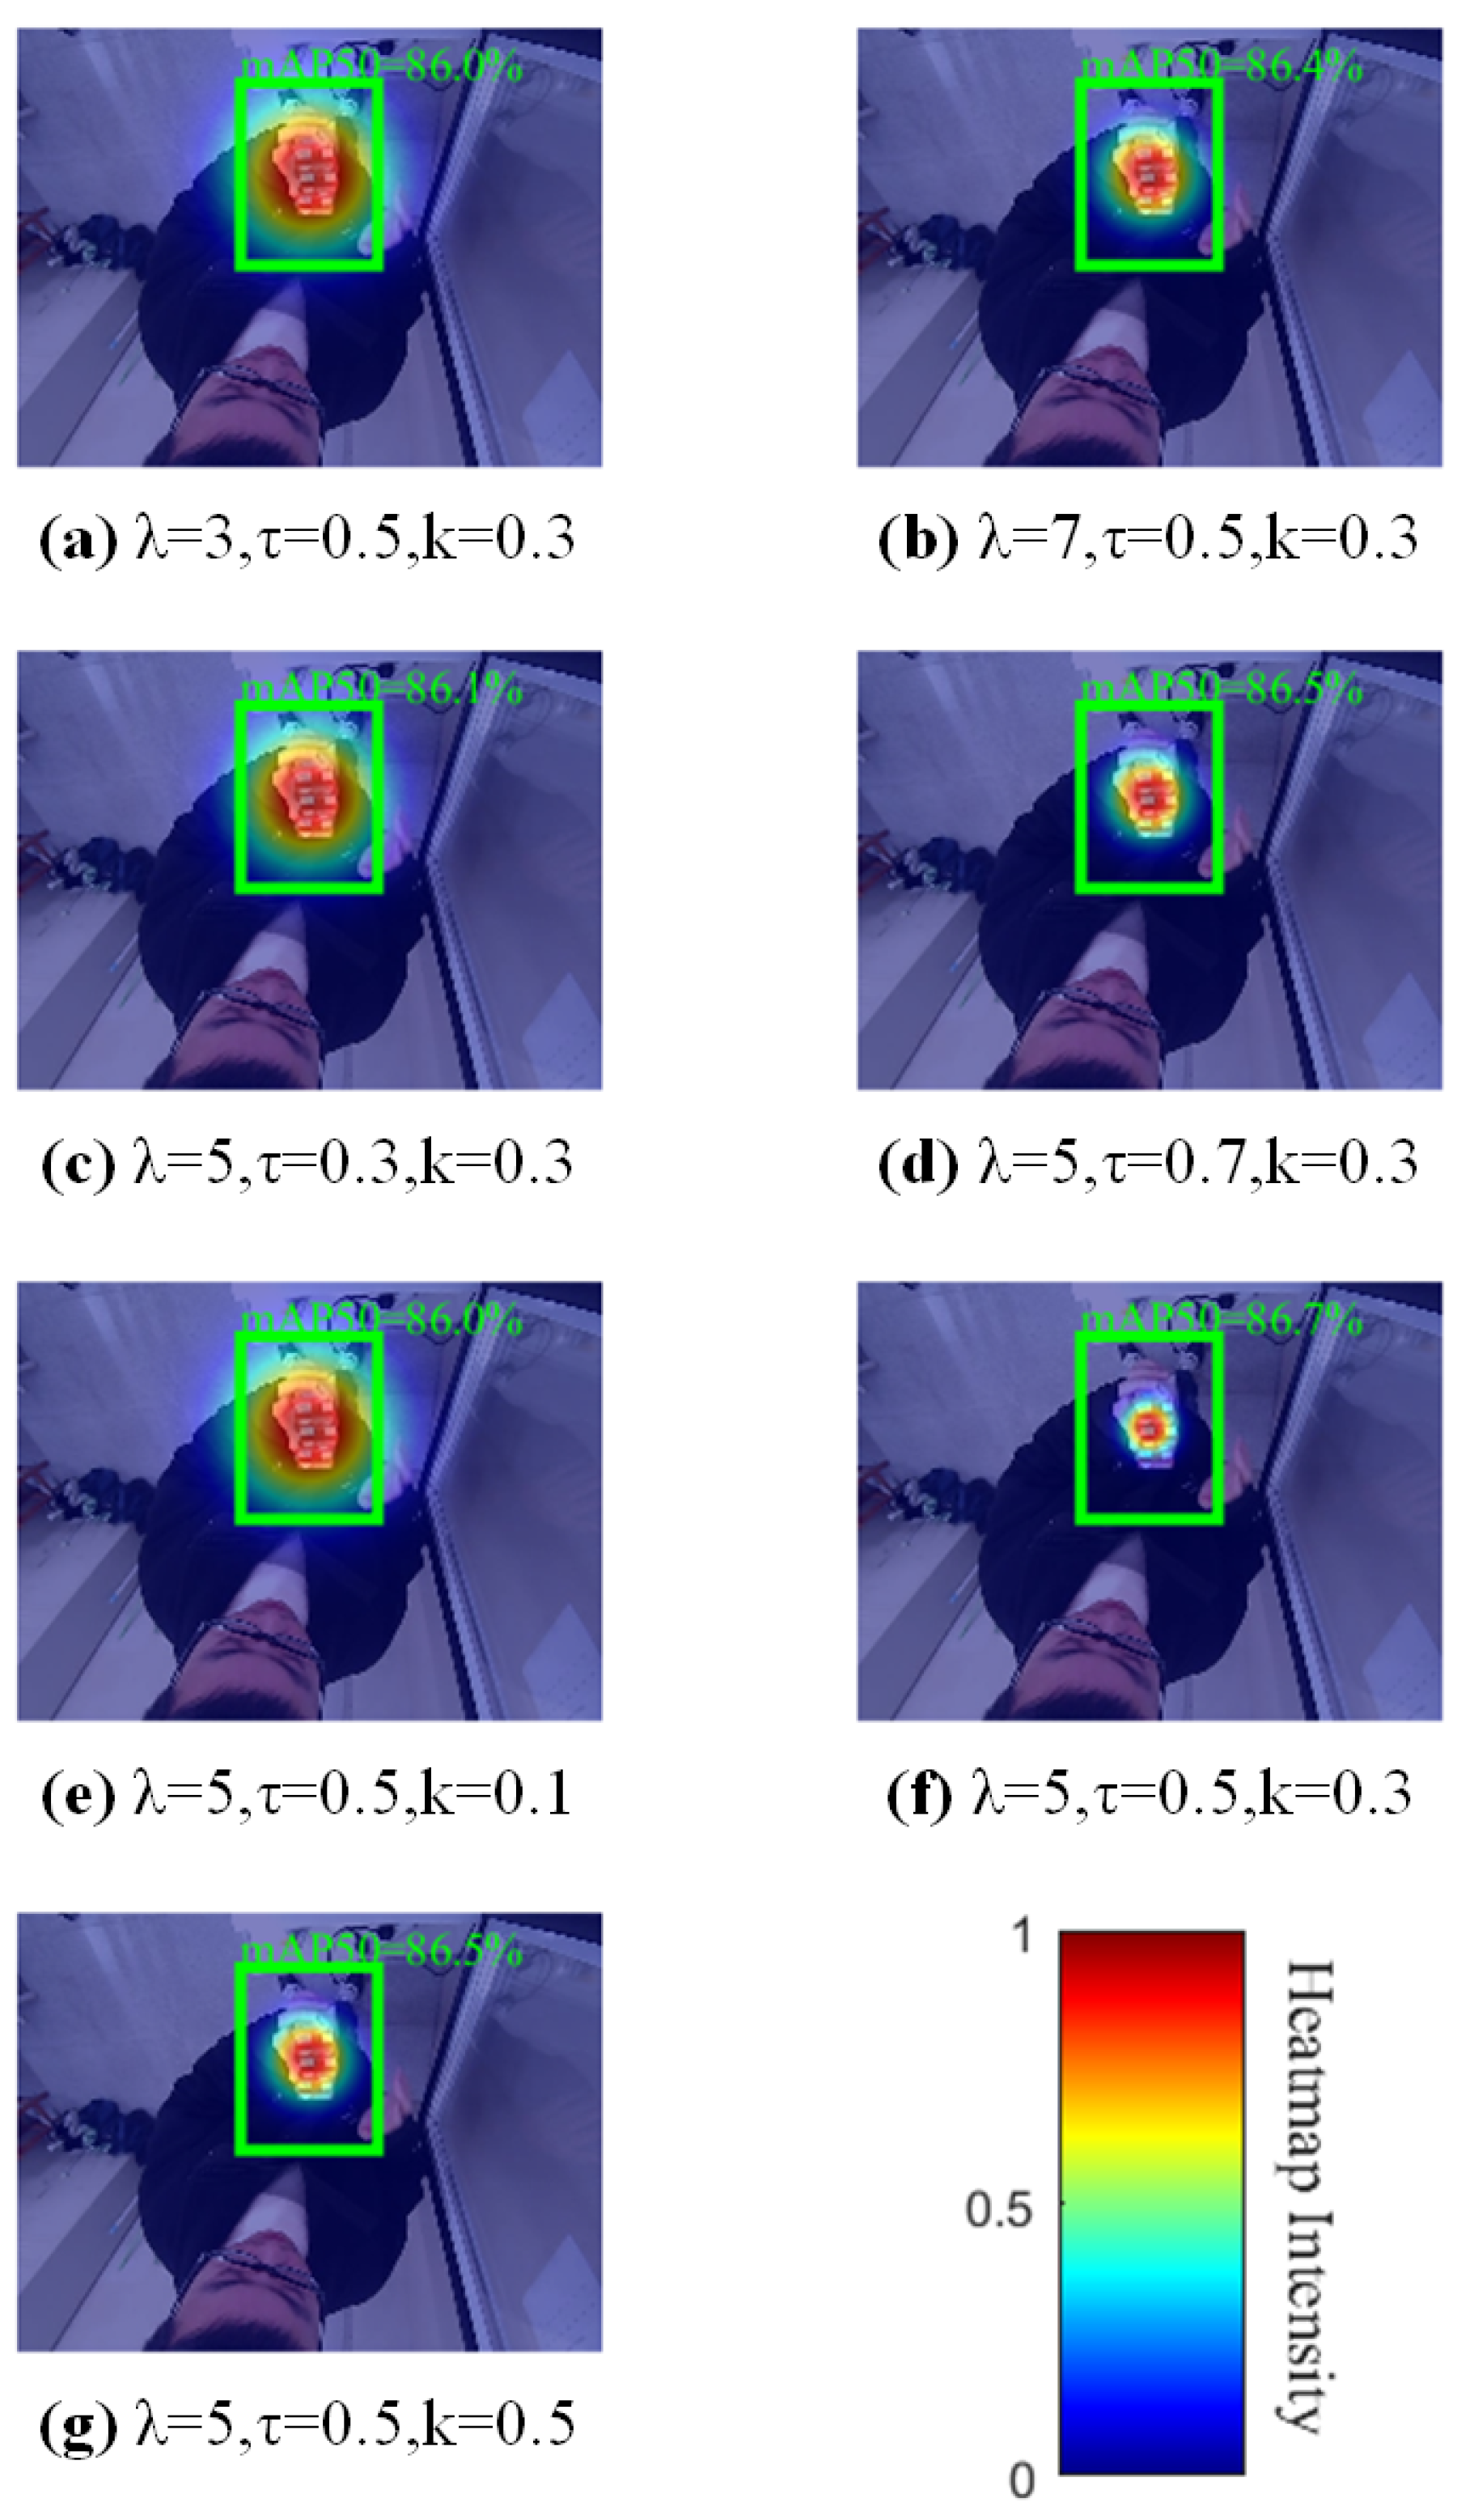
3.6. Sensitivity Analysis

To evaluate the sensitivity of the AWIoU loss function to its parameters, we systematically adjusted the smoothing parameter k, the modulation parameter λ of α , and the IoU threshold τ . The impact of these variations on recognition accuracy and average inference time was analyzed, and a comparative heatmap of different parameter combinations was generated. Experiments were conducted on a custom dataset, with the results summarized in Table 3. The heatmap is depicted in Figure 7.
Table 3 presents the performance metrics for different parameter configurations. The optimal performance is observed when λ = 5 , τ = 0.5 , and k = 0.3 , achieving an mAP50 of 86.7% with an average inference time of 29.5 ms. In comparison, when λ = 3 , the mAP50 decreases to 86.0%, while inference time slightly improves to 28.7 ms. Conversely, increasing λ to 7 results in an mAP50 of 86.4%, with inference time rising to 30.6 ms. These findings highlight the critical role of λ in modulating the dynamic weight assignment of the AWIoU loss function. As λ controls the adjustment intensity of λ , a lower λ leads to a more conservative weight distribution, reducing the model’s focus on target regions, thereby compromising detection accuracy but improving computational efficiency. In contrast, a higher λ strengthens the weight adjustment, enhancing the model’s focus on target regions at the cost of increased computational complexity. Notably, λ = 5 achieves the best trade-off between accuracy and efficiency, demonstrating the balance inherent in the hyperparameter optimization of the AWIoU loss function.
Similarly, adjustments in τ and k significantly impact performance. For instance, when τ = 0.3 , the mAP50 decreases to 86.1%, and when k = 0.1 , it drops to 86.0%, both lower than the optimal configuration, with inference times of 29.1 ms and 28.9 ms, respectively. In contrast, increasing τ to 0.7 or k to 0.5 leads to an improved mAP50 of 86.5%, with inference times increasing to 30.4 ms and 30.2 ms, respectively. These results indicate that τ , as the IoU threshold, dictates the sensitivity of the loss function to bounding box overlap. A lower τ results in a milder penalty for low-IoU predictions, dispersing model attention and reducing recognition accuracy but lowering computational cost. Conversely, a higher τ enforces stricter penalties on low-IoU predictions, enhancing accuracy at the expense of increased computational complexity in IoU calculations. The smoothing parameter k regulates the loss function’s smoothness. A smaller k makes the loss function more directly optimization-driven, rendering the model more sensitive to noise and limiting accuracy while reducing inference time. In contrast, a larger k enhances robustness through smoother optimization, improving accuracy at the cost of additional computational overhead. These variations underscore the inherent trade-off between accuracy and computational efficiency when fine-tuning τ and k.
Figure 7 provides an intuitive visualization of the impact of different parameter combinations on recognition accuracy and the model’s focus intensity on target commodities. When λ = 5 , τ = 0.5 , and k = 0.3 , the heatmap exhibits the most concentrated distribution, corresponding to an mAP50 of 86.7%. This suggests that this particular parameter configuration significantly enhances the model’s ability to focus on commodity regions, thereby achieving optimal recognition performance. This outcome aligns with the fundamental properties of the AWIoU loss function, where a well-balanced selection of λ , τ , and k effectively harmonizes dynamic weight adjustment with smooth optimization. Consequently, the model attains superior precision in object detection while maintaining robustness and computational efficiency.

3.7. Comparison Experiment

Due to the small size and limited feature information of small commodities, they are prone to missed detections. To evaluate the effectiveness of the proposed method in addressing the issue of missed detections in commodity recognition, as well as the lightweight design of LFF, we conducted comparative experiments using a custom dataset. Several state-of-the-art object detection algorithms were benchmarked against our proposed approach for small commodity recognition. The experimental results are summarized in Table 4, while the detection outcomes are illustrated in Figure 8.
According to Table 4, YOLOv5, YOLOv7, YOLOv8, and the proposed model were applied to the small commodity detection task, and the mAP values for each model were computed at an IoU threshold of 50%. The results show that the mAP values for YOLOv8 and the proposed model are significantly higher than those of YOLOv5 and YOLOv7. YOLOv8 achieved an mAP of 93.9%, while the proposed model further improved the mAP to 94.9%, demonstrating a noticeable enhancement over YOLOv8. This indicates that the proposed algorithm significantly improves detection accuracy in commodity recognition and effectively reduces the issue of missed detections. By incorporating the EMFE and MDIAM theories, our model theoretically introduces additional computational overhead. However, empirical results reveal that the average inference time increases by merely 1.3 ms compared to the baseline model. This finding robustly validates the effectiveness of the LFF module, which leverages depthwise separable convolutions to significantly reduce computational complexity and memory consumption. Consequently, our model achieves a substantial improvement in detection accuracy while maintaining computational efficiency comparable to YOLOv8. Furthermore, the EMFE module enhances small-object perception through multi-scale pooling, and the synergy between these components enables the model to sustain high inference efficiency while boosting accuracy. This incremental enhancement overcomes the limitations of Darknet53 in multi-scale feature extraction and fusion, paving the way for more efficient and precise object detection.
Figure 8 provides a more intuitive comparison of the performance of different models in practical applications. The first and third columns present the detection results obtained using YOLOv8, which can accurately detect and identify most target objects. However, as shown in the second and fourth columns, the detection results of the proposed model demonstrate significantly higher confidence scores for the generated bounding boxes, with most values approaching 1.0. This indicates that the proposed model enhances recognition accuracy and effectively reduces missed detections. These results are consistent with the mAP values presented in Table 4.

3.8. Dense Commodity Detection Experiment

To assess the effectiveness of the proposed method in mitigating both misidentification and missed detection in dense product recognition, we conducted comparative experiments against the YOLOv8 and YOLOv11 algorithms using a custom-built dataset. The mAP50 results are summarized in Table 5, while the recognition outcomes are depicted in Figure 9.
The YOLOv8, YOLOv11, and the proposed model were applied to the dense product recognition task, and the mean Average Precision (mAP) for different products was computed for each model. As shown in Table 5, the proposed model achieved higher mAP values than YOLOv8 for most products, with performance comparable to YOLOv11. Notably, no misidentifications or missed detections were observed, demonstrating the model’s superior accuracy in dense product recognition and its effectiveness in addressing these challenges.
In panel b of the first column, numerous erroneous and redundant bounding boxes are observed, while panel c exhibits misidentifications, as indicated by the yellow bounding boxes. Similarly, in panel b of the second column, missed detections are evident, with only a single bounding box present. In contrast, the proposed model, as shown in the third column, eliminates misidentifications and demonstrates improved recognition accuracy. These visual results provide an intuitive validation of the proposed algorithm’s effectiveness in addressing misidentification and missed detection in dense product recognition, aligning well with the findings presented in Table 5.

4. Discussion and Conclusions

This study proposes a dense product recognition algorithm based on multi-scale dynamic interactive feature fusion. A novel feature extraction architecture, termed Dense-YOLO, is introduced, incorporating an enhanced multi-scale feature extraction module at the backbone and a lightweight feature fusion strategy at the neck. This design improves the recognition of small objects and performance in cluttered environments, while reducing memory consumption and parameter tuning complexity. On a custom retail dataset, Dense-YOLO achieves an mAP50 of 94.9%, representing a 1.0% improvement over YOLOv8 and effectively reducing missed detections. In addition, we introduce the Multi-scale Dynamic Interactive Attention Mechanism, which integrates dynamic channel reweighting, multi-scale spatial convolution, and hierarchical feature interaction. This mechanism enables a more effective handling of complex backgrounds and variable object sizes in dense product recognition scenarios, enhancing feature representation and reducing false positives. Evaluated on the COCO128 dataset, the proposed attention module achieves an mAP50 of 86.2%, outperforming CBAM by 1.6%. Furthermore, we propose an adaptive dynamic weighting mechanism and a local density-aware adjustment strategy to reduce reliance on specific datasets. A localization correction term is also introduced to improve the accuracy of highly dynamic targets. On the COCO128 dataset, the proposed method reaches an mAP50 of 86.5%, marking a 0.9% improvement over EIoU and reducing the incidence of missed detections.
In the experiments, the proposed algorithm was evaluated on both the COCO128 dataset and a custom dataset to validate its effectiveness. The results demonstrate that the algorithm improves commodity recognition accuracy in practical applications and effectively addresses the issues of misdetection and missed detection in dense commodity recognition.
Notwithstanding these advances, the proposed algorithm still offers scope for improvement. The incorporation of attention mechanisms increases computational overhead, and its accuracy may therefore decline when confronted with high-throughput data streams. Furthermore, the model’s capacity to generalize under extreme conditions remains limited; recognizing products against highly complex backgrounds continues to pose a challenge. The Adaptive Weighted IoU (AWIoU) term is also highly sensitive to its hyperparameters when optimizing densely packed small objects, necessitating further tuning to reduce dependence on any single dataset. Future work should focus on enhancing both the generalizability and computational efficiency of the framework, and on devising self-adaptive parameter adjustment strategies to strengthen the robustness of AWIoU, thereby magnifying the practical impact of dense product recognition technology in retail applications.

Author Contributions

Conceptualization, Z.W., B.W. and K.X.; methodology, Z.W. and B.W.; software, Z.W., B.X. and J.Y.; investigation, J.H., W.Z. and C.W.; writing—original draft preparation, Z.W.; writing—review and editing, Z.W., B.X. and B.W.; visualization, C.W.; project administration, K.X.; funding acquisition, J.H. and W.Z. All authors have read and agreed to the published version of the manuscript.

Funding

This research was funded by the National Natural Science Foundation of China (Grant No. 62272485 and 62373372). Furthermore, we acknowledge that the main research activities described in this paper were conducted as part of the National Innovative Entrepreneurship Undergraduate Training Program Project (Grant No. 202410489004(Yz2023056)) and the Innovative Entrepreneurship Undergraduate Training Program Project (Grant No. Yz2024410) at Yangtze University.

Informed Consent Statement

Informed consent was obtained from all subjects involved in the study.

Data Availability Statement

The data supporting the findings of this study are not publicly available due to privacy and confidentiality reasons. The dataset comprises over 2000 images of everyday smart retail cabinet products, meticulously organized by the authors in the laboratory. As such, access to the data is restricted to ensure compliance with confidentiality agreements and protection of proprietary information. However, researchers interested in accessing the data may contact Zhiyuan Wu (2022001428@yangtzeu.edu.cn) to discuss potential collaborations or data-sharing agreements.

Conflicts of Interest

The authors declare no conflicts of interest.

References

  1. Deng, J.; Xuan, X.; Wang, W.; Li, Z.; Yao, H.; Wang, Z. A review of research on object detection based on deep learning. J. Phys. Conf. Ser. 2020, 1684, 012028. [Google Scholar] [CrossRef]
  2. Girshick, R.; Donahue, J.; Darrell, T.; Malik, J. Rich Feature Hierarchies for Accurate Object Detection and Semantic Segmentation. In Proceedings of the 2014 IEEE Conference on Computer Vision and Pattern Recognition, Columbus, OH, USA, 23–28 June 2014; IEEE: New York, NY, USA, 2014; pp. 580–587. [Google Scholar] [CrossRef]
  3. Girshick, R. Fast R-CNN. In Proceedings of the 2015 IEEE International Conference on Computer Vision (ICCV), Santiago, Chile, 13–16 December 2015; IEEE: New York, NY, USA, 2015. [Google Scholar] [CrossRef]
  4. Ren, S.; He, K.; Girshick, R.; Sun, J. Faster R-CNN: Towards Real-Time Object Detection with Region Proposal Networks. IEEE Trans. Pattern Anal. Mach. Intell. 2017, 39, 1137–1149. [Google Scholar] [CrossRef] [PubMed]
  5. He, K.; Gkioxari, G.; Dollar, P.; Girshick, R. Mask R-CNN. In Proceedings of the 2017 IEEE International Conference on Computer Vision (ICCV), Venice, Italy, 22–29 October 2017; IEEE: New York, NY, USA, 2017. [Google Scholar] [CrossRef]
  6. Liu, W.; Anguelov, D.; Erhan, D.; Szegedy, C.; Reed, S.; Fu, C.Y.; Berg, A.C. SSD: Single Shot MultiBox Detector. In Computer Vision—ECCV 2016; Springer International Publishing: Berlin/Heidelberg, Germany, 2016; pp. 21–37. [Google Scholar] [CrossRef]
  7. Jiang, P.; Ergu, D.; Liu, F.; Cai, Y.; Ma, B. A Review of Yolo Algorithm Developments. Procedia Comput. Sci. 2022, 199, 1066–1073. [Google Scholar] [CrossRef]
  8. Shetty, A.K.; Saha, I.; Sanghvi, R.M.; Save, S.A.; Patel, Y.J. A Review: Object Detection Models. In Proceedings of the 2021 6th International Conference for Convergence in Technology (I2CT), Maharashtra, India, 2–4 April 2021; IEEE: New York, NY, USA, 2021; pp. 1–8. [Google Scholar] [CrossRef]
  9. Sun, Y.; Tao, H.; Stojanovic, V. Pseudo-label guided dual classifier domain adversarial network for unsupervised cross-domain fault diagnosis with small samples. Adv. Eng. Inform. 2025, 64, 102986. [Google Scholar] [CrossRef]
  10. Zhao, H.; Wu, Y.; Deng, W. Fuzzy Broad Neuroevolution Networks via Multiobjective Evolutionary Algorithms: Balancing Structural Simplification and Performance. IEEE Trans. Instrum. Meas. 2025, 74, 1–10. [Google Scholar] [CrossRef]
  11. Chen, H.; Sun, Y.; Li, X.; Zheng, B.; Chen, T. Dual-Scale Complementary Spatial-Spectral Joint Model for Hyperspectral Image Classification. IEEE J. Sel. Top. Appl. Earth Obs. Remote Sens. 2025, 18, 6772–6789. [Google Scholar] [CrossRef]
  12. Wang, C.Y.; Bochkovskiy, A.; Liao, H.Y.M. YOLOv7: Trainable Bag-of-Freebies Sets New State-of-the-Art for Real-Time Object Detectors. In Proceedings of the 2023 IEEE/CVF Conference on Computer Vision and Pattern Recognition (CVPR), Vancouver, BC, Canada, 17–24 June 2023; IEEE: New York, NY, USA, 2023; pp. 7464–7475. [Google Scholar] [CrossRef]
  13. Terven, J.; Córdova-Esparza, D.M.; Romero-González, J.A. A Comprehensive Review of YOLO Architectures in Computer Vision: From YOLOv1 to YOLOv8 and YOLO-NAS. Mach. Learn. Knowl. Extr. 2023, 5, 1680–1716. [Google Scholar] [CrossRef]
  14. Wang, C.Y.; Mark Liao, H.Y.; Wu, Y.H.; Chen, P.Y.; Hsieh, J.W.; Yeh, I.H. CSPNet: A New Backbone that can Enhance Learning Capability of CNN. In Proceedings of the 2020 IEEE/CVF Conference on Computer Vision and Pattern Recognition Workshops (CVPRW), Seattle, WA, USA, 14–19 June 2020; IEEE: New York, NY, USA, 2020. [Google Scholar] [CrossRef]
  15. Ding, X.; Zhang, X.; Ma, N.; Han, J.; Ding, G.; Sun, J. RepVGG: Making VGG-style ConvNets Great Again. In Proceedings of the 2021 IEEE/CVF Conference on Computer Vision and Pattern Recognition (CVPR), Nashville, TN, USA, 20–25 June 2021; IEEE: New York, NY, USA, 2021; pp. 13728–13737. [Google Scholar] [CrossRef]
  16. Wang, C.Y.; Yeh, I.H.; Mark Liao, H.Y. YOLOv9: Learning What You Want to Learn Using Programmable Gradient Information. In Computer Vision—ECCV 2024; Springer Nature: Cham, Switzerland, 2024; pp. 1–21. [Google Scholar] [CrossRef]
  17. Wang, A.; Chen, H.; Liu, L.; Chen, K.; Lin, Z.; Han, J. Yolov10: Real-time end-to-end object detection. Adv. Neural Inf. Process. Syst. 2024, 37, 107984–108011. [Google Scholar]
  18. Khanam, R.; Hussain, M. Yolov11: An overview of the key architectural enhancements. arXiv 2024, arXiv:2410.17725. [Google Scholar]
  19. Lin, T.Y.; Dollar, P.; Girshick, R.; He, K.; Hariharan, B.; Belongie, S. Feature Pyramid Networks for Object Detection. In Proceedings of the 2017 IEEE Conference on Computer Vision and Pattern Recognition (CVPR), Honolulu, HI, USA, 21–26 July 2017; IEEE: New York, NY, USA, 2017. [Google Scholar] [CrossRef]
  20. Liu, S.; Qi, L.; Qin, H.; Shi, J.; Jia, J. Path Aggregation Network for Instance Segmentation. In Proceedings of the 2018 IEEE/CVF Conference on Computer Vision and Pattern Recognition, Salt Lake City, UT, USA, 18–23 June 2018; IEEE: New York, NY, USA, 2018. [Google Scholar] [CrossRef]
  21. Tan, M.; Pang, R.; Le, Q.V. EfficientDet: Scalable and Efficient Object Detection. In Proceedings of the 2020 IEEE/CVF Conference on Computer Vision and Pattern Recognition (CVPR), Seattle, WA, USA, 13–19 June 2020; IEEE: New York, NY, USA, 2020. [Google Scholar] [CrossRef]
  22. Liu, S.; Huang, D.; Wang, Y. Learning Spatial Fusion for Single-Shot Object Detection. arXiv 2019, arXiv:abs/1911.09516. [Google Scholar] [CrossRef]
  23. Ghiasi, G.; Lin, T.Y.; Le, Q.V. NAS-FPN: Learning Scalable Feature Pyramid Architecture for Object Detection. In Proceedings of the 2019 IEEE/CVF Conference on Computer Vision and Pattern Recognition (CVPR), Long Beach, CA, USA, 15–20 June 2019; IEEE: New York, NY, USA, 2019. [Google Scholar] [CrossRef]
  24. Woo, S.; Park, J.; Lee, J.Y.; Kweon, I.S. CBAM: Convolutional Block Attention Module. In Computer Vision—ECCV 2018; Springer International Publishing: Berlin/Heidelberg, Germany, 2018; pp. 3–19. [Google Scholar] [CrossRef]
  25. Hu, J.; Shen, L.; Sun, G. Squeeze-and-Excitation Networks. In Proceedings of the 2018 IEEE/CVF Conference on Computer Vision and Pattern Recognition, Salt Lake City, UT, USA, 18–23 June 2018; IEEE: New York, NY, USA, 2018. [Google Scholar] [CrossRef]
  26. Redmon, J.; Farhadi, A. YOLOv3: An Incremental Improvement. arXiv 2018, arXiv:1804.02767. [Google Scholar] [CrossRef]
  27. Zheng, Z.; Wang, P.; Liu, W.; Li, J.; Ye, R.; Ren, D. Distance-IoU Loss: Faster and Better Learning for Bounding Box Regression. Proc. AAAI Conf. Artif. Intell. 2020, 34, 12993–13000. [Google Scholar] [CrossRef]
  28. Zhang, Y.F.; Ren, W.; Zhang, Z.; Jia, Z.; Wang, L.; Tan, T. Focal and efficient IOU loss for accurate bounding box regression. Neurocomputing 2022, 506, 146–157. [Google Scholar] [CrossRef]
  29. Tong, Z.; Chen, Y.; Xu, Z.; Yu, R. Wise-IoU: Bounding Box Regression Loss with Dynamic Focusing Mechanism. arXiv 2023, arXiv:2301.10051. [Google Scholar] [CrossRef]
Figure 1. Overall algorithmic flowchart.
Electronics 14 02303 g001
Figure 2. Workflow of the multi-level feature interaction submodule.
Electronics 14 02303 g002
Figure 3. The number of certain types of goods in our data.
Electronics 14 02303 g003
Figure 4. Some of the pictures in our dataset. Below each image is the name of each product.
Electronics 14 02303 g004
Figure 5. Size and spacing distribution of products.
Electronics 14 02303 g005
Figure 6. The training and validation loss curves of AWIoU.
Electronics 14 02303 g006
Figure 7. Heatmap representations of diverse parameter configurations.
Electronics 14 02303 g007
Figure 8. Recognition results for small objects across various algorithms.
Electronics 14 02303 g008
Figure 9. Dense commodity detection results using various algorithms. (a) The recognition result of Crisps. (b) The recognition result of Ili Pure Milk. (c) The recognition result of Sprite. (d) The recognition result of Chocolate Soy Milk.
Electronics 14 02303 g009
Table 1. Image count statistics of the dataset (units: images).
TypeTraining SetValidation SetTest Set
Image2120265265
Annotation File2120265265
Table 2. Performance comparison of YOLOv8 variants.
Network CombinationsmAP50/%mAP50-95/%Average Inference Time/ms
YOLOv8 (baseline)78.557.829.4
YOLOv8+BiFPN81.462.129.7
YOLOv8+NAS-FPN82.563.230.0
YOLOv8+EMFE82.864.029.9
YOLOv8+EMFE+LFF83.164.929.6
YOLOv8+SE83.566.130.0
YOLOv8+ECA83.265.329.8
YOLOv8+CBAM84.667.230.3
YOLOv8+MDIAM86.270.530.6
YOLOv8+CIoU81.560.029.6
YOLOv8+EIoU85.668.129.8
YOLOv8+Wise-IoUv185.068.029.9
YOLOv8+AWIoU86.570.130.1
YOLOv8+EMFE+LFF+MDIAM+AWIoU86.770.429.9
Table 3. Impact of AWIoU hyperparameter configurations on model performance metrics.
Index λ τ kmAP50/%mAP50-95/%Average Inference Time/ms
130.50.386.070.228.7
270.50.386.470.130.6
350.30.386.170.129.1
450.70.386.569.930.4
550.50.186.070.028.9
650.50.386.770.329.5
750.50.586.570.030.2
Table 4. Performance comparison of different algorithms: a quantitative analysis.
ModelsmAP/%Average Inference Time/ms
YOLOv579.834.7
YOLOv785.649.5
YOLOv893.925.4
Ours94.926.7
Table 5. Comparative experiment on recognition accuracy of dense commodities across different algorithms.
Categories of ProductsYOLOv8YOLOv11Ours
Crisps85.0%86.5%85.0%
Ili Pure Milkmisrecognitionmissed detection65.0%
Spritemisrecognition99.5%100.0%
Coca Cola92.0%92.5%94.0%
Disclaimer/Publisher’s Note: The statements, opinions and data contained in all publications are solely those of the individual author(s) and contributor(s) and not of MDPI and/or the editor(s). MDPI and/or the editor(s) disclaim responsibility for any injury to people or property resulting from any ideas, methods, instructions or products referred to in the content.

