1. Introduction
In modern higher education, online learning platforms have become indispensable tools for students and educators, offering personalized learning experiences through adaptive technologies and data-driven insights. Adaptive learning platforms [
1] and Educational Recommender Systems (ERSs) [
2] have been developed to tailor learning experiences to the individual needs of students and facilitate both formative and summative assessments [
3]. Despite their widespread use, the reliance on static student representations and the use of structured system data as the primary basis for student modeling could potentially limit the depth and effectiveness of personalization within these platforms. Learning analytics (LA) has proven to be a promising approach to overcoming this limitation. By collecting, measuring, and analyzing student interaction data, LA provides insights into learner behavior, progress, and engagement (insights that are essential for designing truly personalized and adaptive learning environments) [
4]. The achievement of effective personalization requires not only having access to learner data but also making sense of it.
A main challenge to achieving deeper personalization lies in the continued reliance on static or overly generalized representations of learners, which prevents adaptive systems from responding meaningfully to individual behaviors. To address this challenge, two complementary frameworks have been proposed: learner personas and learner models. Learner personas are conceptual archetypes used to classify students based on key learning characteristics, such as prior knowledge, learning objectives, preferred learning styles, and learning environments [
5]. These personas capture similarities and differences among learners, enabling instructors and adaptive systems to provide targeted support. In contrast, learner models are dynamic and individualized profiles that evolve in real time based on student behavior in digital environments [
6]. While learner personas offer a broader, empathetic understanding of different learner types that can inform curriculum design and content planning, learner models provide fine grained, up-to-date data that can be used to adapt instruction at the individual level. Their combined use allows for both the initial alignment of learning strategies to student archetypes and their ongoing personalization based on evolving learner performance. Taken together, these frameworks support the development of adaptive learning systems that are both insightful and responsive to the changing needs of learners. Although previous research highlights the potential of learner personas to enhance instructional design and learner engagement [
5,
7,
8], many existing approaches construct these personas using predefined typologies (e.g., learning style, motivation type) [
9,
10] or rely on self-reported data [
7], both of which may offer only a partial view of the complexity of learner behavior and limit adaptability in real-world digital environments. LA offers a complementary approach by enabling the construction of learner representations directly from behavioral data. While learning personas and learner models are often predefined and static, LA supports a dynamic, data-driven process, identifying latent behavioral patterns through the application of unsupervised machine learning techniques [
11,
12]. In conjunction with clustering algorithms such as K-Means, LA can uncover engagement profiles within student activity data that can be used as the foundation for creating grounded learner personas.
This study contributes to the advancement of personalized learning by analyzing data on student engagement on the ELARS (E-Learning Activities Recommender System) platform. Specifically, the patterns of task completion in different STEM courses were examined using the K-Means clustering algorithm. By exploring the timing and volume of task completion, different patterns of engagement were identified and used to define learner personas. These personas, in conjunction with adaptive learner models, form the basis for personalized feedback, targeted recommendations, and improved support strategies. Ultimately, the results of this research should improve the design of recommender systems and promote more inclusive and effective learning environments.
This paper is organized as follows:
Section 1 (Introduction) provides the background and motivation for the study, outlines the problem space, and introduces the key concepts of learner personas, LA, and GenAI in personalized education.
Section 2 (Related Work) offers a review of previous research on learner personas, clustering techniques for behavior analysis, and the educational use of GenAI.
Section 3 (Methodology) describes the research design, including the research questions, assessment setup within the ELARS system, data collection, and the clustering approach using the K-Means algorithm.
Section 4 (Results) presents the findings from the clustering dataset, introducing six learner personas and proposing corresponding personalized interventions.
Section 5 (Discussion) contextualizes the results within established motivational and instructional frameworks, emphasizing implications for adaptive learning systems.
Section 6 (Limitations and Recommendations) discusses the study’s limitations and also outlines directions for future research to address these limitations and strengthen the generalizability and depth of the findings.
Section 7 (Conclusions) summarizes the key contributions of the study and outlines future research directions, particularly the integration of GenAI-driven support in personalized learning environments.
2. Related Work
Several studies emphasize the effective use of learner personas in technology-enhanced learning. Yang [
5] developed five different learner personas for collaborative learning in higher education and categorized students as goal-oriented collaborators, fairness-oriented independent learners, learning-oriented collaborators, instruction-dependent learners, and adapted collaborators. Their data consisted of participants sorting predefined statements about frustrations with group work. These personas help educators design collaborative learning environments that meet students’ diverse attitudes, needs, and goals in group work, ultimately increasing engagement and decreasing frustration. Applying these personas to instructional design can enhance teacher empathy, refine pedagogical strategies, and improve student satisfaction. Similarly, Ozkan et al. [
7] used an ethnographic approach to construct learner personas aimed at shaping integrative curricula for electrical and computer engineering programs. Data was collected by observations, interviews, and internal documents. By incorporating personas, they identified student characteristics that were previously underrepresented and challenged faculty assumptions about attributes essential for success, thereby broadening the understanding of student diversity within the program. Lilley et al. [
8] applied persona methodology in a computer science course by creating learner personas based on students’ motivations, challenges, preferences, and expectations for online learning. Data was collected on the basis of staff perceptions, online surveys, and interviews with students. These personas proved helpful in selecting appropriate pedagogical strategies and technological tools for distance learning. Their work focused on two effects: improving communication about learners and encouraging greater identification with students’ learning experiences. In the secondary school context, Weinhandl et al. [
13] identified five learner personas representing Austrian high school students aged 14 to 18 based on their attitudes towards mathematics. Qualitative data from teacher observations was used. These personas supported the development of technology-enhanced learning (TEL) environments that address the different characteristics, goals, and needs of students. Because this approach provides a comprehensible and structured representation of students, it provides valuable insights for educators and developers in adapting mathematics instruction within the context of TEL.
While traditional learner personas have primarily been constructed using qualitative methods and self-reported data, recent advances in learning analytics have opened up new possibilities for data-driven learner profiling. A recent review paper by Barthakur et al. [
14] highlights the growing role of learning analytics in the development of data-driven learner profiles based on behavioral data. These profiles offer scalable alternatives to self-reported or instructor-defined models by capturing engagement patterns, strategy use and learning progress. However, most LA-based profiles remain static and retrospective, with limited integration into pedagogical decision making. Despite its potential, few studies have fully operationalized behavioral profiling to create holistic representations of the learner that inform instructional design or motivational interventions. To address this gap, the present study builds on these developments by clustering behavioral patterns from the ELARS system to construct data-driven learner personas and design targeted, theory-informed interventions.
Related work shows that LA can ensure effective personalization, increase learner motivation, and improve learning outcomes through the use of data-driven insights. For example, Prisco et al. [
10] applied an ELO-based model. ELO refers to the ELO rating system, originally developed for ranking chess players and named after Arpad Elo, the physicist who created it. It is now used to match programming problems to students’ skill levels, using LA to guide progression and maintain engagement by analyzing their interaction history and task performance data. Chang et al. [
15] integrated LA into Moodle to recommend individualized learning paths based on institutional student data, resulting in better performance and reduced learning variance. Synced user profiles from the student information management system were analyzed. Liu et al. [
16] used process mining to extract effective learning strategies from high-performing students and recommend them to others, with notable results. Data were collected from learning logs in online environments. Wang and Lv [
12] used AI-powered clustering to tailor chemistry instruction to learners’ profiles based on learning data and users’ search history. Similarly, Wongwatkit and Panjaburee [
17] presented a duplex adaptation system that combines prior knowledge diagnosis with real-time behavioral analysis to significantly increase motivation based on learning time, question responses, and system feedback logs.
LA enables the early identification of at-risk students by analyzing patterns of disengagement or poor performance, allowing educators to intervene proactively and improve retention outcomes [
18,
19]. It also supports the promotion of self-regulated learning (SRL) by providing students with dashboards, feedback loops, and real-time indicators that foster reflection, planning, and strategic learning behavior [
20,
21]. Furthermore, LA informs instructional design by offering insights into how students interact with course materials, which can guide the adaptation of content sequencing, learning activities, and assessment strategies [
22,
23]. LA also underpins personalized learning pathways by tailoring recommendations and learning trajectories to students’ unique needs, preferences, and progress over time [
24]. These applications underscore the importance of LA for designing adaptive and responsive educational systems. In the context of this study, LA provides the empirical basis for deriving data-driven learner personas and aligning GenAI-powered interventions with actual student behavior.
Recent studies highlight the growing role of generative AI (GenAI) in higher education, particularly through large language models (LLMs), such as ChatGPT-4. These tools support interaction via natural language prompts, and the ability to craft effective inputs—known as prompt engineering—is emerging as a key academic skill [
25]. Prompt engineering, which involves systematic experimentation [
26], aligns well with the STEM learning process. Various methods for designing prompts have been proposed, including chain-of-thought, instructional, role-based, and few-shot prompting [
27,
28]. Enhancements such as zero-shot prompting [
29], self-consistency [
30], and least-to-most strategies [
31] have demonstrated improved performance. Despite its potential for personalized support and integration in educational recommender systems [
32], higher education still lacks structured approaches for integrating GenAI into teaching and assessment [
33].
3. Methodology
3.1. Aim and RQs
This study aimed to identify patterns in student activity data from the ELARS system to support the development of learner personas and improve recommendations within an e-learning environment. The research was guided by the following questions:
RQ1: What distinct patterns of task completion behavior, based on time and number, can be identified in student activity data from the ELARS system?
RQ2: How can these behavioral patterns be clustered to support the development of data-driven learner personas?
RQ3: In what ways can the identified learner personas inform the design of personalization interventions–recommendations?
3.2. Assessment Activities in the ELARS System
Assessment strategies play a crucial role in sustaining student engagement and promoting continuous learning throughout the academic term, particularly in STEM disciplines. Among these, formative assessment has proven especially effective as a motivational tool, as it provides students with timely, targeted feedback on their understanding of specific content concepts [
34]. This ongoing feedback helps learners identify areas for improvement, monitor their progress, and maintain a sense of achievement throughout the learning process [
35].
The ELARS system, developed at the authors’ university, is an educational recommender system designed to support personalized learning in online and blended environments [
36]. It enables teachers to structure learning flows and provides students with recommendations for digital tools, activities, and peers, based on their performance and preferences. ELARS also incorporates formative e-assessment functionalities tailored for STEM courses [
37]. Within ELARS, the course content is structured through a domain-specific framework where mathematical problems are designed by instructors and grouped according to lecture topics. Students engage with these tasks by submitting both intermediate and final answers within predefined time constraints established by their instructors.
The mastery of each concept is determined based on the accuracy of students’ responses, with their competency levels being dynamically updated as they complete tasks associated with each topic. Through ELARS, learners receive immediate feedback on their progress, along with personalized recommendations that highlight areas requiring further study. This adaptive approach not only enhances student learning outcomes but also fosters self-regulated learning by encouraging learners to focus on concepts that need reinforcement.
For each course, instructors prepared math-based tasks corresponding to lecture topics and aligned them with key course concepts. Students were required to complete at least three math-based tasks after each lecture. The tasks were made available for a 15-day period, allowing students to complete them at their own pace. After finishing all the tasks for a particular topic, the students had the option to continue practicing by attempting them again.
3.3. Data Collection and Participants
To address these questions, activity data from N = 90 students (88 male, 2 female) enrolled in three STEM university courses (undergraduate and graduate STEM study programs) was collected and analyzed. The students who participated in the experiment initially enrolled in their respective study programs during the five academic years from 2013/2014 to 2017/2018. Specifically, 7 students (6.67%) enrolled in 2013/2014, 8 (8.89%) in 2014/2015, 17 (18.89%) in 2015/2016, 32 (35.56%) in 2016/2017, and 27 (30.00%) in 2017/2018. The courses involved in the experiment—Electrical Power Networks, Electrical Substation Equipment, and Power Systems—are part of the third-year curriculum and were delivered at the authors’ university between 2019 and 2023.
Based on activity data collected from the ELARS system, two primary categories were examined to capture students’ learning patterns and preferences:
- 1.
The number of tasks completed within each topic, used to assess variations in student engagement and persistence.
- 2.
The timing of task completion over the 15-day period, providing insights into students’ study habits.
3.4. Data Analysis
To distinguish individual engagement profiles, a K-Means clustering algorithm was applied to analyze the interaction between the amount of task completion and timing. These categories were first examined independently to identify general trends in engagement and learning habits and then combined during the clustering process to reveal more nuanced behavioral profiles. Integrating these dimensions through unsupervised learning methods provided additional insights into students’ persistence, time management, and overall learning strategies. The K-Means algorithm [
38] was chosen for its simplicity, reliability, and interpretability, making it particularly suitable for initial analyses of novel datasets, such as the dataset in this study. Since the presented study represents the first analysis conducted with original data from the ELARS system, K-Means was chosen as the basic method for classifying the students’ behavioral patterns. Its transparent logic facilitates a clear understanding of the underlying data structure and provides a robust starting point for future studies involving more advanced clustering techniques. The K-Means algorithm iteratively assigns data points to clusters based on proximity to centroid values and updates these centroids until an optimal configuration is achieved [
39].
Prior to applying the K-Means algorithm, raw activity data were transformed into derived variables that reflect engagement patterns. Timing data were divided into three intervals (day 1–4, day 5–11, day 12–15), and task completion percentages were grouped into four ranges (0–30%, 30–70%, 70–100%, and >100%). For each interval or range, the number of tasks completed was calculated, and these values were then normalized to a 0–1 scale using the maximum value observed for each variable across all the students. This normalization enabled comparability across features and supported a structured clustering analysis to identify distinct engagement patterns and learning profiles.
To determine the optimal number of clusters, two key internal evaluation metrics were analyzed: the Silhouette score and the Davies–Bouldin index (DBI). The Silhouette score assesses both cohesion (the similarity of data points within a cluster) and separation (the distinctness between clusters), with values ranging from −1 to 1; higher values indicate better-defined and non-overlapping clusters [
40]. The Davies–Bouldin index complements this measure by assessing the average similarity between each cluster and its most similar counterpart, with lower values reflecting better compactness and separation [
41]. These metrics were chosen over more visual methods such as the elbow method [
42], which, despite its popularity, often relies on subjective interpretation and may not provide a clearly identifiable “elbow” point, especially for behavioral or real-world educational datasets. In contrast, the Silhouette score and the DBI provide quantitative, in-model scoring criteria that support more objective and data-driven decision making. Considering both metrics together allowed for the selection of a cluster number that balances cohesion, separation, and interpretability, supporting the reliability and relevance of the clustering results.
In this study, principal component analysis (PCA) was used only for visualization and not as a part of the clustering process. PCA is a dimensionality reduction technique commonly used in data analysis and machine learning to simplify complex datasets [
43]. Clustering was performed on the entire normalized feature space without dimensionality reduction. PCA was applied only after clustering to create a 2D representation that allows the visual interpretation of the cluster structures. This approach allowed us to present a clear and interpretable view of student engagement strategies in figures, while preserving the complete information for the actual clustering. The metrics for clustering quality and results, including the optimal number of clusters, remain unchanged regardless of PCA, as PCA did not affect the clustering step. Although the cluster evaluation metrics in
Table 1,
Table 2 and
Table 3 suggest that there may be additional clusters beyond k = 6, k = 6 was chosen based on a balanced consideration of statistical quality and interpretability.
4. Results
4.1. First Analysis
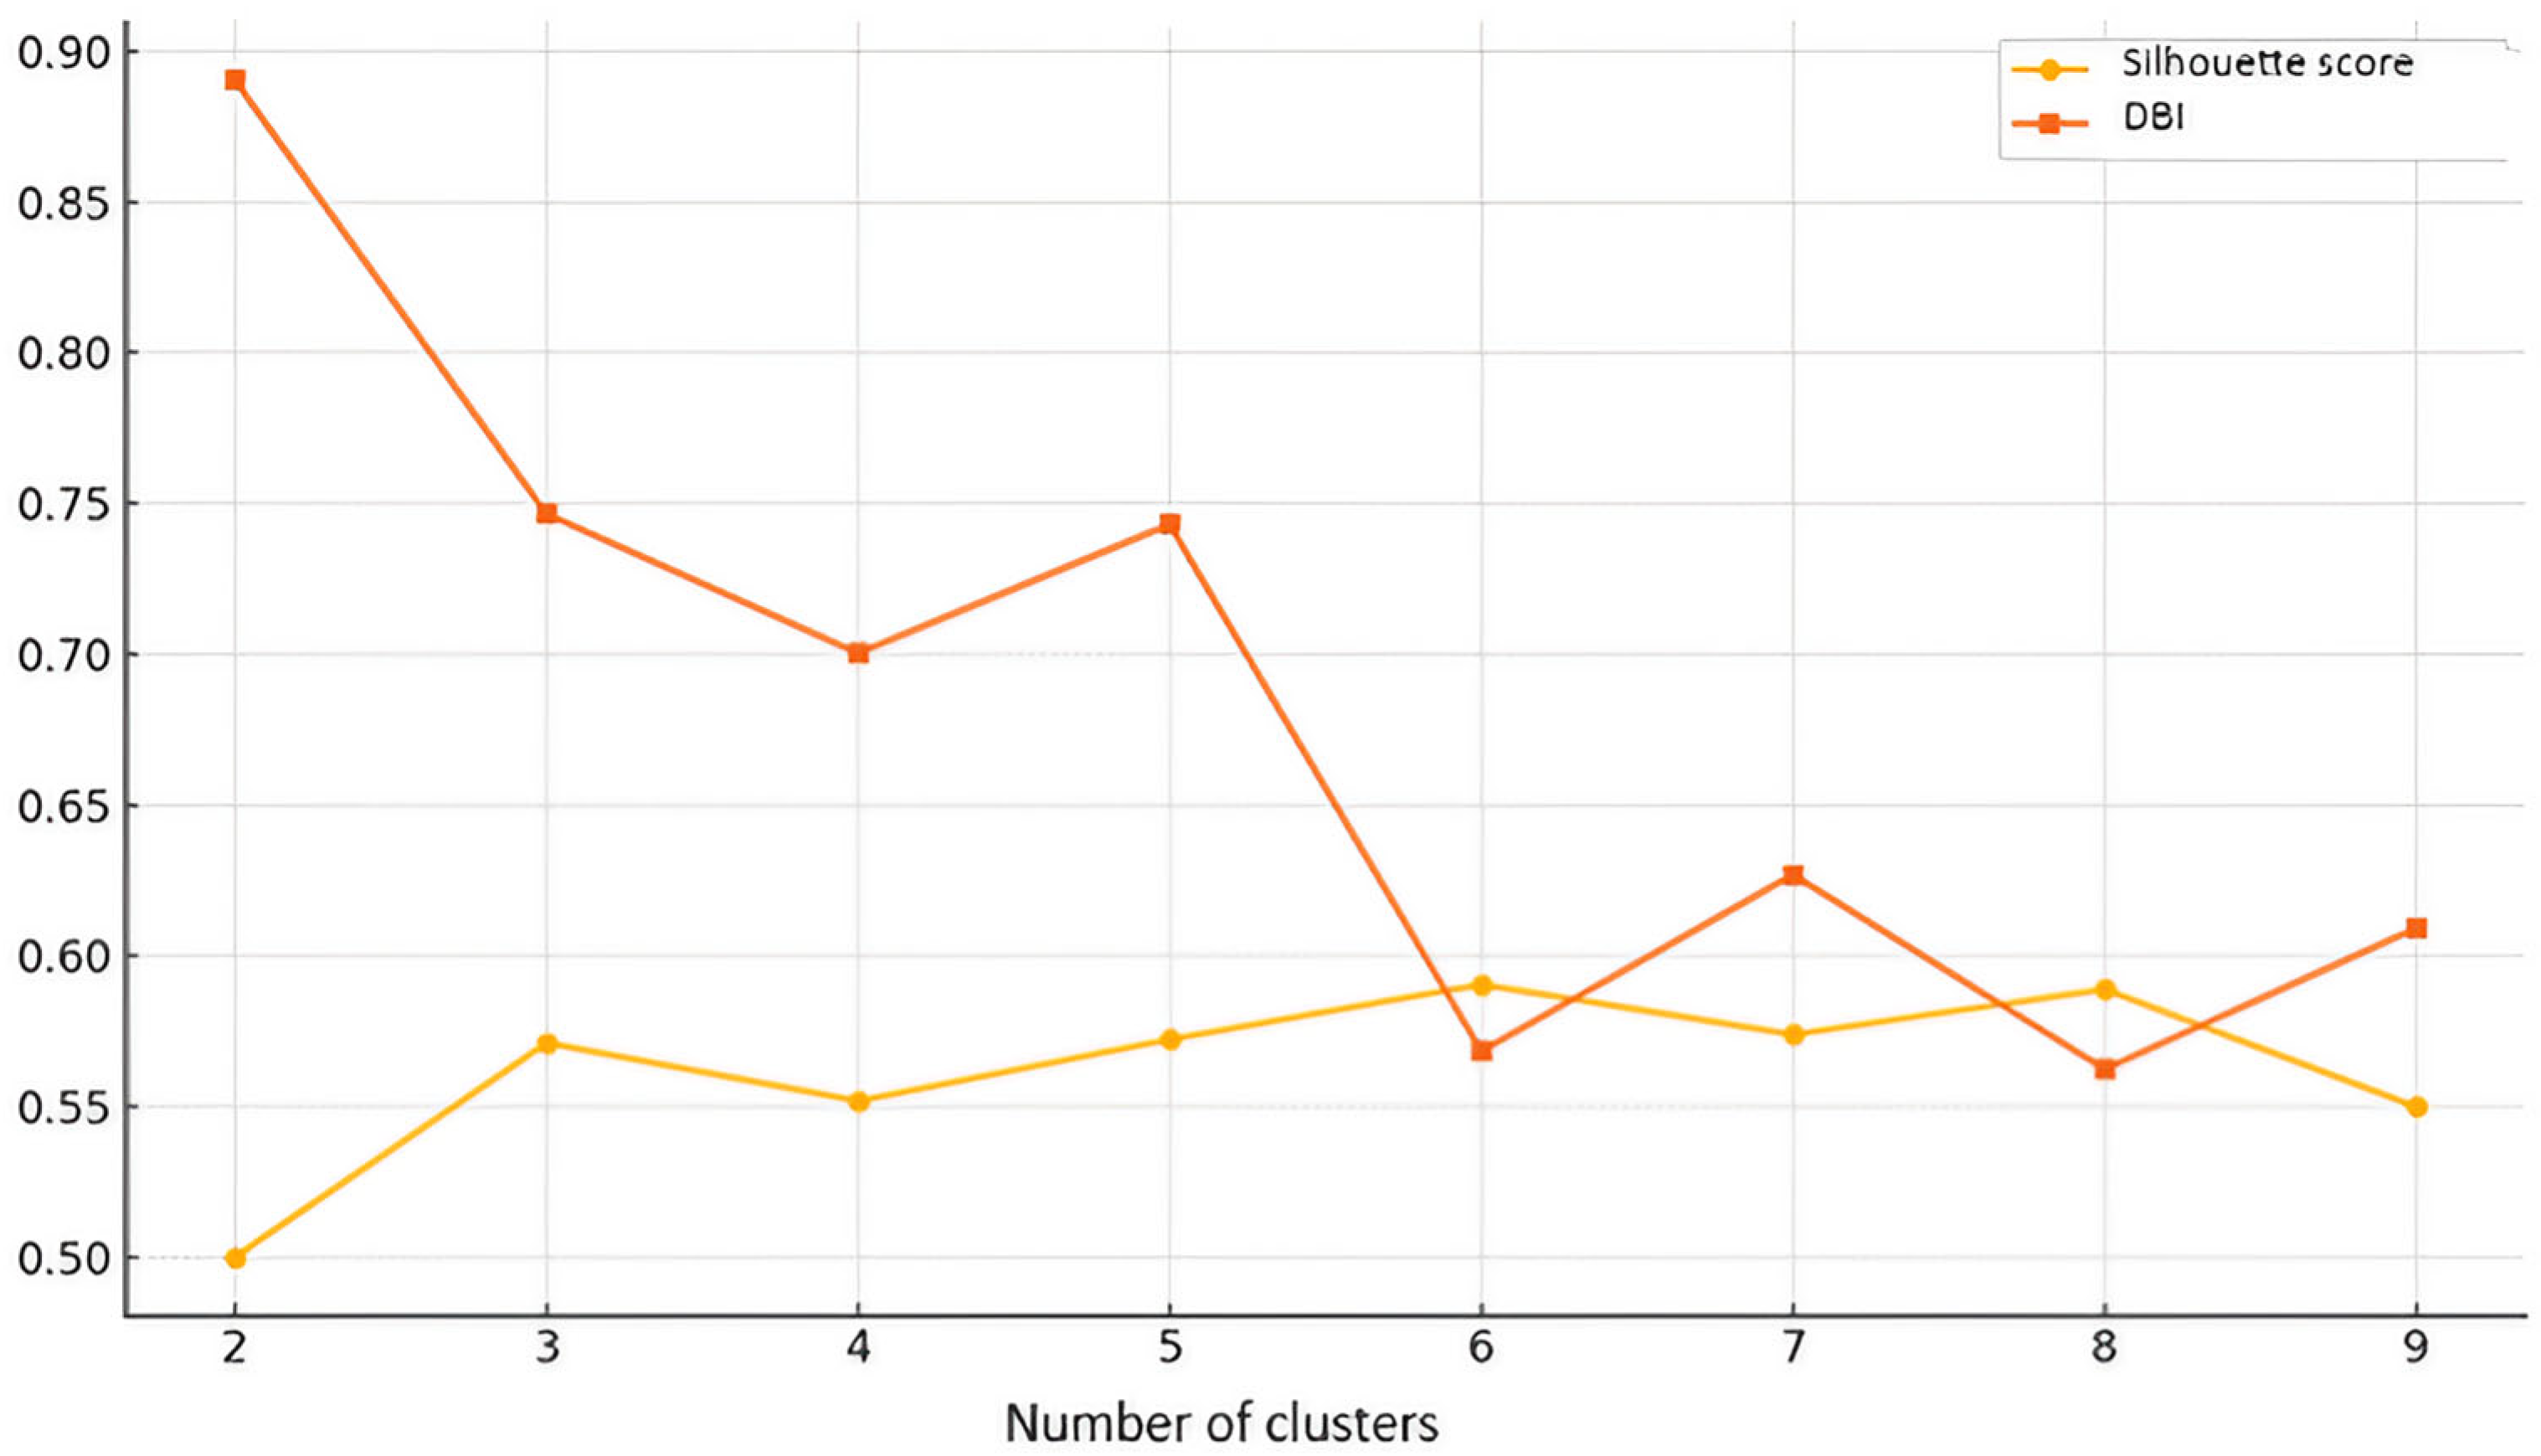
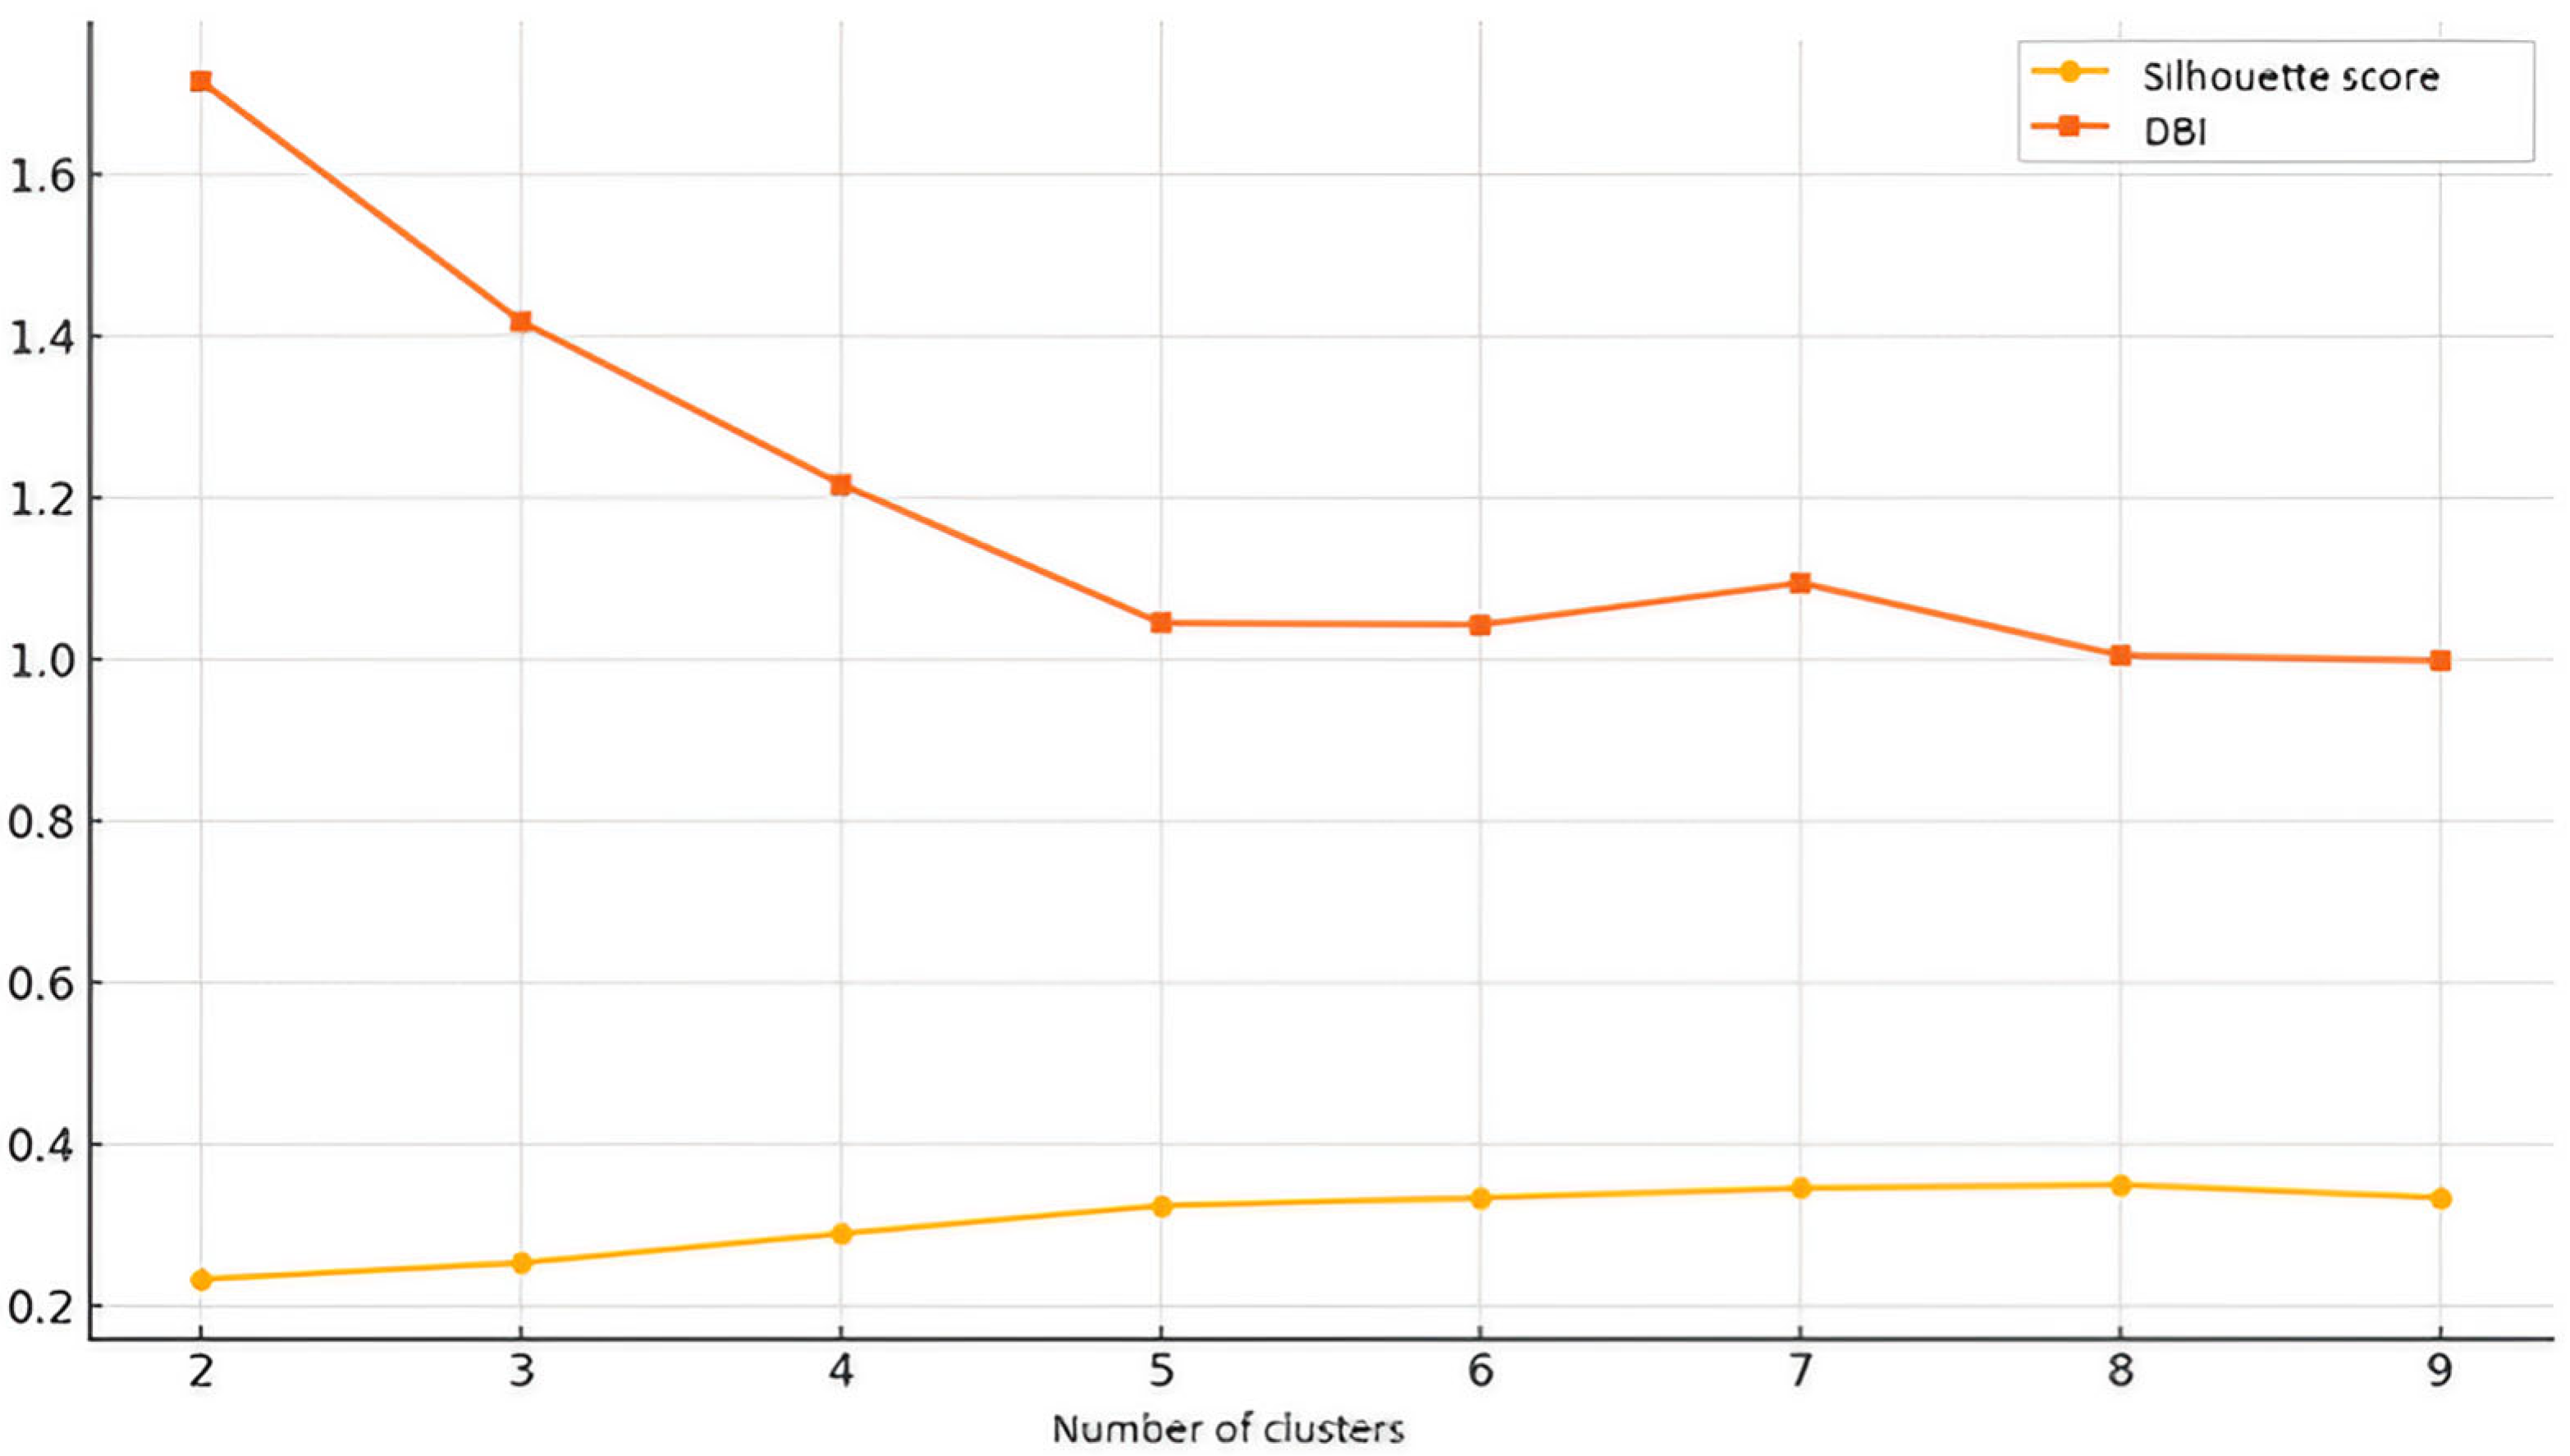
The first set of results, derived from the K-Means analysis, focuses on students’ task completion behavior over a 15-day period. The following table compares the clustering results for different numbers of clusters (k = 2 to k = 9) using the Silhouette score (the higher the better) and the Davies–Bouldin index (the lower the better). These metrics help to evaluate the quality of clustering solutions. Optimal values are highlighted.
Figure 1 is a visualization of
Table 1. It shows how the Silhouette score and Davies–Bouldin index vary across different numbers of clusters.
The optimal number of clusters for this analysis is k = 6, as determined by analyzing both the Silhouette score and the Davies–Bouldin index (DBI). The Silhouette score, which measures how well the clusters are separated from each other and how cohesive they are, peaked at k = 6 (0.5905), indicating that six clusters provide the best balance between intra-cluster cohesion and inter-cluster separation. Lower values for k = 2, k = 3, and k = 4 suggest that fewer clusters lead to overlapping and less-well-defined groups, while k = 8 has a similar Silhouette score (0.5889) but offers no significant improvement over k = 6, making six clusters a more compact and efficient choice. The Davies–Bouldin index supports this conclusion, as k = 8 had the lowest DBI (0.5624), closely followed by k = 6 (0.5684), indicating that the clusters at these levels were the most compact and well separated. Although k = 8 has the lowest DBI value, the difference is minimal, and k = 6 remains a more interpretable choice, as further increasing the number of clusters does not significantly improve the quality of clustering. The higher DBI values for k = 2, k = 3, and k = 4 indicate that these clusters were more dispersed and less well defined. Since both metrics for clustering quality indicate that six clusters provide the best separation, compactness, and interpretability, the k = 6 solution is the optimal balance between accuracy and complexity and, thus, the most statistically justified choice.
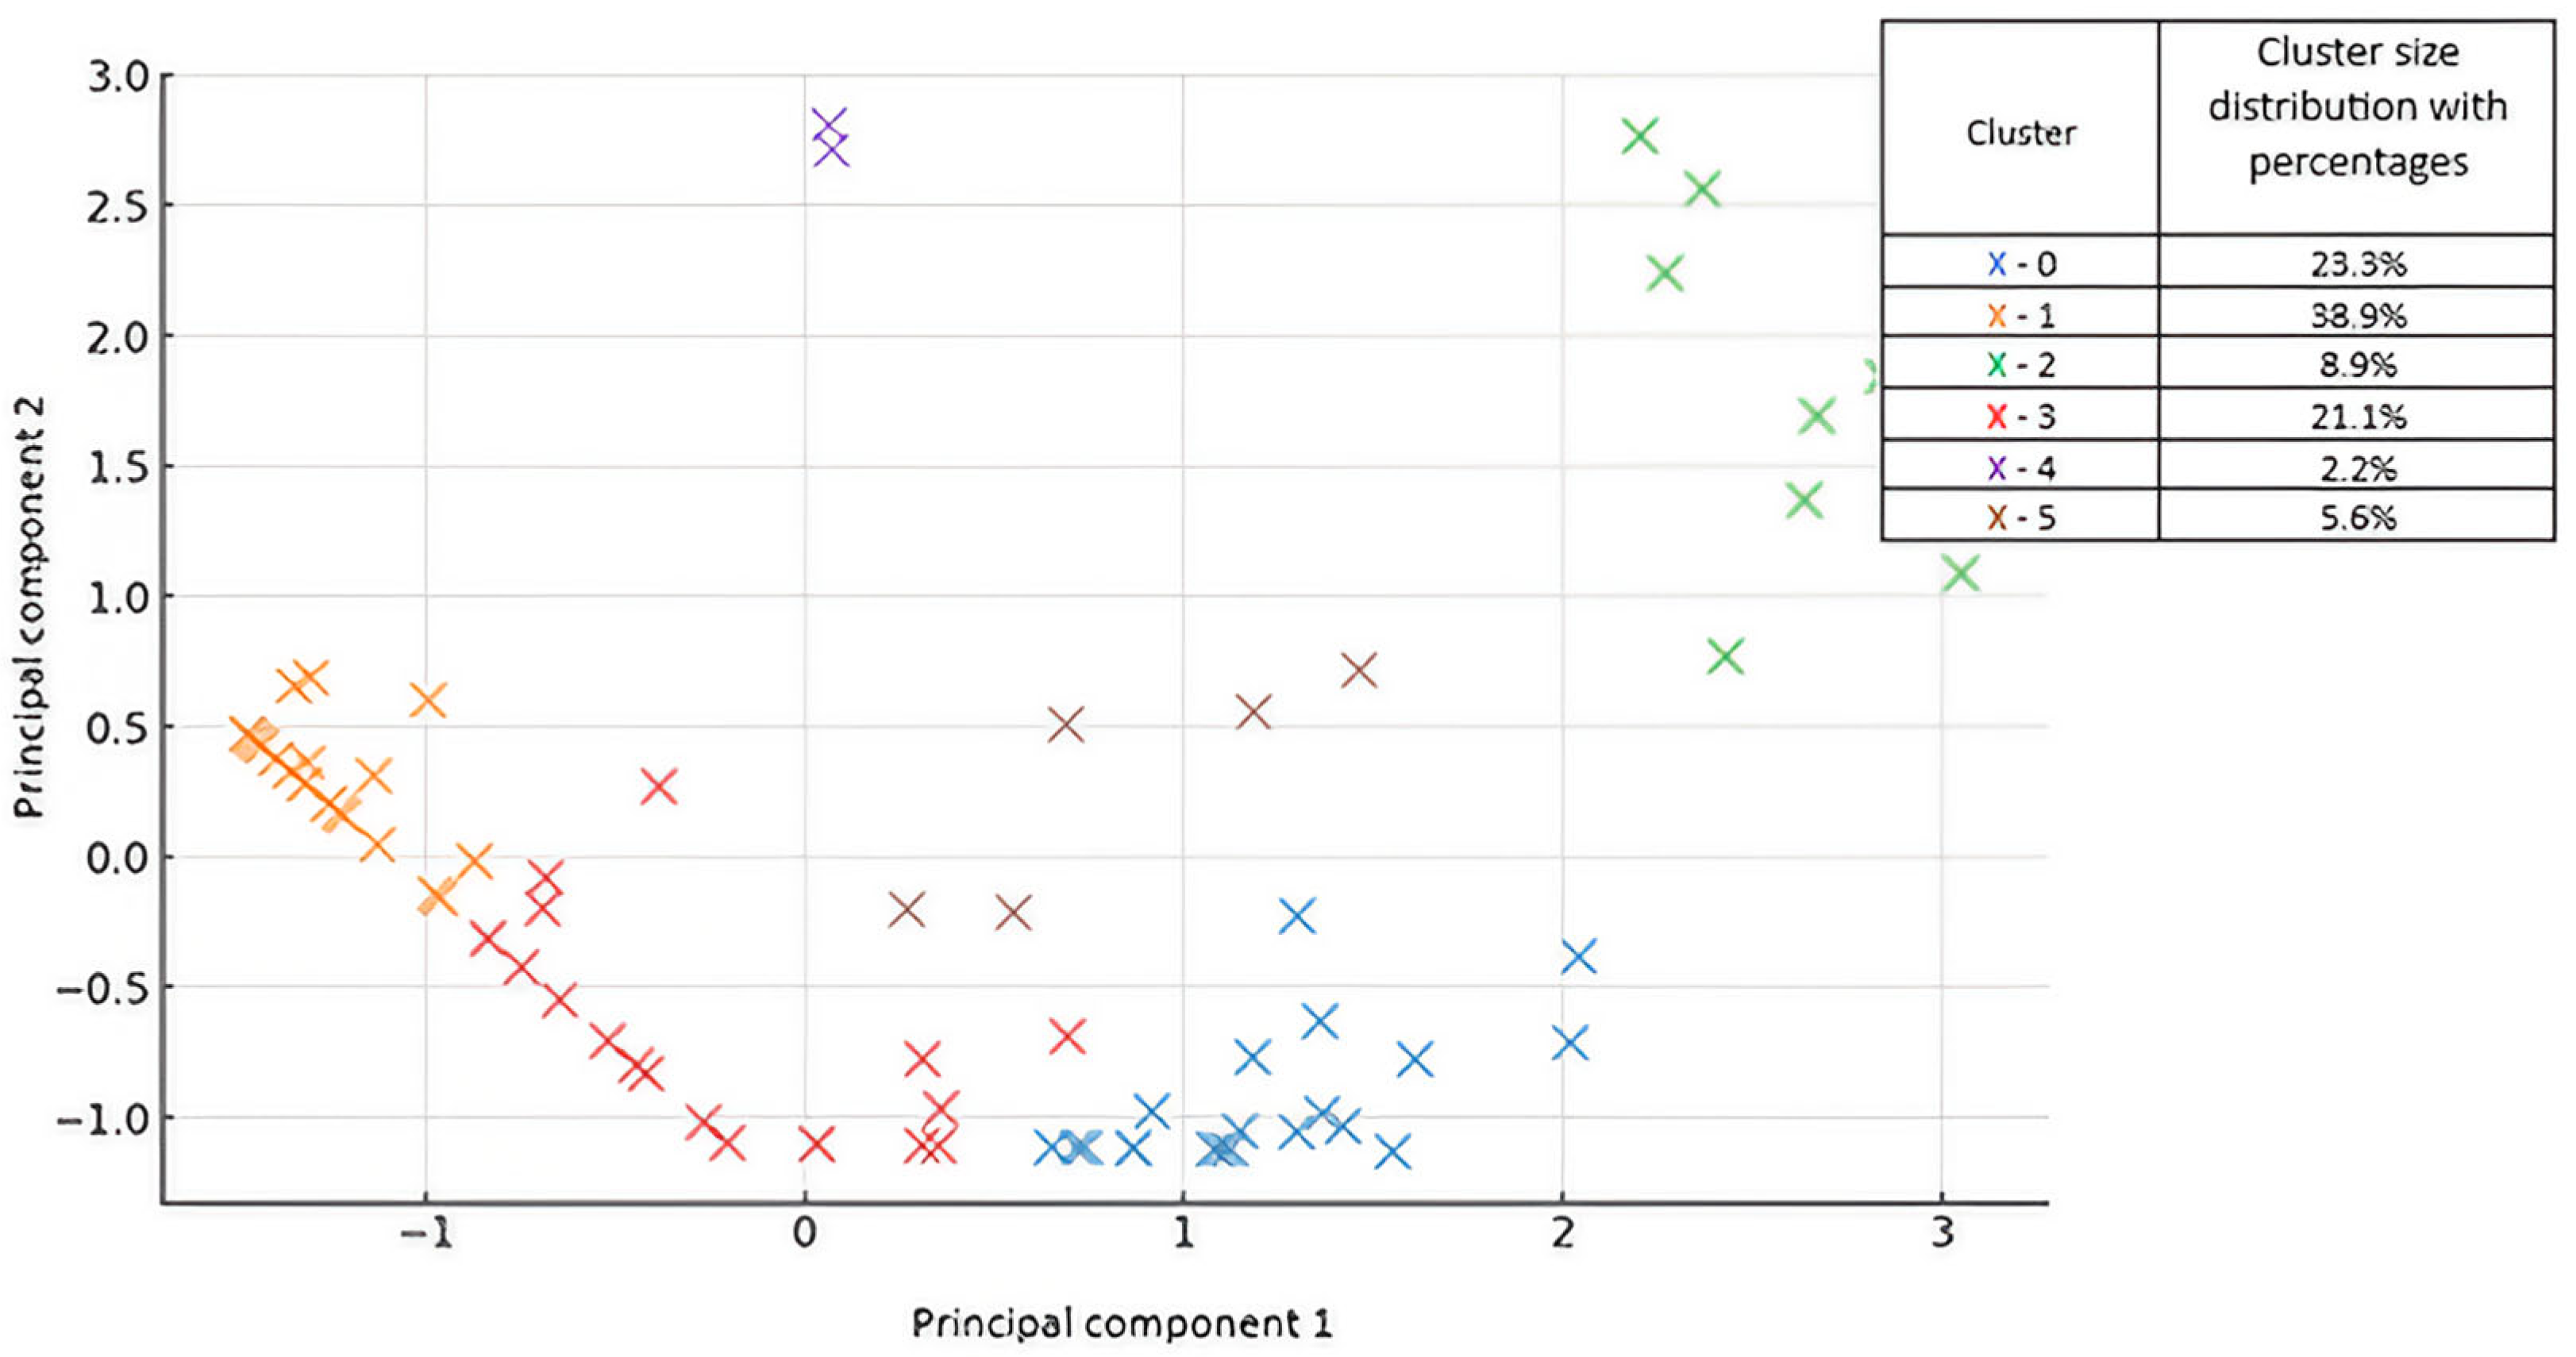
The results of using the K-Means clustering algorithm are shown in
Figure 2.
Figure 2 shows a visual representation of the clusters obtained using the K-Means algorithm with k = 6, where the data was transformed using PCA. Each point represents a student colored by the cluster assigned to it. Principal component 1 (PC1), accounting for 58.1% of the variance, shows a contrast between early/mid engagement and last-minute task completion. The students with higher PC1 values tended to engage earlier (days 1–11), while those with lower PC1 scores focused their activity on the time before the deadline (days 12–15). Principal component 2 (PC2), explaining 30.7% of the variance, distinguishes between the students who started working very early (days 1–4) and those whose activity peaked in the middle of the 15-day window (days 5–11). Together, these components retain 88.8% of the total variance and provide a compact and interpretable 2D representation of temporal engagement that can be used to visualize the six identified clusters.
From a statistical perspective, PC1 and PC2 represent the two dominant linear combinations of the original timing variables that explain the majority of the variation in student behavior. PC1 captures the most pronounced axis of variation, distinguishing between proactive and last-minute learners. PC2 adds an orthogonal dimension, enabling subtle differences in engagement onset to be visualized among early-working students.
This analysis, based on K-Means clustering with six clusters, examines students’ task completion behaviors over a 15-day period. The use of six clusters allows for a more detailed classification of students and captures different patterns of engagement and task completion strategies.
The largest group, cluster 1, consists of 35 students (38.89%) who complete the majority of their work in the last four days of the period, indicating a strong tendency to postpone tasks until the deadline. The second largest group, cluster 0, includes 21 students (23.33%) who work consistently over the middle period (days 5–11), demonstrating a slow and steady approach without rushing at the beginning or procrastinating until the end. Another important group, cluster 3, consists of 19 students (21.11%) who are mainly engaged with their tasks in the first 11 days and show early motivation and an advanced work ethic. A smaller group, cluster 2, consists of eight students (8.89%) who work intensively in the first four days, complete the majority of their assignments early, and are less engaged thereafter. Cluster 4, which includes two students (2.22%), follows a two-peak strategy where they start strong in the first few days, switch off in the middle period, and then rush to complete tasks just before the deadline. Finally, cluster 5 shows low engagement throughout the period, either completing very few tasks or participating only minimally in the tasks.
4.2. Second Analysis
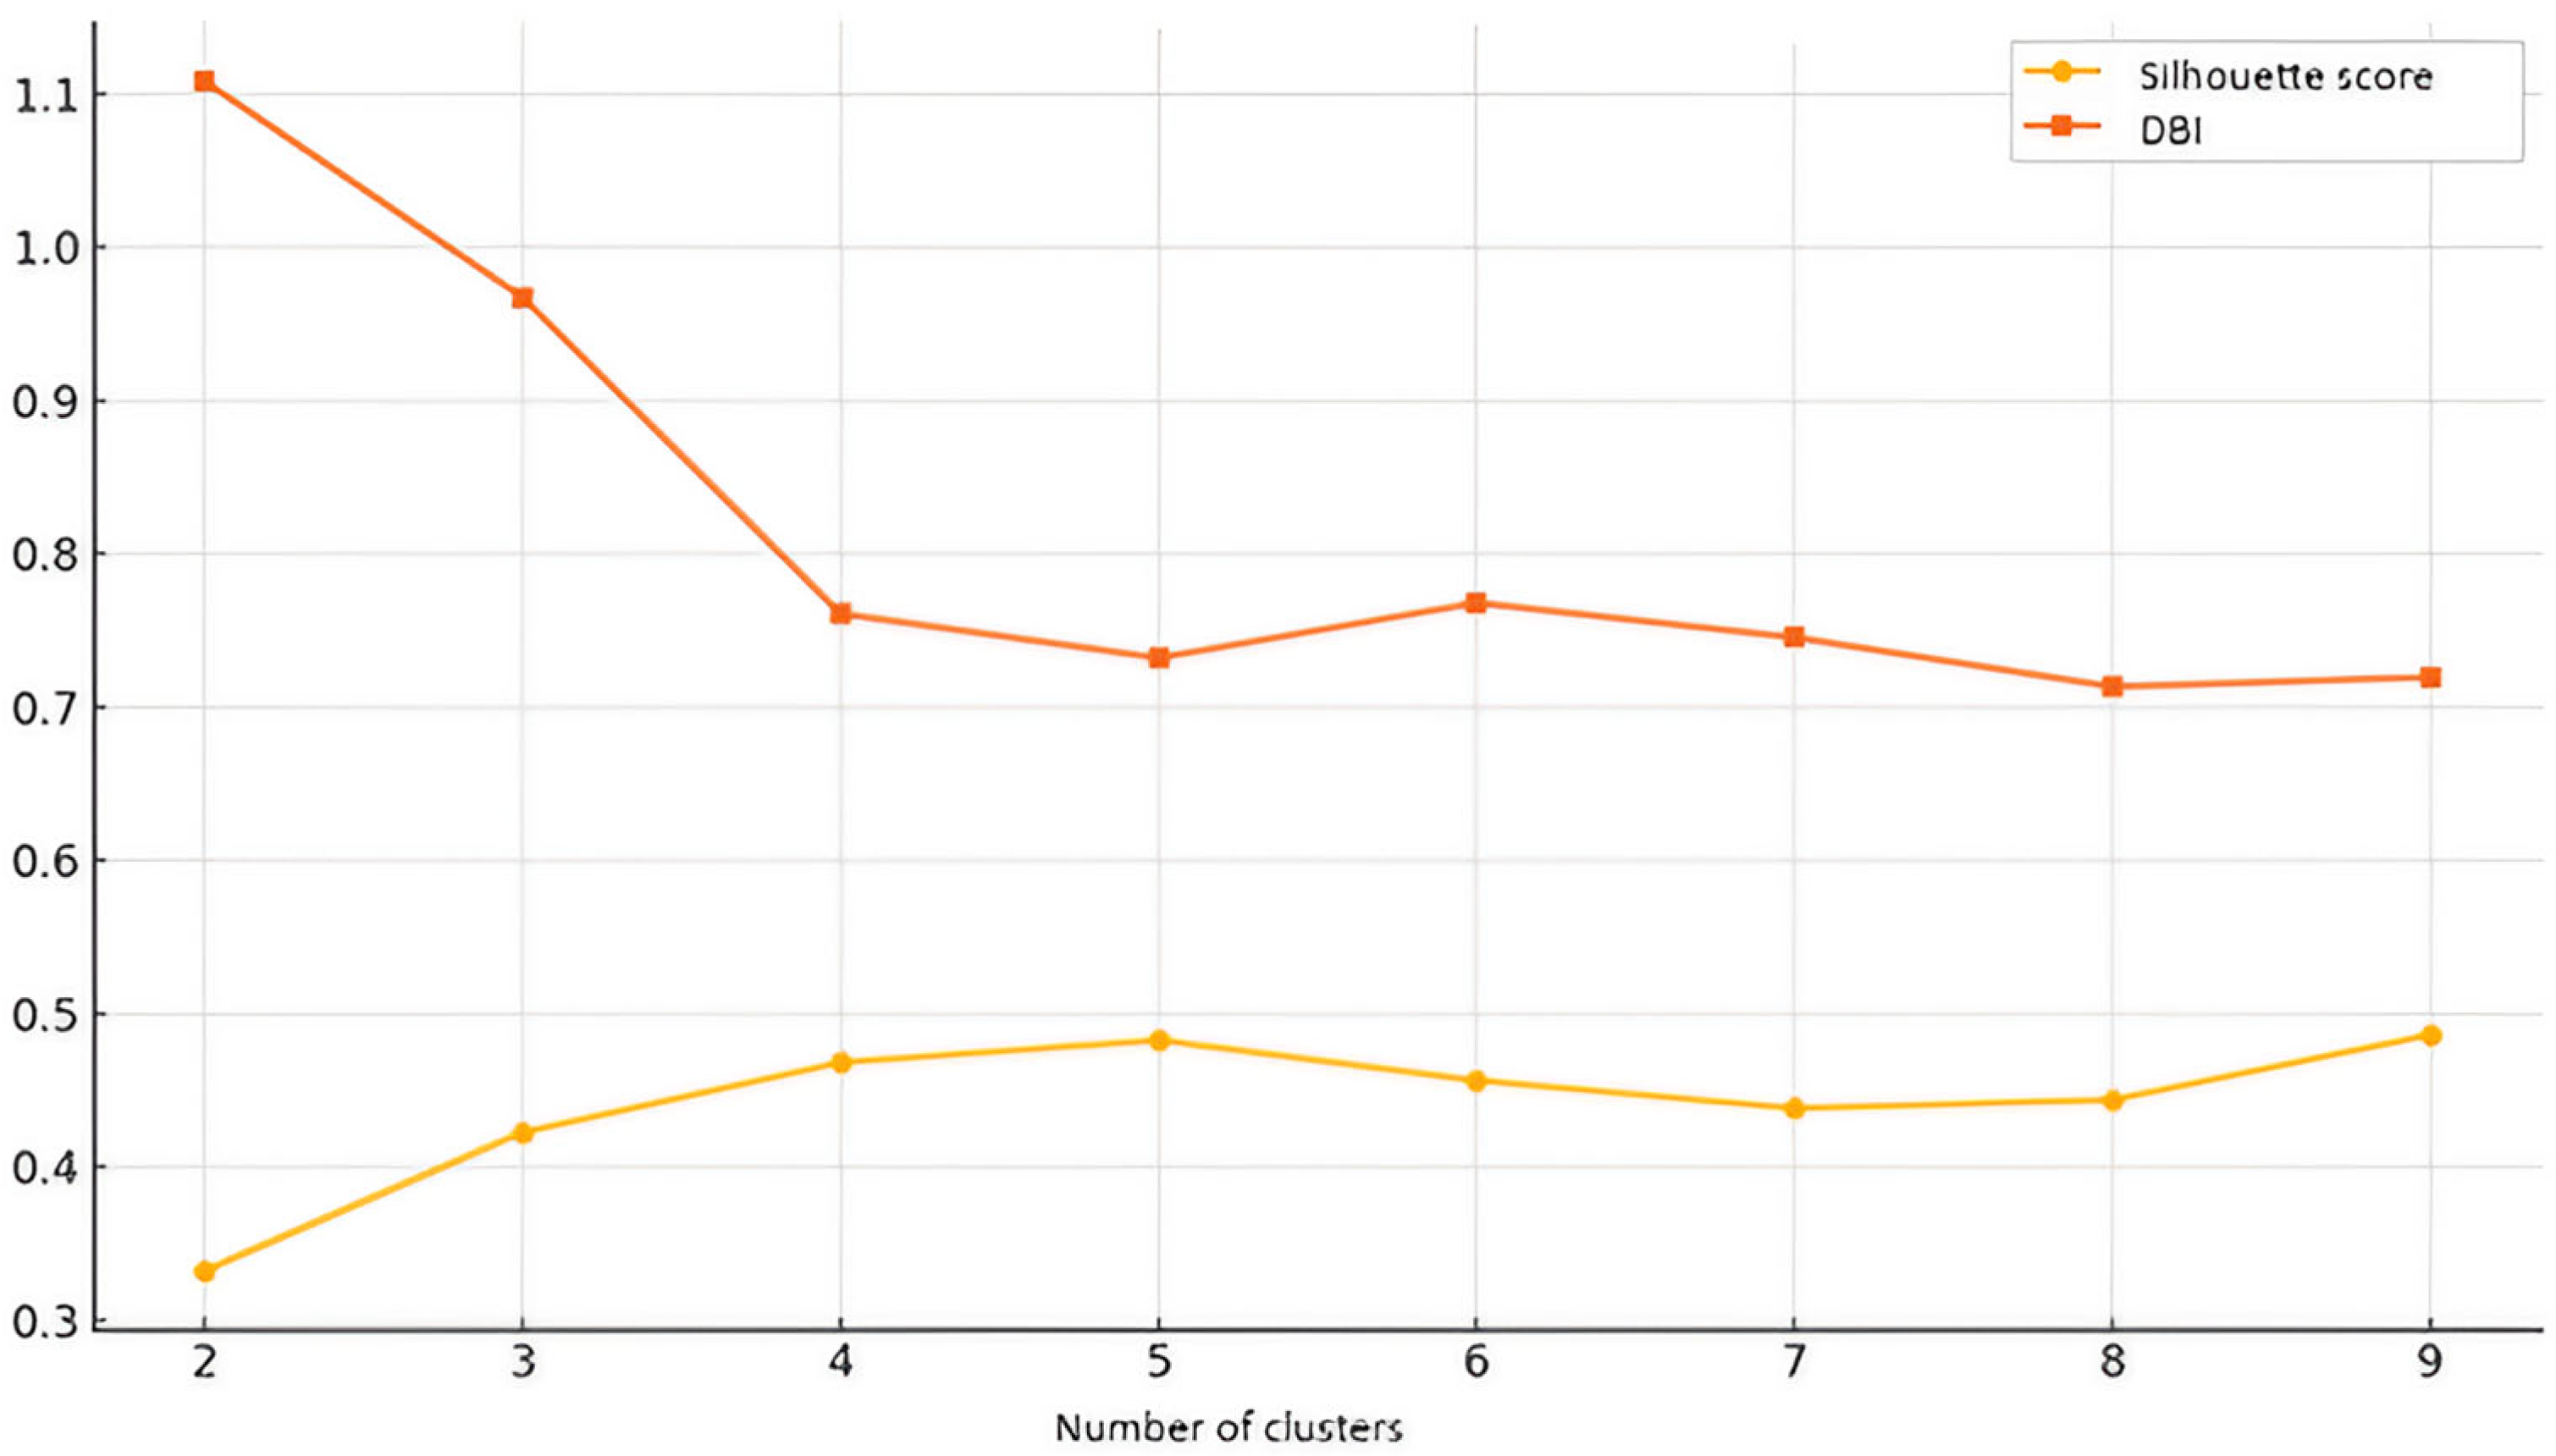
The second set of results focuses on students’ task completion behaviors by clustering them according to the percentage of tasks completed. The following table compares the clustering results for different numbers of clusters (k = 2 to 9) using the Silhouette score (higher is better) and the Davies–Bouldin index (lower is better). These metrics help to evaluate the quality of clustering solutions. Optimal values are highlighted.
Figure 3 is a visualization of
Table 2. It shows how the Silhouette score and Davies–Bouldin index vary across different numbers of clusters.
The optimal number of clusters for the second analysis is k = 5, as determined by analyzing both the Silhouette score and the DBI. While the Silhouette score peaks at k = 9 (0.4861), the increase in separation is marginal compared to k = 5 (0.4826). The choice of k = 5 is preferred because it maintains a high Silhouette score while ensuring better interpretability and avoiding unnecessary complexity.
The Davies–Bouldin index (DBI) further supports this conclusion, as k = 5 has the lowest DBI (0.7320), suggesting that the clusters are compact and well-separated. Although k = 8 has a slightly lower DBI (0.7132), its Silhouette score (0.4437) is significantly lower than that of k = 5, suggesting that although the clusters are tight, they are not as well separated as k = 5. As both metrics for clustering quality indicate that k = 5 provides an excellent balance between separation, compactness, and interpretability, this remains the most statistically justified choice. Further increasing the number of clusters does not significantly improve the clustering quality, so k = 5 is the most efficient and interpretable solution for this analysis.
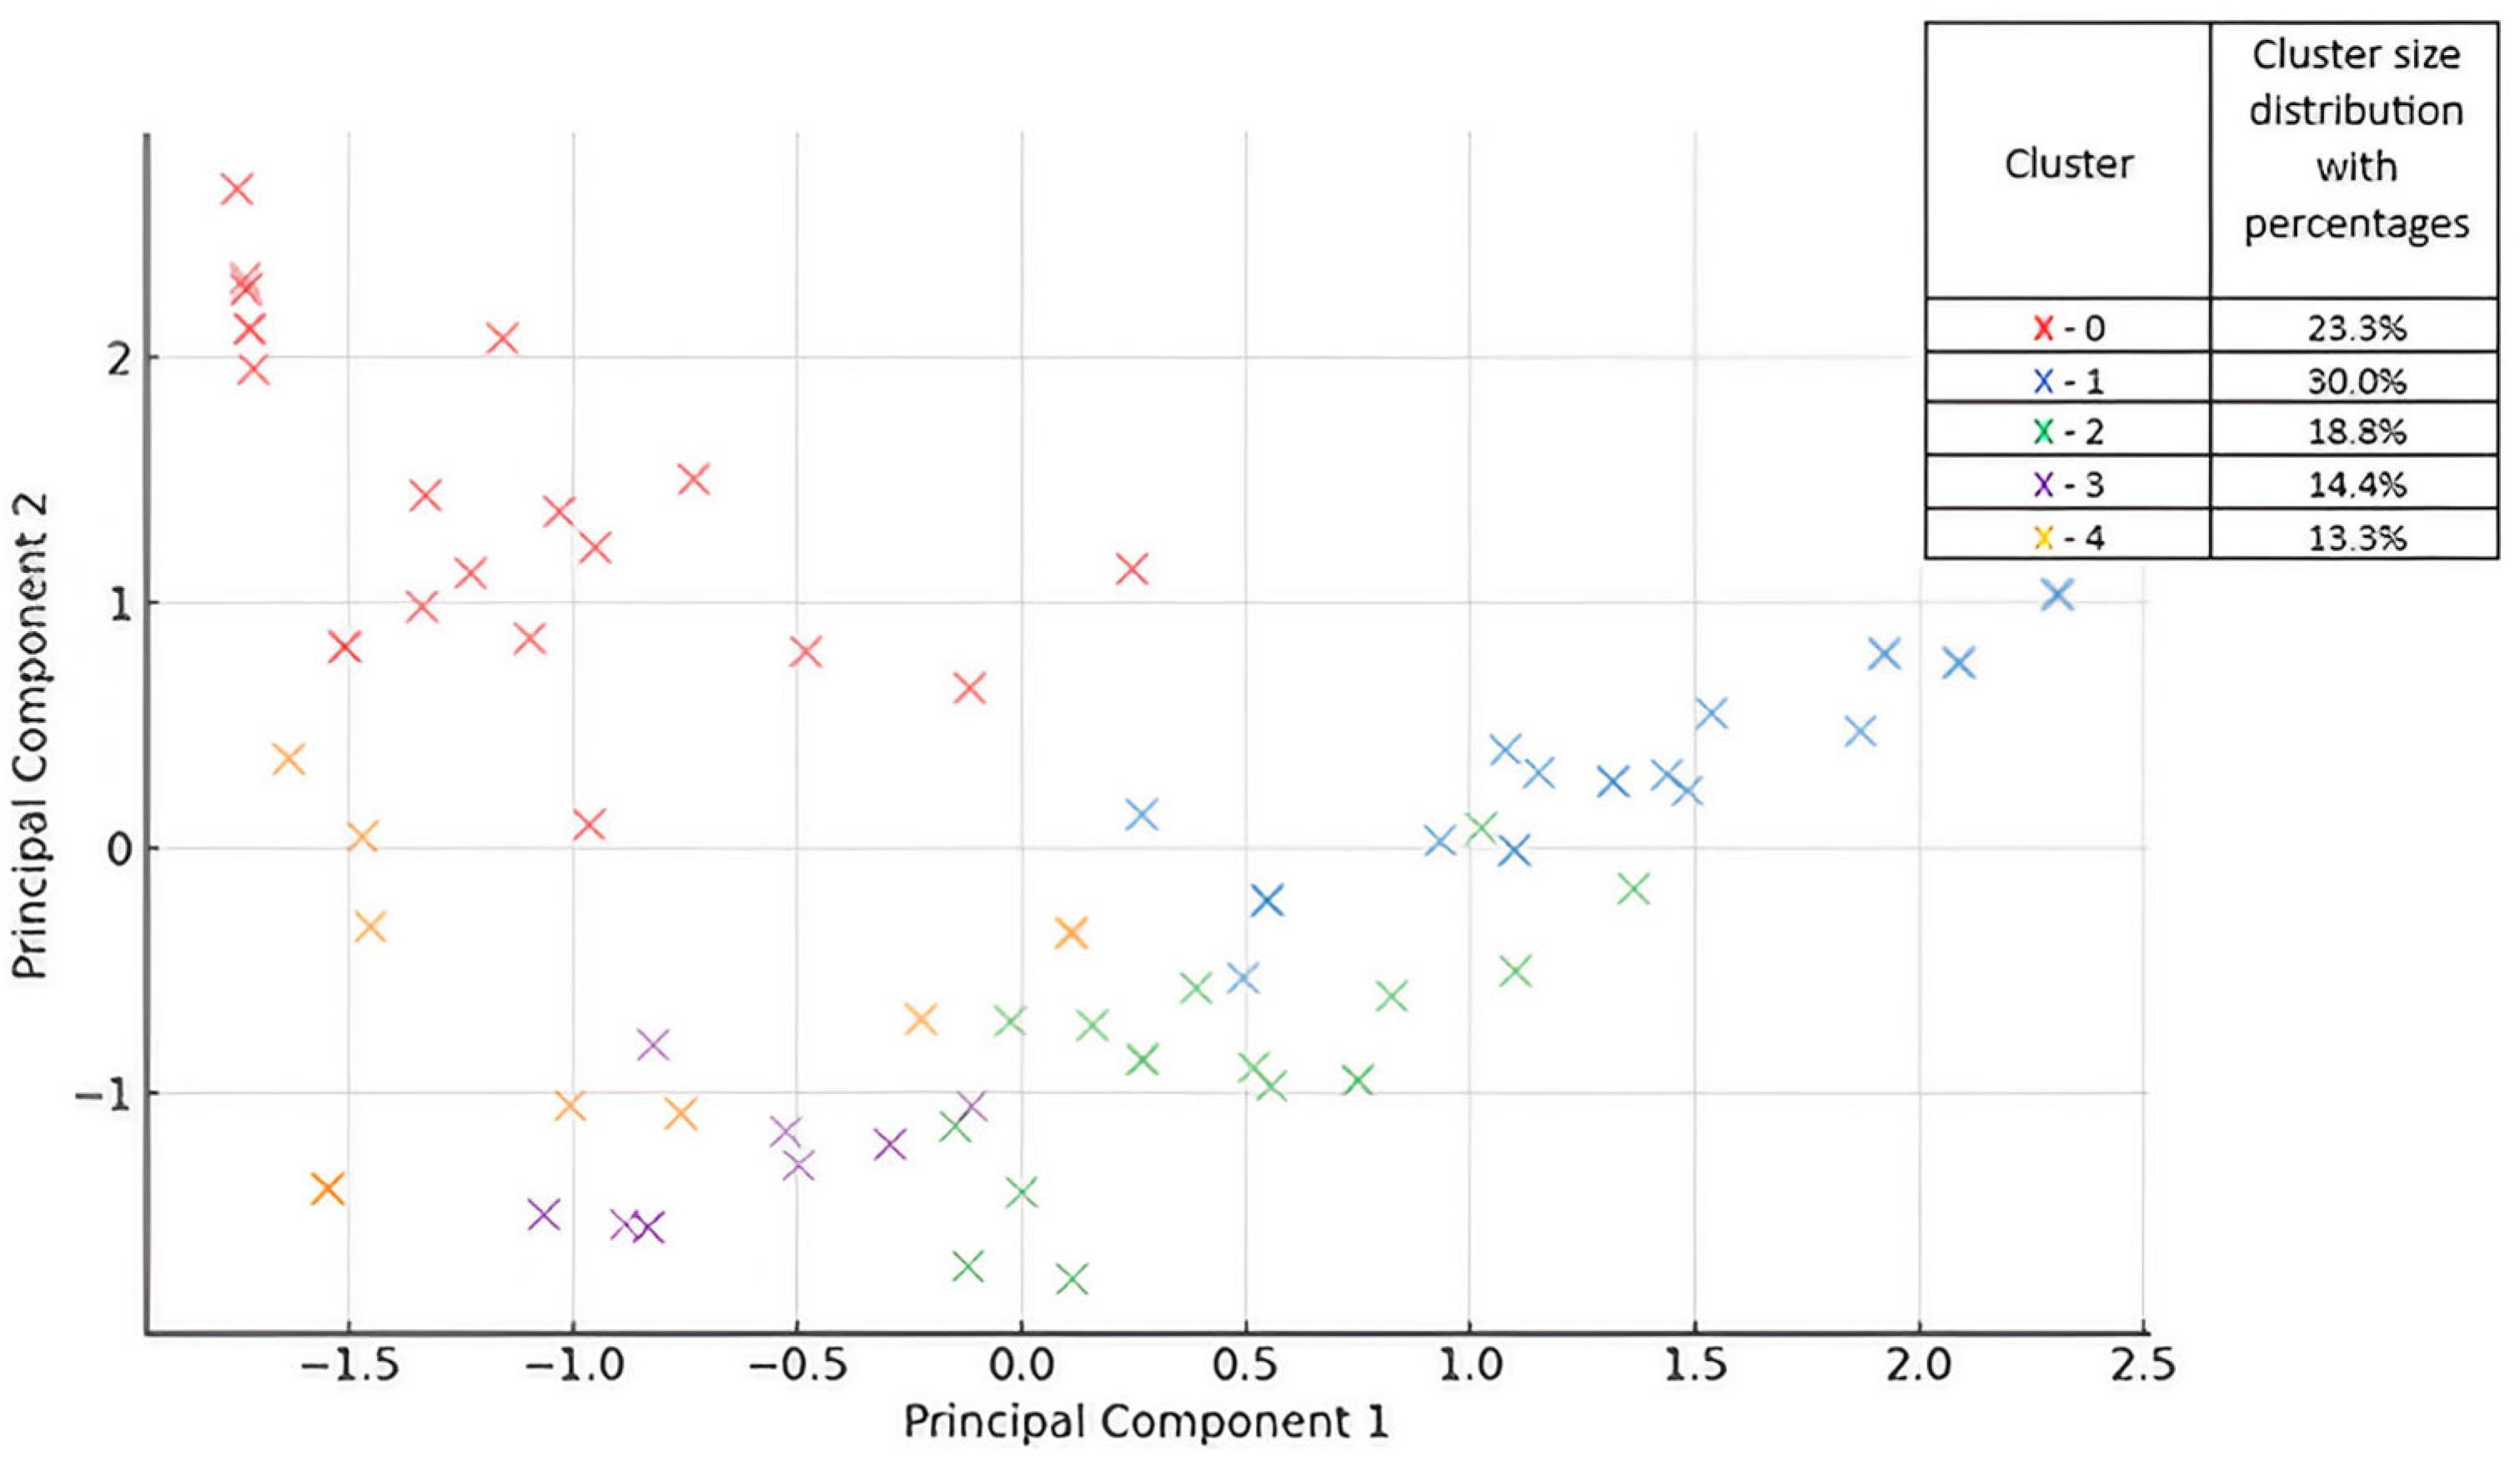
Figure 4 shows a visual representation of the clusters obtained using the K-Means algorithm with k = 5. Each point represents a student colored according to the cluster assigned to them. This 2D visualization illustrates the grouping of students based on their percentage of task completion. Principal component 1 (PC1), which explains 38.1% of the variance, reflects a contrast between the students with low task completion (0–30%) and those who achieved high or exceptional completion rates (70–100% and over 100%). The students with higher PC1 values completed fewer tasks, while those with lower values exceeded expectations. Principal component 2 (PC2), accounts for 32.1% of the variance and separates overachievers from the moderate and consistent performers and captures the differences among the more engaged students. Cumulatively, these components retain 70.2% of the total variance in the original multidimensional data. They provide a simplified and interpretable 2D view of student engagement and the contrast between underperformance and overachievement.
From a statistical perspective, PC1 and PC2 represent the two linear combinations of the original features that capture the greatest variation in the data, with PC1 reflecting the dominant axis of behavioral variation. PC2 introduces an orthogonal dimension, enabling additional structures among high-performing students to be distinguished.
This analysis examined students’ task completion behavior by grouping them according to the percentage of tasks completed. The use of five clusters allows for a more detailed classification of students and the identification of different engagement patterns and work strategies.
Cluster 0 consists mainly of students who could be classified as overachievers. The vast majority (over 90%) complete more than 100% of their assigned tasks, indicating exceptional engagement and motivation. Cluster 1 represents students with very low engagement, as all of them completed less than 30% of their tasks, suggesting that they may need additional support or motivation. Cluster 2 includes students with moderate engagement, most of whom completed between 30% and 70% of their assignments, suggesting a balanced but cautious approach. Cluster 3 and cluster 4 both include high-performing students who completed between 70% and 100% of their tasks. However, while cluster 4 consists entirely of students who are consistently in this high completion range, cluster 3 is slightly more diverse, with around 69% of its members achieving this level of completion. Overall, the clusters provide a clear insight into the different levels of student engagement and task completion behaviors, ranging from minimal effort to exceeding expectations.
4.3. Third Analysis
The last set of results combined data from the first two to focus on the students’ task completion percentages over the given time intervals.
Table 3 compares the clustering results for different numbers of clusters (k = 2 to k = 9) using the Silhouette score (higher is better) and the Davies–Bouldin index (lower is better). These metrics help to evaluate the quality of clustering solutions. Optimal values are highlighted.
Figure 5 is a visualization of
Table 3. It shows how the Silhouette score and Davies–Bouldin index vary across different numbers of clusters.
The optimal number of clusters for this analysis is k = 6. The Silhouette score, which measures how well-separated and cohesive the clusters are, peaks at k = 6 (0.3332), indicating that six clusters provide the best balance between intra-cluster cohesion and inter-cluster separation. Lower values for k = 2, k = 3, and k = 4 suggest that fewer clusters lead to overlapping and less-well-defined groups, while k = 5 has a similar Silhouette score (0.3284) but offers no significant improvement over k = 6, making six clusters a more efficient choice. The DBI supports this conclusion, as k = 6 had the lowest DBI (1.0426), indicating that the clusters were the most compact and separated at this level. The DBI of k = 5 is close (1.0512), but the difference is minimal, and k = 6 remains a more interpretable choice, as further increasing the number of clusters does not significantly improve the quality of clustering. The higher DBI values for k = 2, k = 3, and k = 4 indicate that these clusters were more dispersed and less well defined. Since both metrics for clustering quality indicate that six clusters provide the best separation, compactness, and interpretability, the solution k = 6 is the optimal balance between accuracy and complexity and, thus, the most statistically justified choice.
The results of using the K-Means clustering algorithm are presented in
Figure 6. In
Figure 6, PCA was applied to project the combined timing and task completion onto a 2D space for visualization. Principal component 1 (PC1), explaining 30.2% of the variance, represents a spectrum from students who complete tasks consistently during the middle of the period and within the expected range (70–100%) to those who concentrate activity in the final days (12–15). Students with high PC1 scores tend to demonstrate steady engagement, while lower scores suggest last-minute completion behaviors. Principal component 2 (PC2), accounting for 22.7% of the variance, distinguishes between the students with minimal engagement (strongly negative for 0–30%) and those who are highly proactive or overachieving (positive for >100% and days 1–4). Taken together, they retain 52.9% of the total variance and provide a simplified but informative view of student engagement strategies, balancing both time management and task completion effectiveness.
Statistically, PC1 and PC2 represent the two primary axes that explain the largest share of variation across both the timing and performance variables. PC1 reveals the dominant behavioral spectrum of when and how consistently the students complete tasks, while PC2 introduces a complementary dimension that highlights outliers in both under- and over-performance.
4.4. Activity Patterns and Identified Learner Personas
Based on K-Means clustering with k = 6, the students were categorized into six different clusters based on their percentage of task completion in the given time intervals. These clusters represent different patterns of engagement and performance in completing the tasks.
Cluster 0 (21.11%) showed consistent activity during the middle and final time windows (days 5–11 and 12–15). A high proportion of their work was completed, in the 70–100% range, suggesting steady and efficient task completion. These students can be described as timely and goal-oriented. The students in cluster 1 (18.89%) were mainly active at the end of the task period (days 12–15), while they were hardly engaged before. Their task completion was mostly in the 30–70% range, indicating late starters with moderate success. Cluster 2 (20.00%) was moderately active in the middle and end of the period, but showed low task completion overall, especially with a strong concentration in the 0–30% range. These students may be low performers who were engaged but did not complete the tasks effectively. Students in cluster 3 (17.78%) were also the most active in the last few days. However, in contrast to cluster 1, the majority exceeded the expected task volume, with 68% completing more than 100% of the assigned tasks. This behavior identifies them as highly motivated overachievers who intensified their efforts towards the end of the task window. Cluster 4 (8.89%) was mainly active at the beginning (days 1–4), while they were less engaged in later periods. Their task completion spanned all the performance ranges, including a substantial proportion of over 100%. These students can be categorized as early and ambitious performers, demonstrating a proactive and independent approach. Students in cluster 5 (13.33%) focused almost all of their activity on the last period (days 12–15), but their task completion remained low, with 80% falling in the 0–30% range. This group can be considered late starters with minimal results who may have difficulty managing their time or motivation effectively.
To further interpret the clustering results, each of the six identified clusters (N = 6) was matched to a learner persona based on patterns of task completion and activity timing.
Table 4 summarizes this mapping, matching the profiles with the learner personas. This mapping allows the quantitative results of the clustering analysis to be embedded in a pedagogical context, providing educators with a clearer understanding of how distinct engagement patterns relate to students’ habits.
4.5. Proposed Personalized Interventions for Identified Learner Personas
Based on the results of the data analysis and identified learner personas, personalized interventions are proposed.
Table 5 outlines the key characteristics of each identified persona and suggests targeted interventions aligned with their characteristics and engagement patterns. To illustrate the practical applications within the educational recommender system, example recommendations are also provided for each persona. As a first step, personalized prompts for GenAI tools (based on student activity and performance data) were created to motivate students and prepare them for further personalized interventions tailored to their learner persona characteristics. However, recent advancements in GenAI user interface designs, such as the integration of multimodal inputs (text, images, video, and audio) [
44], as well as the adaptive user interfaces deployed across various platforms [
45], are likely to diminish the relevance of text-only interaction through elaborate prompts. Although prompt engineering, as used in this research, remains the most widely used method at present, there are indications that it may become a transitional skill [
46].
5. Discussion
The results of this study provide valuable insights into student engagement patterns within the ELARS system and highlight the potential of clustering techniques in the development of personalized learning interventions. The research questions of the study guided the exploration of engagement patterns, the application of clustering techniques, and the development of adaptive interventions.
In response to RQ1 (“What distinct patterns of task completion behavior, based on time and number, can be identified in student activity data from the ELARS system?”), the results indicated that student behavior varied significantly on both dimensions. Some students were consistently active throughout the 15-day period, while others concentrated their efforts either at the beginning or just before the deadline. Additionally, the volume of task completion ranged from very low to a percentage higher than expected, suggesting large differences in engagement, effort, and possibly motivation.
In addressing RQ2 (“How can these behavioral patterns be clustered to support the development of data-driven learner personas?”), the application of K-Means clustering enabled the identification of six distinct groups, each reflecting a particular engagement pattern. These clusters included students who worked continuously, those who worked intensively near deadlines, early proactive learners, and underperformers with minimal activity. The clustering results were validated against internal evaluation metrics and confirmed that six clusters provided the best balance between cohesion and separation. This highlights the robustness of clustering techniques in the analysis of educational data and the value of applying learning analytics to optimize personalized learning environments.
Regarding RQ3 (“In what ways can the identified learner personas inform the design of personalization interventions—recommendations?”), each cluster was translated into a learner persona and paired with tailored interventions. These recommendations were tailored to each cluster’s behavioral patterns and provided support strategies, such as timely prompts, planning tools, extended activities, peer collaboration, and gamified elements. This process illustrates how clustering not only uncovers meaningful insights about behavior but also provides a practical foundation for improving personalization in an e-learning environment.
To ensure that the proposed personalized interventions were not only data-driven but also pedagogically grounded, their design was based on well-established motivational theories and instructional frameworks relevant to STEM education. Since motivation plays a critical role in learning by influencing students’ engagement, persistence, and academic performance [
10,
35], effective strategies are needed to support students’ sense of relevance, control, and confidence in their ability to succeed [
47,
48]. These elements are especially important in STEM disciplines, where learners often face complex and abstract content.
Motivational strategies have evolved alongside advances in learning technologies, shaping how personalized support is delivered in modern learning environments. Instructional models based on learning styles [
9] and active online learning approaches such as e-tivities [
49] provide effective frameworks for engaging students in digital and blended settings. The rise of blended learning has also enabled the integration of formative e-assessment and personalized feedback systems [
50,
51], which support sustained motivation by offering timely, targeted interventions adapted to learner needs. Building on these foundations, the present study links system-generated behavioral patterns to tailored recommendations, operationalizing pedagogical and theoretical principles in a scalable and practical way. All the personalized interventions, ranging from GenAI-based prompts to planning tools, gamified challenges, and peer-based activities, were carefully designed to align with established learning theories and instructional models. Self-regulated learning (SRL) theory underpins many of the strategies focused on planning, monitoring, and reflection, including interventions that support time management, goal setting, and self-assessment. Motivational frameworks, such as Keller’s ARCS model and Expectancy-Value Theory (EVT), guide the use of gamified elements, timely feedback, and manageable tasks aimed at increasing learners’ confidence, engagement, and perceived relevance. Metacognitive scaffolding is reflected in prompts and tools that encourage students to evaluate their learning strategies and collaborate with peers, fostering awareness and autonomy. Together, these frameworks provide a strong theoretical foundation for the personalized interventions proposed in the study, ensuring they are not only grounded in learner data, but also in evidence-based educational practice.
The six identified learner personas are aligned with key components of these motivational frameworks. Last-minute underperformers are associated with low expectancy and a high perceived cost in EVT and would benefit from strategies that support confidence and relevance (ARCS) and planning and time management (SRL). Low-engagement students show a low intrinsic value and utility according to EVT and require increased attention and confidence (ARCS) and prompts for self-monitoring (SRL) to maintain engagement. Late moderate achievers show moderate expectancy and utility, with confidence and relevance (ARCS) being the key motivators. They also benefit from pacing guides and peer collaboration aligned with SRL principles. Consistent performers demonstrate high expectancy and intrinsic value (EVT) and strong confidence and satisfaction (ARCS). They are also supported by SRL strategies such as reflection and goal setting to maintain progress. High-achieving finishers are characterized by high expectancy and attainment value (EVT) and are best supported by satisfaction and relevance strategies (ARCS). SRL elements such as strategic challenges and peer mentoring can also help to support their learning. Early proactive performers exhibit high intrinsic value and high utility value at a low perceived cost (EVT) and benefit from attention, relevance, and satisfaction (ARCS), as well as autonomy-enhancing practices consistent with SRL. As shown in
Table 5, personalized interventions were developed for each persona to address their different motivational needs using the combined components of EVT, ARCS, and SRL.
This study contributes to the field of learning analytics by demonstrating how clustering techniques can reveal distinct engagement patterns and support the development of personalized instructional strategies. It also highlights the value of learning analytics in identifying meaningful trends in student behavior and illustrates how unsupervised learning can support the development of responsive e-learning systems. While the study aligns with previous research on learning analytics and personalized education, it offers new insights by identifying nuanced behavioral clusters and incorporating real-time data to inform adaptive interventions. Several previous studies have successfully used clustering and learning analytics to examine student behavior, and this study builds on and extends those efforts. Li et al. [
52] and Nafuri et al. [
53] applied clustering techniques to large-scale behavioral and demographic data to categorize students into different groups. The primary aim of both studies was to gain insights at an institutional or policy level, e.g., to identify students at risk, detect anomalies, or support administrative decisions. In contrast, the present study focuses on personalization at the course level by identifying six learner personas with the goal of supporting individualized instructional interventions. Similarly, Sari et al. [
54] and Aggarwal & Sharma [
55] have used clustering to group students according to academic performance indicators, such as exam scores and assignment results, with the aim of assessing learning outcomes or segmenting learners by their achievement level. However, these studies have not extended their clustering results to enable personalized interventions through the direct application of clustering results in course-level teaching. The present study uses system-generated activity logs, providing a more objective and scalable approach. In addition, it provides a more detailed analysis by considering both the timing and the number of tasks completed, allowing for a multidimensional understanding of student engagement.
This study makes a theoretical contribution by combining data-driven behavioral clustering with established motivational and instructional theories to guide the development of meaningful learner personas and a practical contribution by suggesting targeted interventions and GenAI prompts aligned with these personas for use in educational recommender systems. These contributions support the advancement of personalized learning in digital contexts while offering a pedagogically sound approach to learner modeling and adaptive support.
6. Limitations and Recommendations
While this study provides valuable insights into student engagement patterns using ELARS activity data, some limitations should be considered when interpreting the results. The sample size (N = 90) was sufficient for exploratory clustering, but the results may not be fully generalizable due to limited diversity and a pronounced gender imbalance (88 males, 2 females). Future research with larger and more balanced populations would help to validate the robustness and broader applicability of the identified learner profiles. Clustering was based on two behavioral dimensions, the amount of task completion and timing, that were intentionally selected to meet the study’s goal of identifying engagement-driven learner personas. While these categories provided a clear view of student interaction patterns, this approach did not include additional dimensions, such as prior academic performance or motivational factors. Exploring these categories in future research could support the development of multi-layered learner models, especially in studies aiming to capture a broader range of learning influences. Finally, the dataset combined student activity data from different academic years and courses, so future studies should consider analyzing more homogeneous course samples.
6.1. Recommendations for Teachers
Teachers are encouraged to use learner personas derived from behavioral engagement profiles to inform and adapt their instructional strategies. These personas, based on the amount and timing of task completion, can help identify different levels and styles of student engagement throughout the course. Teachers should consider integrating these findings into their planning to differentiate support, adjust pacing, and provide more targeted formative feedback. Although the personas reflect behavioral rather than motivational or cognitive factors, they provide a valuable starting point to better address diverse learning needs and promote self-directed learning.
6.2. Recommendations for Developers of Education Systems
Developers of educational systems that support personalized learning are recommended to integrate learner personas as part of their analytics and recommendation capabilities. These personas, derived from student engagement, should be linked to adaptable intervention options that teachers can tailor to their specific teaching context. Integrating visual dashboards that display personas and summarize engagement trends can increase system transparency and facilitate informed decisions for teachers and learners. Ensuring that these features are pedagogically meaningful can help education systems to provide better support for self-directed and data-driven learning experiences.
6.3. Recommendations for Educational Institutions
Educational institutions should support the use of learning analytics as part of their overall efforts to personalize learning. Providing teachers with access to engagement data and learner personas will enable them to develop more targeted and responsive teaching strategies. Institutions should offer training on the effective use of learning data to inform instructional practices and promote the integration of personalization features into existing education systems. They should also actively encourage collaboration between educators and system developers to ensure that analytics-based interventions align with curriculum goals and effectively support the needs of diverse learners.
7. Conclusions
The aim of this study was to identify patterns in student activity data from the ELARS system to support the development of learner personas and improve personalized interventions in a technology-enhanced learning environment. The development of learner personas formed the basis for designing adaptive interventions that reflect diverse learning habits and engagement routines, such as promoting early planning for last-minute learners, maintaining motivation while maintaining performance, and increasing participation for students with low engagement. GenAI prompts were included as an initial personalized intervention to engage learners and prepare them for subsequent support strategies. The prompts were designed using GenAI prompt engineering principles to ensure alignment with learner personas and pedagogical goals.
The diversity of learning habits identified highlights the limitations of one-size-fits-all approaches and emphasizes the value of adaptive strategies that address individual student needs. Personalized interventions, ranging from GenAI prompt recommendations to scaffolding techniques, can ensure that each learner receives support tailored to their profile.
It is expected that combining these insights with the student model in ELARS will enable a more dynamic and responsive approach to personalization. Future research should explore the long-term impact of these strategies and investigate the integration of advanced learning analytics methods to further enhance personalization.


