
Open-Source Photosynthetically Active Radiation Sensor for Enhanced Agricultural and Agrivoltaics Monitoring


Abstract
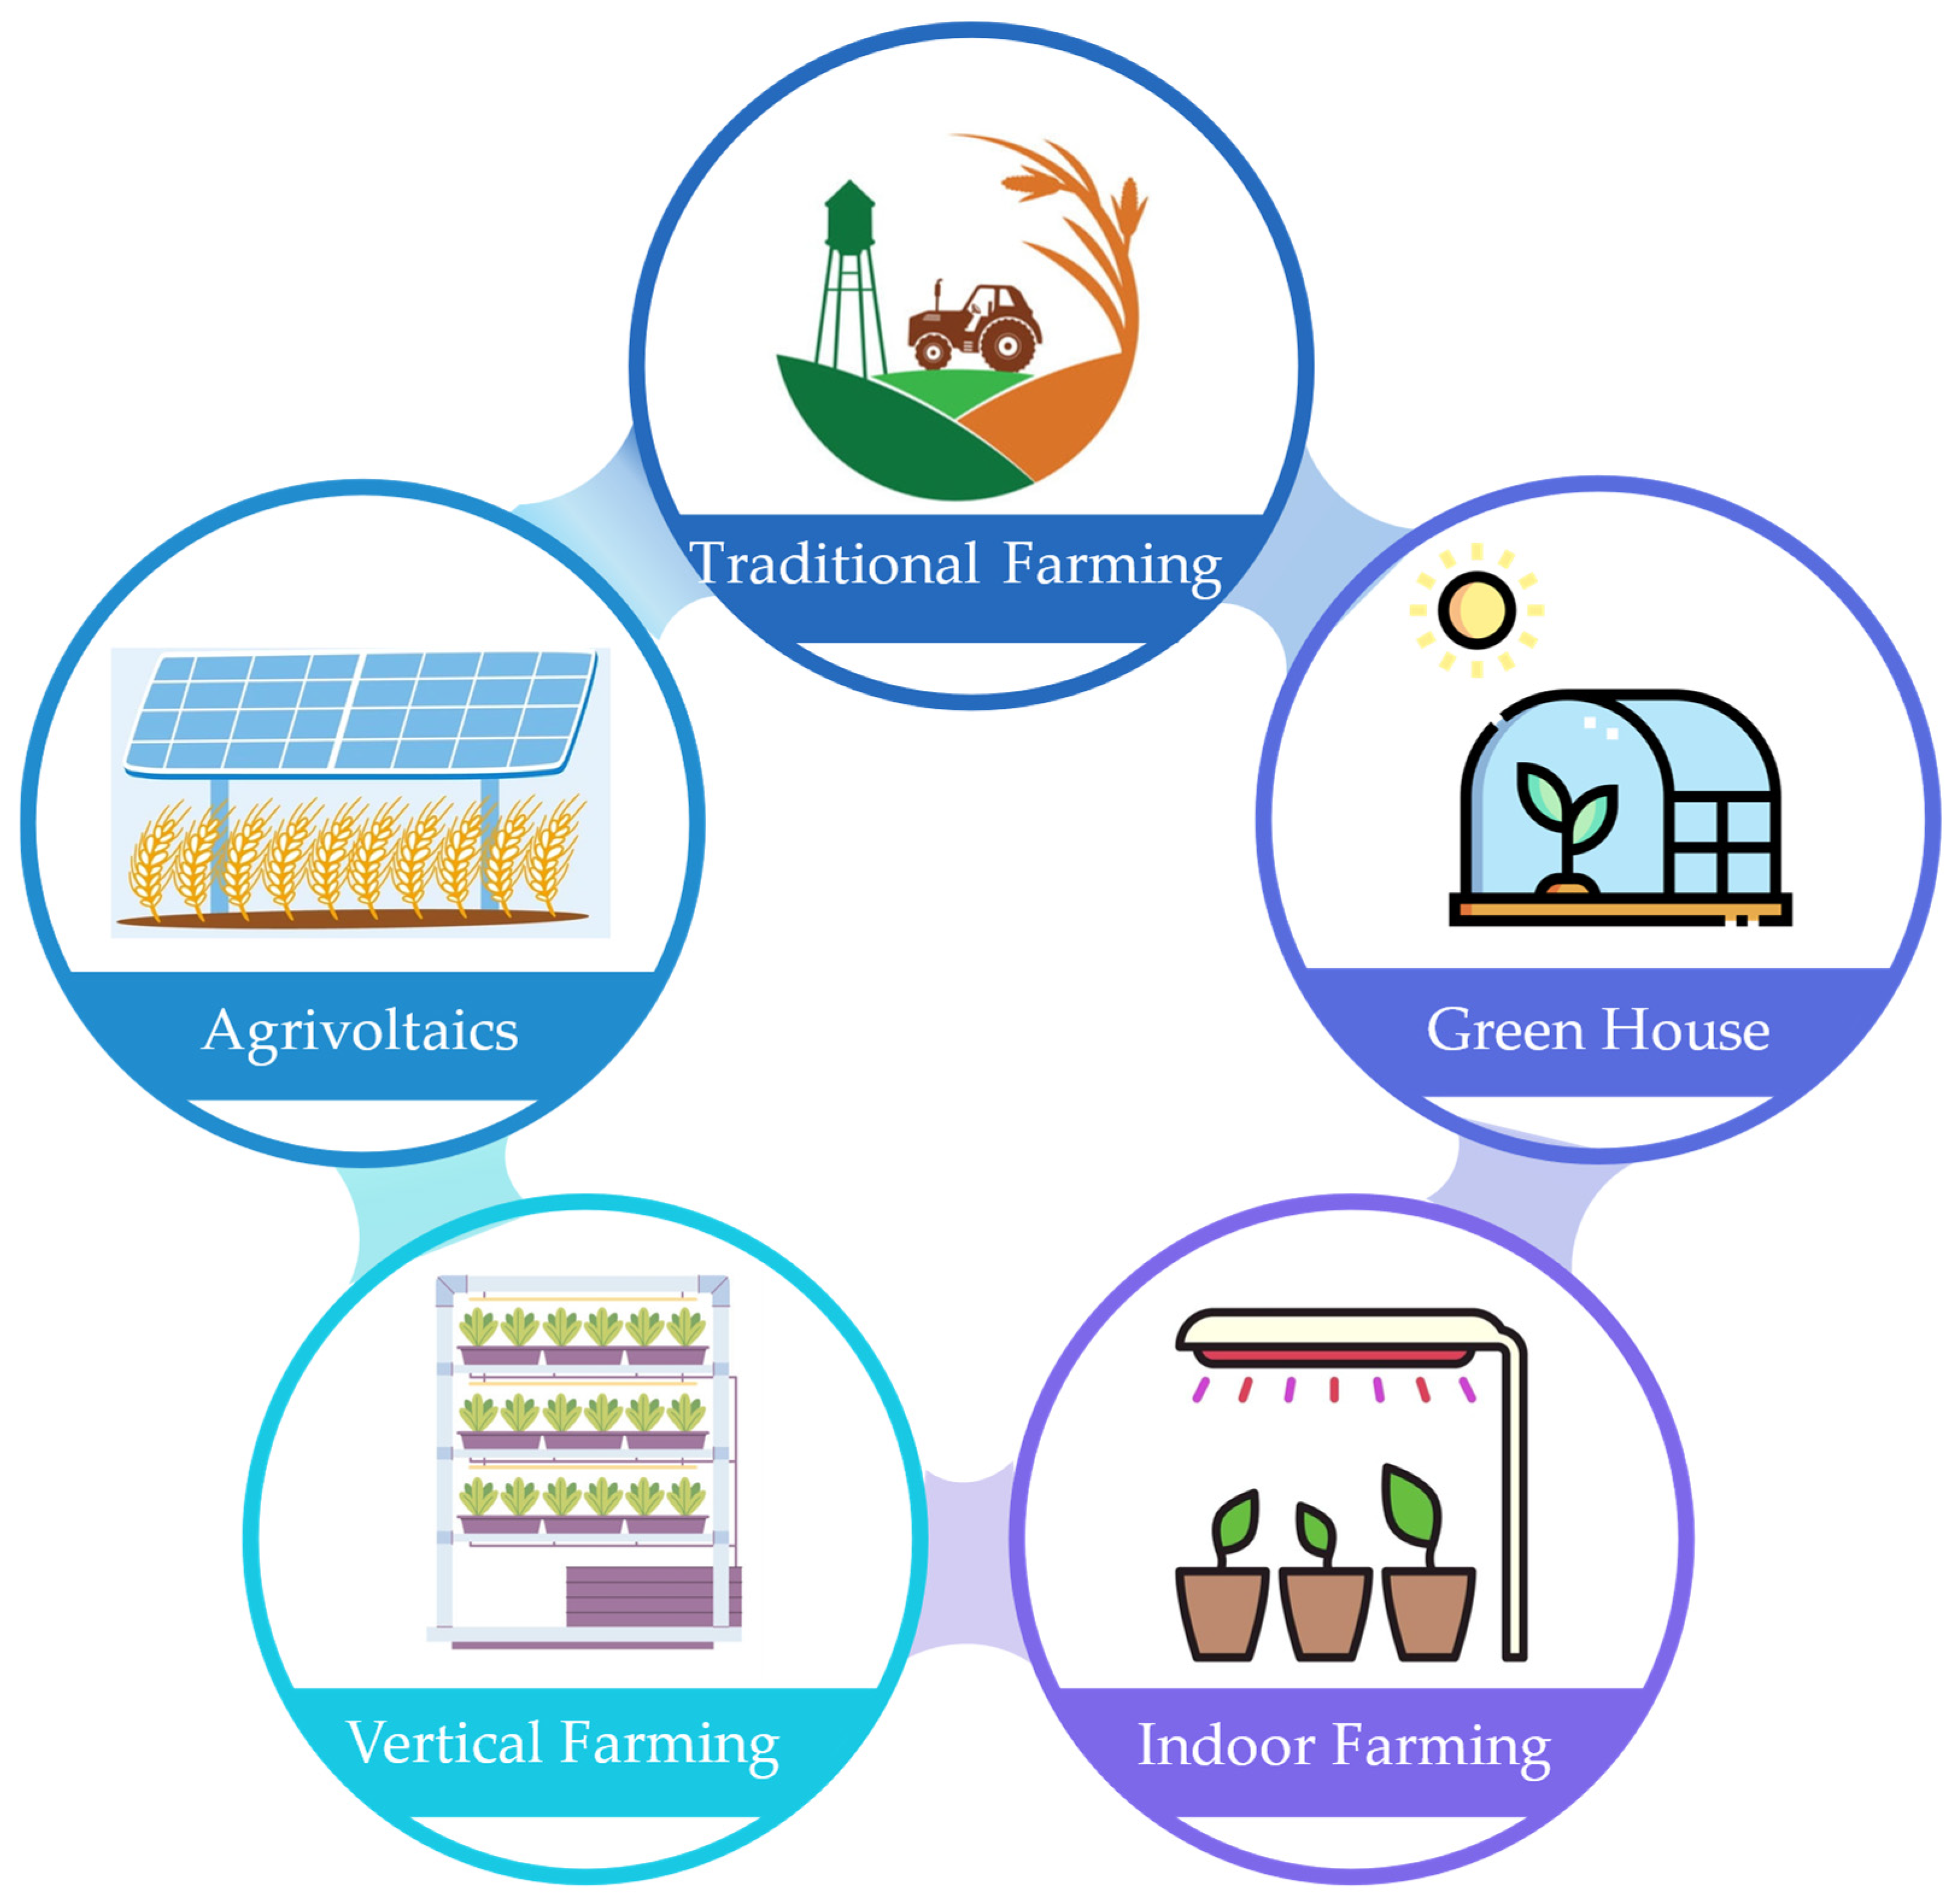
1. Introduction
2. Materials and Methods
2.1. AS7341 Sensor Description and Parameters Extraction
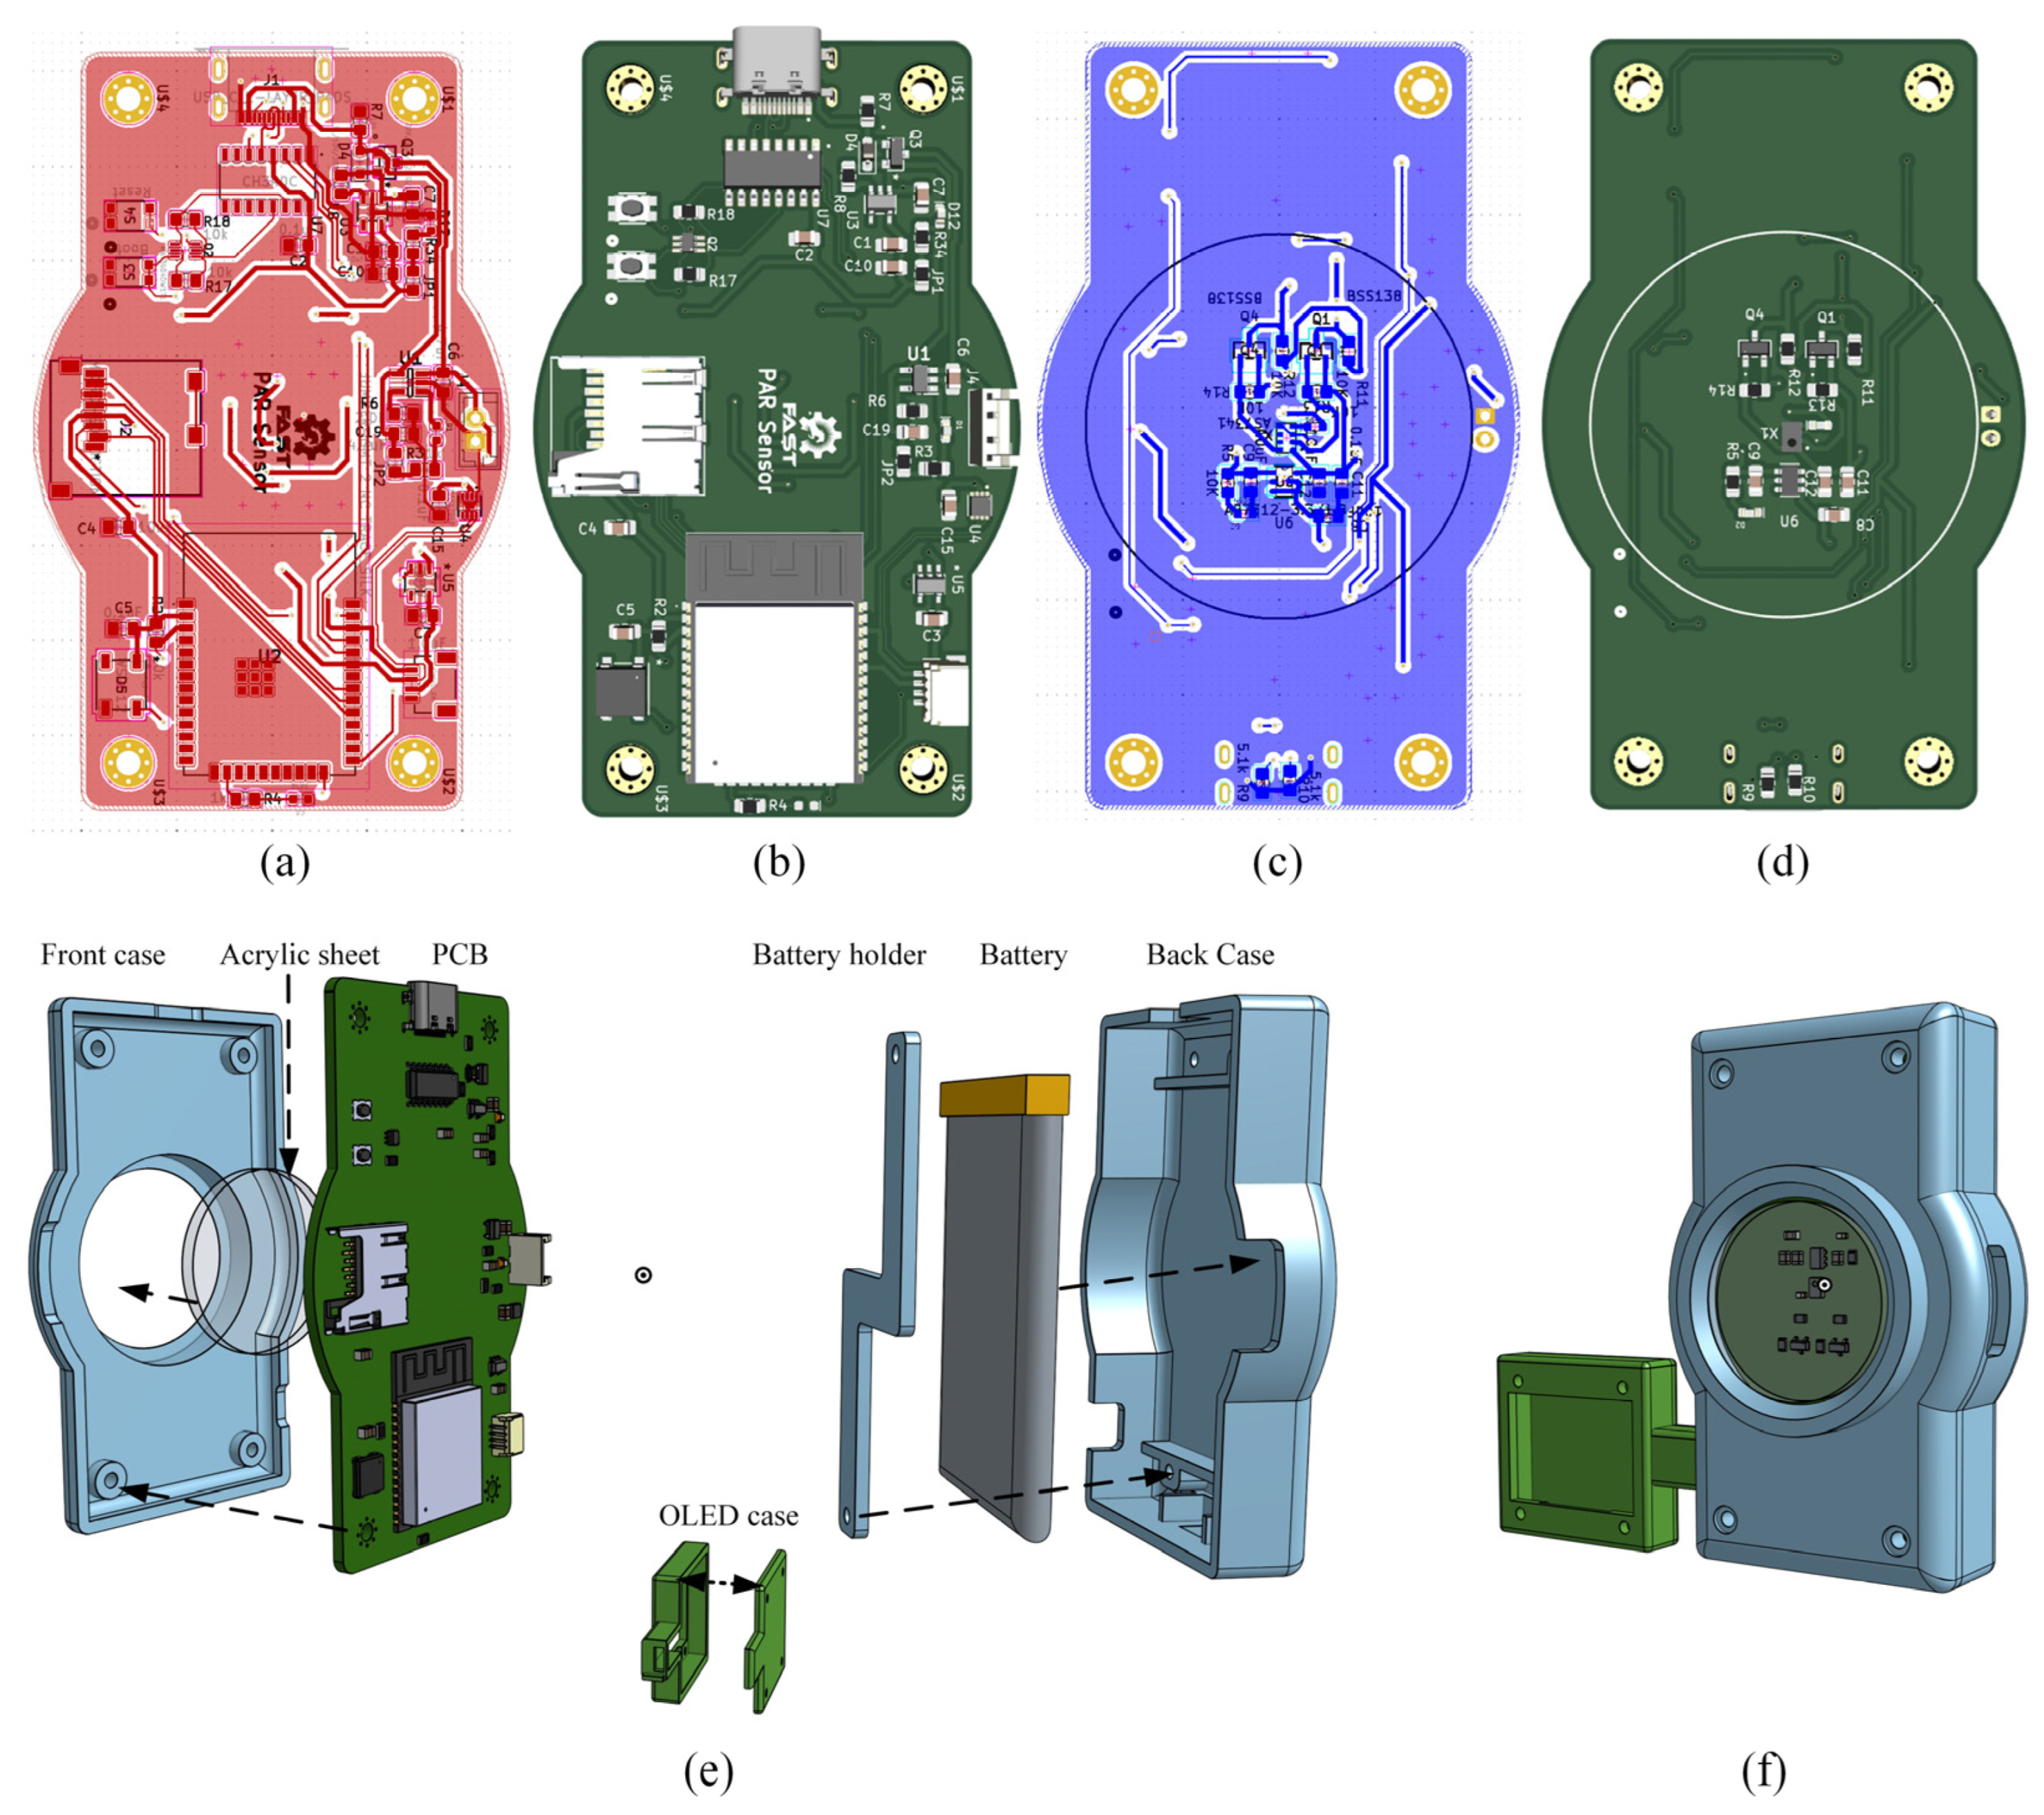
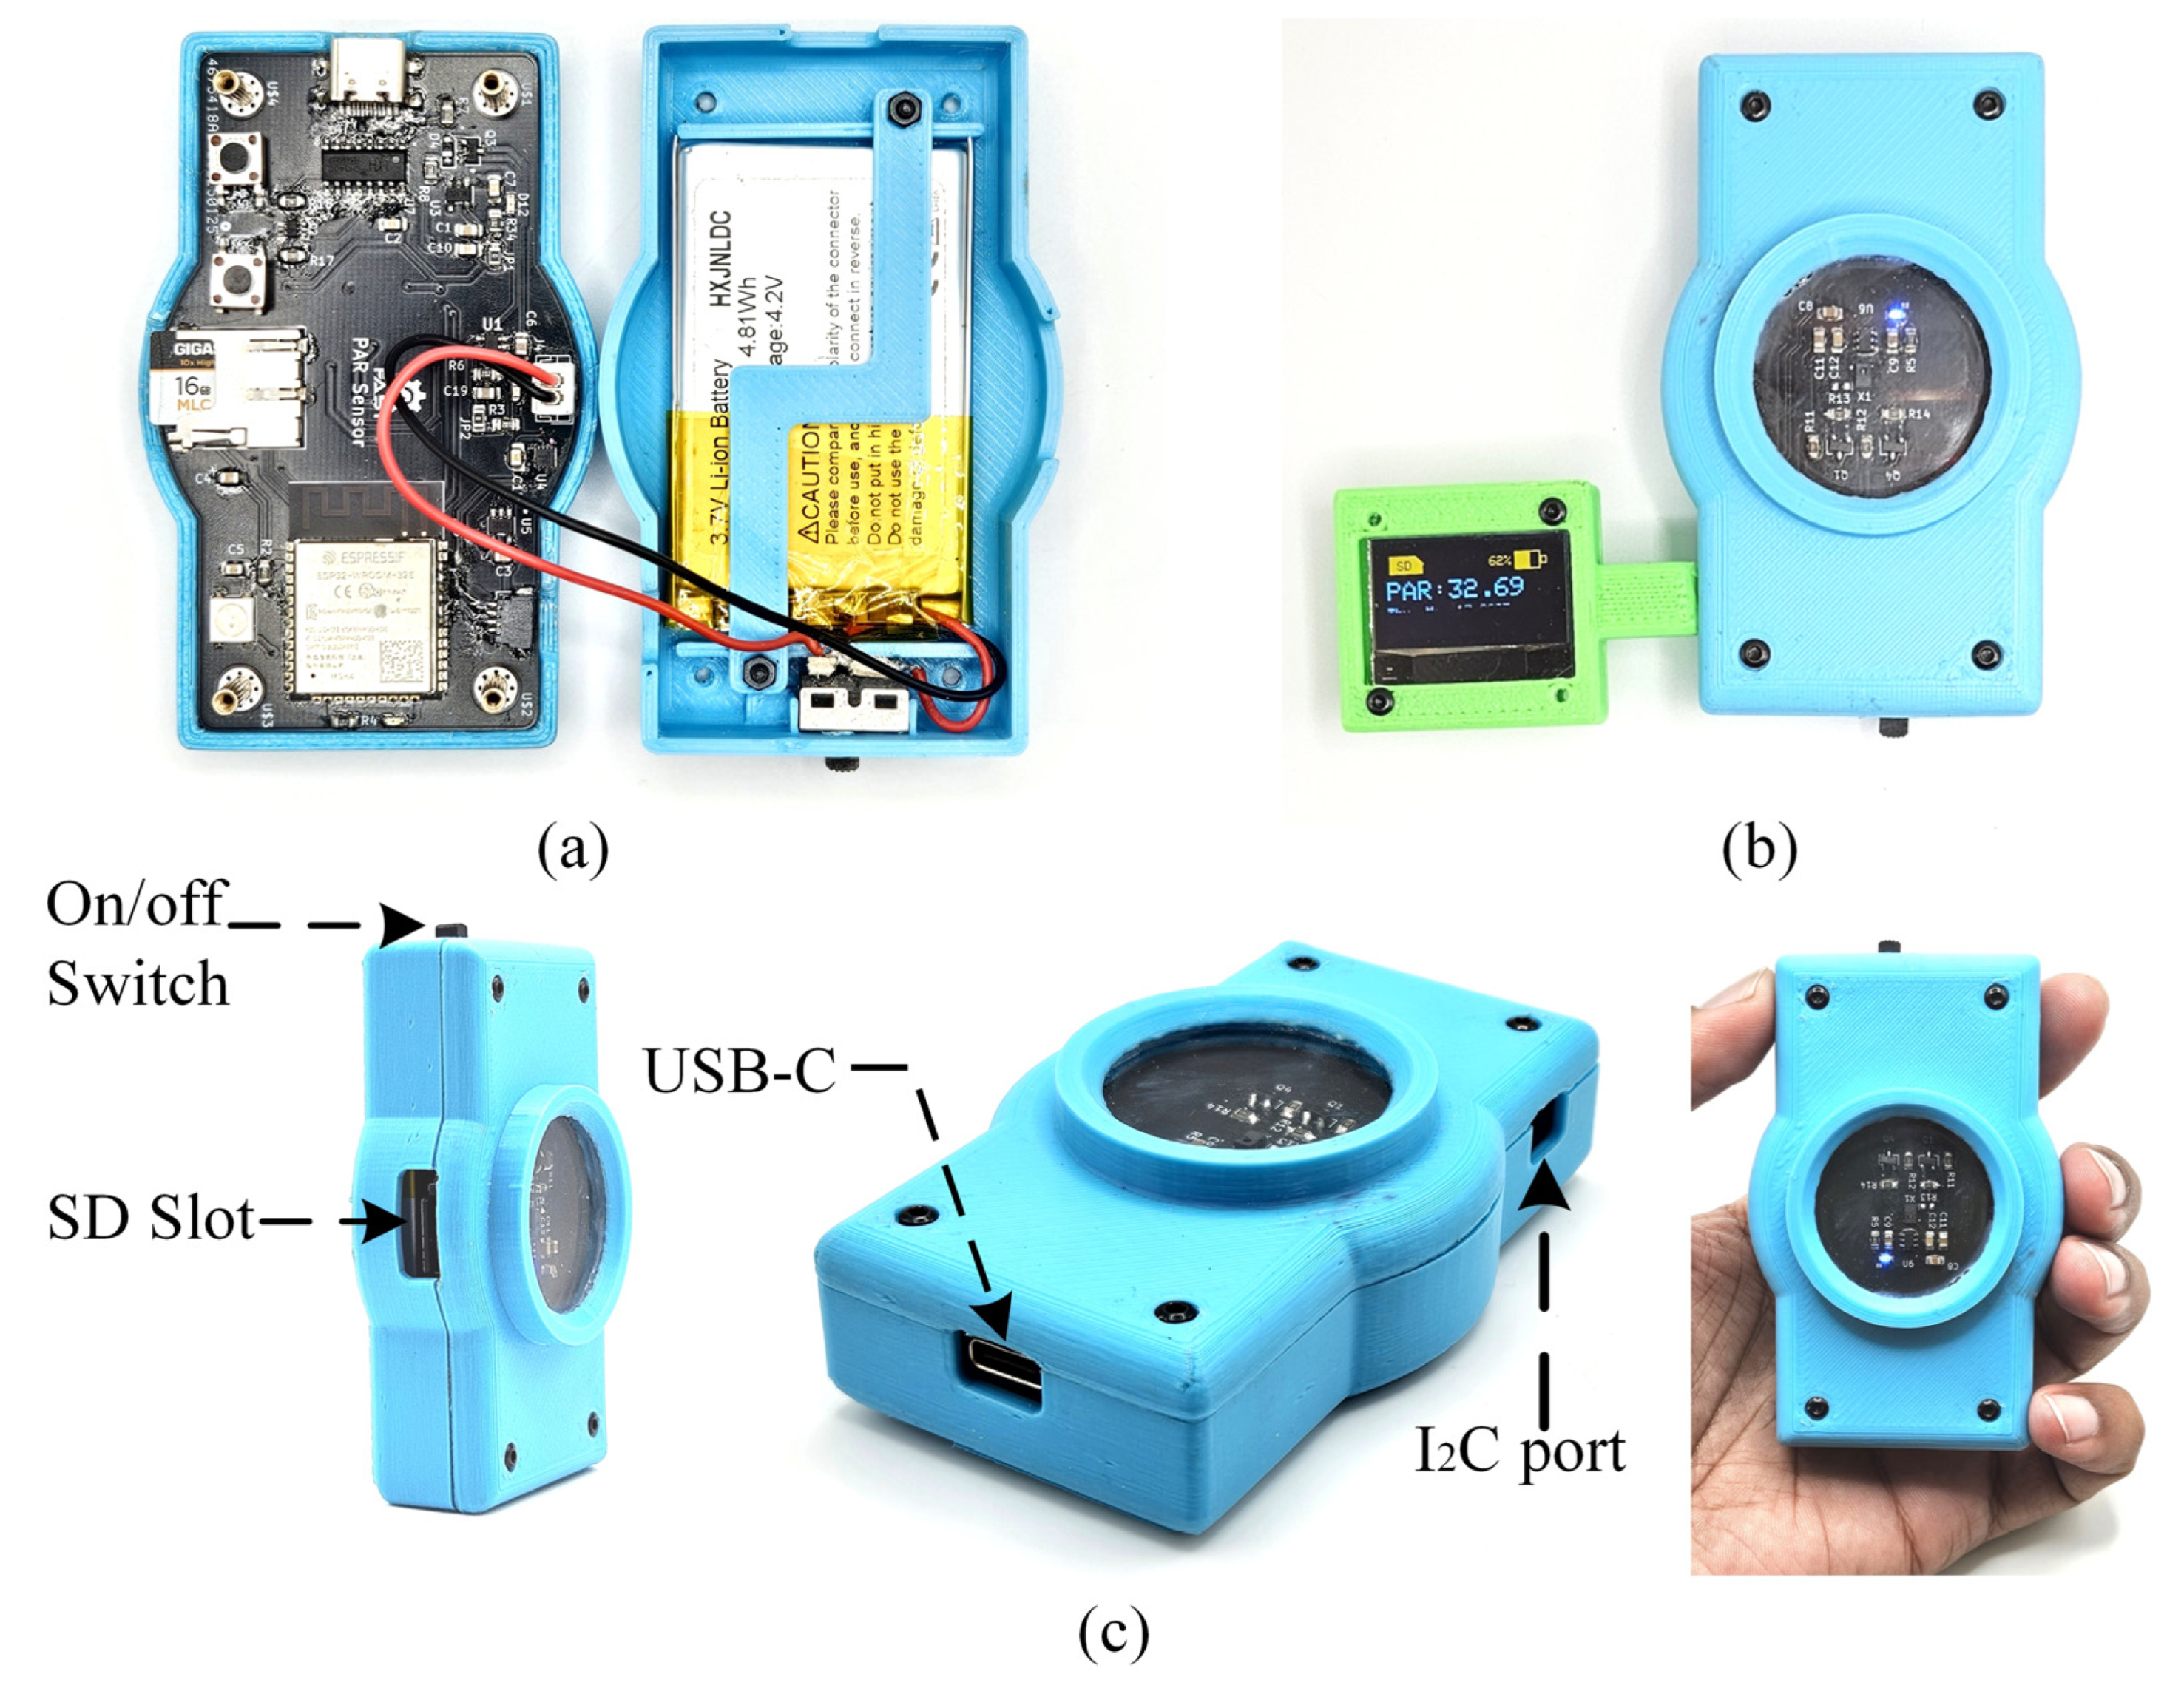
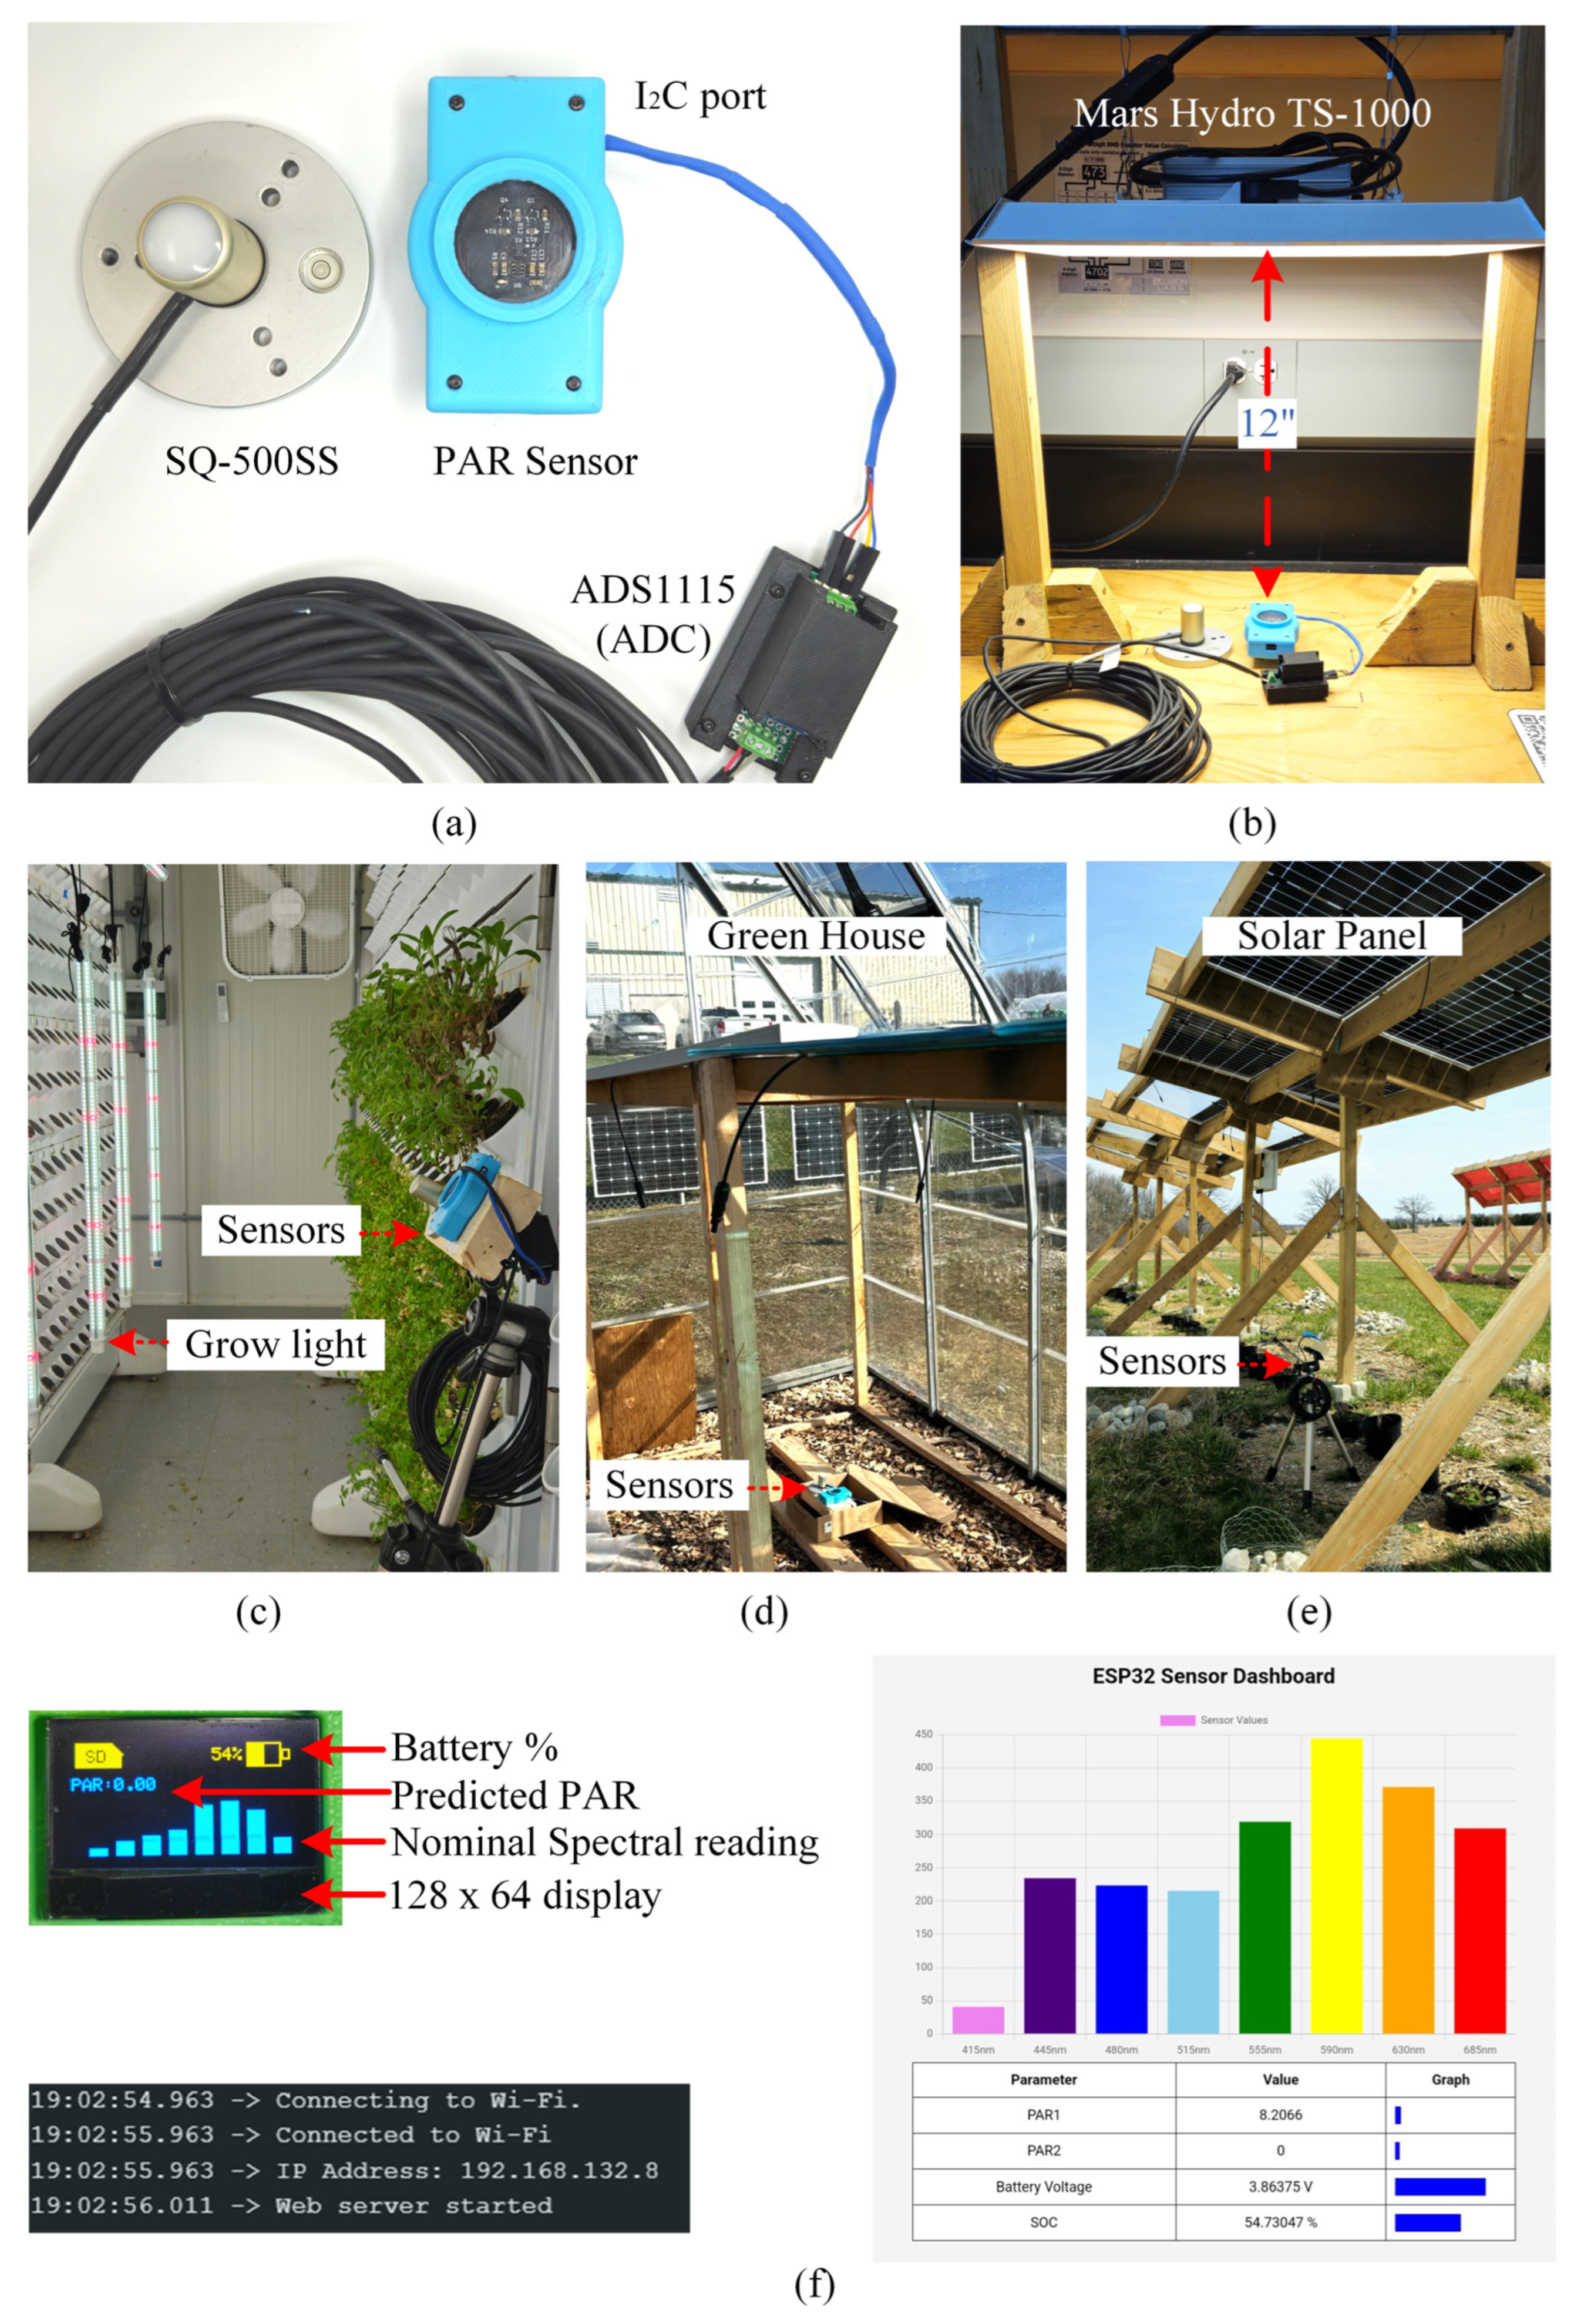
2.2. Features and Components of the Sensor
2.3. Assembly of PAR Sensor
2.4. Calculation of PAR Using Multilinear Regression
2.5. Modes of Operation and Corresponding Core and Setup Instruction
2.5.1. Calibration Mode
2.5.2. Deployment of Sensor
3. Results
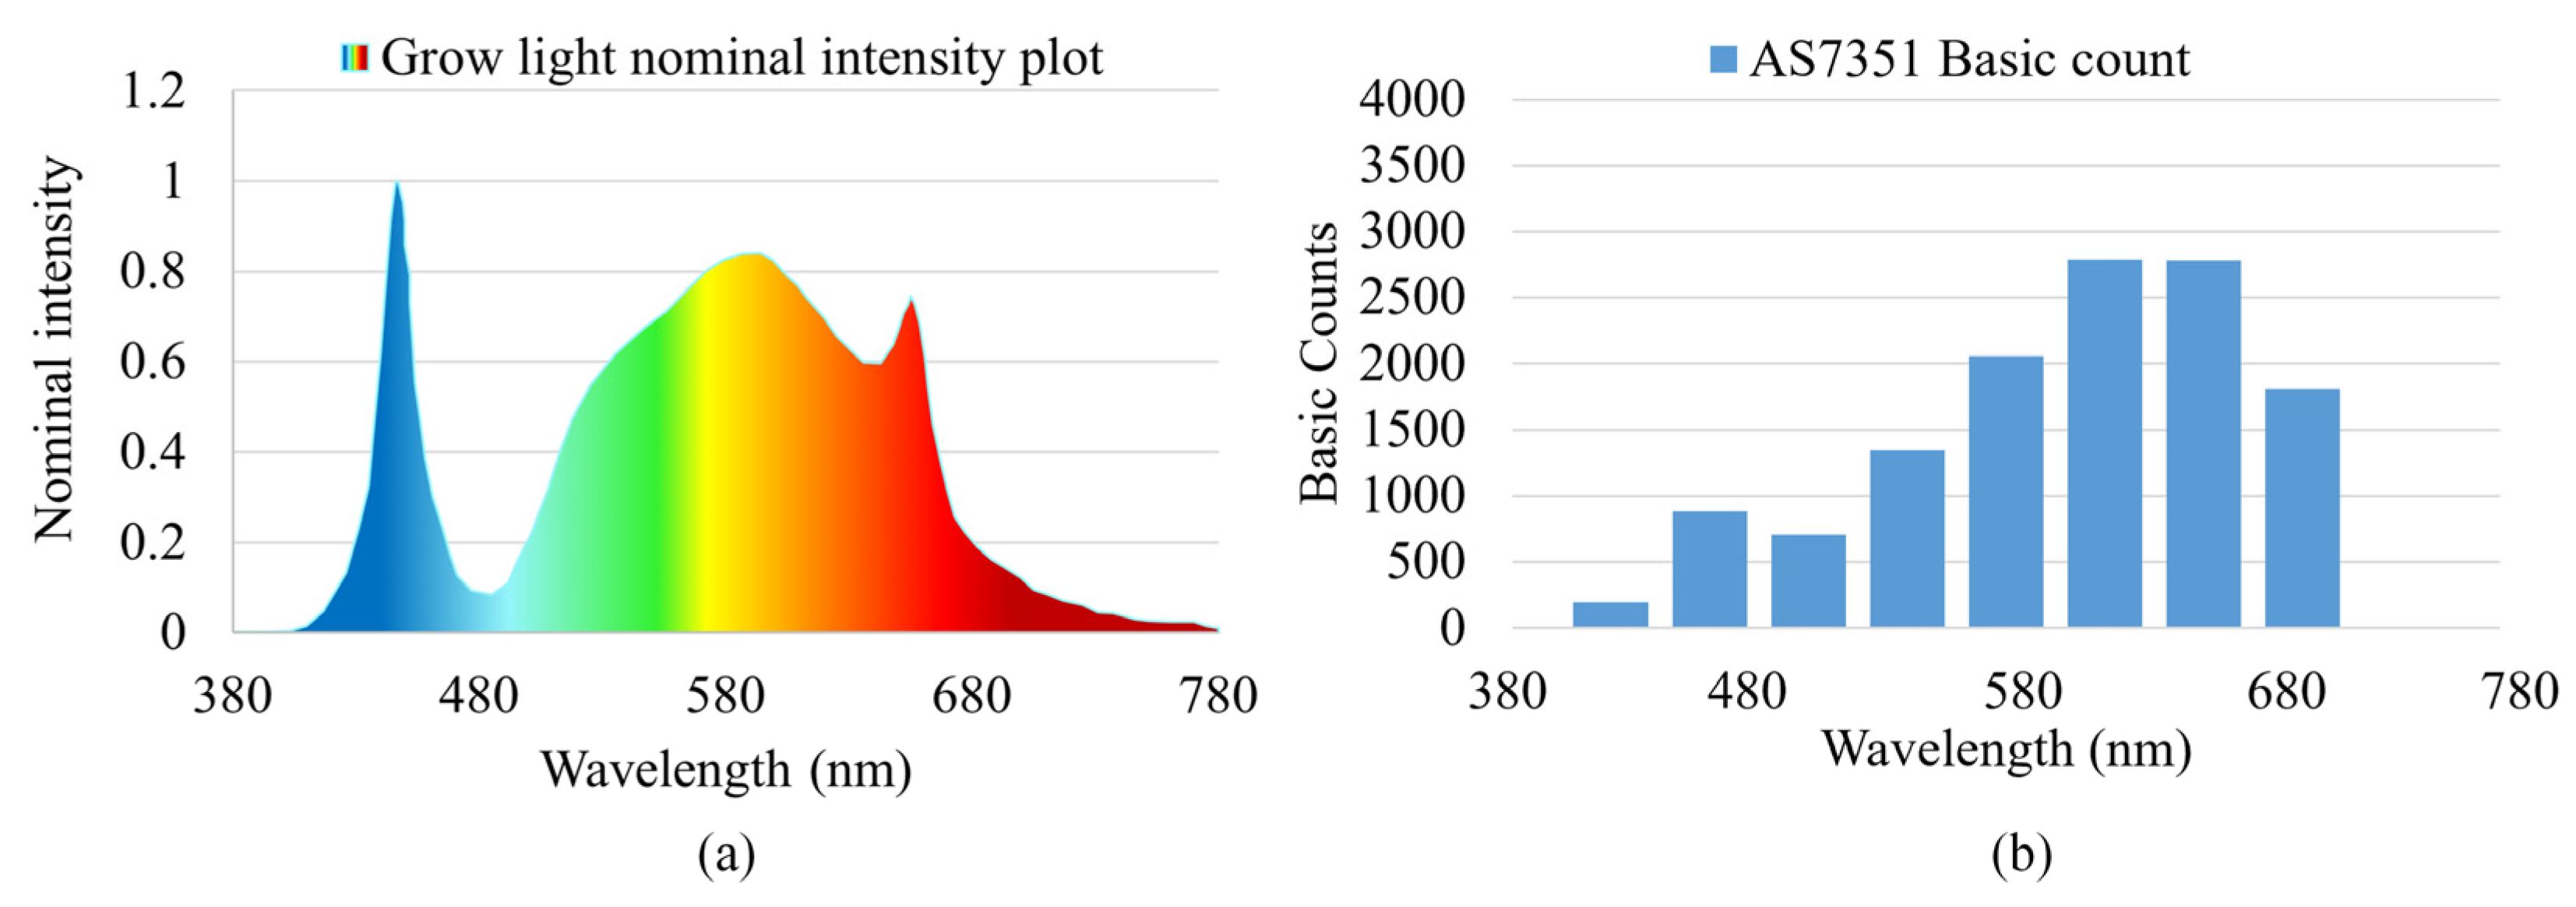
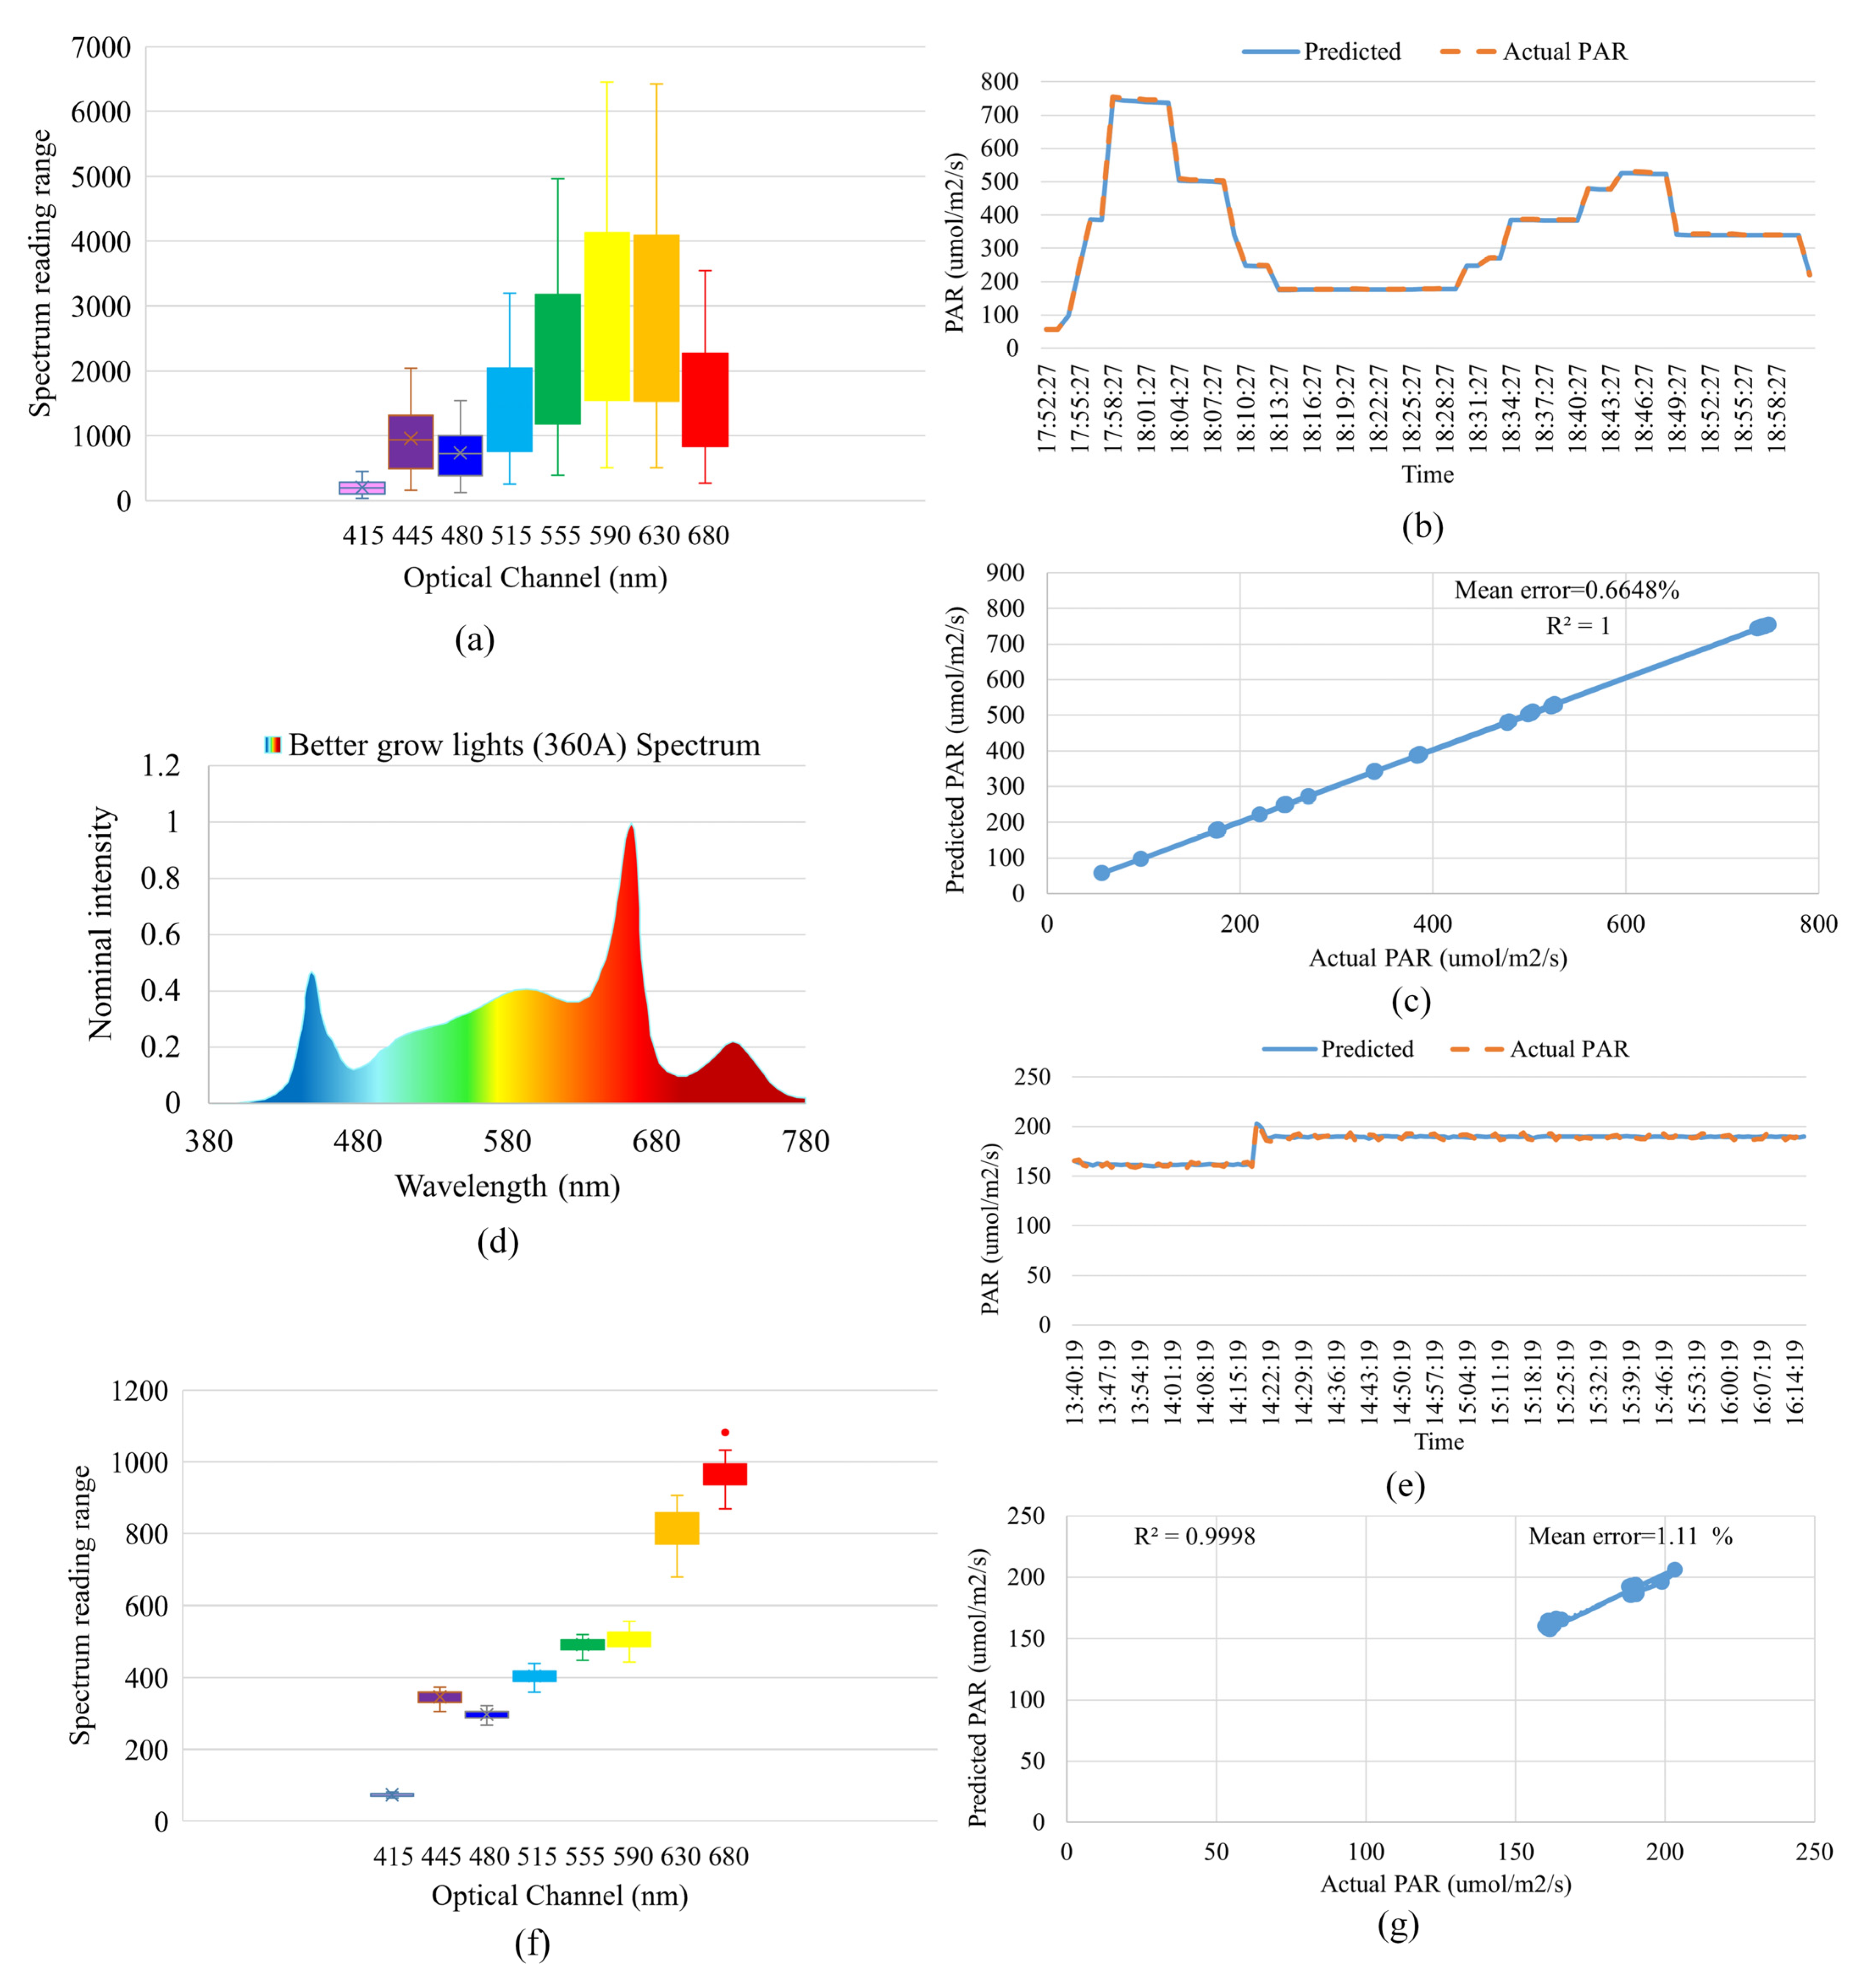
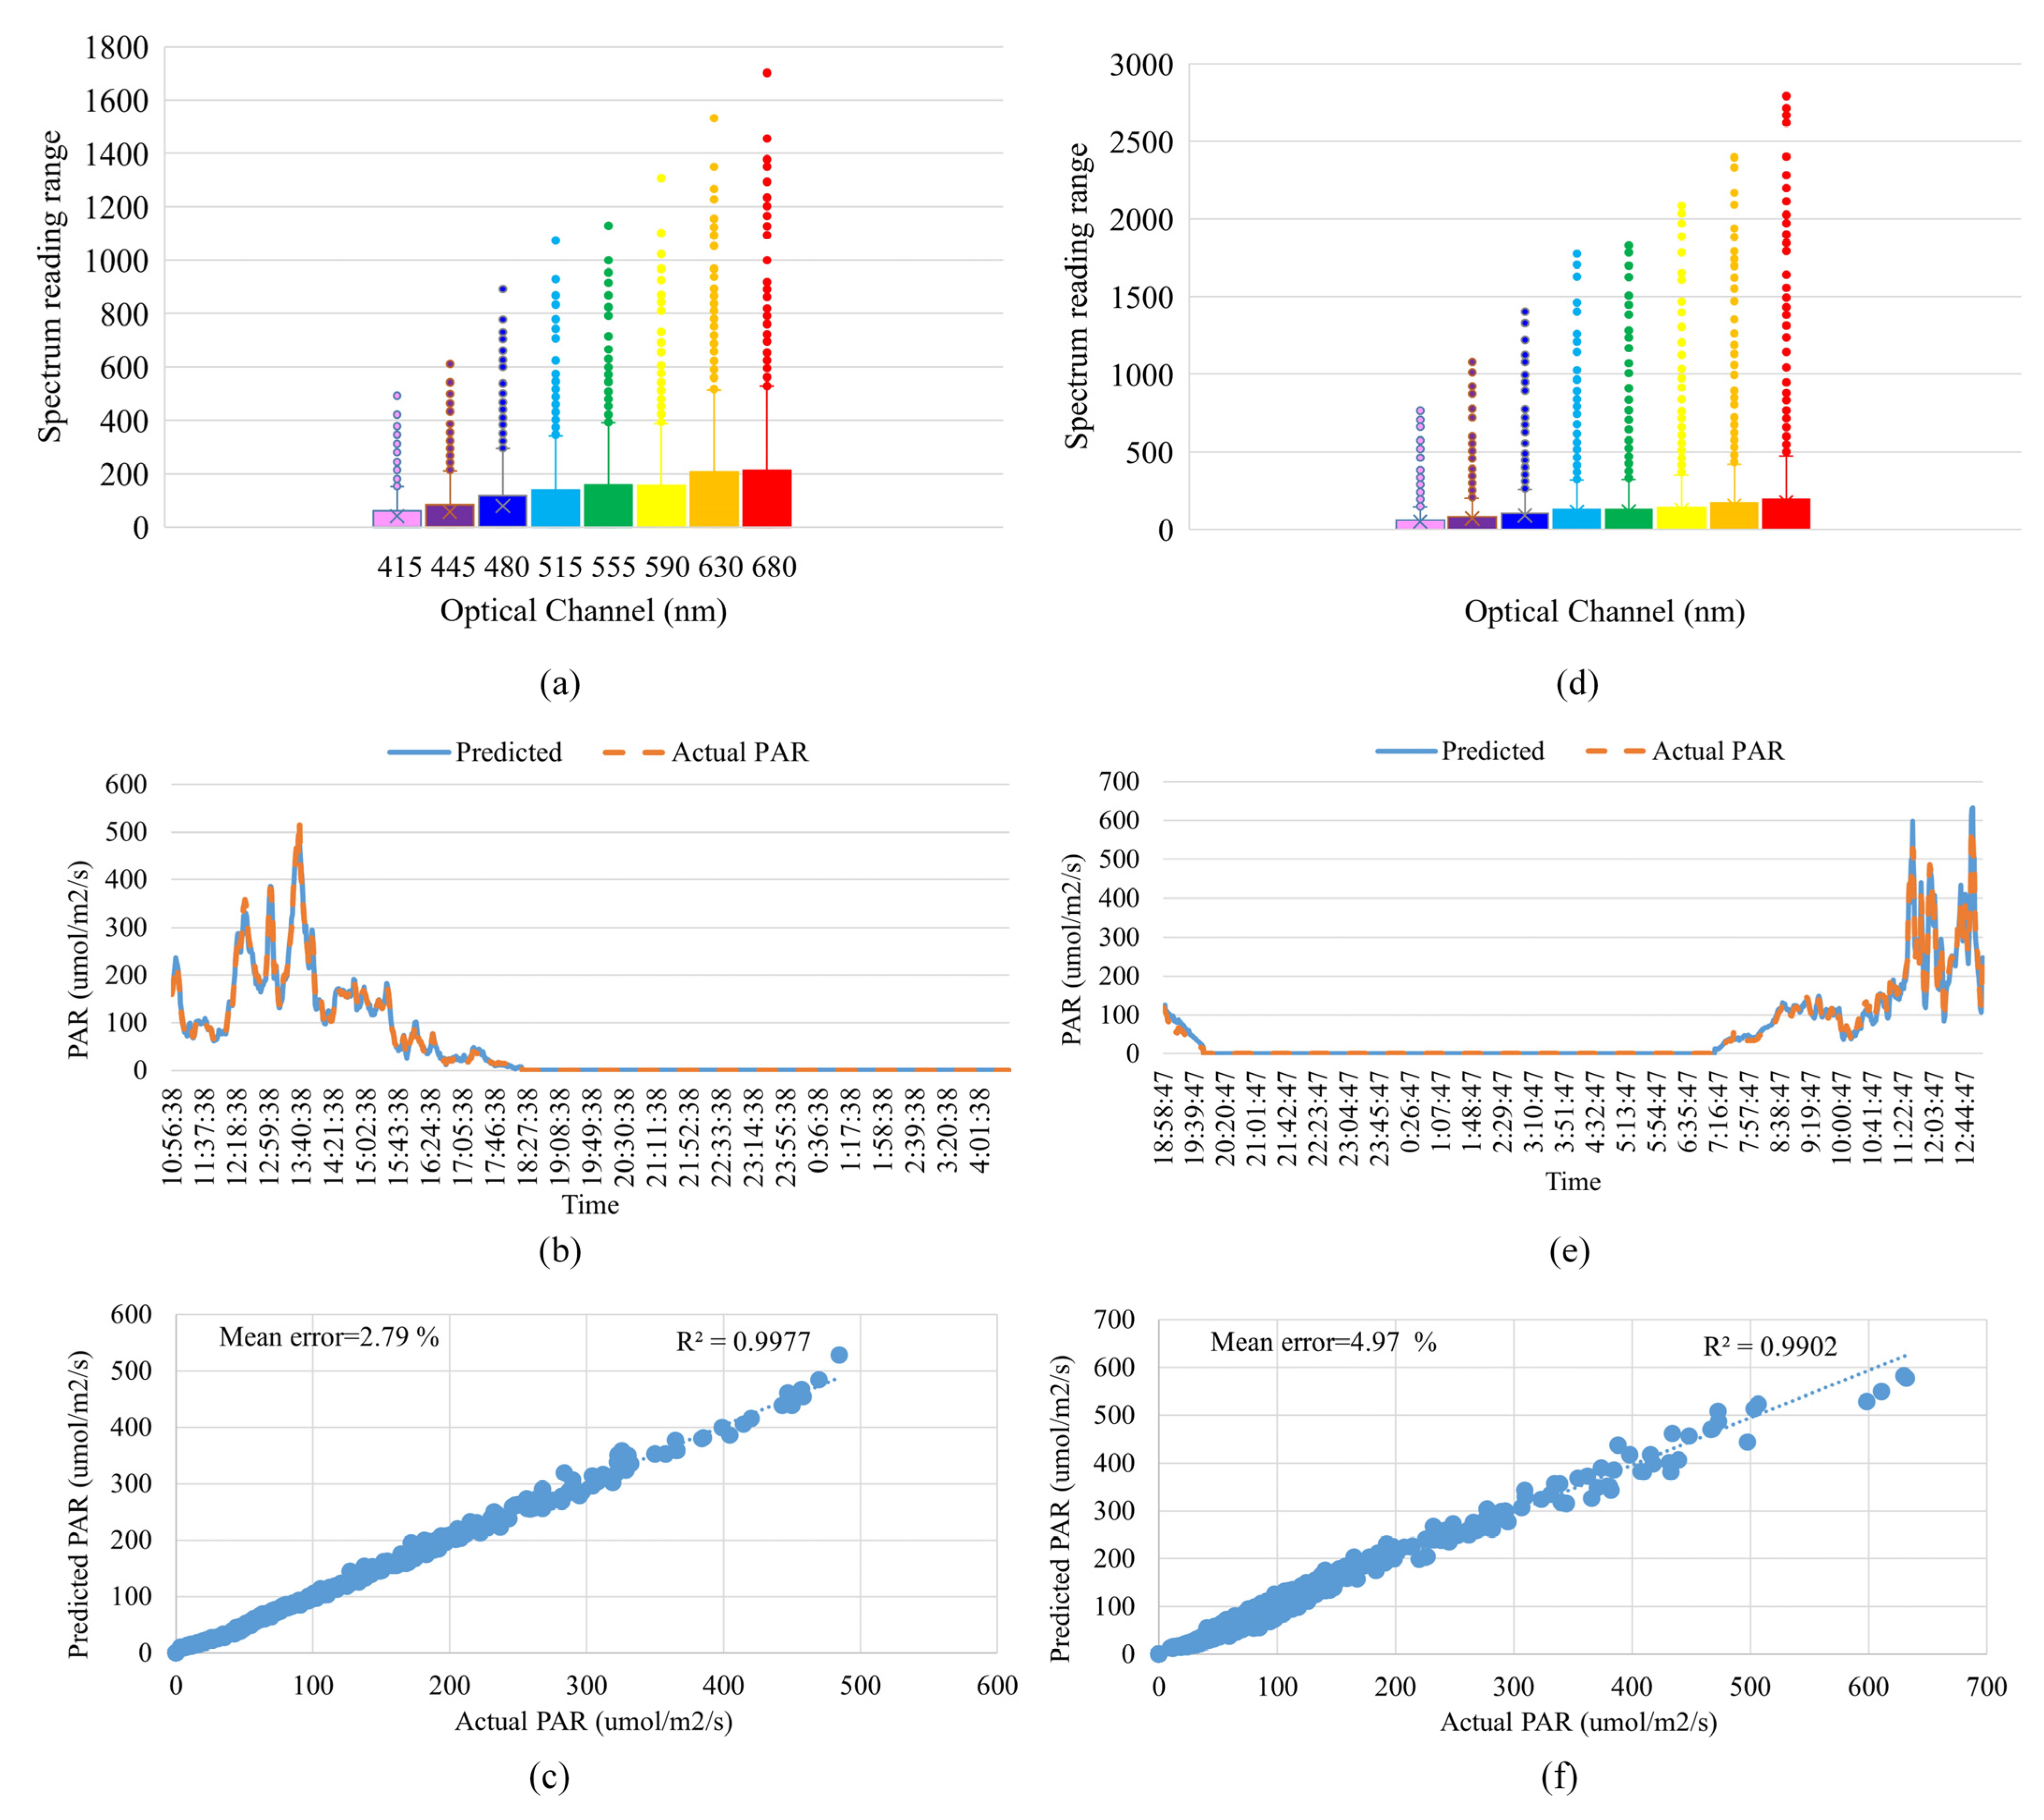
3.1. Calibration and Results with Grow Lights and Agrotunnel
3.2. Calibration and Results in Greenhouse
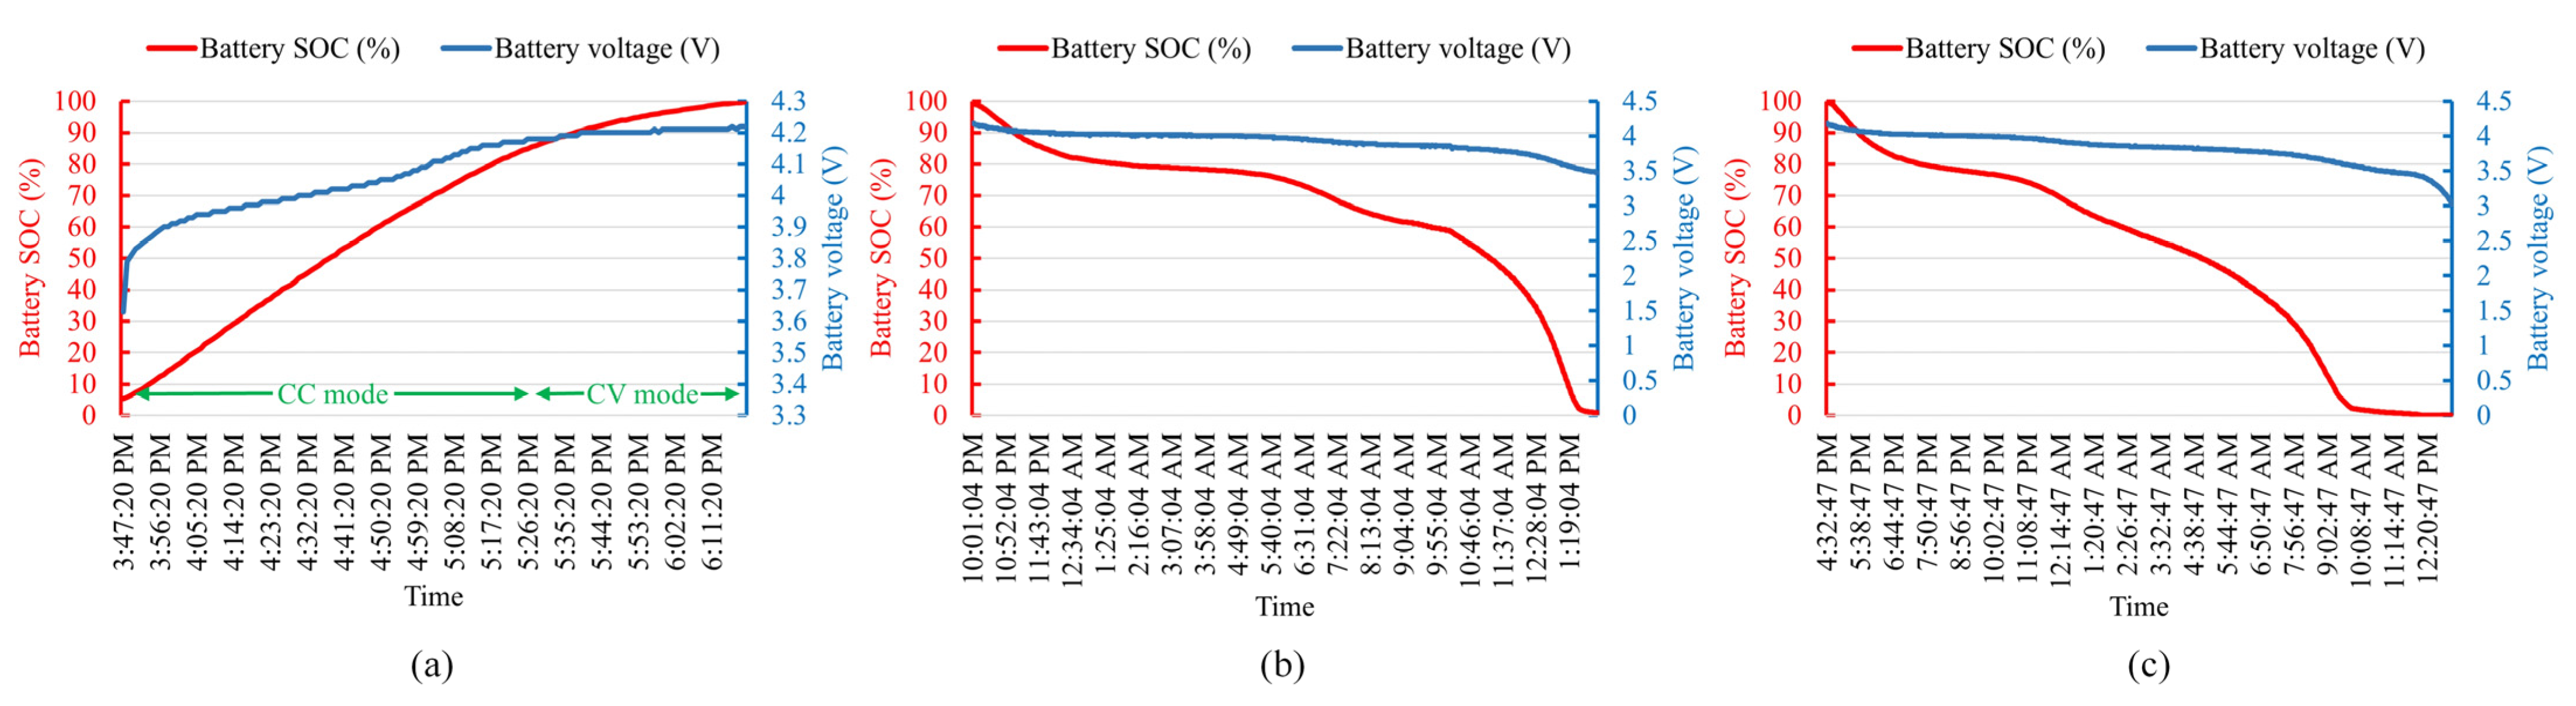
3.3. Battery Charging Duration and Impact of WiFi Dashboard on Backup Duration
4. Discussion
5. Conclusions
Author Contributions
Funding
Data Availability Statement
Conflicts of Interest
Abbreviations
| PAR | Photosynthetically active radiation; |
| PPFD | Photosynthetic Photon Flux Density; |
| MLR | Multiple linear regression; |
| I2C | Inter Integrated Circuit. |
Appendix A

| Parts Name | Quantity | File Type | License | Location of File (All Visited on 17 April 2025) |
|---|---|---|---|---|
| PCB_gerbers | 1 | STEP/stl | CERN OHL-S 2.0. | https://osf.io/vxarp/ |
| PCB_KiCad | 1 | STEP/stl | CERN OHL-S 2.0. | https://osf.io/vxarp/ |
| 3D_printed_parts_Onshape | 5 | STEP/stl | CERN OHL-S 2.0. | https://osf.io/vxarp/ |
| ESP32_calibration_firmware | 1 | .ino | GNU GPL v3 | https://osf.io/vxarp/ |
| ESP32_deployment_firmware | 1 | .ino | GNU GPL v3 | https://osf.io/vxarp/ |
| Parameter | Value |
|---|---|
| Filament | PLA |
| Layer Height | 0.3 mm |
| Initial Layer Height | 0.2 mm |
| Infill Density | 15% |
| Printing Temperature | 210 °C |
| Build Plate Temperature | 60 °C |
| Print Speed | 60 mm/s |
| Travel Speed | 175 mm/s |
References
- McCree, K.J. The Action Spectrum, Absorptance and Quantum Yield of Photosynthesis in Crop Plants. Agric. Meteorol. 1971, 9, 191–216. [Google Scholar] [CrossRef]
- Björkman, O.; Demmig, B. Photon Yield of O2 Evolution and Chlorophyll Fluorescence Characteristics at 77 K among Vascular Plants of Diverse Origins. Planta 1987, 170, 489–504. [Google Scholar] [CrossRef]
- Yunus, M.; Pathre, U.; Mohanty, P. Probing Photosynthesis: Mechanism, Regulation & Adaptation; CRC Press: Boca Raton, FL, USA, 2014; ISBN 978-1-4822-6801-0. [Google Scholar]
- Niinemets, Ü.; Valladares, F. Photosynthetic Acclimation to Simultaneous and Interacting Environmental Stresses Along Natural Light Gradients: Optimality and Constraints. Plant Biol. 2004, 6, 254–268. [Google Scholar] [CrossRef] [PubMed]
- Ritchie, R.J. Fitting Light Saturation Curves Measured Using Modulated Fluorometry. Photosynth. Res. 2008, 96, 201–215. [Google Scholar] [CrossRef] [PubMed]
- Graamans, L.; Baeza, E.; van den Dobbelsteen, A.; Tsafaras, I.; Stanghellini, C. Plant Factories versus Greenhouses: Comparison of Resource Use Efficiency. Agric. Syst. 2018, 160, 31–43. [Google Scholar] [CrossRef]
- Jamil, U.; Pearce, J.M. Experimental Impacts of Transparency on Strawberry Agrivoltaics Using Thin Film Photovoltaic Modules under Low Light Conditions. Sol. Energy 2025, 290, 113375. [Google Scholar] [CrossRef]
- Jamil, U.; Rahman, M.; Pearce, J.M. Complexities in Agrivoltaic Policy Mandates Illustrated with Semitransparent Photovoltaic Yields; SSRN 2024. Available online: https://www.researchgate.net/publication/387434730_Complexities_in_Agrivoltaic_Policy_Mandates_Illustrated_with_Semitransparent_Photovoltaic_Yields (accessed on 7 March 2025).
- Barron-Gafford, G.A.; Pavao-Zuckerman, M.A.; Minor, R.L.; Sutter, L.F.; Barnett-Moreno, I.; Blackett, D.T.; Thompson, M.; Dimond, K.; Gerlak, A.K.; Nabhan, G.P.; et al. Agrivoltaics Provide Mutual Benefits across the Food–Energy–Water Nexus in Drylands. Nat. Sustain. 2019, 2, 848–855. [Google Scholar] [CrossRef]
- Jamil, U.; Givans, J.; Pearce, J.M. Impacts of Type of Partial Transparency on Strawberry Agrivoltaics: Uniform Illumination Thin Film Cadmium-Telluride and Non-Uniform Crystalline Silicon Solar Photovoltaic Modules. Renew. Energy 2025, 247, 122913. [Google Scholar] [CrossRef]
- Dupraz, C.; Marrou, H.; Talbot, G.; Dufour, L.; Nogier, A.; Ferard, Y. Combining Solar Photovoltaic Panels and Food Crops for Optimising Land Use: Towards New Agrivoltaic Schemes. Renew. Energy 2011, 36, 2725–2732. [Google Scholar] [CrossRef]
- Jamil, U.; Hickey, T.; Pearce, J.M. Solar Energy Modelling and Proposed Crops for Different Types of Agrivoltaics Systems. Energy 2024, 304, 132074. [Google Scholar] [CrossRef]
- Nelson, J.A.; Bugbee, B. Economic Analysis of Greenhouse Lighting: Light Emitting Diodes vs. High Intensity Discharge Fixtures. PLoS ONE 2014, 9, e99010. [Google Scholar] [CrossRef] [PubMed]
- Boucher, L.; Nguyen, T.-T.-A.; Brégard, A.; Pepin, S.; Dorais, M. Optimizing Light Use Efficiency and Quality of Indoor Organically Grown Leafy Greens by Using Different Lighting Strategies. Agronomy 2023, 13, 2582. [Google Scholar] [CrossRef]
- Park, Y.; Sethi, R.; Temnyk, S. Growth, Flowering, and Fruit Production of Strawberry ‘Albion’ in Response to Photoperiod and Photosynthetic Photon Flux Density of Sole-Source Lighting. Plants 2023, 12, 731. [Google Scholar] [CrossRef]
- Baligar, V.C.; Elson, M.K.; He, Z.; Li, Y.; Paiva, A.d.Q.; Almeida, A.A.F.; Ahnert, D. Light Intensity Effects on the Growth, Physiological and Nutritional Parameters of Tropical Perennial Legume Cover Crops. Agronomy 2020, 10, 1515. [Google Scholar] [CrossRef]
- Hole, C.C.; Dearman, J. The Effect of Photon Flux Density on Distribution of Assimilate between Shoot and Storage Root of Carrot, Red Beet and Radish. Sci. Hortic. 1993, 55, 213–225. [Google Scholar] [CrossRef]
- MQ-500: Full-Spectrum Quantum Meter. Available online: https://www.apogeeinstruments.com/mq-500-full-spectrum-quantum-meter/ (accessed on 7 March 2025).
- MQ-510: Full-Spectrum Underwater Quantum Meter. Available online: https://www.apogeeinstruments.com/mq-510-full-spectrum-underwater-quantum-meter/ (accessed on 7 March 2025).
- SQ-520: Full-Spectrum Smart Quantum Sensor (USB). Available online: https://www.apogeeinstruments.com/sq-520-full-spectrum-smart-quantum-sensor-usb/ (accessed on 7 March 2025).
- LI-COR Environmental. Available online: https://www.licor.com/products/light/quantum (accessed on 7 March 2025).
- Seeed Studio-Industrial PAR Sensor (PAR-2.5V). Available online: https://www.seeedstudio.com/PAR-2-5V-p-4831.html (accessed on 7 March 2025).
- Caya, M.V.C.; Alcantara, J.T.; Carlos, J.S.; Cereno, S.S.B. Photosynthetically Active Radiation (PAR) Sensor Using an Array of Light Sensors with the Integration of Data Logging for Agricultural Application. In Proceedings of the 2018 3rd International Conference on Computer and Communication Systems (ICCCS), Nagoya, Japan, 27–30 April 2018; pp. 377–381. [Google Scholar]
- Rajendran, J.; Leon-Salas, W.D.; Fan, X.; Zhang, Y.; Vizcardo, M.A.; Postigo, M. On the Development of a Low-Cost Photosynthetically Active Radiation (PAR) Sensor. In Proceedings of the 2020 IEEE International Symposium on Circuits and Systems (ISCAS), Seville, Spain, 10–21 October 2020; pp. 1–5. [Google Scholar]
- Fielder, P.; Comeau, P. Construction and Testing of an Inexpensive PAR Sensor; Ministry of Forests Research Program: British Columbia, Canada, 2000; Volume 53.
- Kutschera, A.; Lamb, J.J. Light Meter for Measuring Photosynthetically Active Radiation. Am. J. Plant Sci. 2018, 9, 2420–2428. [Google Scholar] [CrossRef]
- Jiang, J.; Moallem, M.; Zheng, Y. An Intelligent IoT-Enabled Lighting System for Energy-Efficient Crop Production. J. Daylighting 2021, 8, 86–99. [Google Scholar] [CrossRef]
- Ams AS7341—11-Channel Spectral Color Sensor Ambient Light, Color, Spectral & Proximity Sensors|Ams OSRAM. Available online: https://ams-osram.com/products/sensor-solutions/ambient-light-color-spectral-proximity-sensors/ams-as7341-11-channel-spectral-color-sensor (accessed on 10 March 2025).
- Ams AS7265x Smart Spectral Sensor Ambient Light, Color, Spectral & Proximity Sensors—Ams-Osram—Ams. Available online: https://ams-osram.com/products/sensor-solutions/ambient-light-color-spectral-proximity-sensors/ams-as7265x-smart-spectral-sensor (accessed on 10 March 2025).
- Leon-Salas, W.D.; Rajendran, J.; Vizcardo, M.A.; Postigo-Malaga, M. Measuring Photosynthetically Active Radiation with a Multi-Channel Integrated Spectral Sensor. In Proceedings of the 2021 IEEE International Symposium on Circuits and Systems (ISCAS), Daegu, Republic of Korea, 22–28 May 2021; pp. 1–5. [Google Scholar]
- Mohagheghi, A.; Moallem, M. An Energy-Efficient PAR-Based Horticultural Lighting System for Greenhouse Cultivation of Lettuce. IEEE Access 2023, 11, 8834–8844. [Google Scholar] [CrossRef]
- Mohagheghi, A.; Moallem, M. Measuring Photosynthetic Photon Flux Density in the Blue and Red Spectrum for Horticultural Lighting Using Machine Learning Methods. IEEE Trans. Instrum. Meas. 2024, 73, 1–10. [Google Scholar] [CrossRef]
- D Stevens, J.; Murray, D.; Diepeveen, D.; Toohey, D. Adaptalight: An Inexpensive PAR Sensor System for Daylight Harvesting in a Micro Indoor Smart Hydroponic System. Horticulturae 2022, 8, 105. [Google Scholar] [CrossRef]
- Bäumker, E.; Zimmermann, D.; Schierle, S.; Woias, P. A Novel Approach to Obtain PAR with a Multi-Channel Spectral Microsensor, Suitable for Sensor Node Integration. Sensors 2021, 21, 3390. [Google Scholar] [CrossRef] [PubMed]
- Kurasaki, R.; Byrd, M.; Kobayashi, K. Low-Cost Light Sensors for Indoor Agriculture; College of Tropical Agriculture and Human Resources (CTHAR): Honolulu, HI, USA, 2023. [Google Scholar]
- Gibb, A. Building Open Source Hardware: DIY Manufacturing for Hackers and Makers; Addison-Wesley Professional: Boston, MA, USA, 2014; ISBN 978-0-13-337390-5. [Google Scholar]
- Pearce, J.M. Cut Costs with Open-Source Hardware. Nature 2014, 505, 618. [Google Scholar] [CrossRef] [PubMed]
- Mars Hydro TS 1000 Full Spectrum Dimmable 150W LED Grow Light. Available online: https://www.mars-hydro.com/ts-1000-led-grow-light (accessed on 19 April 2025).
- ESP32 Wi-Fi & Bluetooth SoC|Espressif Systems. Available online: https://www.espressif.com/en/products/socs/esp32 (accessed on 19 April 2025).
- KiCad EDA. Available online: https://www.kicad.org/ (accessed on 19 April 2025).
- OSF|Open-Source Photosynthetically Active Radiation. Available online: https://osf.io/vxarp/ (accessed on 19 April 2025).
- The GNU General Public License v3.0—GNU Project—Free Software Foundation. Available online: https://www.gnu.org/licenses/gpl-3.0.en.html (accessed on 26 August 2024).
- Home|CERN Open Hardware Licence. Available online: https://cern-ohl.web.cern.ch/ (accessed on 26 August 2024).
- Sells, E.; Bailard, S.; Smith, Z.; Bowyer, A.; Olliver, V. RepRap: The Replicating Rapid Prototyper: Maximizing Customizability by Breeding the Means of Production. In Handbook of Research in Mass Customization and Personalization; World Scientific Publishing Company: Singapore, 2009; pp. 568–580. ISBN 978-981-4280-25-9. [Google Scholar]
- Jones, R.; Haufe, P.; Sells, E.; Iravani, P.; Olliver, V.; Palmer, C.; Bowyer, A. RepRap—The Replicating Rapid Prototyper. Robotica 2011, 29, 177–191. [Google Scholar] [CrossRef]
- Anzalone, G.C.; Wijnen, B.; Pearce, J.M. Multi-Material Additive and Subtractive Prosumer Digital Fabrication with a Free and Open-Source Convertible Delta RepRap 3-D Printer. Rapid Prototyp. J. 2015, 21, 506–519. [Google Scholar] [CrossRef]
- Dertinger, S.C.; Gallup, N.; Tanikella, N.G.; Grasso, M.; Vahid, S.; Foot, P.J.S.; Pearce, J.M. Technical Pathways for Distributed Recycling of Polymer Composites for Distributed Manufacturing: Windshield Wiper Blades. Resour. Conserv. Recycl. 2020, 157, 104810. [Google Scholar] [CrossRef]
- Mohammed, M.I.; Wilson, D.; Gomez-Kervin, E.; Rosson, L.; Long, J. EcoPrinting: Investigation of Solar Powered Plastic Recycling and Additive Manufacturing for Enhanced Waste Management and Sustainable Manufacturing. In Proceedings of the 2018 IEEE Conference on Technologies for Sustainability (SusTech), Long Beach, CA, USA, 11–13 November 2018; pp. 1–6. [Google Scholar]
- Mohammed, M.I.; Wilson, D.; Gomez-Kervin, E.; Vidler, C.; Rosson, L.; Long, J. The Recycling of E-Waste ABS Plastics by Melt Extrusion and 3D Printing Using Solar Powered Devices as a Transformative Tool for Humanitarian Aid; University of Texas at Austin: Austin, TX, USA, 2018. [Google Scholar]
- SQ-500-SS: Full-Spectrum Quantum Sensor. Available online: https://www.apogeeinstruments.com/sq-500-ss-full-spectrum-quantum-sensor/ (accessed on 19 April 2025).
- Weisberg, S. Applied Linear Regression; John Wiley & Sons: Hoboken, NJ, USA, 2013; ISBN 978-1-118-62595-8. [Google Scholar]
- Montgomery, D.C.; Peck, E.A.; Vining, G.G. Introduction to Linear Regression Analysis; John Wiley & Sons: Hoboken, NJ, USA, 2015; ISBN 978-1-119-18017-3. [Google Scholar]
- Home|LibreOffice—Free and Private Office Suite—Based on OpenOffice—Compatible with Microsoft. Available online: https://www.libreoffice.org/ (accessed on 19 April 2025).
- NumPy. Available online: https://numpy.org/ (accessed on 19 April 2025).
- SciPy. Available online: https://scipy.org/ (accessed on 19 April 2025).
- MATLAB. Available online: https://www.mathworks.com/products/matlab.html (accessed on 19 April 2025).
- Use the Analysis ToolPak to Perform Complex Data Analysis-Microsoft Support. Available online: https://support.microsoft.com/en-us/office/use-the-analysis-toolpak-to-perform-complex-data-analysis-6c67ccf0-f4a9-487c-8dec-bdb5a2cefab6 (accessed on 16 March 2025).
- Food Security Structures Canada—Better Grow Lights. Available online: https://www.foodsecuritystructures.ca/growing-systems/better-grow-lights (accessed on 19 April 2025).
- Asgari, N.; Jamil, U.; Pearce, J.M. Net Zero Agrivoltaic Arrays for Agrotunnel Vertical Growing Systems: Energy Analysis and System Sizing. Sustainability 2024, 16, 6120. [Google Scholar] [CrossRef]
- Schallenberg-Rodriguez, J.; Rodrigo-Bello, J.-J.; Río-Gamero, B.D. Agrivoltaic: How Much Electricity Could Photovoltaic Greenhouses Supply? Energy Rep. 2023, 9, 5420–5431. [Google Scholar] [CrossRef]
- Jamil, U.; Bonnington, A.; Pearce, J.M. The Agrivoltaic Potential of Canada. Sustainability 2023, 15, 3228. [Google Scholar] [CrossRef]
- Bitella, G.; Rossi, R.; Bochicchio, R.; Perniola, M.; Amato, M. A Novel Low-Cost Open-Hardware Platform for Monitoring Soil Water Content and Multiple Soil-Air-Vegetation Parameters. Sensors 2014, 14, 19639–19659. [Google Scholar] [CrossRef]
- Chagas, A.M. Haves and Have Nots Must Find a Better Way: The Case for Open Scientific Hardware. PLoS Biol. 2018, 16, e3000014. [Google Scholar] [CrossRef]
- Pearce, J.M. Applications of Open Source 3-D Printing on Small Farms. Org. Farming 2015, 1, 19–35. [Google Scholar] [CrossRef]
- Robert, M.; Jérémy, B.; Christian, V.; Elies, D.; Roland, J. Open Source Hardware Development—A Handbook for Collaborative Product Creation; Berlin Universities Publishing: Berlin, Germany, 2024; ISBN 978-3-9878101-3-8. [Google Scholar]
- Trilles, S.; González-Pérez, A.; Huerta, J. A Comprehensive IoT Node Proposal Using Open Hardware. A Smart Farming Use Case to Monitor Vineyards. Electronics 2018, 7, 419. [Google Scholar] [CrossRef]
- Rogers, H.; School of Computer Science, University of Lincoln; Fox, C. School of Computer Science, University of Lincoln. An Open Source Seeding Agri-Robot. In Proceedings of the 3rd UK-RAS Conference, Lincoln, UK, 1–2 April 2020; pp. 48–50. [Google Scholar]


| Manufacturer | Model | Cost (in CAD) | Spectral Range | PAR Range µmol m−2 s−1 | Sensitivity | Calibration Uncertainty | Reference | |
|---|---|---|---|---|---|---|---|---|
| Only Sensor | Including Monitoring Device | |||||||
| Apogee | MQ-500 | 663 | 900 | 389 to 692 nm | 0 to 4000 | 0.01 mV per μmol s−1 m−2 | ±5% | [18] |
| MQ-510 | - | 917 | 389 to 692 nm | 0 to 4000 | ±5% | [19] | ||
| SQ-520 | 769 | - | 389 to 692 nm | 0 to 4000 | ±5% | [20] | ||
| LI-COR | LI-190R | 673 | - | 400–700 | 0 to 10,000 | 5 μA to 10 μA per 1000 μmol/s/m2 | ±5% | [21] |
| Seeed studio | S-PAR-02 | 336 | - | 400–700 | 0–2500 | 1 mV per μmol/s/m2 | N/A | [22] |
| Calculation Method | Measurement Environment | Sensor/Device Used | Calibrated with | Microcontroller Used | Spectral Range | Cost (If Mentioned) | Data Acquisition | Performance | Ref |
|---|---|---|---|---|---|---|---|---|---|
| Multilinear regression | Indoor smart hydroponic system | AS7265x | Apogee SQ-520 Quantum Sensor | Arduino UNO, Raspberry Pi | 410–940 nm | Not mentioned | Data logging InfluxDB server and Raspberry Pi | Correlation factor R2 = 88.7% for ambient light and 99.8% under LED. | [33] |
| Multiple linear regression | Outdoor PAR measurement | AS-7341 | LI-190 with Li-250A light | LoRa-WAN | 360 nm to 760 nm | Not mentioned | Wireless | R2 of 0.991 obtained. | [34] |
| Multi-linearregression | Greenhouse and field monitoring | AS-7341 | SS-110 spectroradiometer | Raspberry Pi 3 B+ | 400–700 nm | Not mentioned | Google cloud storage | PPFD is tracked with 0.3% error. | [31] |
| Machine learning method (Decision tree and Random Forest models) | Greenhouse and field monitoring | AS-7341 | SS-110 spectroradiometer | Raspberry Pi 3 B+ | 400–700 nm | Not mentioned | Google cloud storage | Mean absolute percentage errors (MAPEs) of 0.01–0.88% | [32] |
| Vector quantization | Indoor controlled lighting system and outdoor | AS7265x | Black comet spectroradiometer | Windows 10 laptop with an i7 processor | 410–940 nm | Not mentioned | Serial data transmission to laptop | A 12.51% average error was obtained. | [30] |
| Linear regression | Indoor greenhouse setup | AS7341 | Solar Electric Quantum Meter #3415FSE | ESP32 S2 TFT Feather | 400–700 nm | USD 51 | N/A (LCD display) | [35] |
| Regression Statistics | Multiple Linear Regression Calibration Co-Efficient | |||||
|---|---|---|---|---|---|---|
| Coefficients | Standard Error | t Stat | p-Value | |||
| Multiple R | 0.999891 | Intercept (b0) | −1.83008 | 0.898409 | −2.03702 | 0.042778 |
| R Square (R2) | 0.999782 | 415 nm (b1) | −0.10893 | 0.185726 | −0.58649 | 0.558117 |
| Adjusted R Square | 0.999774 | 445 nm (b2) | −0.19323 | 0.152327 | −1.26855 | 0.205867 |
| Standard Error | 1.97794 | 480 nm (b3) | 0.149401 | 0.099145 | 1.506898 | 0.133191 |
| Observations | 242 | 515 nm (b4) | 0.234282 | 0.11797 | 1.985939 | 0.048212 |
| 555 nm (b5) | 0.019283 | 0.084076 | 0.229355 | 0.818794 | ||
| 590 nm (b6) | −0.1623 | 0.058166 | −2.79027 | 0.005702 | ||
| 630 nm (b7) | 0.133297 | 0.033919 | 3.92987 | 0.000112 | ||
| 690 nm (b8) | 0.087622 | 0.029122 | 3.00877 | 0.002911 | ||
| Regression Statistics | Multiple Linear Regression Calibration Co-Efficient | |||||
|---|---|---|---|---|---|---|
| Coefficients | Standard Error | t Stat | p-Value | |||
| Multiple R | 0.99659 | Intercept (b0) | −1.9196374 | 0.36951 | −5.19507 | 0.00000 |
| R Square (R2) | 0.99319 | 415 nm (b1) | 4.7280568 | 0.08699 | 54.35164 | 0.00000 |
| Adjusted R Square | 0.99315 | 445 nm (b2) | −0.6033910 | 0.13967 | −4.32009 | 0.00002 |
| Standard Error | 8.88614 | 480 nm (b3) | −1.5187001 | 0.10148 | −14.96531 | 0.00000 |
| Observations | 1390 | 515 nm (b4) | 0.4630669 | 0.13534 | 3.42156 | 0.00064 |
| 555 nm (b5) | 0.6610031 | 0.09463 | 6.98546 | 0.00000 | ||
| 590 nm (b6) | −1.6748574 | 0.07769 | −21.55799 | 0.00000 | ||
| 630 nm (b7) | 0.7903176 | 0.05275 | 14.98284 | 0.00000 | ||
| 690 nm (b8) | −0.2266746 | 0.04864 | −4.65997 | 0.00000 | ||


Disclaimer/Publisher’s Note: The statements, opinions and data contained in all publications are solely those of the individual author(s) and contributor(s) and not of MDPI and/or the editor(s). MDPI and/or the editor(s) disclaim responsibility for any injury to people or property resulting from any ideas, methods, instructions or products referred to in the content. |
© 2025 by the authors. Licensee MDPI, Basel, Switzerland. This article is an open access article distributed under the terms and conditions of the Creative Commons Attribution (CC BY) license (https://creativecommons.org/licenses/by/4.0/).
Share and Cite
Rahman, M.M.; Jamil, U.; Pearce, J.M. Open-Source Photosynthetically Active Radiation Sensor for Enhanced Agricultural and Agrivoltaics Monitoring. Electronics 2025, 14, 2225. https://doi.org/10.3390/electronics14112225
Rahman MM, Jamil U, Pearce JM. Open-Source Photosynthetically Active Radiation Sensor for Enhanced Agricultural and Agrivoltaics Monitoring. Electronics. 2025; 14(11):2225. https://doi.org/10.3390/electronics14112225
Chicago/Turabian StyleRahman, Md Motakabbir, Uzair Jamil, and Joshua M. Pearce. 2025. "Open-Source Photosynthetically Active Radiation Sensor for Enhanced Agricultural and Agrivoltaics Monitoring" Electronics 14, no. 11: 2225. https://doi.org/10.3390/electronics14112225
APA StyleRahman, M. M., Jamil, U., & Pearce, J. M. (2025). Open-Source Photosynthetically Active Radiation Sensor for Enhanced Agricultural and Agrivoltaics Monitoring. Electronics, 14(11), 2225. https://doi.org/10.3390/electronics14112225