1. Introduction
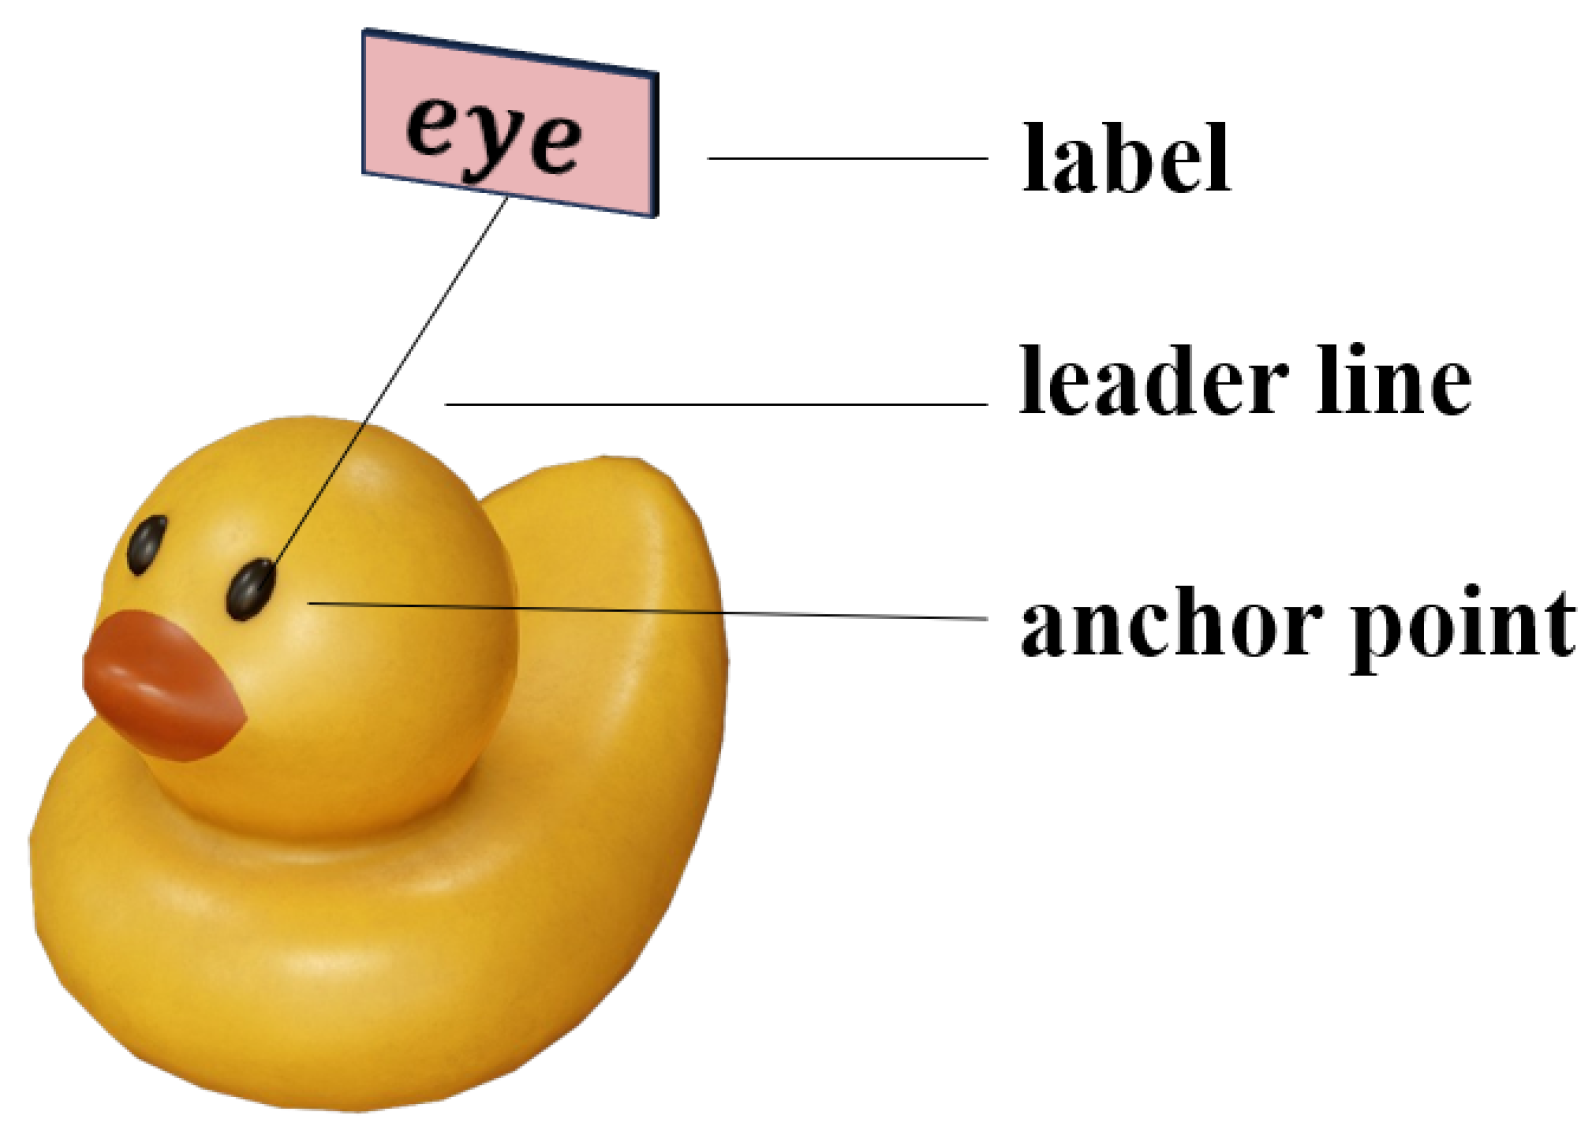
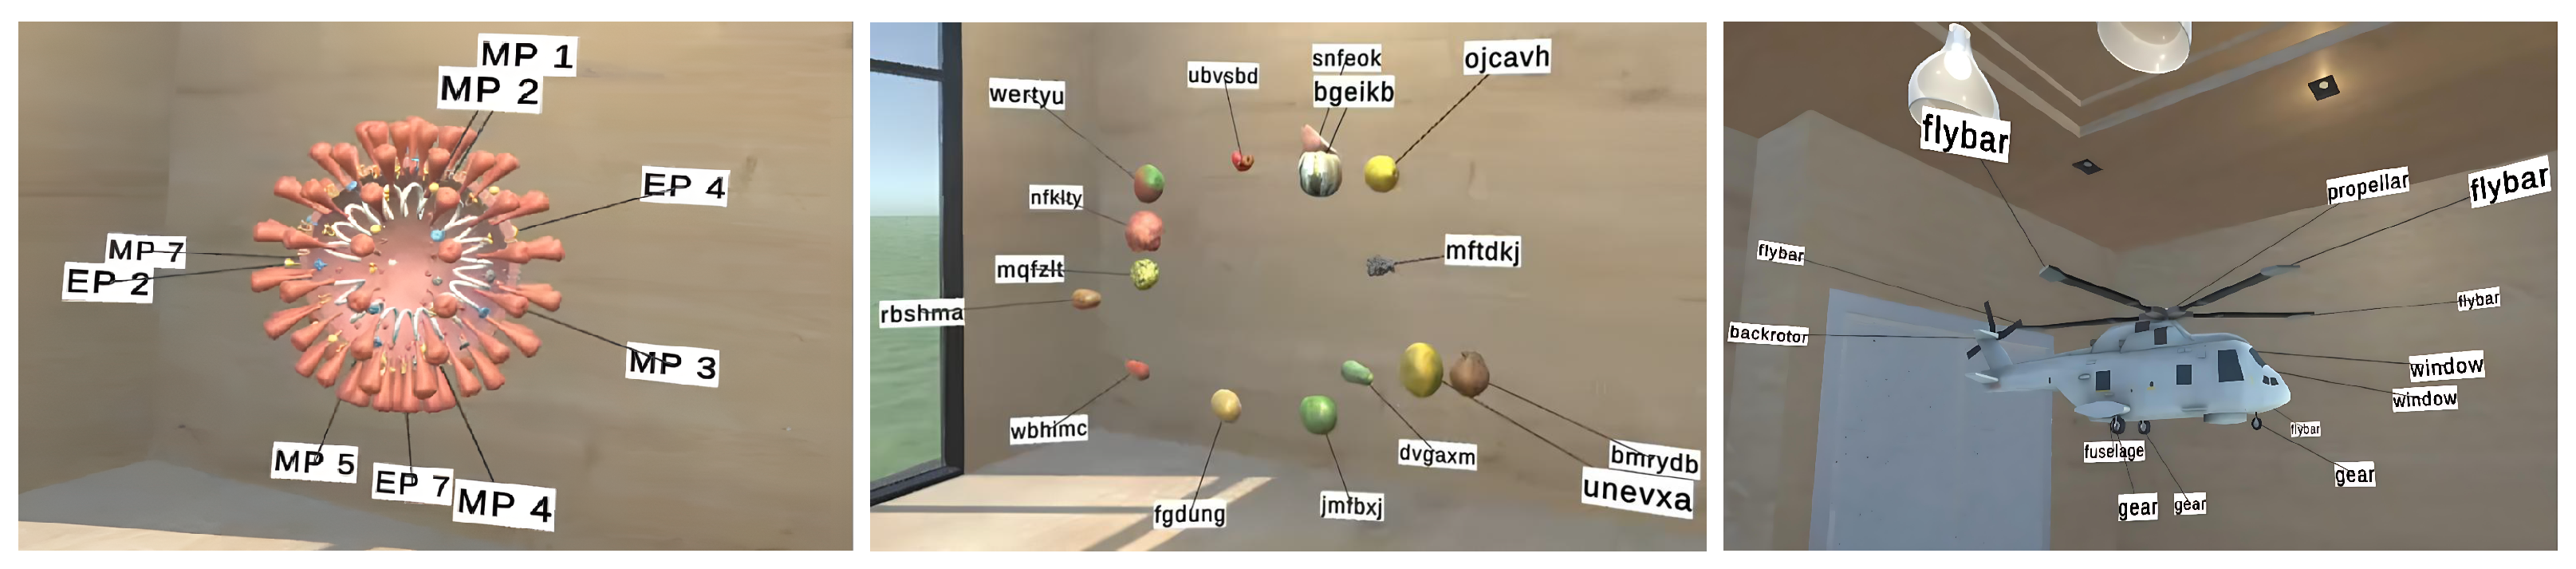
Clear information presentation is critical for users in 3D environments, particularly in immersive virtual reality (VR) or augmented reality (AR) applications. Labeling complex 3D structures or compositions allows users to quickly understand the functionality or attributes of objects. A common approach to improving visual clarity is through textual annotations, which provide additional details about objects in the scene. As shown in
Figure 1, these labels typically consist of three key components: the text label itself, an anchor point marking the specific object being described, and a connecting line, commonly referred to as a “leader line”. An effective label layout enhances interaction efficiency by providing key information at a glance, reducing the time and effort needed to search for relevant details. However, despite ongoing advancements, existing methods still face significant challenges when dealing with label layout in dynamic 3D scenes with changing viewpoints.
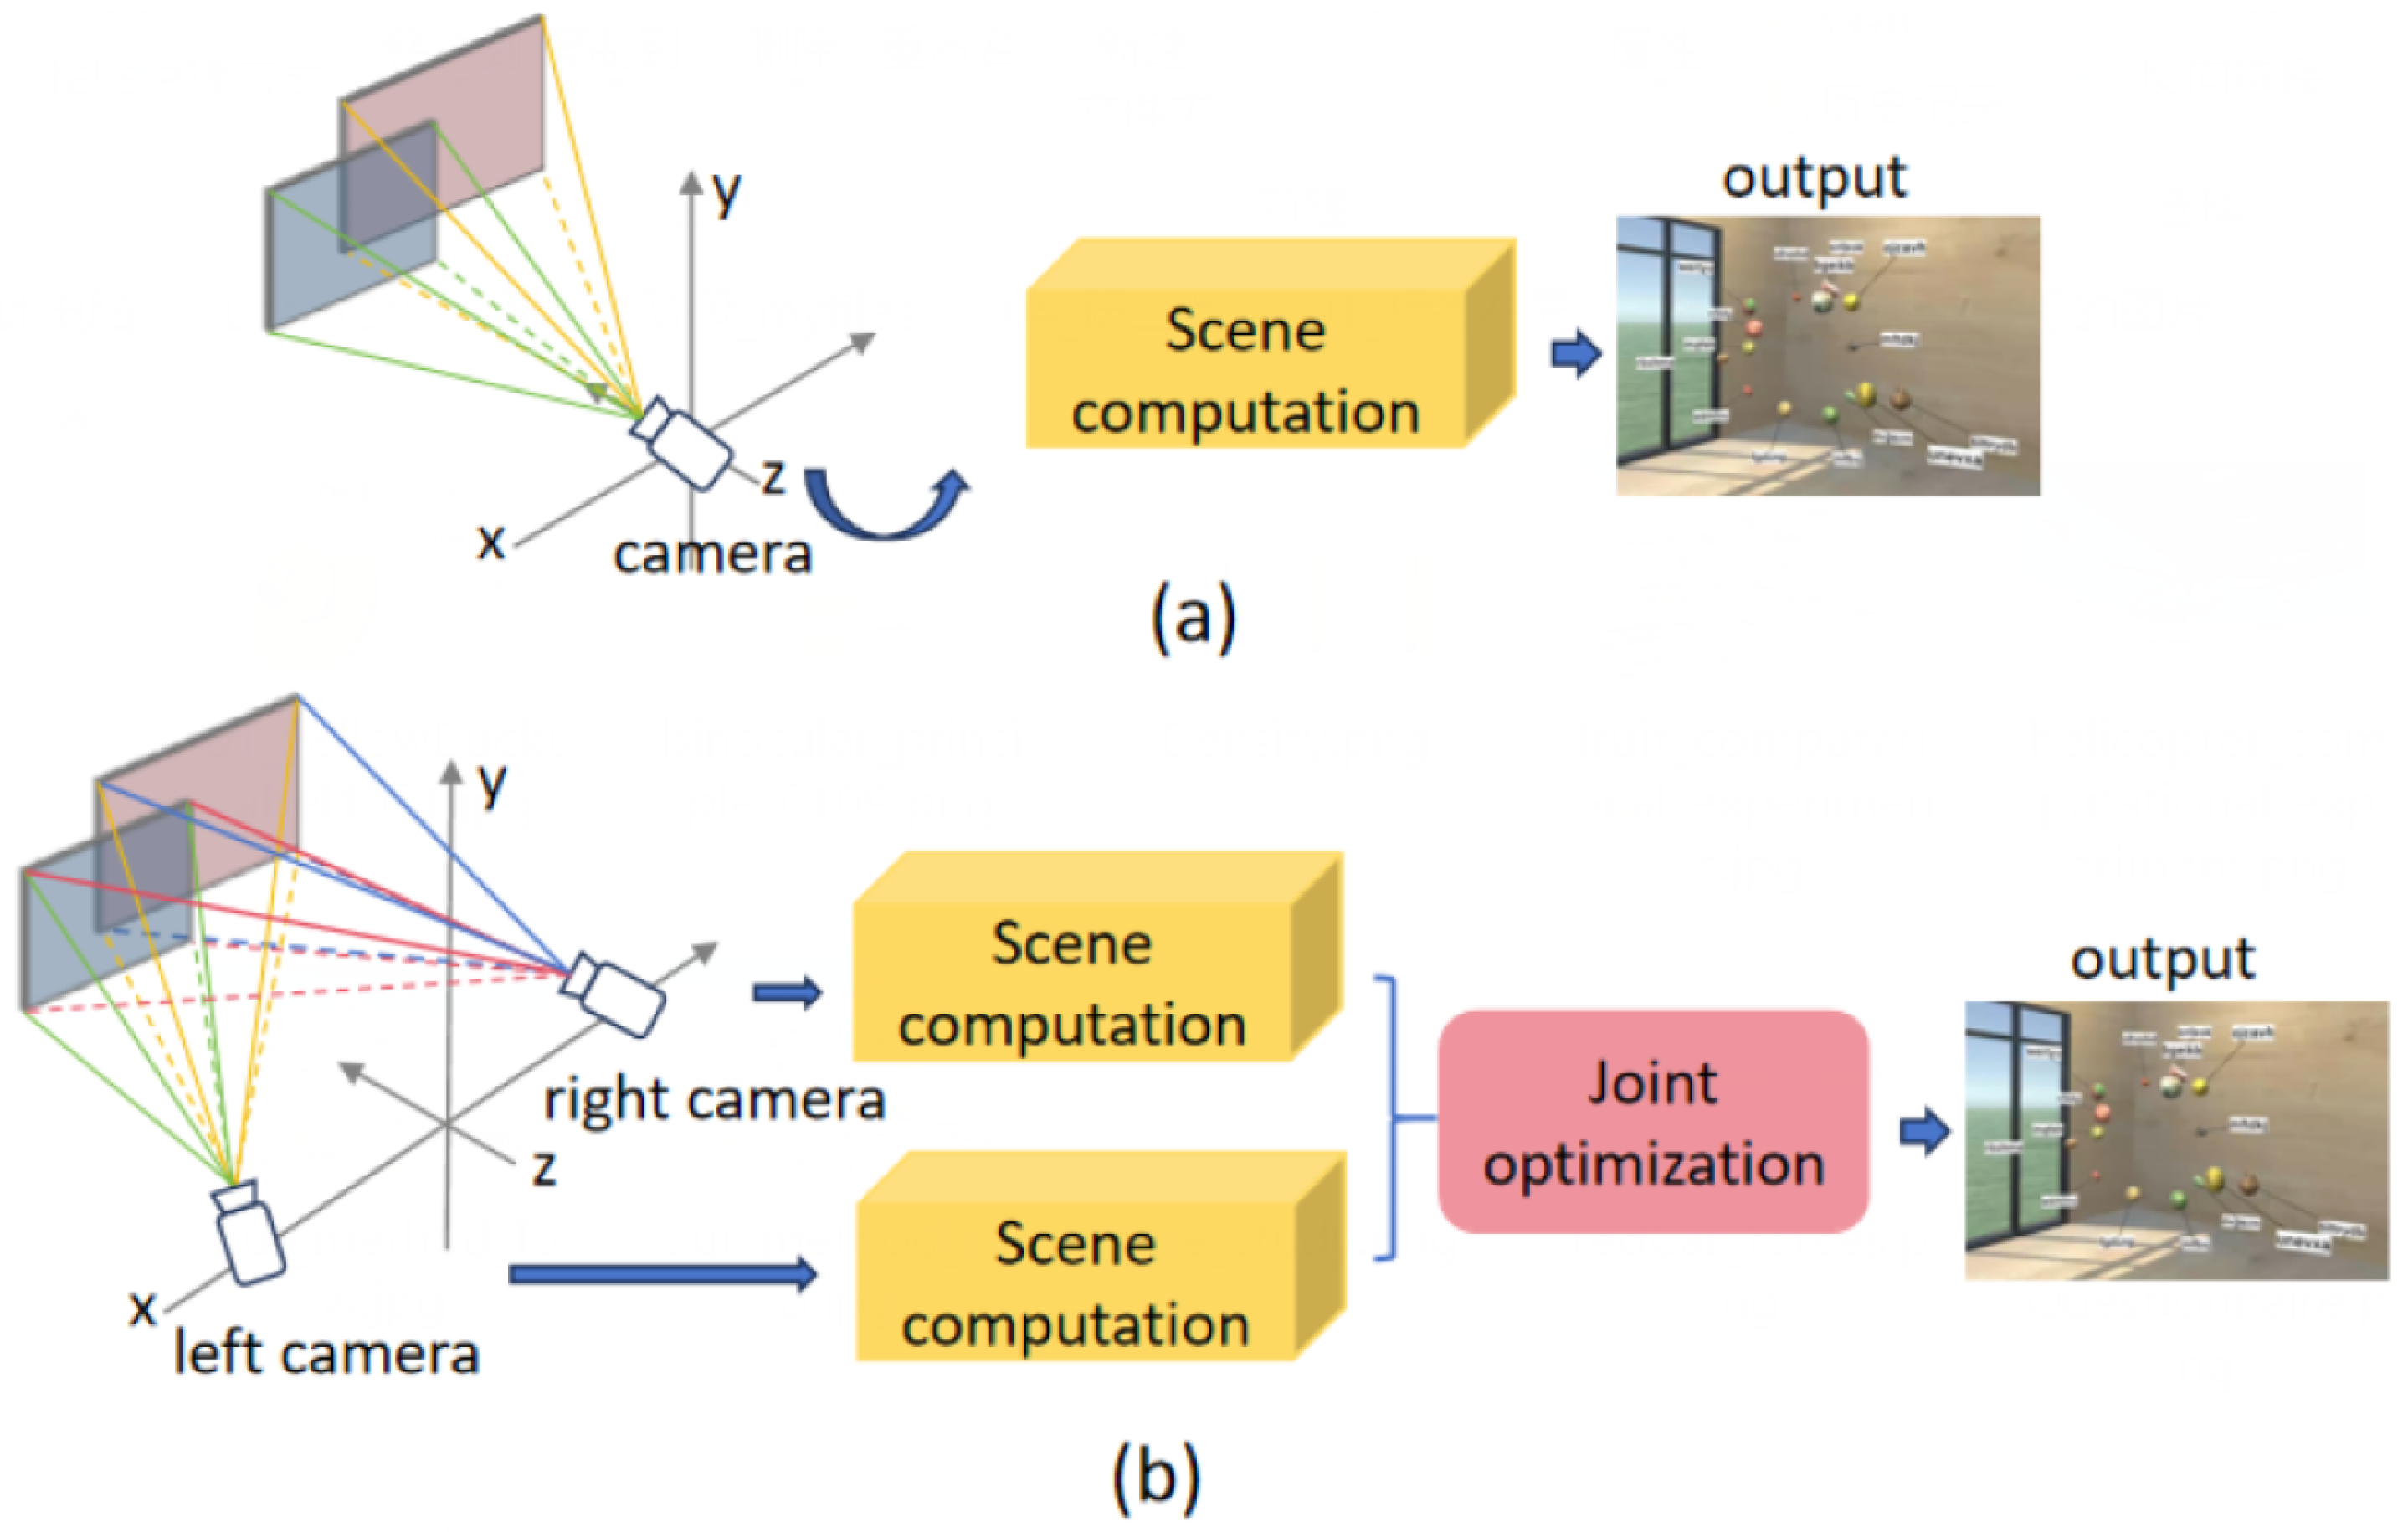
A critical yet largely unaddressed challenge in 3D label layouts is the detrimental impact of binocular double vision—both between labels themselves and between labels and scene objects—on user experience. Current label placement methods primarily eliminate overlaps in monocular optimization. While this achieves label separation in the central view (
Figure 2e), it inevitably causes residual overlap in the right-eye view (
Figure 2f) due to ignored binocular disparity. This phenomenon mirrors how holding a finger close to your eyes makes it appear to “jump” sideways when alternating between left-/right-eye views. Recent work has begun exploring binocular vision for label optimization. Peterson et al. [
1] improved label clarity and readability by distributing overlapping labels at different depths, while Emsenhuber et al. [
2] optimized label layouts under binocular viewpoints to prevent double vision caused by differing backgrounds. However, these approaches still neglect label–label and label–object double vision. To the best of our knowledge, no prior work has addressed the negative effects of binocular double vision on user experience within the specific context of 3D label placement.
Another challenge in dynamic 3D label layout lies in maintaining the efficacy of discrete update strategies when the number of labels in the scene increases. While label layout optimization under variable user viewpoints has garnered attention [
3,
4,
5], many image-space methods exhibit unpredictable layout changes with viewpoint shifts, diminishing consistency and user experience. To tackle this, Tatzgern et al. [
6] proposed a view management method for placing external labels in 3D object space, representing a significant advancement in the labeling of static 3D objects. While Tatzgern et al. employed a discrete update strategy, it still suffers from suboptimal layouts at certain moments due to its discrete nature. Madsen et al. [
7] further demonstrated that a discrete update strategy, calculated from a single initial viewpoint, generally outperforms continuous strategies. However, Madsen et al.’s approach, for instance, addressed label overlap primarily through parallax effects between label planes, inadvertently introducing double vision and reducing user comfort. More importantly, as label density increases, accurately positioning these planes to eliminate overlap across numerous viewpoints becomes exponentially more complex. This raises a critical question: can discrete update strategies remain advantageous when a high label count requires intricate and potentially conflicting arrangements to prevent overlap across multiple viewpoints? Therefore, when the number of labels in the scene increases, these limitations present a significant hurdle to realizing the full potential of discrete update strategies in dynamic 3D label layouts.
To address these challenges, our work has two primary goals: first, to reduce the double vision effect between labels and between labels and objects and improve user experience; and second, to alleviate the limitations of discrete update strategies when the number of labels increases. In this paper, we present a 3D dynamic label layout method based on a continuous updating strategy [
8]. Our method simultaneously optimizes label positions for both left- and right-eye viewpoints, effectively reducing double vision between labels and between labels and objects caused by binocular disparity. To achieve smooth and adaptive label movement, we adopt a force-based placement mechanism, where labels dynamically adjust their positions under the influence of calculated forces in each frame. As double vision between labels caused by binocular disparity has rarely been explored in the existing literature, we conducted a user study to investigate its impact on users.
In the computational assessment, our method was evaluated in three scenarios, effectively mitigating double vision and outperforming baseline methods in reducing label overlap and leader line crossings. We further conducted a user study where participants completed a label-reading task while their task completion time, workload scores (NASA-TLX [
9]), and subjective questionnaire were collected. The results indicate that, compared to the baseline methods, our approach enables users to read the label more quickly, particularly in high-density label environments. Moreover, it achieved significantly better performance in workload scores and subjective questionnaire responses.
In summary, our main contributions are as follows:
We demonstrate that double vision between labels caused by binocular disparity negatively impacts user experience, introducing a binocular optimization strategy to address this issue under dynamic viewpoints.
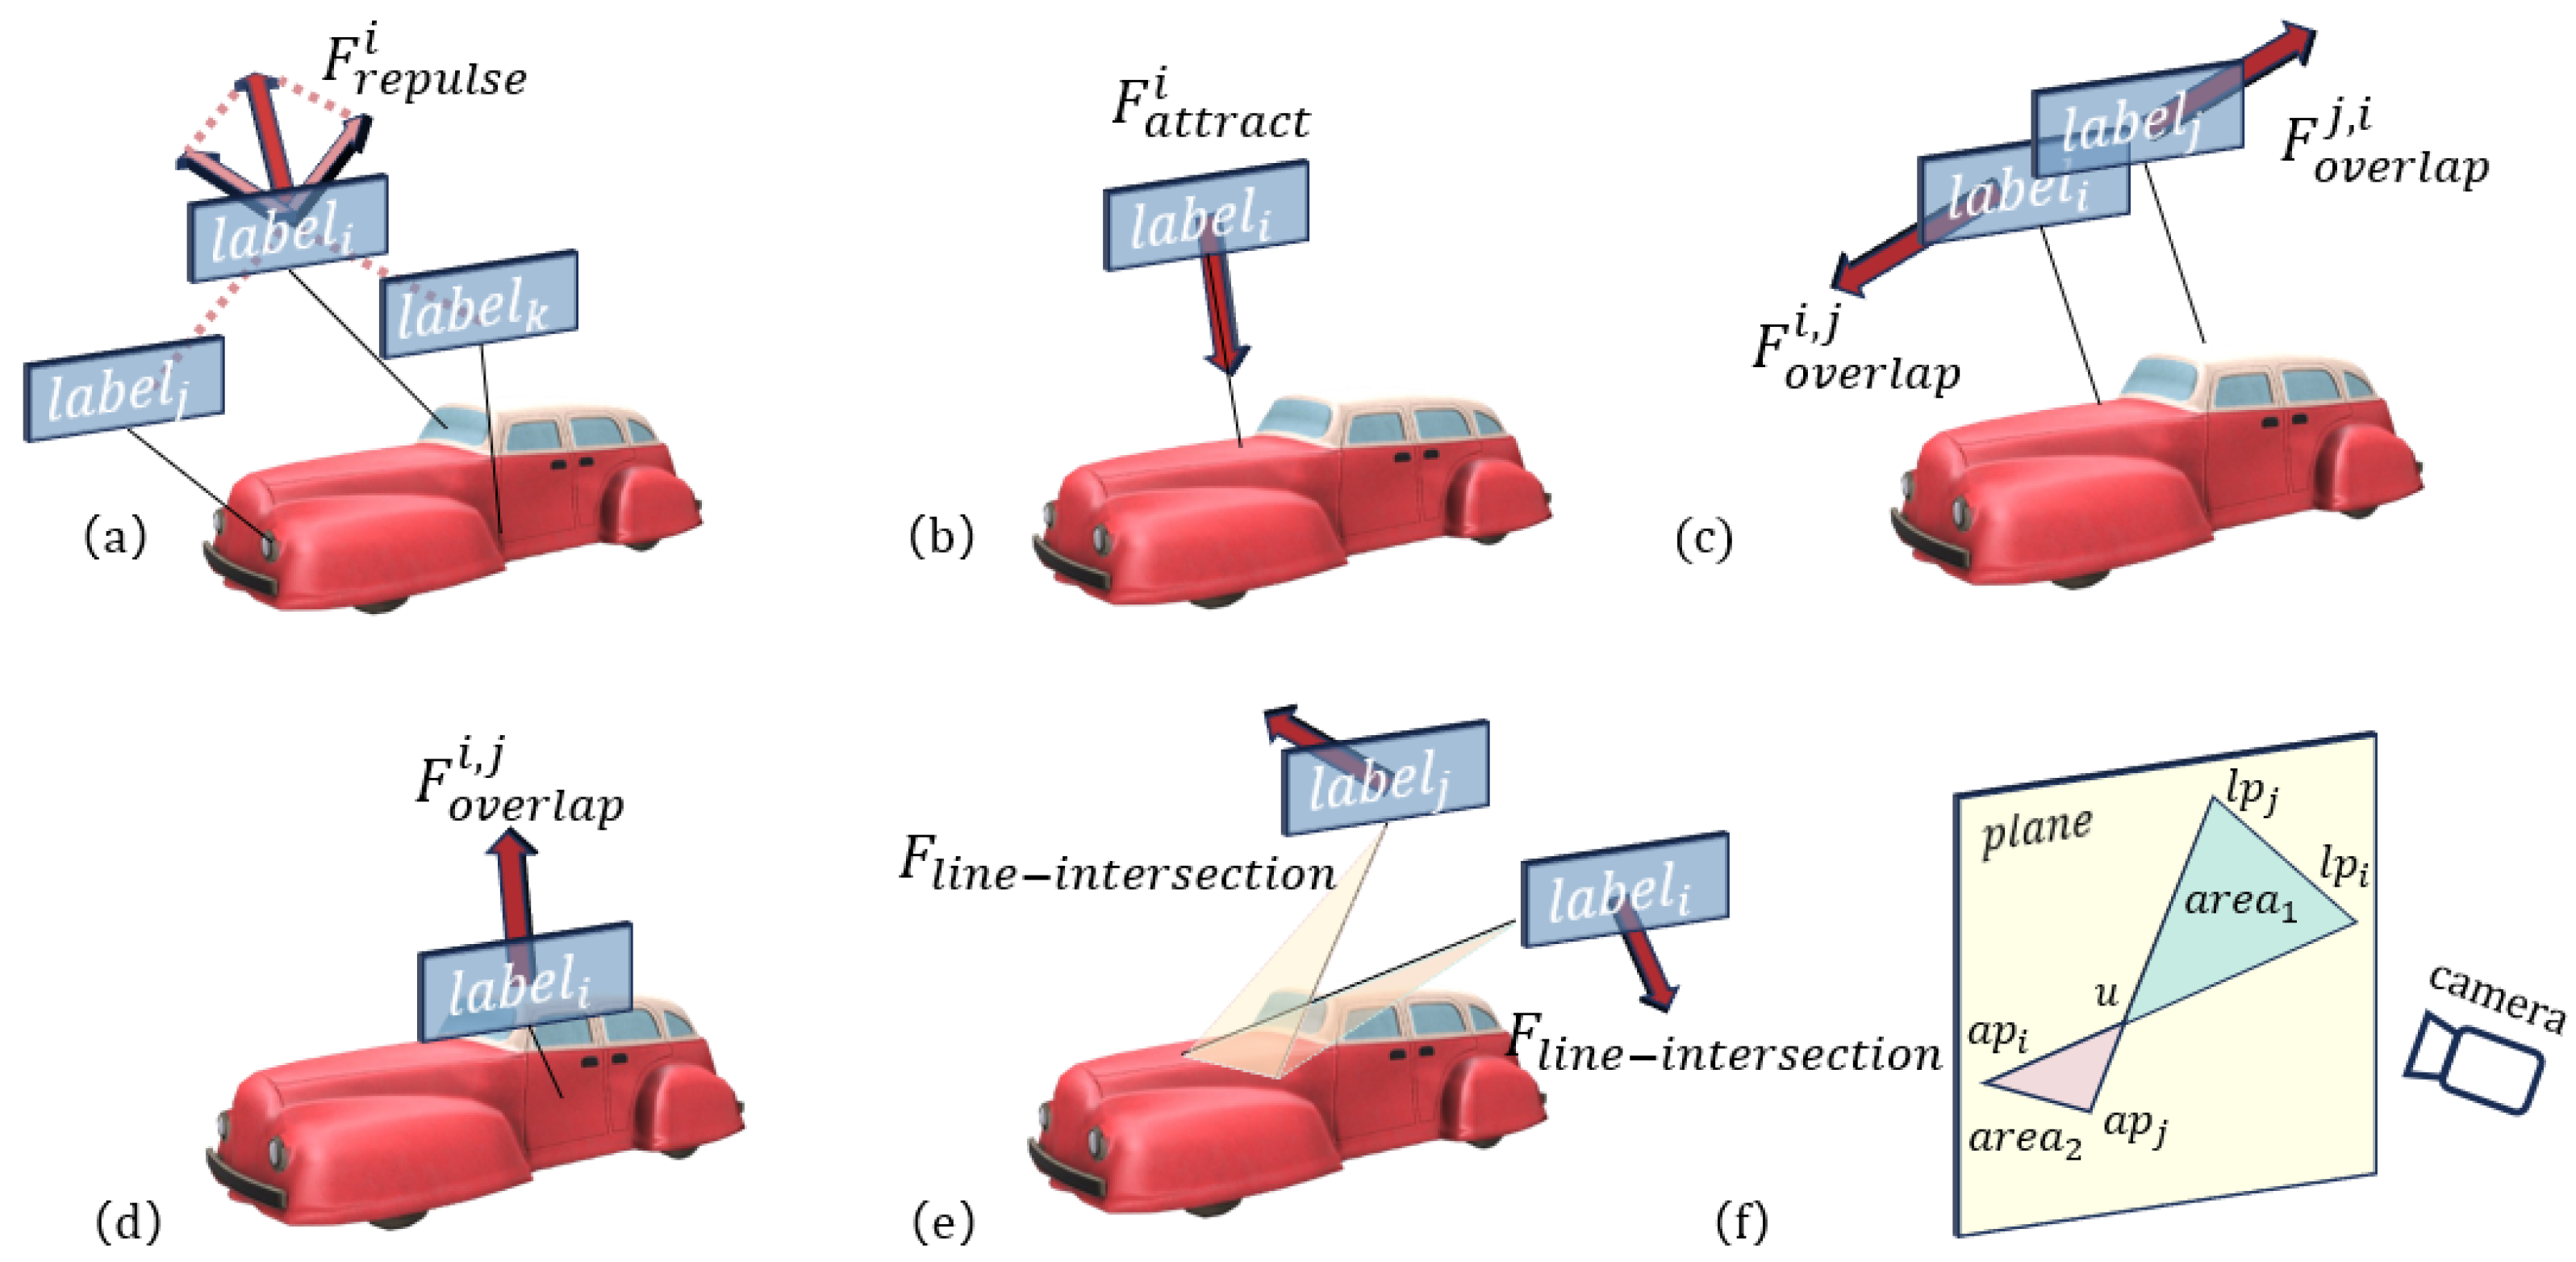
We propose a 3D dynamic label layout method based on a continuous updating strategy, enabling labels to update their positions under the influence of multiple forces.
We evaluate the proposed method through computational assessment and a user study, demonstrating its overall superiority over baseline methods.
2. Related Work
The study of label layout can be traced back to the 1970s. In 1975, Imhof et al. [
10] provided foundational guidelines for placing names on maps to improve both readability and aesthetic quality. In recent years, automatic label layout has become an increasingly active research area. However, many label layout problems have been proven to be NP-hard [
11], which means it is computationally infeasible to find exact solutions within polynomial time. As a result, researchers commonly rely on heuristic or approximation algorithms to address these challenges rather than seeking exact polynomial-time solutions.
Existing label layout methods can generally be classified into two categories based on the space in which labels are placed: image space (2D) and world space (3D). In image space, elements are positioned on the screen for readability and clarity (
Section 2.1). In world space, labels adjust dynamically based on the viewer’s distance and viewpoint, providing a more immersive and context-aware user experience (
Section 2.2). The respective advantages and challenges of 2D and 3D label layouts will be presented in
Section 2.3. For a more comprehensive review of label layout methods, we recommend referring to [
11,
12].
2.1. Label Layouts in Image Space
Hartmann et al. [
13] introduced an image-space floating label system using dynamic potential fields. Although this system was effective, it did not address leader line crossings or maintain label coherence in dynamic scenes. They later implemented real-time label arrangements by projecting 3D scenes onto 2D space [
4].
Image-driven methods are frequently used for 2D boundary labeling. Bekos et al. [
14] proposed placing labels along polygonal boundaries, connecting them with non-overlapping leader lines. Their subsequent work [
15] explored variations to improve aesthetic label placement. Heinsohn et al. [
16] developed a boundary labeling system for 2D biological networks, offering four distinct label arrangement strategies and allowing dynamic focus region movement.
Deep learning has also been applied to 2D label placement. Qu et al. [
17] proposed a Label Placement Graph Transformer (LPGT), formulating label placement as a node prediction problem on a graph. Their method uses attention mechanisms to capture label interactions and outperforms existing approaches on the AMIL dataset.
In mobile mixed reality, Shibata et al. [
18] proposed an image-space labeling method tailored for mobile devices. Čmolík et al. [
5] introduced a real-time labeling technique for illustrations, combining fuzzy logic with greedy optimization. Despite dealing with 3D objects, both methods relied heavily on image-space view management. Ekman [
19] presented a force-based method for real-time labeling of moving objects on maps, which He et al. [
20] later extended with a hybrid optimization approach to achieve smoother dynamic label movements.
Image-space methods are also extensively used in augmented reality. Tatzgern et al. [
21] utilized hierarchical clustering to build a multi-level structure for efficiently managing large datasets within the user’s field of view. Labels are dynamically selected based on user preferences and visual clutter. Similarly, Grasset et al. [
3] proposed an image-driven approach that identifies significant regions within the image, applying geometric constraints derived from visual saliency detection and edge analysis.
2.2. Label Layouts in World Space
World-space label layouts offer significant advantages in enhancing users’ spatial awareness and immersion. Tatzgern et al. [
6] introduced a view management method arranging labels in 3D world space, addressing floating label issues, but its discrete updates can cause constraint violations with viewpoint changes. Sirk et al. [
22] built on this, developing a label layout method for translucent scenarios (common in forensics) by constraining the search space to finite planes at varying depths, improving search efficiency. Pick et al. [
23] presented an automated labeling system for immersive VR using shadow volumes to detect occlusions and a force-based approach to reposition labels, though it did not address leader line crossings.
In augmented reality and mixed reality environments, world-space label layouts have also been widely explored. Zhou et al. [
24] arranged labels alphabetically on multiple concentric circles surrounding 3D objects, allowing users to locate specific labels more efficiently. Building on this, Wei et al. [
25] introduced a label-guided target localization method, further enhancing object identification efficiency in VR settings. Köpper et al. [
26] proposed a comprehensive label layout strategy that integrates occlusion management, level-of-detail control, and temporal consistency, treating labels as integral 3D scene elements. More recently, Chen et al. [
27] became the first to apply reinforcement learning to optimize moving object label layouts in AR environments, accounting for both the current and predicted future states of objects and labels to dynamically adjust layouts. Employing reinforcement learning, Gebhardt et al. [
28] presented an approach to learn personalized cooperative labeling policies for mixed-reality systems, optimizing for minimal visual overload during visual search tasks by observing users’ gaze patterns.
Furthermore, labels can be considered a form of user interface element. In recent years, the field of adaptive user interfaces (AUIs) has seen a surge in research. Adaptive user interfaces are defined as user interfaces that dynamically adjust their behavior and presentation based on changes in the user, environment, or task. Within MR environments, common approaches to implementing adaptive user interfaces include optimization-based methods [
29,
30,
31,
32], supervised learning methods [
33], and reinforcement learning methods [
27,
34,
35].
In the context of depth perception, binocular disparity provides users with an intuitive understanding of object positions within a scene. Peterson et al. [
1] demonstrated that increasing the depth difference between overlapping labels could reduce visual search time by 24%. Subsequently, Peterson et al. [
36] extended their research to far-field scenarios (100–120 m), revealing that separating overlapping labels in distant views significantly improved response times. Additionally, Emsenhuber et al. [
2] optimized label layouts by rendering images from the user’s binocular perspective, effectively utilizing scene information from both eyes. However, our experimental findings reveal that while binocular disparity enhances depth perception, it simultaneously introduces double vision, which degrades the overall visual experience.
2.3. Two-Dimensional vs. Three-Dimensional Label Layouts
While label placement in image space is generally simpler than in world space, it introduces inherent limitations. For instance, when users change their viewpoints, unpredictable layout changes can occur due to the transformation of projected 3D points. Tatzgern et al. [
6] observed that label reordering often happens when users move through the environment. Moreover, image-space labels lack depth information, which can result in poor integration between labels and the 3D environment, ultimately reducing the quality of user interaction.
Three-dimensional label layouts, by contrast, offer the potential for more intuitive and spatially consistent labeling, better leveraging the user’s understanding of the 3D environment. This is especially true for dynamic 3D label layouts, where labels can adapt and move within the 3D scene. However, this approach presents significant challenges. Algorithms must consider the complexity of the scene, the user’s viewpoint, and the potential for label overlap [
37]. Furthermore, ensuring label stability and preventing visual clutter becomes increasingly difficult as the number of labels increases [
21]. Finally, adapting UI element layouts in real time to dynamic viewpoints while preserving spatial relationships and minimizing cognitive load on the user remains a complex optimization problem [
38].
To address the limitations of existing label layout methods in adapting to dynamic viewpoints and mitigating double vision caused by binocular disparity, this paper proposes a force-based real-time dynamic 3D label layout method under binocular viewpoints. This approach allows labels to move freely within 3D scenes, ensuring visual consistency and reducing occlusions for an enhanced user experience.
3. Preliminary Study
Binocular disparity arises from the slight difference in images captured by the left and right eyes due to their distinct viewpoints. In a 3D environment, each eye perceives a slightly offset view, and the brain integrates these images to construct a stereoscopic perception.
Figure 2 illustrates label layouts from left-eye, central, and right-eye perspectives.
Binocular disparity can cause double vision between labels or between labels and objects. This occurs when depth differences result in the left and right eyes perceiving labels at misaligned positions, making visual fusion difficult. When two labels (or a label and an object) are positioned at significantly different depths, their disparity increases, preventing the visual system from merging them into a single coherent image. As a result, users may perceive duplicated or misaligned labels, leading to visual discomfort and reduced readability.
However, most existing layout methods optimize label placement only from a central viewpoint. As shown in
Figure 2d–f, while overlap is resolved in the central view, it persists in the right-eye view. Consequently, when the brain combines both eye images into a unified 3D perception, users still experience double vision [
39].
To investigate the impact of binocular parallax-induced double vision between labels on users, we conducted an exploratory user study. The evaluation considered readability, visual comfort, aesthetics, and interactivity of labels. In this work, the interactivity of labels refers to the ability of users to select a specific label within the 3D scene. User perceptions of this interactivity were qualitatively evaluated using Likert-scale questions, the specific design of which is detailed in the “Measures” Section of this chapter. This study was approved by our institution’s ethics committee.
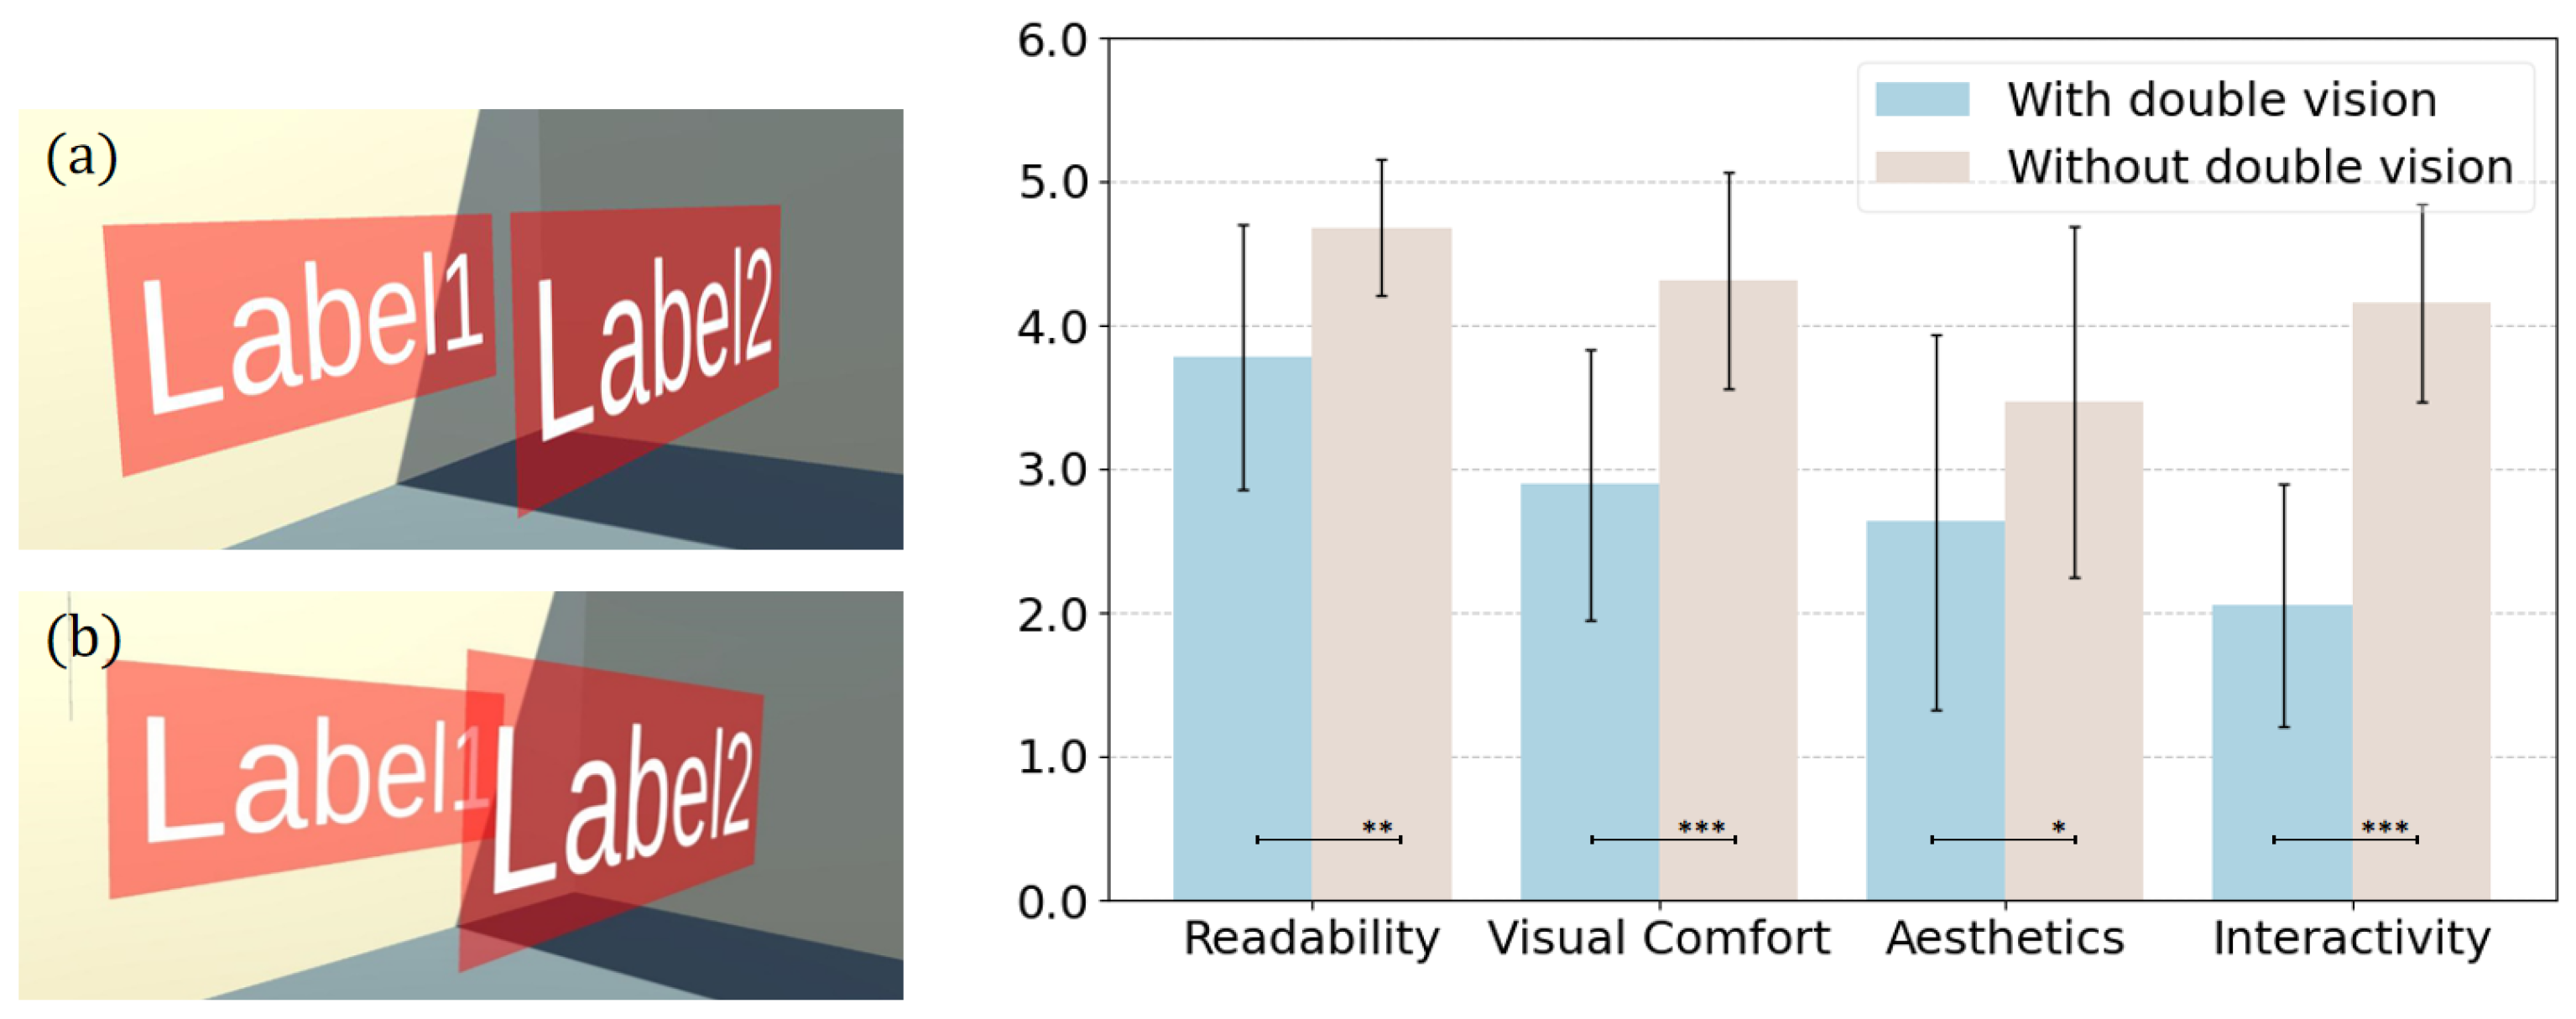
Study design. We designed two scenes to compare the effects of double vision between labels. Scene 1 (
Figure 3(left, b)): in the left-eye viewpoint, labels do not overlap, whereas in the right-eye viewpoint, labels overlap, resulting in double vision. Scene 2 (
Figure 3(left, a)): labels do not overlap in either eye’s viewpoint, eliminating double vision. To ensure that the label overlap caused by binocular disparity was consistent across participants, we marked a fixed observation point in the scenes, requiring all users to stand at the same position. Additionally, label height was adjusted based on each participant’s height to align with their eye level. To mitigate potential order effects, we counterbalanced the order in which participants completed the two scenes. After observing both scenes, participants completed a Likert-scale questionnaire to assess readability, visual comfort, aesthetic appeal, and interactivity of the labels.
Participants. A total of 19 participants (11 female, 8 male) were recruited for this study. They range in the age from 20 to 45 (M = 27.2). Among them, 15 participants had prior experience using VR systems, while 4 had little to no experience. All participants had normal or corrected-to-normal vision and reported no significant prior history of motion sickness in VR environments. Informed consent was obtained from all participants before the study.
Study flow. In the study flow, participants were given a brief overview of the study’s purpose. Participants observed layouts in both scenarios. In scene 1, double vision between labels occurs due to binocular disparity, whereas in scene 2, it is absent.
Measures. A five-point Likert scale was used to collect user feedback, with the following questions: Is the text on the labels easy to read (Q1, Readability)? Is reading the labels visually comfortable (Q2, Visual Comfort)? Does the label layout affect aesthetic appeal (Q3, Aesthetics)? In this context, are the speed and accuracy of selecting labels with a controller affected (Q4, Interactivity)?
Methods for data analysis. A paired-sample
t-test was employed to assess whether significant differences exist in readability, visual comfort, aesthetic appeal, and interactivity. First, the Shapiro–Wilk test was conducted to assess whether our data approximately followed a normal distribution. Subsequently, a paired-sample
t-test [
40] was performed to evaluate the significance of the
p-values. If significant differences were found, further analysis of effect sizes was conducted. Cohen’s d [
41] was used to evaluate the effect size of the differences, where values in the range of [0.5, 0.8) indicate a medium effect, and values greater than 0.8 signify a large effect.
Results. Prior to analysis, we conducted the Shapiro–Wilk test, confirming that the data approximately followed a normal distribution. As is shown in
Figure 3(right), a paired-sample
t-test showed significant differences between the two conditions across all measures. The experimental results (as shown in
Table 1) indicate that the most significant differences between the two experimental conditions were observed for visual comfort and interactivity, followed by readability and aesthetics.
Discussion. Compared to labels with double vision, those without double vision significantly enhance visual comfort and interactivity, while moderately improving readability and aesthetics. These results suggest that eliminating double vision is crucial for improving user experience.
6. User Study
We conducted a user study to evaluate whether our method facilitates faster comprehension of scene information in dynamic environments. This study was approved by our institution’s ethics committee.
6.1. Methods
Apparatus. Our label layout application was developed using the Unity game engine (version 2022.3.8f1c1), utilizing the XR Interaction Toolkit (version 2.4.3) to manage virtual reality interactions. The application was tested on a Nolo VR headset, which was connected to a laptop equipped with an Intel i9-13900 2.20 GHz CPU, an NVIDIA GeForce RTX 4090 GPU, and 32 GB of RAM.
Participants. We recruited 24 participants (13 female, 11 male) aged between 20 and 45 years (M = 26.5). Among them, 17 had prior experience with VR systems, while 7 had little to no experience. All participants had normal or corrected-to-normal vision and reported no significant history of motion sickness in VR environments. Informed consent was obtained from all participants prior to the study.
Study design. We employed a within-subject design with nine scenes, defined by two independent variables: METHOD (
Baseline,
Hedgehog,
BinoForce) and DENSITY (
Low,
Medium,
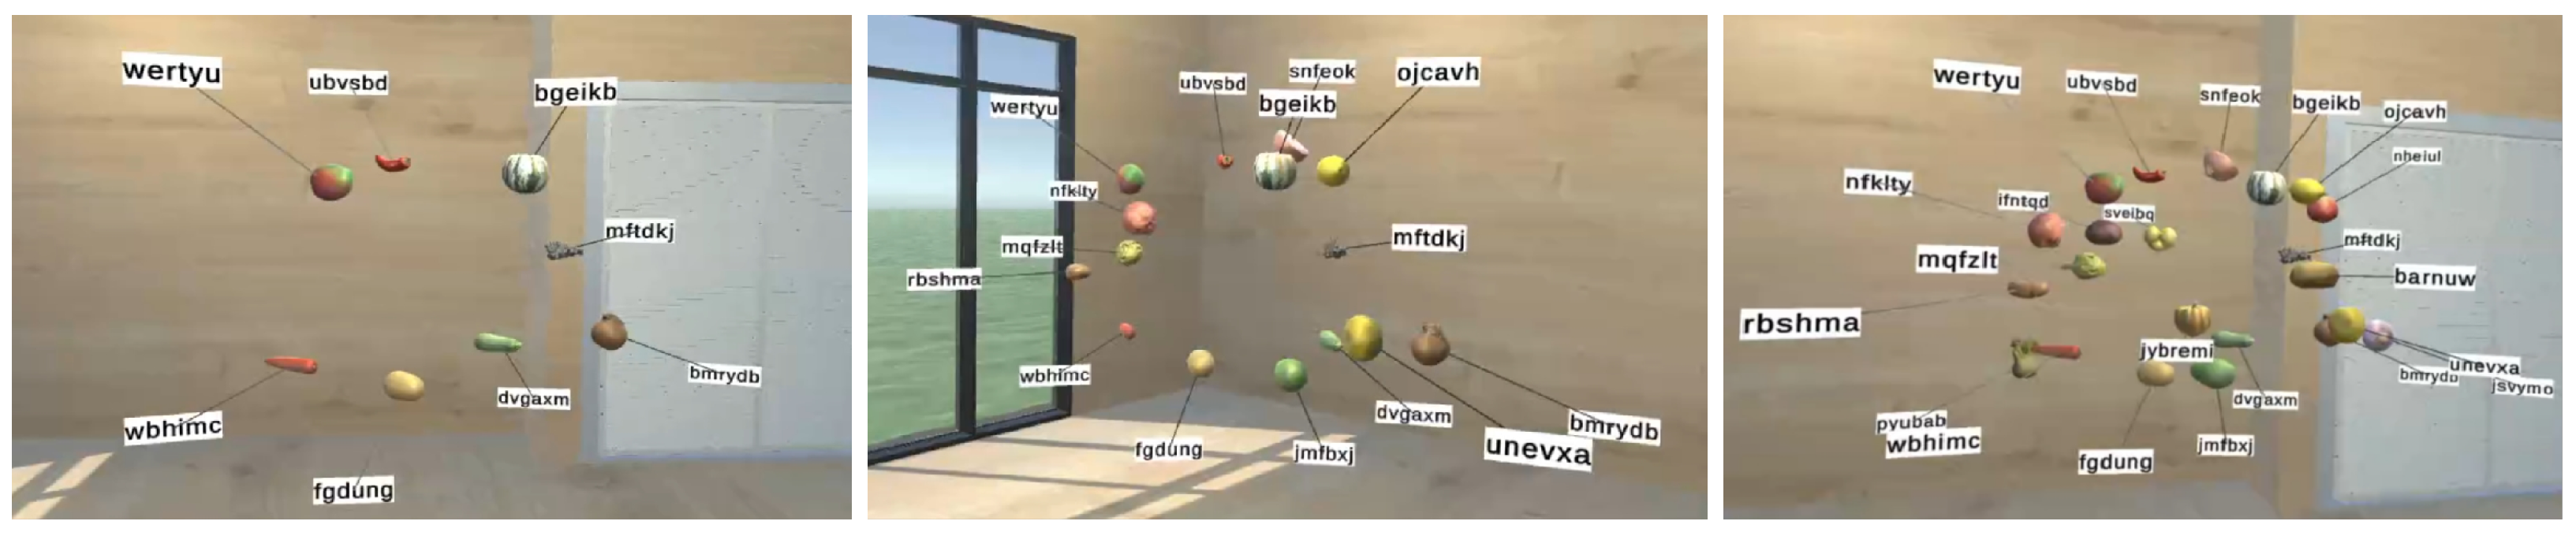
High). Each scene consisted of a 1 m × 1 m × 1 m cube, where 10, 17, and 24 objects were placed in the cube in the low-, medium-, and high-density conditions, respectively (
Figure 7). Each object was associated with a label displaying a randomly generated six-letter English string, as is illustrated in
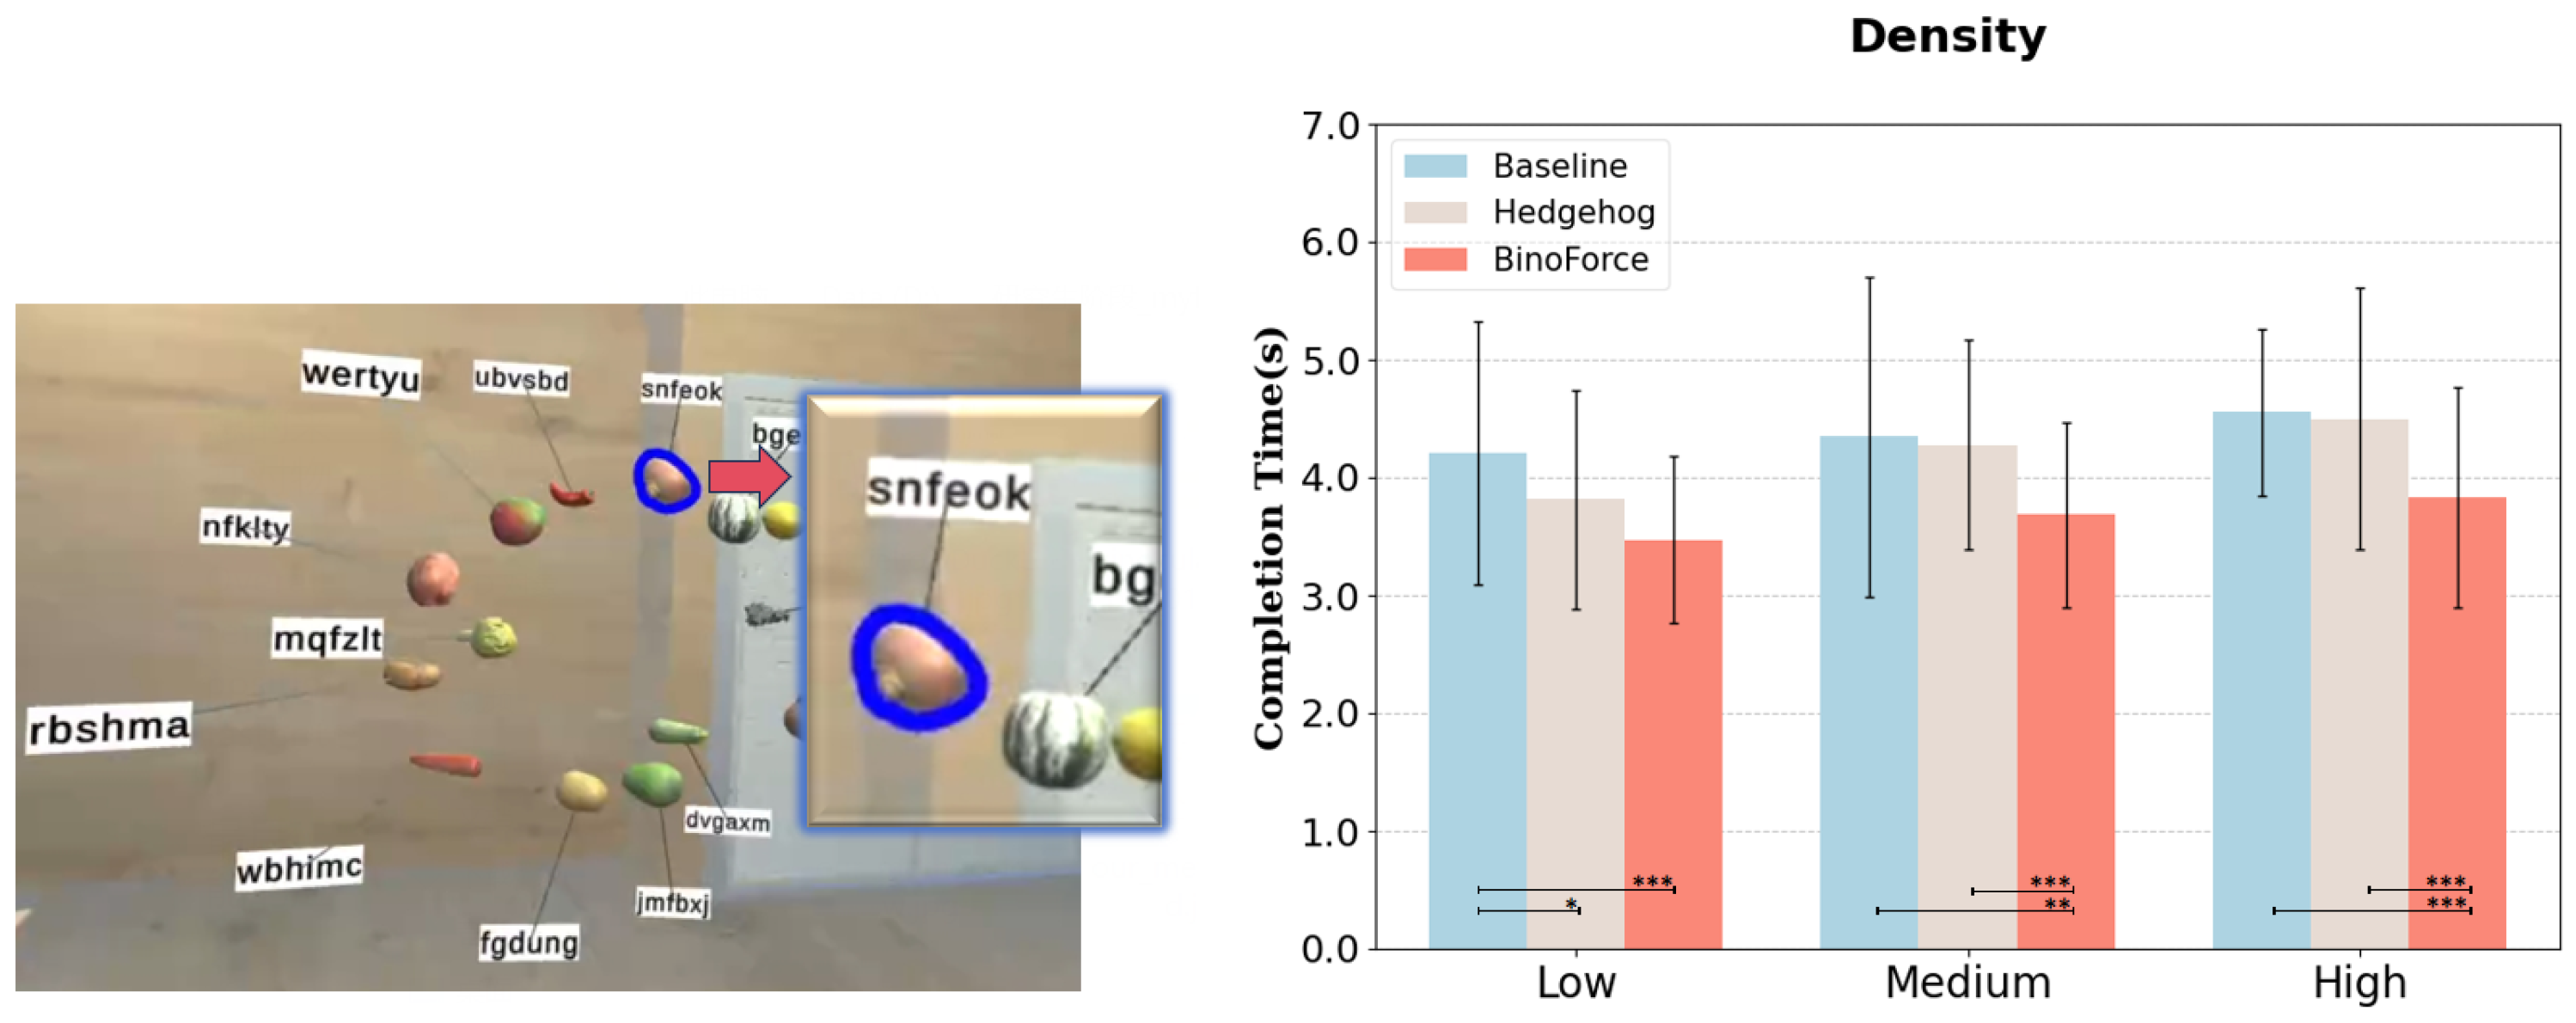
Figure 8(left). Participants were asked to move freely within a range of 1 to 2 m from the cube, observing the generated label layout from any perspective. In each scene, participants performed a label-reading task: at random intervals, a randomly selected object was highlighted in blue. Upon seeing the highlight, the participant was required to read the corresponding label aloud. Each scene included seven repetitions of this task. In total, we collected 1512 trials (24 participants × 3 methods × 3 density levels × 7 repetitions) of data. A Latin Square design was employed to counterbalance the presentation order and mitigate learning and fatigue effects.
Study flow. Participants first completed an informed consent form and a demographic questionnaire, followed by a brief introduction to the study’s purpose. Before the main experiment, they underwent a short training session in a simple virtual scene to familiarize themselves with the equipment and tasks. Once they confirmed readiness, the experiment commenced. Each participant completed a total of 63 (3 methods × 3 density levels × 7 repetitions) label-reading trials. Participants were instructed to complete the task as quickly and accurately as possible.
Measures. We recorded the task completion time (TCT), measured from the moment an object was highlighted until the participant read its label correctly. After the experiment, participants provided subjective feedback through two questionnaires: a standard NASA-TLX survey [
9] to assess perceived workload and a five-point Likert scale evaluating the effectiveness of each method. For each method, users were required to answer the following five questions: Are the labels clear and easy to read? (Q1, Clarity) Is the label layout visually appealing? (Q2, Aesthetics) Does the label layout remain stable? (Q3, Stability) Does the algorithm effectively adjust the layout when quality deteriorates? (Q4, Adaptability) How satisfied are you with the overall layout? (Q5, Satisfaction) Finally, participants were asked to provide qualitative feedback on the strengths and weaknesses of each method.
Methods for data analysis. A one-way repeated measures ANOVA was conducted to compare task completion time across the three label density conditions. First, the Shapiro–Wilk test [
40] was used to assess the normality of the data, which confirmed that our data followed a normal distribution. Next, we tested the sphericity assumption to evaluate the correlation among conditions. After confirming sphericity, we examined whether significant differences existed among the three methods. Finally, the Bonferroni method was applied for post hoc multiple comparisons to identify specific differences. To analyze the NASA-TLX survey and user questionnaire, the Friedman non-parametric test was used to determine whether significant differences existed among the methods for each metric. The Wilcoxon signed-rank test was then applied to assess the magnitude of these differences.
6.2. Results
Figure 8 presents the results of task completion times under varying label density conditions. For low density, METHOD was found to have a statistically significant effect on completion time, with a large effect size (F
2,46 = 34.898,
p < 0.001). For task completion time across methods, we found significant differences between
Baseline and
Hedgehog (
p < 0.05), as well as between
Baseline and
BinoForce (
p < 0.001). For medium density, METHOD was found to have a statistically significant effect on task completion time, with a large effect size (F
2,46 = 16.375,
p < 0.001). Our method took the least time to complete when compared to
Baseline (
p < 0.01) and
Hedgehog (
p < 0.001). The difference between
Baseline and
Hedgehog was not significant. For high density, METHOD was found to have a statistically significant effect on completion time, with a large effect size (F
2,46 = 25.103,
p < 0.001). Our method took the least time to complete when compared to
Baseline (
p < 0.001) and
Hedgehog (
p < 0.001). The difference between
Baseline and
Hedgehog was not significant.
Figure 9 and
Table 4 present the results of the NASA TLX survey. The Friedman test indicates that the method significantly affects mental demands, physical demands, temporal demands, and effort. However, there is no significant effect on performance and frustrations. In terms of mental demands,
Hedgehog has a significant effect compared to
Baseline (Z = −2.818,
p < 0.01) and
BinoForce (Z = −3.707,
p < 0.001). For physical demands,
BinoForce significantly affects both
Baseline (Z = −3.225,
p = 0.001) and
Hedgehog (Z = −3.659,
p < 0.001). Regarding temporal demands, our method shows a significant effect compared to
Baseline (Z = −3.216,
p < 0.001) and
Hedgehog (Z = −3.289,
p < 0.001). For effort demands, our method shows a significant effect compared to both
Baseline (Z = −2.708,
p = 0.007) and
Hedgehog (Z = −3.686,
p < 0.001).
Figure 9 and
Table 4 shows the results of the user questionnaire. The Friedman test indicates that the method significantly affects clarity, aesthetics, stability, adaptability, and satisfaction. In terms of clarity, our method has a significant effect compared to
Baseline (Z = −3.957,
p < 0.001) and
Hedgehog (Z = −3.364,
p < 0.001). For aesthetics,
BinoForce significantly affects both
Baseline (Z = −3.107,
p = 0.002) and
Hedgehog (Z = −3.520,
p < 0.001). Regarding stability,
Hedgehog shows a significant effect compared to
Baseline (Z = −2.137,
p = 0.033) and
BinoForce (Z = −3.101,
p = 0.002). For adaptability, the data indicated significant differences between
Baseline and
Hedgehog (Z = −2.671,
p = 0.008),
Baseline and
BinoForce (Z = −3.973,
p < 0.001), as well as
Hedgehog and
BinoForce (Z = −2.979,
p = 0.003). For satisfaction, our method significantly affects both
Baseline (Z = −4.001,
p < 0.001) and
Hedgehog (Z = −3.079,
p = 0.002).
6.3. User Feedback
After completing the experiment, participants were asked to provide feedback on each method, highlighting its strengths and weaknesses.
For the Baseline method, several participants positively evaluated the method’s stability, with representative comments including the following: “Highly stable and intuitive” (P9) and “The fixed relative positions between labels and objects allow rapid visual search once leader lines are established” (P10). One participant explicitly noted “This approach enhances label positional stability” (P20). Additionally, some participants (P6, P16) reported that the stability facilitated easier memorization of label locations. However, this stability also introduced occlusion issues, making label reading more challenging. For example, in terms of physical effort, some participants reported that “constantly adjusting the viewing angle to read labels was tiring” (P4) and “It took too much energy to read occluded labels” (P18). In terms of accuracy, one participant mentioned occasional misreading, such as mistaking “h” for “n” (P10).
Regarding the Hedgehog method, approximately half of the participants appreciated its adaptive nature, with comments such as the following: “The dynamic label adjustment effectively mitigates occlusion issues” (P17) and “Real-time label repositioning improves readability” (P5). However, several issues were raised: (1) Abrupt label movements. Some participants found that label positions changed too drastically, making it difficult to memorize their locations (P16, P19). Additionally, sudden updates during label reading forced participants to “constantly shift their gaze” (P12, P13), making it hard to keep up with the moving labels. (2) Unnecessary updates. Two participants mentioned that layout updates occasionally occurred even when not needed (P8, P11). (3) Occlusion. Since the layout was updated discretely rather than continuously, occlusion issues still occurred during movement (P1, P2, P11).
Compared to the other two methods, most participants found BinoForce to provide a clearer and more intuitive label layout, with representative comments including the following: “The labels update their positions smoothly in real time without disruptive jumps” (P12), “Adaptive label movement according to viewpoint changes significantly improves legibility” (P2), and “The system responds instantaneously to user viewpoint changes” (P18). Some participants mentioned that the real-time updates occasionally felt unstable and distracting (P1, P20). However, others considered these updates to be “within an acceptable range” (P4, P6, P11).
6.4. Discussion
Figure 8 shows that our method consistently outperforms
Baseline in task completion time, achieving statistically significant improvements. This indicates that our approach provides a tangible benefit to users regardless of the complexity of the scene. While its performance is comparable to
Hedgehog in low-density conditions, it enables faster label reading in medium- and high-density scenes, highlighting the advantage of our method in more complex environments. As label density increases, the advantages of
Hedgehog’s discrete update strategy gradually diminish. This is likely because labels cannot update their positions in real time, leading to constraint violations during viewpoint changes—an issue that becomes more frequent with higher density. Therefore, we recommend adopting our continuous update strategy in such scenarios, especially when dealing with medium to high label densities where real-time adaptation is crucial for maintaining label clarity and minimizing occlusion.
Figure 9 shows that, compared to the two baseline methods, our approach demonstrates lower physical demands, temporal demands, and effort. The statistically significant improvements in these categories suggest that our method is perceived as less physically taxing, allows users to complete tasks more quickly, and requires less overall exertion. This is a crucial finding, as reduced workload can lead to improved user satisfaction and reduced fatigue, particularly in demanding tasks. Regarding performance and frustration, no significant differences were observed among the three methods, suggesting that a larger-scale user study is needed to enhance statistical power and confirm significance. Additionally, user questionnaire results indicate that our method outperforms the baselines in terms of layout clarity, aesthetics, adaptability, and satisfaction. The statistically significant improvements across these categories suggest that users perceive our method as providing a more understandable, visually appealing, flexible, and ultimately more pleasing experience. These findings reflect the subjective preferences and overall impression of the users, which can significantly impact the adoption and acceptance of the system.
However, both user feedback and questionnaire responses highlight a limitation of our approach in terms of layout stability—a common challenge for continuous update strategies. Nonetheless, some participants noted that while the layout stability of our method is slightly weaker, it remains within an acceptable range. Furthermore, as we have so far only tested our method within a controlled VR environment, future development must address the complexities of real-world AR scenarios. These scenarios present significantly more complex challenges, including greater environmental variability, more unpredictable user movements, and a wider range of potential occlusions. Therefore, future work adapting our method to these more complex real-world settings should focus on robustifying the algorithm against these factors. This includes developing techniques to maintain label clarity and stability even in the presence of significant noise and occlusion. Additionally, we plan to develop an adaptive parameter adjustment mechanism to streamline the parameter tuning process.
In summary, we introduce a binocular 3D dynamic label layout method leveraging a continuous update strategy. Our approach improves task completion time, particularly in dense labeling scenarios, while simultaneously reducing user workload (physical and temporal demands, and effort). User feedback confirms that our method excels in layout clarity, aesthetics, adaptability, and overall satisfaction. While layout stability presents a minor limitation, it remains within acceptable parameters. Overall, our method offers a solution for dynamic 3D labeling, especially where high label density and user experience are paramount.
7. Conclusions
In this paper, we demonstrate that double vision between labels caused by binocular disparity negatively impacts user experience and introduce a binocular optimization strategy to address this issue. Building on this, we propose a 3D dynamic label layout method based on a continuous updating strategy that incorporates a binocular optimization strategy. This method simultaneously optimizes label layouts from both the left- and right-eye perspectives while applying force-based adjustments to dynamically refine the layout.
Experimental results show that our method effectively reduces the occurrence of double vision, label overlap, and leader line crossings in 3D scenes. Subjective and objective evaluations confirmed that our method significantly improves layout clarity, aesthetics, adaptability, and overall user satisfaction compared to baseline methods. Users were able to comprehend scene information more efficiently, while experiencing reduced workload, particularly in high-density labeling environments.
This work offers a solution for dynamic 3D labeling, particularly where high label density, binocular viewing, and user experience are important. Future research will focus on extending the applicability of our method to more complex real-world AR scenarios and developing adaptive parameter adjustment mechanisms to further enhance its robustness and usability.


