Article

Developing a Novel Muscle Fatigue Index for Wireless sEMG Sensors: Metrics and Regression Models for Real-Time Monitoring

by
Dimitrios Miaoulis
1,†,
Ioannis Stivaros
1,† and
Stavros Koubias
1,2,*
1
Department of Electrical and Computer Engineering, University of Patras, 26504 Patras, Greece
2
Applied Electronics Laboratory, Department of Electrical and Computer Engineering, University of Patras, Rion, 26504 Patras, Greece
*
Author to whom correspondence should be addressed.
These authors contributed equally to this work.
Electronics 2025, 14(11), 2097; https://doi.org/10.3390/electronics14112097
Submission received: 17 March 2025 / Revised: 25 April 2025 / Accepted: 28 April 2025 / Published: 22 May 2025
(This article belongs to the Special Issue Wireless Sensor Network: Latest Advances and Prospects)

Abstract

:
Muscle fatigue impacts performance in sports, rehabilitation, and daily activities, with surface electromyography (sEMG) widely used for monitoring. In this study, we developed a wearable sEMG device and conducted experiments to create a dataset for fatigue analysis. The sEMG signals were analyzed through a multi-domain feature extraction pipeline, incorporating time-domain (e.g., RMS, ARV), frequency-domain (e.g., MNF), and hybrid-domain metrics (e.g., MNF/ARV ratio, Instantaneous Mean Amplitude Difference), to identify physiologically meaningful indicators of fatigue. To ensure inter-subject comparability, we applied a dynamic standardization strategy that normalized each feature based on the RMS value of the first active segment, establishing a consistent baseline across participants. Using these standardized features, we explored several fatigue index construction methods—such as weighted sums, t-SNE, and Principal Component Analysis (PCA)—to capture fatigue progression effectively. We then trained and evaluated multiple machine learning models such as LR, SVR, RF, GBM, LSTM, CNN, and kNN to predict fatigue levels, selecting the most effective approach for real-time monitoring. Integrated into a wireless BLE-enabled sensor platform, the system offers seamless body placement, mobility, and efficient data transmission. An initial calibration phase ensures adaptation to individual muscle profiles, enhancing accuracy. By balancing on-device processing with efficient wireless communication, this platform delivers scalable, real-time fatigue monitoring across diverse applications.

1. Introduction

1.1. Background and Motivation

Muscle fatigue, characterized by a decline in muscle performance during sustained activity, significantly impacts athletic performance, rehabilitation outcomes, and daily functional tasks. The accurate monitoring and assessment of muscle fatigue are crucial for optimizing training regimens, preventing injuries, and enhancing recovery processes.
Surface electromyography (sEMG) has emerged as a non-invasive and effective method for evaluating muscle activity and fatigue [1]. By detecting electrical signals generated during muscle contractions, sEMG provides real-time insights into muscle function and fatigue levels. Changes in sEMG signal characteristics, such as shifts in frequency and amplitude, are indicative of muscle fatigue. The analysis of sEMG signals enables the identification of specific patterns associated with fatigue, facilitating timely interventions and personalized training adjustments. The integration of Wireless Sensor Networks (WSNs) into sports and rehabilitation domains has further revolutionized the monitoring of physiological parameters. Wearable IoT devices equipped with sEMG sensors allow for continuous, real-time data collection and analysis, providing immediate feedback to users and practitioners. This advancement enhances the ability to track muscle performance, detect early signs of fatigue, and implement preventive measures effectively.
Despite these technological advancements, challenges persist in accurately quantifying muscle fatigue due to individual variability and the complex nature of muscle dynamics. The development of robust, personalized fatigue indices that adapt to individual differences and provide reliable assessments across various contexts would offer invaluable insights.

1.2. Related Work

Recent advancements in surface electromyography (sEMG) technology have led to significant progress in real-time muscle fatigue detection systems, with increasing emphasis on wearable, wireless, and low-power solutions. Early work in this field has focused on real-time monitoring using wearable sEMG systems, which are increasingly used to track muscle performance during exercise. Systems such as those developed by Liu et al. in 2019 [2] and Xu in 2020 [3] have laid the foundation for understanding how sEMG signal features—particularly those in the frequency domain—can be linked to fatigue. median frequency (MDF) and mean power spectrum frequency (MNF) are widely recognized as key indicators of muscle fatigue, as these features tend to decrease with sustained muscle activity. Liu et al. [2] made a notable contribution with their EMG patch system by introducing an adaptive baseline method for fatigue quantification. Their approach leveraged median frequency (MF) values, calculating a baseline from the average of the first five MF readings, while subsequent readings were used to determine fatigue levels. Importantly, if newer MF values exceeded the baseline, the baseline was automatically updated, ensuring that it represented the maximum capacity state of the muscle. This dynamic baseline approach allowed them to define a 10-level fatigue scale, where the fatigue level was calculated as a percentage. This standardization technique provided a personalized, relative measure of fatigue that could account for individual differences, addressing a key challenge in fatigue quantification. In addition to the commonly employed features such as MNF and RMS, other studies have explored alternative methodologies for muscle fatigue detection. For instance, Samann and Schanze [4] proposed a technique based on the autocorrelation function (ACF) of EMG segments to extract oscillatory characteristics of the signal, capturing dynamic behavior associated with fatigue progression. Their method identifies three specific peaks and valleys (F1, F2, F3) from the ACF and applies k-means clustering for binary classification into fatigue and non-fatigue states. This approach offers robustness against common EMG signal artifacts such as noise and outliers, addressing one of the limitations often encountered in time and frequency domain fatigue metrics. Their findings demonstrated that ACF-derived features could detect the transition-to-fatigue phase with good temporal accuracy, suggesting a promising direction for identifying subtle fatigue onset in repetitive tasks. Moreover, Guzu et al. [5] introduced a combined classification strategy for forearm exercises and fatigue states using time-domain features such as RMS, Zero Crossing Rate, Slope Sign Change, and Waveform Length and frequency-domain parameters such as MNF, Kurtosis, and Skewness. Notably, they demonstrated that a decrease in MNF and a concurrent increase in RMS during continuous contractions signify muscle fatigue, validating these features as reliable fatigue indicators. These works reinforce the ongoing relevance of RMS and MNF as core fatigue indicators while highlighting new approaches such as ACF-based clustering and slope-based detection. However, a limitation observed in many prior methods is the reliance on binary fatigue classification or thresholding mechanisms, which may oversimplify the complex and gradual nature of fatigue. In contrast, our study proposes a continuous fatigue index based on a broader set of standardized features across multiple domains. This index, refined through PCA and machine learning models, enhances sensitivity and addresses the limitations of existing fatigue indices by capturing progressive fatigue dynamics rather than discrete states.
However, the lack of wireless capabilities in earlier systems limited their practical applications, especially in dynamic or real-world settings. Wireless communication, particularly via Bluetooth Low Energy (BLE), has since been integrated into sEMG systems, enabling long-duration monitoring with minimal power consumption. The importance of low-power wireless communication has been underscored in recent studies, such as Wu et al. in 2021 [6], which proposed an ultra-low power sEMG sensor optimized for wearable biometric applications. Their system, using BLE, achieved significant improvements in energy efficiency, making it suitable for the continuous, real-time monitoring of muscle fatigue. The Multiple Feedback Filter (MFB) used in their design further enhanced signal quality by effectively removing noise, thus improving the reliability of fatigue detection.
Furthermore, machine learning (ML) techniques have begun to play a crucial role in enhancing the performance of sEMG-based fatigue monitoring systems. Traditional methods of fatigue detection relied heavily on signal processing techniques, but the advent of ML has allowed for more accurate and personalized predictions. Sun et al. in 2022 [7] and Yousif et al. in 2019 [8] provided comprehensive reviews of the role of ML in analyzing sEMG signals. ML methods, including support vector machines (SVMs), random forests, and k-nearest neighbors (k-NN), have demonstrated superior accuracy in classifying muscle fatigue patterns compared to conventional methods. These techniques are particularly useful in handling the complex, non-linear relationships inherent in sEMG data, which are challenging for traditional signal processing alone. The combination of signal processing and ML approaches has also led to the development of more sophisticated fatigue indices, such as the two-step classification algorithm proposed by Qassim et al. in 2022 [9]. By combining time-domain features like integrated EMG with frequency-domain analysis to distinguish between high-frequency components (HFC) and low-frequency components (LFC), their system was able to achieve a high level of accuracy (95%) in detecting fatigue during isometric exercises. This innovative approach reflects a growing trend toward integrating more advanced classification algorithms into wearable devices to improve the reliability and real-time applicability of fatigue detection.
The integration of fatigue detection with movement classification was also explored in recent research by Alexandru Guzu et al. in 2024 [5]. Notable work in this area examined combined fatigue detection and movement classification for forearm exercises using sEMG signals. Their approach first employed fatigue detection to calculate a fatigue index, which was then used to categorize data for each movement into fatigued and non-fatigued states. When comparing classification algorithms for this multi-class problem (three movements × two fatigue states), support vector machine (SVMs) achieved the highest overall accuracy at 74%, outperforming k-NN (62%) and MLP (73%) approaches. This work underscores the potential for the simultaneous tracking of both movement patterns and fatigue states from the same sEMG signals, though it highlights the computational challenges involved in real-time implementation.
The recent work by Kinugasa and Kubo in 2023 [10] further exemplifies the growing trend of affordable, consumer-friendly systems for muscle fatigue detection. Their low-cost wireless system, which uses commercially available components, shows that it is possible to design a system that is both economical and effective for the real-time monitoring of muscle fatigue. The use of basic time-domain metrics such as root mean square (RMS) and mean power frequency (MPF) demonstrated that low-cost, wearable sEMG systems can provide insights into muscle fatigue comparable to more expensive commercial systems. The work highlights the potential for the widespread adoption of wearable sEMG devices in both sports and rehabilitation settings, where cost and accessibility have traditionally been barriers to entry.
Overall, the integration of wireless, low-power devices, coupled with advanced signal processing and machine learning algorithms, is revolutionizing the way we monitor muscle fatigue in real time. These systems, through improved accuracy, personalization, and affordability, are opening up new possibilities for applications in sports, healthcare, and rehabilitation. However, challenges remain in achieving robust and scalable solutions that can adapt to the diverse needs of users and exercise conditions. Continued innovation in both the hardware and algorithmic domains will be essential to overcome these challenges and realize the full potential of wearable fatigue detection systems.
While previous studies have demonstrated the utility of classical fatigue indicators such as median frequency (MF), root mean square (RMS), and zero crossings (ZCs), these methods often rely on fixed thresholds or baseline comparisons that are sensitive to noise and inter-subject variability. Most importantly, they typically assume binary fatigue states—fatigued versus non-fatigued—without capturing the gradual and continuous nature of fatigue progression. Moreover, many traditional systems lack the adaptability to adjust to individual muscle profiles, limiting their applicability in diverse athletic or other scenarios. These limitations highlight the need for a more flexible, data-driven approach that combines domain-specific signal analysis with real-time, personalized fatigue modeling.

1.3. Contribution of This Work

This study presents a wearable, IoT-enabled sEMG system designed for real-time muscle fatigue monitoring. By integrating Bluetooth Low Energy (BLE) technology, the system enables wireless data transmission, overcoming the mobility constraints of traditional wired sEMG setups. While the hardware setup is built on accessible, low-cost components, the novelty of this work lies in the design of a personalized fatigue modeling framework centered on dynamic calibration, feature standardization, and multi-domain signal analysis. To support this, a domain-specific sEMG dataset was created, focused on the Vastus Medialis muscle, with recordings from 11 participants of varied physical backgrounds. This dataset, collected under controlled isometric contraction protocols, was critical for exploring inter-subject differences in muscle fatigue expression and evaluating fatigue indicators with high granularity.
A key contribution of this work is the introduction of a robust and reproducible baseline normalization strategy for sEMG-derived metrics. Six distinct baseline calibration methods were systematically compared, and the approach of normalizing each active window’s features by the RMS of the first active window was selected. This method was demonstrated to provide more stable metric ranges across participants while preserving fatigue progression trends, addressing one of the major shortcomings of prior approaches relying on rest-phase calibration or static thresholds. Furthermore, we propose a continuous fatigue estimation pipeline that moves beyond binary classification. After normalizing the directionality of all fatigue-sensitive metrics, dimensionality reduction was performed using Principal Component Analysis (PCA) to create a smooth, interpretable fatigue index. This approach preserves inter-metric relationships while minimizing noise and individual variability. While prior work has applied PCA in isolated contexts, our study integrates it directly into a real-time fatigue estimation model, aligned with a pre-filtered, low-pass, smoothed metric set to ensure continuity over time.
Machine learning regression models were implemented to enhance fatigue estimation, comparing different models such as linear regression, support vector regression, k-NN, and random forest techniques. The models were trained on calibrated and standardized feature sets, ensuring a systematic approach to fatigue quantification. Through extensive analysis, the study selected the most suitable machine learning model for real-time, personalized fatigue monitoring.
By combining IoT technologies, advanced signal analysis, metric standardization, and machine learning, this work provides a scalable, real-time solution for athletes, clinicians, and researchers, enabling improved performance monitoring, injury prevention, and rehabilitation strategies.

2. Materials and Methods
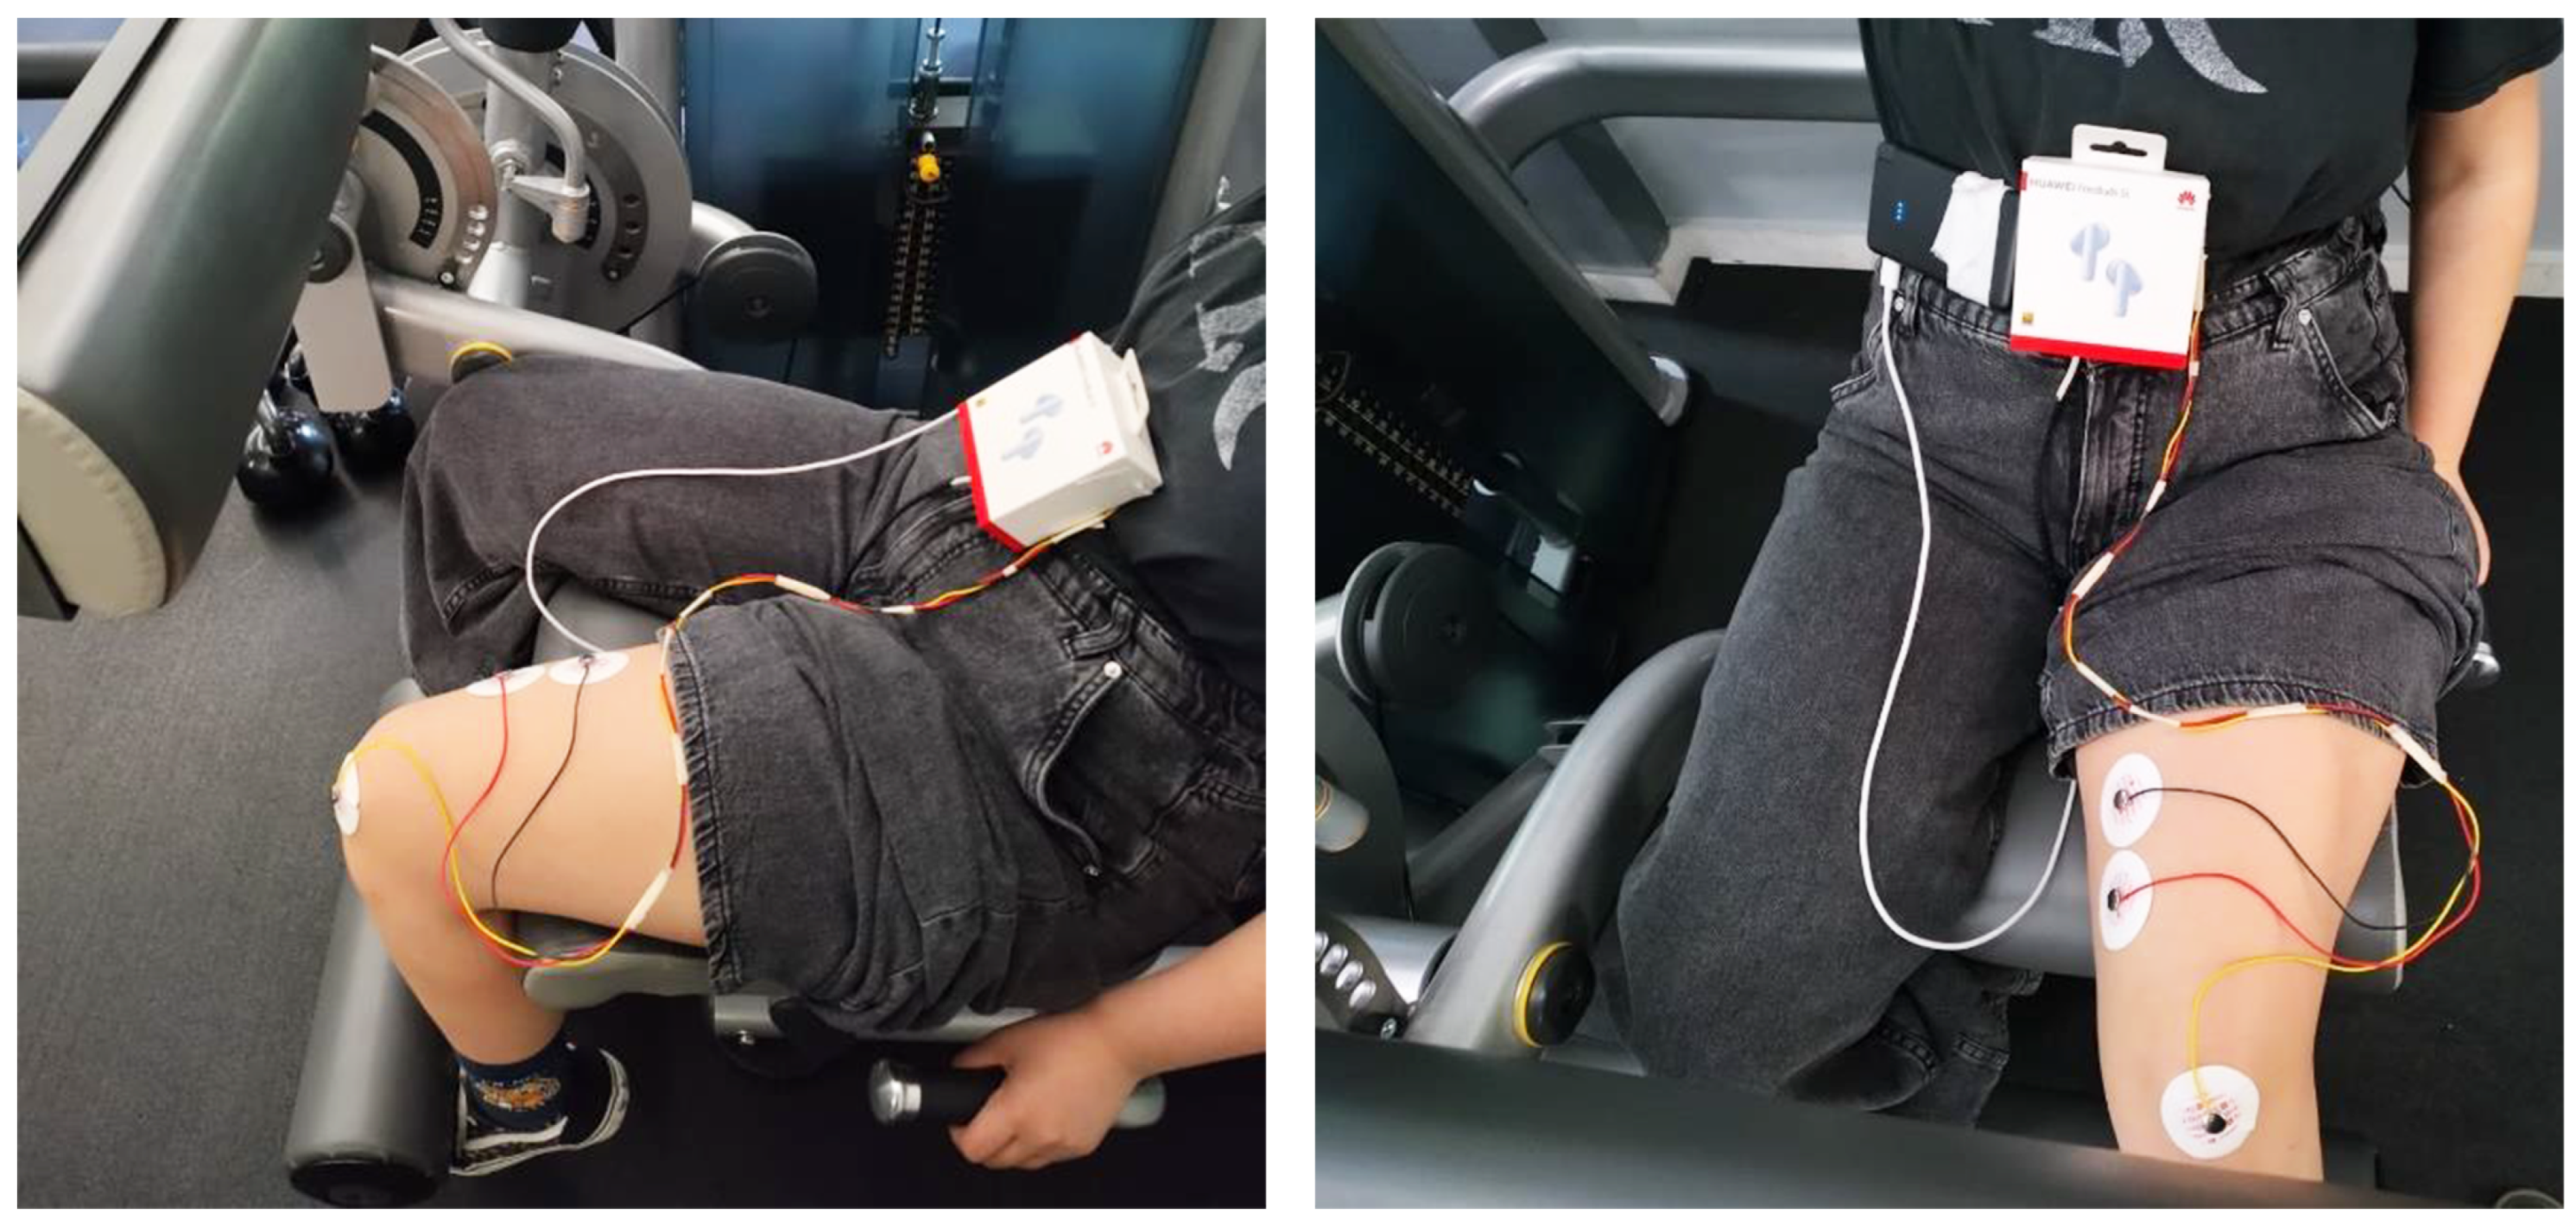
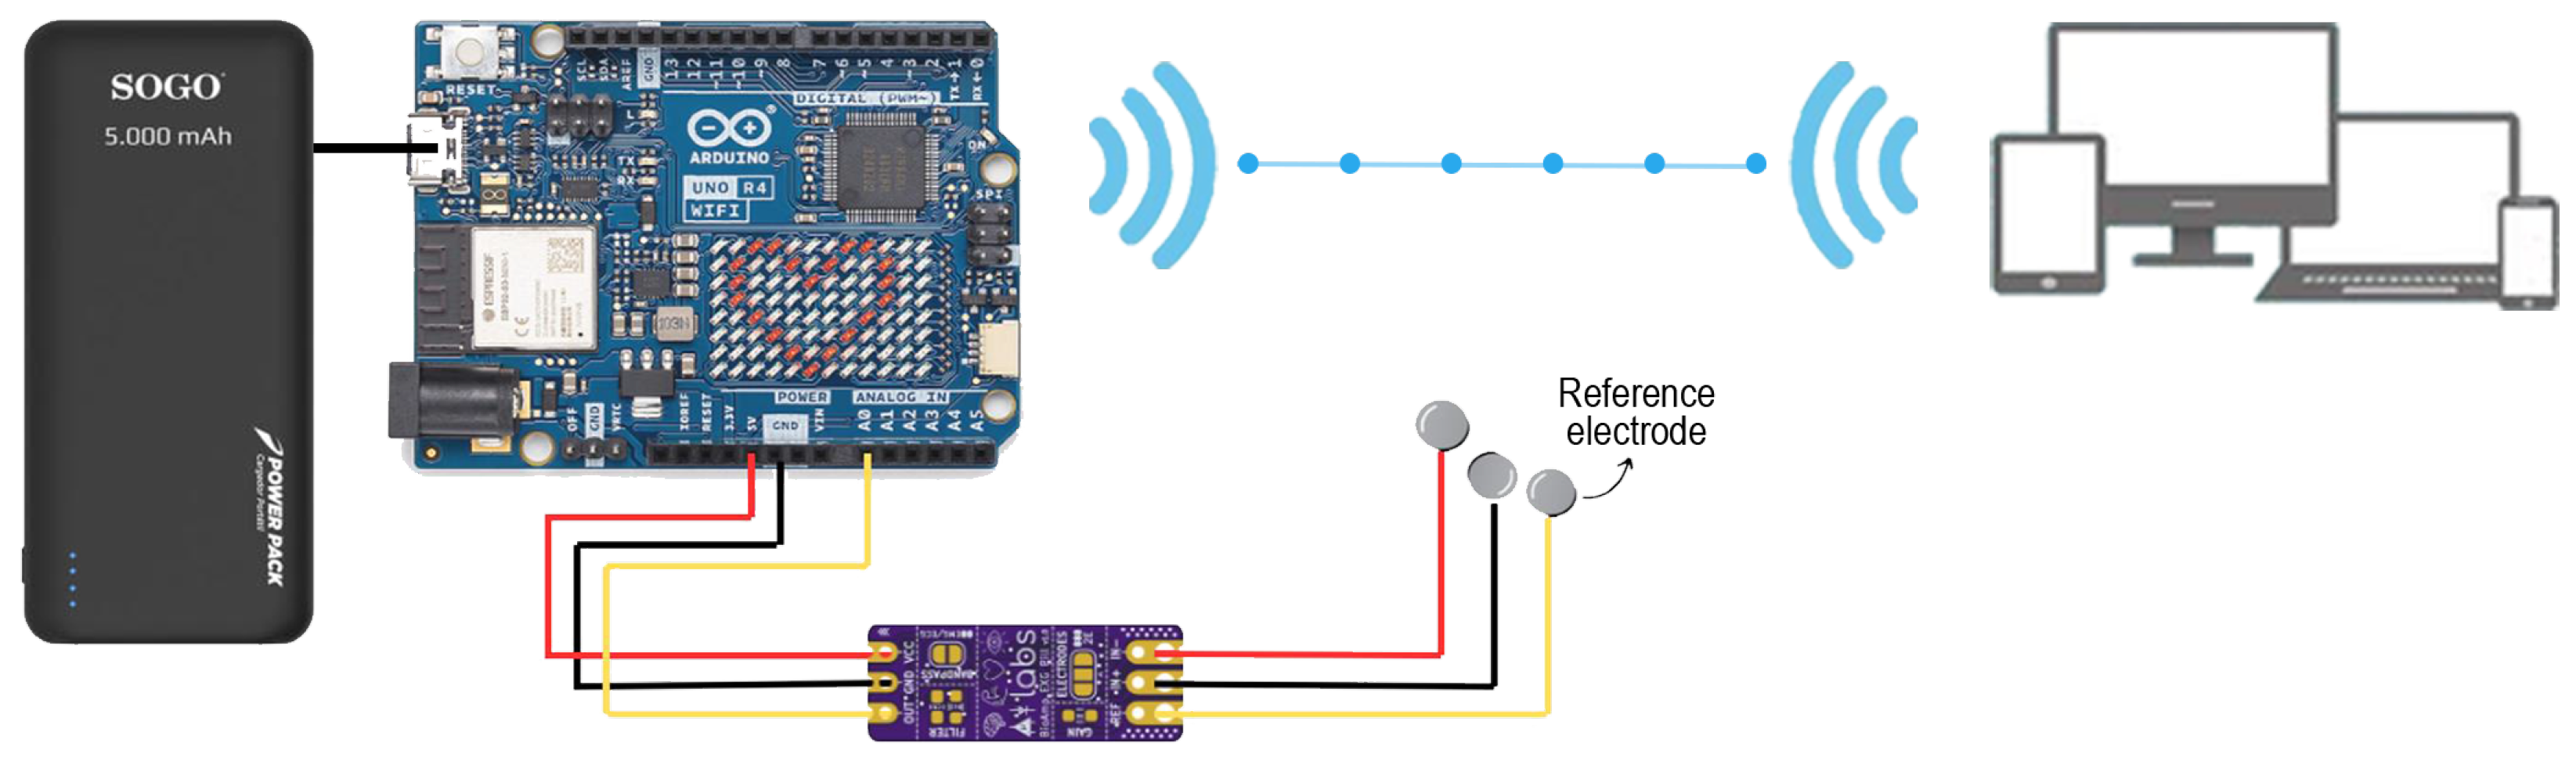
2.1. System Design

The proposed muscle fatigue monitoring system is designed as a wearable device, with wireless surface electromyography (sEMG) acquisition setup, ensuring real-time signal processing and data transmission. The system consists of sEMG sensors, a microcontroller unit (MCU), and a Bluetooth Low Energy (BLE) communication module, all working together to provide an efficient and mobile monitoring solution.
The core processing unit selected for this study was the Arduino UNO R4 WiFi, which integrates a dual-core microcontroller with BLE 5.0 capabilities. This platform was chosen due to its high-resolution ADC, low-latency data processing, and extended BLE range, making it well-suited for continuous physiological monitoring applications. The system captures sEMG signals using pre-gelled Ag/AgCl electrodes placed on the desired muscle, ensuring optimal signal acquisition. A fourth-order Butterworth IIR filter is applied to preprocess the signals before transmission, eliminating unwanted noise and improving the accuracy of fatigue detection. BLE 5.0 is employed for data transmission, offering an energy-efficient communication protocol that ensures stable connectivity during movement. This approach enables real-time fatigue monitoring without the constraints of wired systems, making it particularly suitable for sports and rehabilitation applications.
Two commercially available sEMG sensors, the BioAmp EXG Pill v1.0b and MyoWare 2.0 Muscle Sensor, were evaluated for their suitability in the system. The BioAmp EXG Pill offers superior configurability, allowing gain adjustments of up to 1000× [11] and modifications to its bandpass filter to optimize the frequency range for specific biopotential measurements, including EMG, EEG, ECG, and EOG. Its built-in noise rejection and wide input frequency band make it highly resistant to electrical interference, ensuring high signal fidelity even in challenging environments. Default values were used for gain and the frequency band was the wide input one. The sensor’s sampling was performed via an external 10-bit ADC integrated into the microcontroller, with a sampling rate of 800 Hz, sufficient to capture the dominant spectral content of muscle signals.
In contrast, the MyoWare 2.0 Muscle Sensor is a self-contained module designed for ease of integration with microcontrollers, featuring a default gain of 200× and an onboard analog filtering pipeline comprising a high-pass filter (20.8 Hz) and a low-pass filter (498.4 Hz), providing a usable bandwidth of approximately 20–500 Hz, which aligns with the typical frequency content of sEMG signals. It has a Common Mode Rejection Ratio (CMMR) of 140 dB and an imput impedance of 800 [12]. While MyoWare 2.0 provides processed envelope signals suitable for basic applications and offers expandability through various shields, its susceptibility to motion artifacts and fixed filtering parameters limit its adaptability for precise fatigue analysis.
Given these observations, BioAmp EXG Pill was selected as the primary sensor for this study due to its enhanced signal quality and flexibility in gain adjustment. MyoWare 2.0 was initially used in pilot testing, providing valuable insights into signal acquisition but proving less effective in applications requiring high signal fidelity. The integration of the selected sensor into the Arduino-based system enables robust real-time muscle activity tracking, forming the foundation for subsequent signal processing and feature extraction analyses.

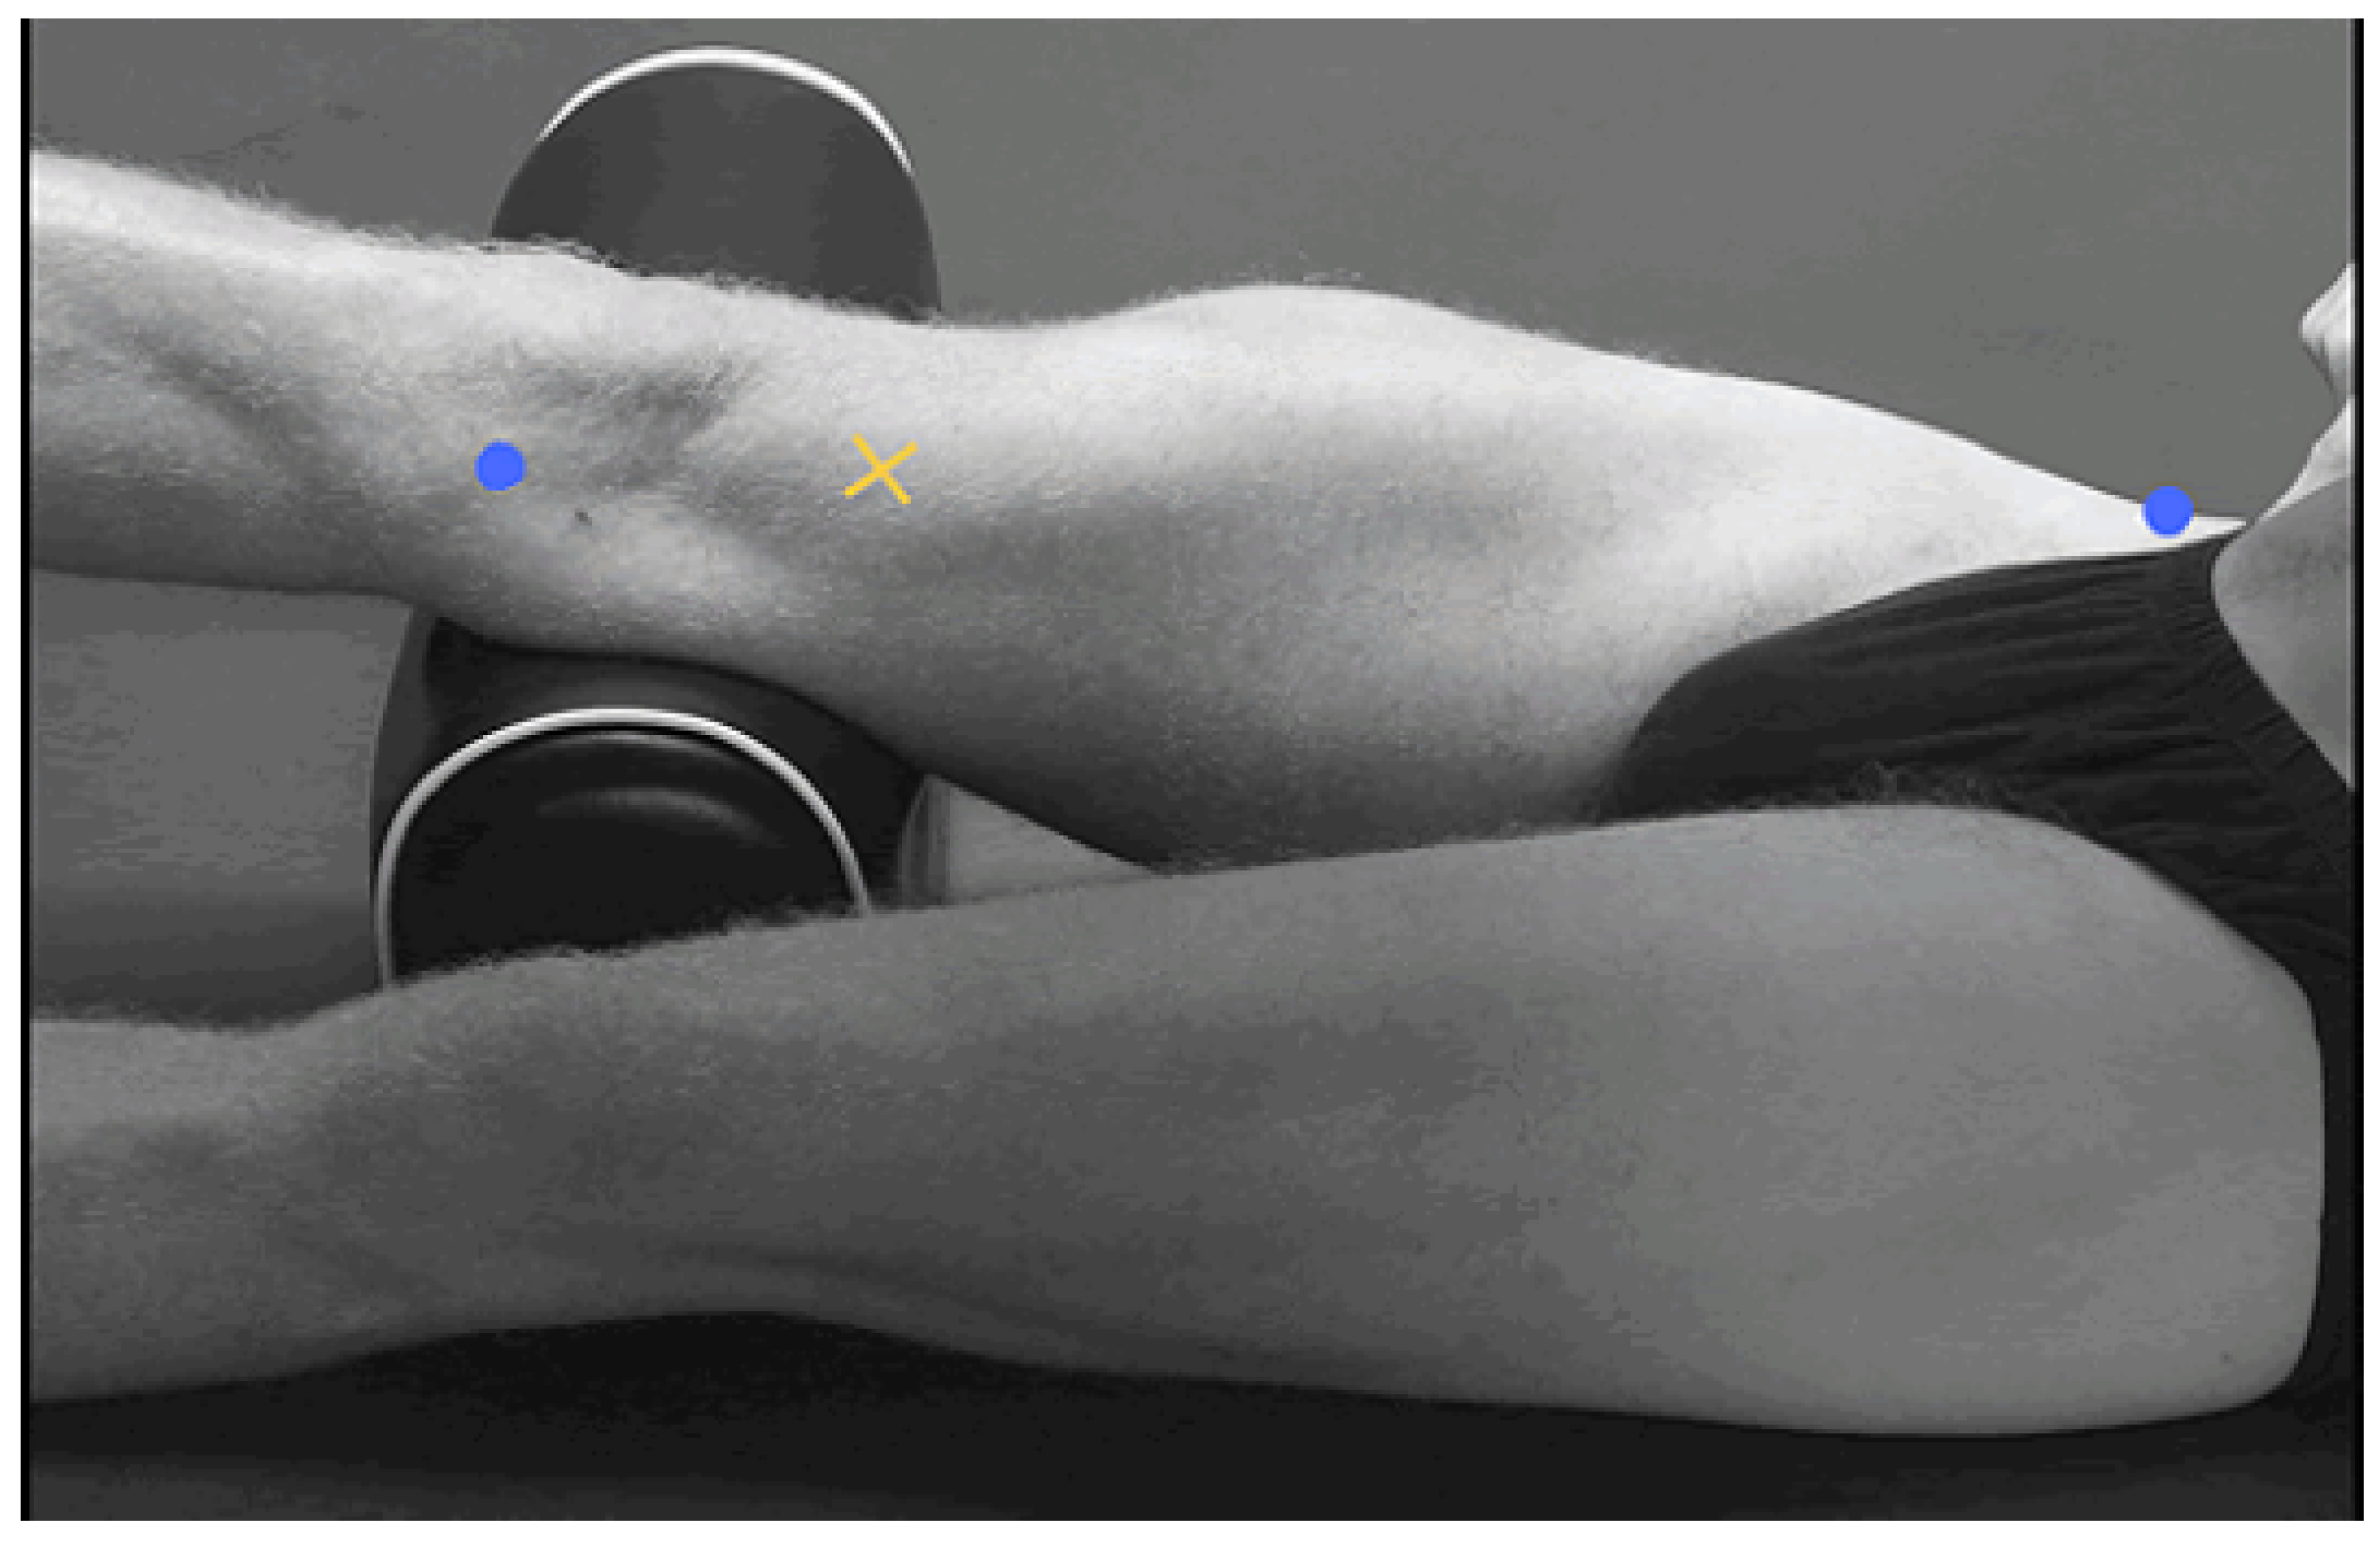
2.2. Data Collection

The experimental protocol was designed to assess muscle fatigue through surface electromyography (sEMG) signals recorded from the Vastus Medialis during an isometric leg-extension exercise. This specific muscle was selected due to its accessibility, relevance in lower-limb strength assessment, and alignment with standardized electrode placement guidelines. While the present study focused exclusively on isometric contractions and a single muscle group, the methodology was designed to be extendable to dynamic tasks and additional muscles in future investigations. Exploring such applications remains an important direction for validating the broader applicability of the proposed system. The leg-extension exercise was selected due to its ability to maintain a controlled contraction while minimizing movement artifacts. Each participant performed the task on a leg-extension machine, holding a fixed knee angle between 90° and 100° for a duration of approximately 60 to 80 s per repetition. This sustained contraction was chosen to ensure the gradual onset of muscle fatigue over time. A 5–7s resting phase was recorded at the beginning of each trial, providing a clear baseline segment for signal calibration and normalization. A total of 11 participants (10 males, 1 female; mean age 29.73 ± 7.98 years) were recruited through voluntary enrollment for this university-based study. The sample included five semi-professional football players and one semi-professional basketball player, while the remaining participants were individuals whose occupations required regular physical activity, ensuring that all subjects were in at least moderate to good physical condition. Each subject completed three fatigue-inducing sessions under the same experimental conditions. Rest intervals of 1–2 min were provided between trials to allow partial recovery while still encouraging fatigue accumulation across repeated efforts. A representative image of the experimental setup is shown in Figure 1. While the majority of participants showed consistent effort across these sessions, variations in perceived exertion and activation levels were observed, which we tried to account for during signal segmentation and analysis. To simulate personalized resistance training scenarios, participants selected a load level based on self-reported training frequency and perceived capacity, choosing among 11 kg, 18 kg, and 25 kg weight settings. Across the full dataset, four participants consistently selected 11 kg, and another four chose 18 kg as their working load. The remaining sessions—six in total—were performed using the 25 kg load, with some participants opting for different weights across their three trials based on perceived exertion and training familiarity. This variability in load selection allowed us to capture a broader range of fatigue responses and investigate the effects of intensity on fatigue progression. This diversity provided valuable insights into the effect of load intensity on fatigue progression and signal consistency. This study was conducted as part of a university thesis project. Informed consent was obtained from all subjects involved in the study. Due to academic time constraints and scope limitations, the participant sample was kept intentionally small to demonstrate methodological feasibility and validate the system’s performance across repeated measurements. As such, the findings should be interpreted as a proof-of-concept with potential for future expansion. A larger and more diverse participant pool would undoubtedly have enhanced the robustness and generalizability of the results; however, this could not be achieved. Expanding the sample size remains a key objective for future iterations of this research.
Electrode placement followed the SENIAM guidelines [13], ensuring high-quality signal acquisition. Electrodes were positioned parallel to the muscle fibers to maximize signal amplitude and reduce phase cancellation effects. The primary electrodes were placed at 80% of the distance between the anterior superior iliac spine and the patella, while the reference electrode was positioned over a neutral bony site above the patella. A detailed illustration of the key points is presented in Figure 2. This configuration was chosen to align with the natural anatomical orientation of the muscle fibers, reducing variability in signal acquisition and improving reproducibility. Alternative electrode placements were briefly explored but exhibited higher vulnerability to cross-talk from adjacent muscles and inconsistent amplitude variations.
To mitigate cross-talk and external noise sources, several measures were implemented. The differential recording technique was employed, using closely spaced electrodes to enhance signal specificity while canceling out common noise. Additionally, proper skin preparation—including shaving, cleansing with alcohol, and drying—was performed to reduce impedance and improve electrode contact. Motion artifacts were minimized by ensuring a tight but non-restrictive electrode attachment, preventing displacement during contractions. Environmental interference, particularly 50 Hz powerline noise, was suppressed using a notch filter, and the system operated on a battery-powered supply to eliminate ground loops. These precautions were guided by well-established principles of EMG signal acquisition, which emphasize that surface EMG is highly sensitive to noise originating from electronic components, electrode–skin interface variability, and ambient electromagnetic interference [1,14]. As noted by Granados et al. [15], the frequency content of surface EMG (sEMG) signals typically lies within the 20–400 Hz range. Based on this, a sampling frequency of 800 Hz was selected, which adhered to the Nyquist criterion and ensured the accurate capture of relevant muscle activation dynamics. The acquired signals underwent preprocessing with a 4th-order Infinite Impulse Response (IIR) Butterworth bandpass filter (25–380 Hz) to isolate the physiological sEMG frequency range while eliminating low-frequency motion artifacts and high-frequency electrical noise. The filter order was implemented as two cascaded second-order sections, reducing numerical errors and improving stability. These frequency values were selected to avoid interference near 20 Hz and 500 Hz, ensuring a clean and informative sEMG signal. The signal acquisition and processing pipeline is depicted in Figure 3.
For real-time data transmission, Bluetooth Low Energy (BLE) 5.0 was implemented, ensuring efficient wireless communication between the acquisition system and the processing unit. The BLE protocol was structured to maintain low latency while transmitting sEMG data continuously. The BLE central device, such as a computer or mobile application, requested data from the BLE peripheral device (Arduino-based system), ensuring synchronized data flow. The microcontroller unit acquired sEMG signals and buffered them locally before transmitting packets in 236-byte frames, each containing 59 floating-point values. The transmitted data were received by a computer as the BLE central device, where they were further processed, formatted and stored into JSON output files, allowing seamless integration with data analysis pipelines.
By integrating high-fidelity signal acquisition, optimized electrode placement, and wireless data transmission [6], this methodology enables real-time muscle fatigue monitoring with minimal artifacts, making it applicable for both sports performance and rehabilitation settings.

2.3. Signal Processing and Feature Extraction

2.3.1. Feature Evaluation

In this study, feature evaluation and selection was a critical step in developing a robust muscle fatigue assessment model. The objective was to identify metrics that exhibited consistent changes over time or across exercise sessions, as these variations could be correlated with muscle fatigue [14]. Upon examining the acquired data, we observed that during the rest phase, both the raw signal and extracted features showed minimal variance, indicating that muscle activity was stable and not influenced by fatigue-related factors. To ensure a structured analysis, we segmented the data into three distinct phases: (i) the rest phase, which corresponded to the initial seconds before activation; (ii) the activation phase, a brief transition period of approximately two seconds during which the leg extended to a stable position; and (iii) the active phase, which constituted more than 70% of each session, capturing sustained muscle engagement under load. Since fatigue is more prominently observed when the muscle is subjected to continuous exertion, our evaluation of fatigue-related metrics was focused exclusively on data from the active phase, where progressive fatigue effects were expected to be most insightful. Given that the isometric contraction induced progressive fatigue in each participant, it was hypothesized that features displaying a systematic trend during prolonged exertion were most relevant for fatigue estimation.
A wide range of features from different signal processing domains were initially examined, including time-domain, frequency-domain, time–frequency domain, and complexity-based features.
Time-domain features such as root mean square (RMS), zero crossings (ZCs), and average rectified value (ARV) [16] were analyzed to assess their ability to reflect muscle activation levels. RMS provided a measure of the overall power of the signal and was computed as
R M S = 1 N i = 1 N x i 2
As fatigue progressed, RMS was expected to increase, reflecting greater muscle effort to maintain force production. Similarly, ARV, given by
A R V = 1 N i = 1 N | x i |
also increased, capturing the greater absolute signal amplitude associated with fatigue. Zero crossings (ZCs), which counted the number of times the signal crossed zero, was computed as
Z C = i = 1 N 1 I [ ( x i · x i + 1 ) < 0 ]
where I is an indicator function that returns 1 when the sign of consecutive signal values changes (crossing zero) and 0 otherwise. ZC typically decreased as fatigue set in due to the reduction of higher-frequency components in the signal. The features selected from this domain were RMS and ARV, as both exhibited clear, consistent changes during fatigue progression and have been widely validated in prior sEMG research [10,16,17,18]. Although zero crossing (ZC) is also recognized as a meaningful fatigue indicator, in our experiments, it demonstrated unstable behavior across participants and inconsistent trends, likely due to inter-subject variability in signal morphology. As such, ZC was excluded from the final set of features, with the understanding that its use may require further investigation and preprocessing to ensure reliability.
Frequency-domain features were explored to capture the spectral characteristics of the signal. Mean frequency (MeanFreq) and median frequency (MedianFreq) [19] described how power was distributed across different frequency components and were computed as
MeanFreq = i f i P i i P i
MedianFreq = f m such   that i , f i f m P i = 1 2 i P i
where f i represents the frequency bins, P i is the corresponding power spectral density at each frequency, and f m is the median frequency that divides the total power into two equal halves. As fatigue progressed, both measures decreased due to the recruitment of slower motor units. Mean power frequency (MNF) followed a similar trend, shifting toward lower frequencies [20]. The Spectral Moments Ratio, which characterizes the spectral shape of a signal, was also analyzed for its sensitivity to fatigue-induced frequency shifts. Mean frequency was retained due to its proven effectiveness as a fatigue marker [2,21,22], capturing the downward spectral shift commonly associated with fatigue. Median frequency was retained as well but in the context of Empirical Mode Decomposition, which we will analyze later on. The Spectral Moments Ratio showed weaker correlation with fatigue progression in our pilot tests and was excluded for computational simplicity.
Time–frequency domain features combine frequency and amplitude-based metrics to improve fatigue estimation. The MNF/ARV ratio [16] normalizes spectral shift effects by accounting for both time and frequency domain variations. This ratio tended to decrease as fatigue progressed, providing a more holistic view of muscle endurance degradation. Instantaneous Mean Frequency represents the real-time spectral centroid of a signal and provides insight into momentary shifts in power distribution. The Instantaneous Medium Frequency Band focuses on a predefined segment of a spectrum, allowing for finer tracking of fatigue-related frequency shifts. These features were particularly valuable in detecting rapid, localized changes in muscle activation. From the evaluated time–frequency domain metrics, the MNF/ARV ratio offered a straightforward yet effective indicator of muscle fatigue by integrating amplitude and spectral information. Due to a valuable individual performance of these metrics, the combination was introduced for stability purposes [16]. We also investigated the Instantaneous Mean Frequency but the computational cost occurred did not provide the proportional gain in sensitivity, leading to its exclusion.
Instantaneous Mean Amplitude Difference (IMA Difference) [9] quantifies the difference in amplitude between low -and high-frequency components of a signal. Specifically, the frequency spectrum was divided at 80 Hz, with the low-frequency component (LFC) spanning 25–80 Hz and the high-frequency component (HFC) covering 80–380 Hz. IMA Difference was calculated as the difference between IMA LFC and IMA HFC, effectively capturing how the frequency spectrum became more concentrated in the lower frequency range as fatigue progressed. Since muscle fatigue was associated with a spectral shift toward lower frequencies, IMA Difference increased, making it a strong and key, for our research, indicator of fatigue development.
Fluctuation-based metrics [23] provide valuable insight into signal stability and variability. Fluctuation measures analyze changes in signal amplitude and spectral distribution over time. Fluctuation variance quantifies the overall variability of a signal, fluctuation range values measure the spread of fluctuations within a defined window, and fluctuation mean difference examines the average deviation between successive fluctuations. An increase in these measures typically signified greater instability in neuromuscular control as fatigue progressed.
Complexity-based features such as Empirical Ensemble Mode Decomposition (EEMD) and Empirical Mode Decomposition (EMD) [19] were incorporated. EEMD is an extension of Empirical Mode Decomposition (EMD) designed to mitigate mode mixing by introducing white noise during decomposition. While EEMD theoretically improves mode separation, our analysis revealed that its computational cost was prohibitively high, making it unsuitable for real-time applications. As a result, it was excluded from further evaluation. Conversely, EMD, despite requiring slightly more than 0.5 s per computation, remained feasible due to its ability to extract meaningful, fatigue-related features. A thorough examination of the IMFs obtained through EMD indicated that only the first two components exhibited a consistent trend aligned with muscle fatigue progression. Therefore, we selected the median frequencies of these IMFs, denoted as MDF1 and MDF2, as key complexity-based features. These features were particularly relevant since median frequency typically decreased with fatigue [2], reflecting the shift of spectral power toward lower frequencies.
Entropy-based features such as Wavelet Entropy [19] and Band Spectral Entropy were used to assess the disorder and unpredictability of the signal. Wavelet Entropy evaluated the energy distribution across different frequency bands and was expected to decrease with fatigue as the signal became more uniform. Band Spectral Entropy measured spectral dispersion and also decreased as fatigue led to spectral compression. Lempel-Ziv Complexity, which quantified the repetitiveness of a signal, was examined as well. It typically decreased with fatigue due to the loss of variability in muscle activation patterns.
Following an extensive evaluation process, a subset of features was selected based on a balance between interpretability, reliability, and computational efficiency in detecting assumed fatigue progression. The final set of features included the following:
  • RMS;
  • MNF/ARV ratio;
  • Instantaneous Mean Amplitude Difference (IMA Difference);
  • EMD-based Median Frequencies (MDF1 and MDF2);
  • Fluctuation Variance;
  • Fluctuation Range Values;
  • Fluctuation Mean Difference.
These metrics demonstrated a clear progression with fatigue, as shown in Figure 4, aligning with the established literature while maintaining feasibility for real-time processing. The refined feature set enabled efficient muscle fatigue monitoring while ensuring that computational constraints were met for potential embedded system deployment.

2.3.2. Window Size Analysis

A crucial aspect of signal processing in this study involved determining the optimal window size and step size for feature extraction. Various window sizes and overlaps were evaluated to understand their impact on different feature metrics, including variance, max–min range, maximum differential, and computational time. The analysis revealed that different combinations of window and step sizes led to varying feature distributions over time, particularly in Empirical Mode Decomposition (EMD) features and fluctuation-based features, where the metric patterns exhibited significant changes as time progressed.
To identify the optimal windowing strategy, multiple configurations were systematically compared, as presented in Table 1. The performance of each configuration was assessed based on feature stability, signal representation, and computational efficiency. Among the tested window sizes, the 800-sample window with a 75% overlap (step size of 200 samples) was selected as the most effective configuration.
Smaller window sizes, such as 200 window—150 step or 400 window—200 step, exhibited higher variance in key metrics, leading to noisier feature representations. For instance, the MNF/ARV variance for the 200–150 configuration was 8.00, whereas, for 800–200, it was reduced to 6.67, indicating smoother feature evolution over time. Similarly, EMD variance dropped from 767.65 in the 200–150 window to 384.56 in the 800–200 window, highlighting a more stable and reliable tracking of muscle activity. The fluctuation variance, which was particularly high in smaller windows (4482.82 × 10 12 for 200–150), also showed a significant reduction in the 800-200 setup (3458.47 × 10 12 ), mitigating excessive fluctuations in extracted features.
At the same time, excessively large windows, such as 1600–800, introduced computational constraints while not necessarily improving signal stability. The max–min range for EMD, for example, was 201.56 for the 1600–800 window, only slightly higher than the 179.00 recorded for the 800–200 setup, indicating that the increased window size did not provide substantial advantages in feature separation. Additionally, the computational time for 1600–800 was 0.28 s, nearly double that of the 800–200 configuration (0.13 s), which could pose a challenge for real-time applications.
Apart from the window size, the step size played a critical role in determining the update frequency of the extracted features. A step size of 200 samples ensured that new features were computed at a frequency of 4 Hz (due to 800 Hz sampling rate), providing frequent updates without excessive computational overhead. Reducing the step size further, such as to 100 or 50 samples, would have allowed even more frequent updates, but at the cost of higher processing demands. On the other hand, increasing the step size beyond 200 would have reduced the feature update rate to below 4 Hz, potentially leading to delayed responses and a loss of important signal variations.
Given these observations, the 800–200 window configuration successfully balanced signal clarity, computational efficiency, and real-time feasibility. The structured evaluation provided a data-driven justification for this choice, ensuring the robustness of the feature extraction process in our system.

3. Metric Standardization and Fatigue Modeling

3.1. Baseline Establishment

The standardization of metrics derived from surface electromyography (sEMG) signals presents a significant challenge when analyzing muscle fatigue across diverse participants. Initial investigations focused on utilizing rest phase measurements as potential calibration references. While root mean square (RMS) values during rest phases demonstrated relatively consistent patterns across participants, the subsequent active phases exhibited substantial inter-subject variability, limiting the utility of rest-based normalization. This observation led to an exploration of alternative calibration approaches to address the inherent physiological differences among individuals.
We evaluated four distinct normalization strategies to identify the most effective method for standardizing fatigue metrics.
  • Metric (Active/RMS (Rest))
  • Metric (Active)/Metric (RMS (Rest))
  • Metric (Active/RMS (1st Active))
  • Metric (Active)/Metric (RMS (1st Active))
The first approach involved normalizing active-phase RMS values by dividing them by the corresponding rest-phase RMS values. Rest-phase RMS was often stable and minimally influenced by muscle activity, making it a plausible reference for normalization. This method produced widely varying ranges among participants, indicating insufficient standardization for cross-subject comparisons. This approach assumed that rest-phase characteristics were representative of active-phase dynamics, which may not have held true due to differing physiological states regarding, for example, muscle inactivity vs. contraction. Similarly, when applying this normalization technique to derived metrics, the results lacked meaningful insights, further confirming the inadequacy of rest-based normalization for complex sEMG analysis. This aligns with findings from Chalard et al. [24], who noted that rest-phase normalization can be unreliable due to low signal-to-noise ratios during rest.
The second approach compared derived metrics directly between active and rest phases by dividing each metric of the active phase with the metric of rest phase. Theoretically, this could account for individual differences in feature baselines. While this showed promise for certain parameters such as the MNF/ARV ratio and IMA Difference, the considerable variance in values limited its universal applicability. This limitation is supported by Halaki et al. [25], who emphasized that rest-phase metrics may not reliably reflect active-phase dynamics, especially in fatigue studies where muscle activation patterns differ significantly between states.
Given these limitations, we explored dynamic reference points using the first active window as a calibration baseline. The third approach, which normalized various fatigue metrics from each active window by dividing them by the RMS value of the first active window, demonstrated superior performance, establishing more consistent ranges across participants for most metrics. Previous work by Fernando et al. [16], who demonstrated that early active-phase metrics provide a stable baseline for tracking fatigue progression, enforced consistency compared to rest-based baselines. This normalization technique effectively accounted for individual differences while maintaining sensitivity to fatigue-induced changes. A similar technique was followed as well by Godoy et al. [26], showing that normalizing to the first active window reduces inter-subject variability.
The fourth method directly compared metrics between subsequent active windows and the first active window by dividing each metric’s value by its corresponding value in the first active window. This method was explored to complete the evaluation spectrum by bridging rest-based and dynamic calibration techniques. While this approach exhibited stability for most parameters, inconsistencies in EMD values and fluctuation metrics diminished its overall reliability.
Table 2 presents the standardized ranges for key fatigue metrics using the third normalization approach, where each metric from active windows was divided by the RMS of the first active window, across all participants. Close examination of these results reveals several advantages of the third normalization method over the alternatives. First, this approach established more consistent metric ranges across diverse participants, facilitating meaningful cross-subject comparisons [26]. The MNF/ARV ratio typically ranged between 30 and 90 units, while IMA Difference values consistently fell between 0.1 and 0.3, demonstrating a standardized response pattern despite individual physiological differences.
Additionally, the EMD values exhibited a predictable range (30–120) across participants, indicating effective normalization while preserving sensitivity to fatigue-induced changes. In contrast, the sixth method demonstrated excessive variability in fluctuation metrics (ranging from 0 to 6 in some participants to 0 to 230 in others), compromising its reliability for fatigue assessment. Furthermore, the fifth approach maintained clearer differentiation between EMD1 and EMD2 values, preserving important signal characteristics that might otherwise have been obscured through alternative normalization techniques.
Based on these comprehensive evaluations, we selected the third normalization approach, which divided fatigue metrics from each active window by the RMS of the first active window, as the optimal method for establishing a consistent baseline while maintaining sensitivity to fatigue-related changes in sEMG signals. This standardization technique facilitated reliable cross-subject comparisons and provided a robust, justified foundation for subsequent fatigue modeling and machine learning applications.
To quantify muscle fatigue reliably, it was necessary to evaluate multiple estimation techniques and assess their suitability based on sensitivity, robustness, and cross-population applicability. The process began by ensuring that all selected fatigue-related metrics exhibited a consistent trend over time. Since some features, such as the MNF/ARV ratio, EMD MDF1, and EMD MDF2, naturally decreased as fatigue progressed, they were inverted by multiplying them by −1 to align their behavior with the remaining metrics, which trended upward. This standardization step allowed for the uniform interpretation of fatigue progression across all extracted features.
After the aforementioned feature standardization and the above transformation, we explored different approaches to construct a fatigue index, each with distinct advantages and limitations.
  • Equal-weighted sum
  • Average
  • PCA
  • t-SNE
The first method considered was the equal-weighted sum, applied by [3], which assumed that all fatigue-related metrics contributed equally to fatigue estimation. This approach was simple and computationally efficient, as it aggregated all standardized metrics without requiring further transformation. However, a fundamental drawback is that it fails to account for the varying impact of different features on fatigue progression. Certain metrics, such as fluctuation-based values, exhibited higher sensitivity to muscle fatigue, whereas others, like the MNF/ARV ratio, could be less responsive or exhibit individual-specific trends. This unequal contribution across features led to inconsistencies in tracking fatigue across different participants, resulting in poor cross-population generalizability and thus deeming it not suitable for our case. A similar limitation was observed in the average-based approach, which computed a mean value of all selected metrics. While this method ensured the equal representation of each feature and reduced extreme variations, it still assumed that all features held the same weight, potentially diluting the significance of more fatigue-sensitive metrics [25]. Furthermore, both methods assumed linear relationships between metrics, which may not have accurately captured the complex, multi-dimensional nature of muscle fatigue. Given these drawbacks, neither approach was proven suitable for constructing a robust fatigue index.
To overcome these limitations, we examined dimensionality reduction techniques, which offer a data-driven way to identify the most informative aspects of high-dimensional feature spaces. Principal Component Analysis (PCA) was applied to decompose the fatigue-related metrics into orthogonal components that maximized variance, enabling the identification of latent patterns that contributed most significantly to fatigue progression. PCA is particularly advantageous in physiological signal analysis as it reduced the influence of redundant or less relevant features while preserving the most meaningful trends in fatigue evolution [27,28,29]. Rogers and MacIsaac [29] demonstrated that PCA provided a robust fatigue index across dynamic EMG recordings, outperforming more complex neural network-based methods in terms of signal-to-noise separation. Similarly, Brown et al. [27] validated PCA’s utility in reducing feature dimensionality while maintaining temporal sensitivity to fatigue progression. These findings collectively underscore PCA’s strength in isolating physiologically meaningful components from multivariate data, particularly when the goal is to extract interpretable, subject-invariant fatigue indicators. In our case, this method allowed us to transform multiple fatigue indicators into a lower-dimensional space, improving both interpretability and generalizability across different participants. Specifically, the first principal component (PC1), which captured the majority of the variance across features, was used as a composite fatigue index. This approach allowed us to retain the dominant fatigue-related trend while suppressing redundant or noisy information.
Additionally, t-distributed Stochastic Neighbor Embedding (t-SNE) was evaluated as a potential method for identifying non-linear relationships among the selected fatigue-related features. t-SNE is widely recognized for its ability to capture complex, high-dimensional structures in biomedical data and has shown success in sEMG-based classification tasks and neurological condition modeling, such as in the work by Oliveira et al. [30], who applied t-SNE to distinguish Parkinson’s disease patients based on gait and movement patterns. However, despite its power in exploratory visualization, t-SNE presents critical limitations when used for fatigue index construction. Most notably, it is a non-deterministic algorithm, sensitive to initialization and hyperparameter tuning, which often results in output variability across repeated runs, even with identical inputs. As discussed in [30], this lack of reproducibility can hinder the use of t-SNE in scenarios requiring consistent temporal tracking or real-time deployment. In our application, where a continuous and stable index was required to track fatigue progression, these instabilities rendered t-SNE unsuitable. Small variations in input features frequently led to unpredictable outputs, making it impractical as the backbone of a reliable fatigue monitoring system.
In our work, Principal Component Analysis (PCA) was selected to transform the set of standardized, fatigue-related metrics into principal components that best captured fatigue progression trends across different individuals. Compared to other dimensionality reduction or transformation techniques—such as equal-weighted aggregation, averaging, or non-linear embeddings like t-SNE—PCA offered the most practical balance between interpretability, computational efficiency, and physiological relevance. While techniques like t-SNE can reveal non-linear structures, their instability and stochastic behavior make them unsuitable for continuous, real-time fatigue monitoring. In contrast, PCA ensures deterministic and reproducible outputs, a crucial advantage for real-time applications. Furthermore, PCA has a well-established history in sEMG analysis. Studies by Rogers and MacIsaac [29] and Brown et al. [27] demonstrated findings that support the use of PCA as a physiologically interpretable method capable of compressing redundant features while preserving the signal variance most associated with fatigue progression. In our framework, the first principal component (PC1) consistently captured the dominant fatigue trend across subjects and sessions, enabling us to construct a robust and continuous fatigue index. This index dynamically adapted to individual patterns while maintaining generalizability for our limited dataset, making PCA the most appropriate dimensionality reduction technique for our system.
Given that raw fatigue index values still exhibited fluctuations, a low-pass Butterworth filter was applied to smooth the extracted fatigue trends. This filtering process was implemented using a second-order low-pass filter with a cutoff frequency of 0.2 Hz and a sampling frequency (fs) of 4 Hz. The low-pass filter helped suppress short-term fluctuations while preserving the overall fatigue progression, ensuring a more interpretable and user-friendly signal like Figure 5. The implementation was tested in different stages, and the best results were obtained by applying filtering for each individual person, before merging all participant data, as this approach preserved subject-specific fatigue trends more effectively. By systematically evaluating different fatigue estimation methods, PCA was identified as the most suitable approach, enhanced by empirical low-pass filtering to improve signal stability. This refined methodology provided a robust framework for tracking muscle fatigue in real-time applications.

3.2. Machine Learning Model Training and Evaluation

To develop a robust and generalizable fatigue estimation model, multiple machine learning algorithms were trained using the standardized fatigue-related metrics as input. The dataset consisted of eight input features, representing the most informative fatigue-sensitive metrics, while the target output variable was the computed fatigue index derived through Principal Component Analysis (PCA) and low-pass filtering. The following selected models encompassed both traditional regression techniques and more advanced deep learning approaches to evaluate their effectiveness in tracking fatigue progression.
  • Simple Linear Regression
  • Support Vector Regression
  • Random Forest Regression
  • Gradient-Boosting Machine Regression
  • Long Short-Term Memory (LSTM) Neural Network Regression
  • Convolutional Neural Network Regression
  • k-Nearest Neighbor Regression
The selected models represent a diverse range of regression approaches commonly used in time-series and sensor-based prediction tasks. They include linear (simple linear regression), kernel-based (SVR), ensemble (random forest, gradient-boosting), instance-based (k-NN), and deep learning (LSTM, CNN) methods, allowing us to compare both traditional and modern techniques in terms of performance, complexity, and suitability for metric regression in signal analysis and time-series modeling.
The first set of models included linear regression (LR) and support vector regression (SVR), both of which served as fundamental baselines for fatigue estimation. Linear regression assumed a direct relationship between input features and fatigue, making it interpretable and computationally efficient. However, given the complex, non-linear nature of muscle fatigue progression, linear regression alone could not fully capture the intricate dependencies between features. SVR, on the other hand, extended linear regression by incorporating a kernel-based approach, allowing it to model non-linear relationships between fatigue-related metrics. The flexibility of SVR makes it a strong candidate for muscle fatigue modeling, especially when properly tuned to avoid overfitting or excessive regularization.
In addition to these baseline models, random forest (RF) and gradient-boosting machines (GBMs) were employed due to their capacity to handle complex feature interactions. Random forest, an ensemble learning technique, constructs multiple decision trees and aggregates their outputs, reducing variance and improving model stability. It is particularly beneficial for handling non-linear dependencies and noisy data, both of which are present in sEMG-based fatigue estimation. Similarly, gradient-boosting machines iteratively refine weak learners to improve prediction accuracy, offering a highly adaptive framework that balances bias and variance effectively. These tree-based models are advantageous for their robustness in handling diverse datasets, making them well-suited for real-world muscle fatigue monitoring.
To incorporate temporal dependencies in fatigue progression, we explored long short-term memory (LSTM) neural networks and convolutional neural networks (CNNs). LSTMs are a specialized form of recurrent neural networks (RNNs) designed to capture long-term dependencies in sequential data, making them particularly useful for tracking fatigue trends over time. By leveraging memory gates, LSTMs can model gradual fatigue accumulation and short-term fluctuations effectively. CNNs, typically used in image processing, were adapted for sequential data by treating fatigue metrics as spatially related inputs. The convolutional layers extracted hierarchical patterns from the feature set, improving the model’s ability to detect fatigue-related trends. While computationally more demanding, these deep learning models were tested to assess their suitability for real-time fatigue estimation.
Additionally, k-nearest neighbor (k-NN) was evaluated as a non-parametric alternative that estimated fatigue based on similarity to past observations. Though k-NN is highly interpretable and adaptable to non-linear distributions, it can become computationally expensive for larger datasets and may struggle with generalization when, for example, fatigue progression varies significantly across subjects.
Model performance was assessed using mean squared error (MSE) and the coefficient of determination (R2). The initial training phase employed a standard 80–20 train–test split, ensuring that the models were exposed to a diverse set of fatigue patterns while preserving unseen data for evaluation. To further refine generalizability, a leave-one-subject-out (LOSO) cross-validation strategy was adopted, where models were trained on all participants except one and subsequently tested on the excluded participant. This approach simulated real-world conditions where models must generalize to unseen individuals, providing a more rigorous test of predictive performance, seen on Figure 6.
Through a structured comparison of model outputs and actual fatigue values, we evaluated the strengths and limitations of each technique. The results of this analysis, including comparative performance metrics, are presented in Section 4, where a matrix illustrates the effectiveness of different approaches in real-time fatigue monitoring.

4. Results and Discussion

4.1. Baseline and Metric Analysis

The selection of a suitable standardization method was a critical step in ensuring reliable fatigue quantification across participants. After evaluating six different normalization techniques, the method that provided the most stable and comparable metric ranges was the fifth approach, in which active-phase sEMG metrics were divided by the RMS of the first active-phase sEMG window. This approach minimized inter-subject variability, ensuring that fatigue-related trends were preserved while accounting for individual differences in baseline activation levels. Compared to other methods, this normalization strategy demonstrated higher consistency across subjects, particularly in key fatigue-sensitive metrics such as the MNF/ARV ratio, IMA Difference, and EMD-based features, which exhibited clear fatigue trends without excessive variability or loss of sensitivity. The final standardized dataset confirmed that the selected method facilitated cross-population comparability, allowing for a meaningful evaluation of fatigue patterns across all participants.

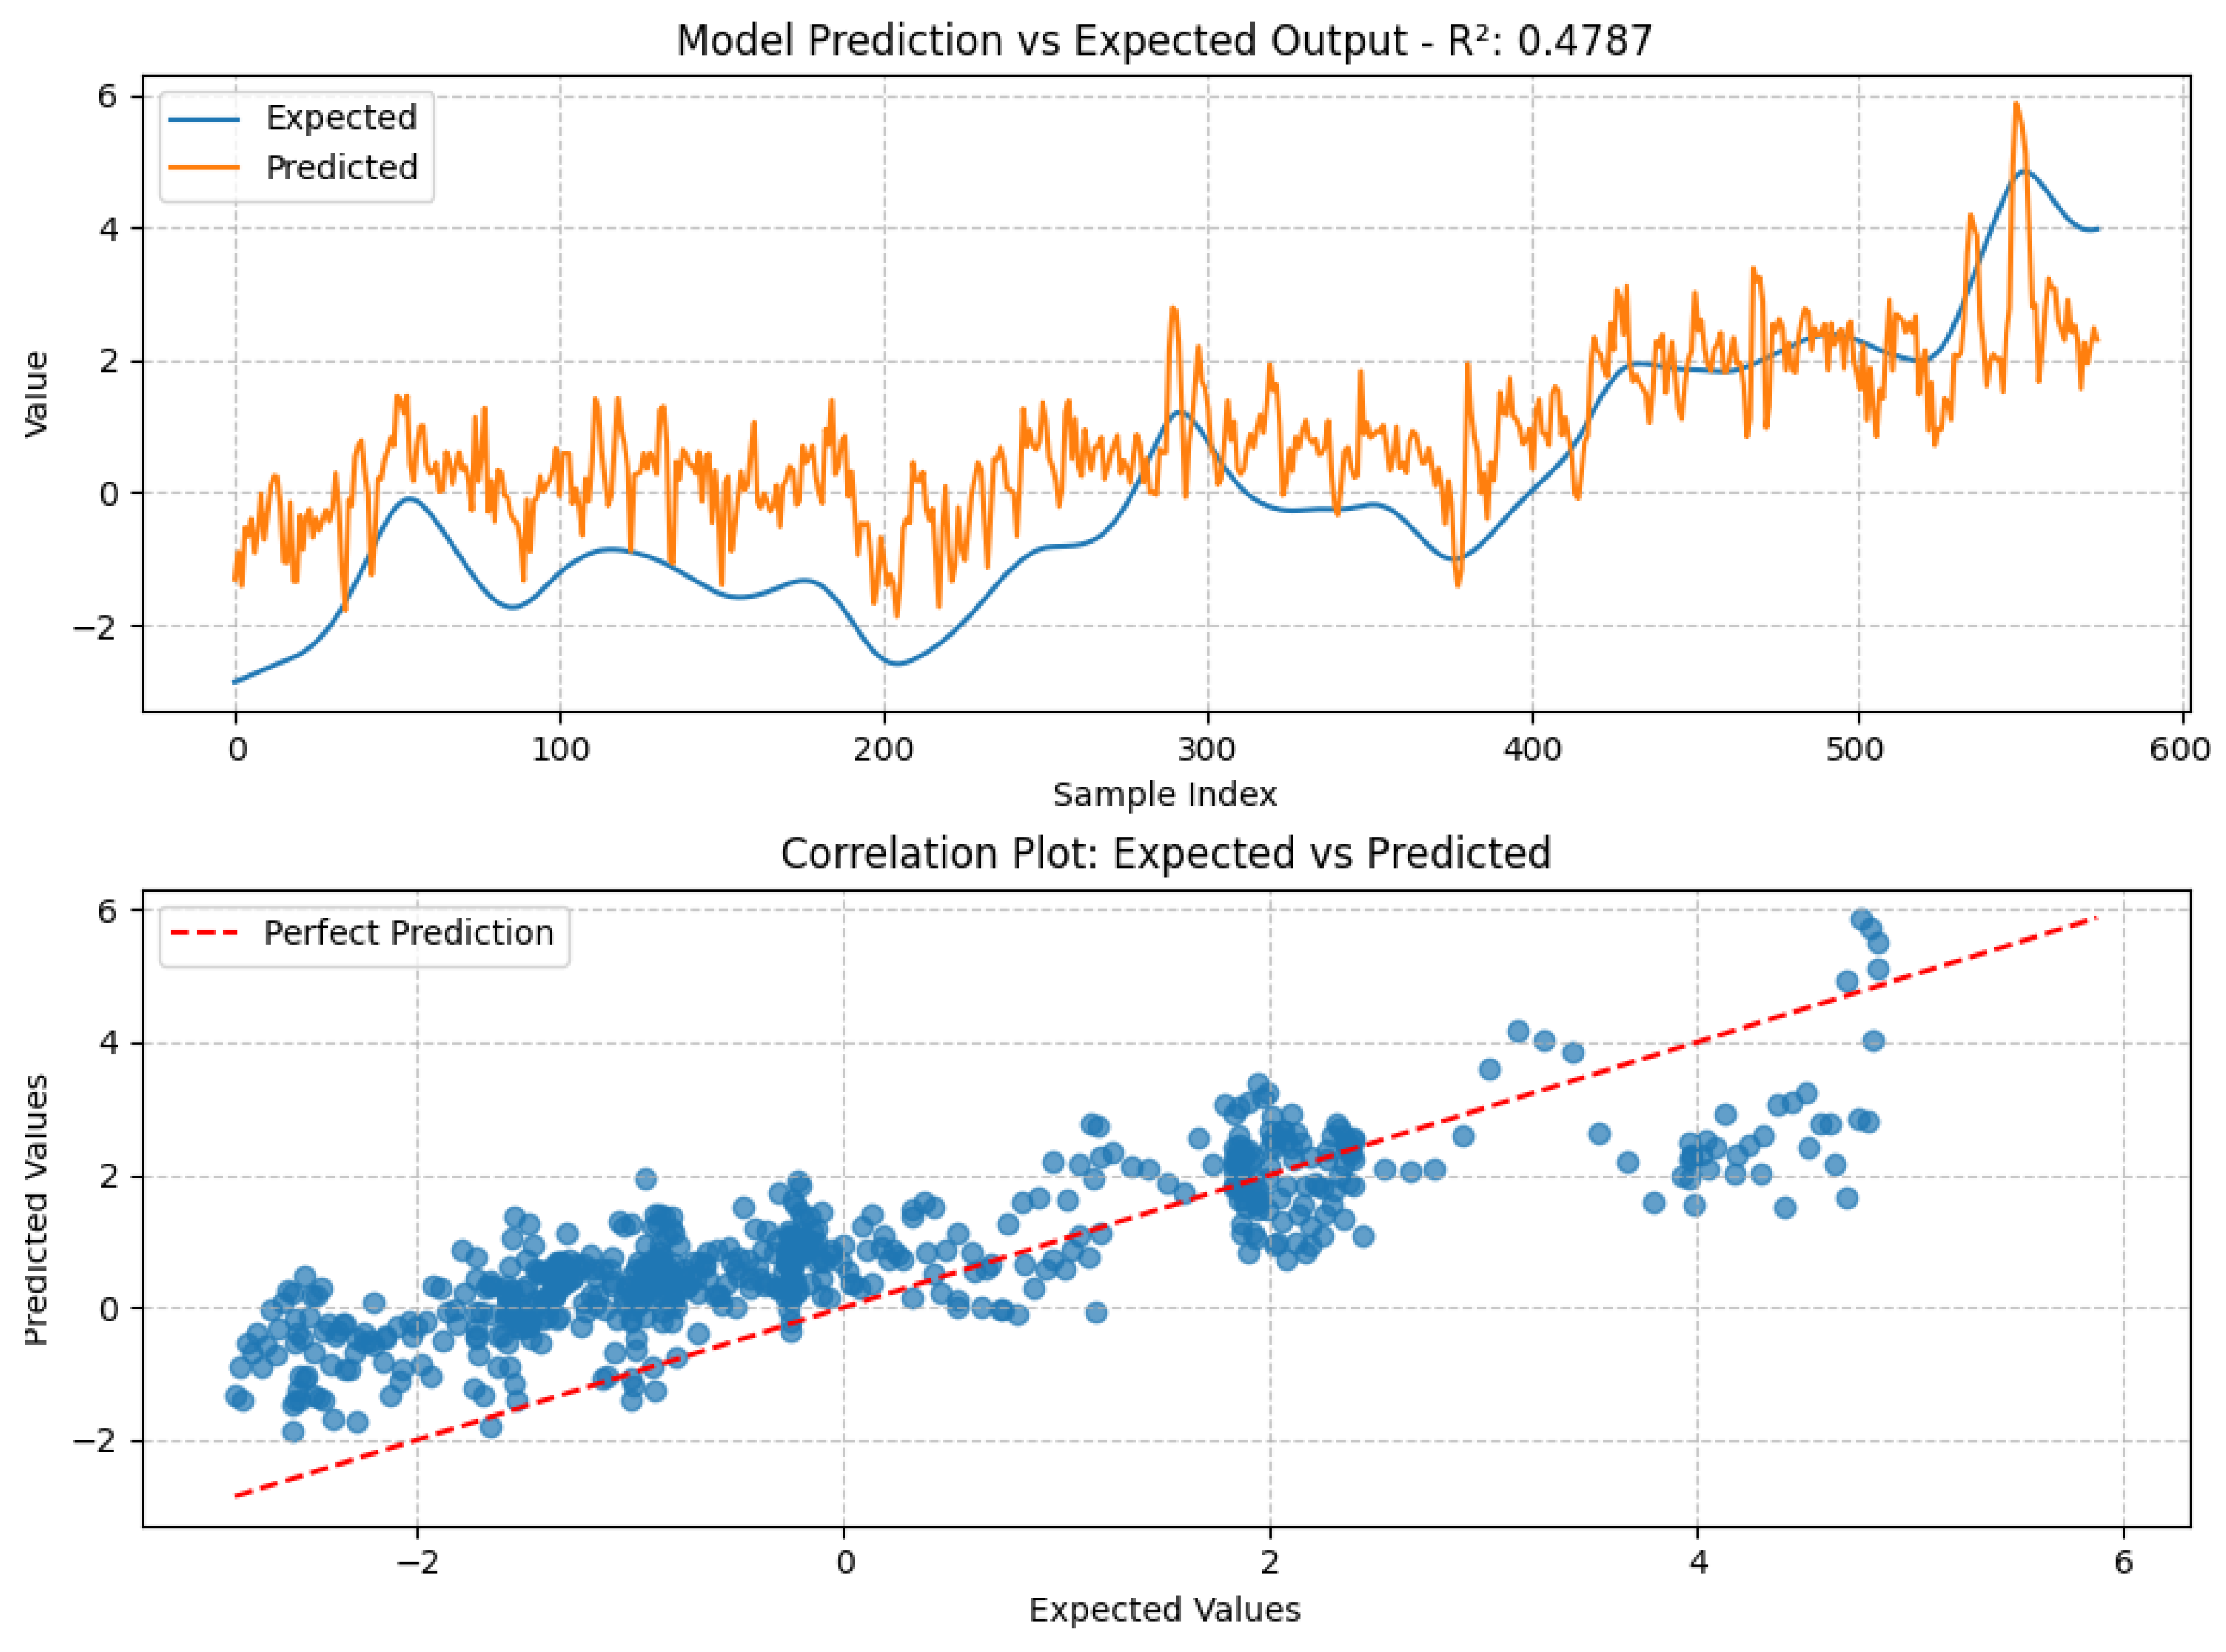
4.2. Fatigue Estimation Performance

Four different approaches were explored to define and quantify fatigue, including equal-weighted summation, averaging, PCA-based transformation, and t-SNE-based clustering. Among these, PCA emerged as the most effective method, as it efficiently captured fatigue trends while reducing noise and preserving inter-subject generalizability. Unlike simpler methods such as equal-weighted summation and averaging, PCA allowed for data-driven feature weighting, ensuring that the most informative components contributed the most to fatigue estimation. Moreover, while t-SNE effectively visualized non-linear relationships in fatigue progression, its high sensitivity to initialization parameters made it unsuitable for a reproducible fatigue index. The PCA-derived fatigue index aligned well with observed physiological trends, where participants exhibited progressive fatigue over multiple repetitions, validating the method’s applicability for real-time fatigue tracking.

4.3. Machine Learning Model Performance

A range of machine learning models were evaluated for fatigue prediction, including linear regression, support vector regression (SVR), k-nearest neighbor (k-NN), random forest, gradient-boosting, LSTM neural networks, and CNNs. The random forest model consistently outperformed other approaches, achieving higher predictive accuracy with lower error metrics while maintaining computational efficiency. The results, summarized in Table 3, demonstrate that random forest achieved the lowest mean square error (MSE) of 1.4059 and the highest R2 score of 0.5209, confirming its suitability for fatigue estimation. Gradient-boosting followed closely, with an MSE of 1.4090 and R2 of 0.5198, showing that ensemble-based methods effectively captured non-linear fatigue patterns.
Among the deep learning approaches, the LSTM and CNN models provided reasonable performance, with LSTM achieving an updated MSE of 1.5037 and R2 of 0.4876, slightly outperforming CNN (MSE 1.6717, R2 0.4303). The ability of LSTMs to model sequential dependencies in the data likely contributed to their improved performance. Simple linear regression and k-NN models performed similarly, with MSE values of around 1.55–1.58 and R2 scores just below 0.47, indicating that while these models captured some fatigue-related trends, they lacked the complexity to model fatigue progression effectively. SVR exhibited improved performance compared to other runs, reaching an MSE of 1.5542 and an R2 of 0.4704, but still struggled to generalize across different subjects.
These findings highlight the effectiveness of ensemble-based models such as random forest and gradient-boosting in fatigue estimation, while deep learning models show potential but require further optimization for real-time applications. The slight improvements in the SVR and LSTM models suggest that further hyperparameter tuning and feature engineering could enhance performance, particularly in handling inter-subject variability.
Among the evaluated models, tree-based methods (random forest and gradient-boosting) showed the highest robustness, with consistent performance (R2 = 0.52) and relatively low MSE. These models were also computationally efficient during inference, making them suitable for real-time use on moderately powered hardware. While deep learning models like LSTM and CNN offered comparable accuracy, they require significantly more computational resources and longer training times, which may limit real-time feasibility in embedded or mobile systems. Simpler models such as linear regression and SVR demonstrated lower performance but remain attractive for real-time applications due to their minimal computational overhead. Overall, tree-based models offer a good balance between accuracy and efficiency for real-time fatigue estimation.
Limited subject variability can impact generalization. While no extreme outliers were found, the small sample size limited robustness across individuals. Expanding the dataset in future work will help address this and improve model generalization.

4.4. Comparative Discussion

The selected fatigue index and machine learning models offer a real-time solution for fatigue estimation, providing a practical framework for sports performance monitoring and rehabilitation applications. Compared to existing fatigue detection techniques, which often rely on predefined thresholds or simple frequency-based indicators, our approach leverages multi-dimensional feature extraction and advanced regression models, thereby improving accuracy and adaptability to different users and use cases.
A critical comparison with the existing literature reveals both the strengths and limitations of our proposed methodology. One of the most prominent systems in this field is the gold-standard sEMG patch developed by Liu et al. [2], which quantifies fatigue using median frequency (MF) derived from the first Intrinsic Mode Function (IMF1). Their system implements a dynamic baseline approach, updating the fatigue index based on the deviation of current MF values from an adaptively maintained baseline calculated from the average of the first five readings. This allows Liu’s system to produce a personalized, percentage-based fatigue score tailored to each participant’s maximum capacity, making it highly suitable for individual monitoring. While effective, this method is fundamentally single-metric and heuristic-driven, relying solely on MF and requiring the periodic recalibration of baselines.
In contrast, our system introduces several methodological advancements, combining established techniques with underexplored strategies to enhance fatigue monitoring accuracy and adaptability. Rather than focusing on one fatigue marker, we incorporate a comprehensive set of features drawn from time, frequency, time–frequency, and complexity domains, including RMS, ARV, MNF/ARV ratio, Instantaneous Mean Amplitude Difference, median frequencies from EMD, and fluctuation-based indicators. This multi-domain approach enables a richer understanding of the physiological processes underlying fatigue and ensures that various manifestations of fatigue (e.g., spectral shifts, amplitude instability) are captured effectively.
To handle the complexity introduced by this feature diversity, Principal Component Analysis (PCA) was used to reduce dimensionality and synthesize the most informative fatigue-related trends into a single, continuous index. Unlike Liu et al.’s method, which updates based on individual MF values, PCA allows us to capture latent fatigue structures in the data without relying on thresholding or rigid assumptions. Notably, prior work by Rogers et al. [29] and Brown et al. [27] supports the use of PCA in fatigue monitoring, showing that it effectively isolates physiologically relevant trends and enhances generalization across participants. In our study, the first principal component (PC1) was used as a composite fatigue index, providing high interpretability and temporal sensitivity while reducing sensitivity to noise or redundant features.
Although our PCA-based fatigue index lacks a per-subject dynamic baseline, as used by Liu et al., we instead employed a standardized normalization method using the RMS of the first active window, which yielded robust results across participants. This baseline standardization reduced inter-subject variability without sacrificing sensitivity, a result consistent with studies advocating for active-phase normalization as a more reliable calibration strategy than rest-phase methods.
We also evaluated t-distributed Stochastic Neighbor Embedding (t-SNE) to explore non-linear interactions between features. While t-SNE has been successfully applied in biomedical contexts—including EMG-based motor classification and gait modeling, as shown by Oliveira et al. [30]—it was found to be unsuitable for our application. The non-deterministic nature of t-SNE and its high sensitivity to initialization and parameter tuning produced inconsistent fatigue trajectories across sessions, making it unreliable for longitudinal monitoring. This aligns with Oliveira’s findings, which caution against using t-SNE in applications requiring stable, reproducible outputs. As already mentioned, PCA was selected for its interpretability, computational efficiency, and robustness in real-time tracking, making it a superior fit for our composite fatigue estimation pipeline.
Beyond baseline formulation and index construction, our work also integrates machine learning models—including random forest, SVR, k-NN, CNN, and LSTM—to map standardized features to predicted fatigue scores. Compared to prior work such as Qassim et al. [9], which achieved 95% classification accuracy using a two-step algorithm based on binary labeling (fatigued vs. non-fatigued), our approach aimed for continuous, regression-based fatigue estimation. While our top-performing model, random forest, achieved a moderate R 2 score of 0.5209, the discrepancy from classification benchmarks was largely due to the more complex and granular nature of continuous fatigue prediction. Moreover, studies such as those by Sun et al. [7] and Yousif et al. [8] report superior performance for models trained on binary classification problems. In contrast, our regression-based formulation is designed to offer fine-grained, real-time tracking of fatigue levels, which is more applicable for continuous monitoring during exercise or rehabilitation.
Despite the challenges, our system successfully demonstrates the viability of a real-time black-box model capable of processing eight standardized input features to output an estimated fatigue index. Unlike traditional methods that rely on post-processed or offline evaluations, our pipeline is built with live deployment in mind, optimized for low-power, wearable environments. Our work aimed to offer not only as an academic contribution but also a step toward practical field applications, particularly in sports performance enhancement, occupational monitoring, and personalized rehabilitation.
In summary, the novelty of our work lies not in introducing new sensors, as they are already well developed, but in building a robust and integrative system that brings together validated signal features, dynamic normalization, interpretable dimensionality reduction, and regression modeling to produce an adaptable, real-time fatigue index. When compared to traditional methods like Liu et al. [2], our approach adds greater depth in signal understanding, flexibility in modeling, and scalability for embedded deployment, key attributes for next-generation fatigue monitoring systems.

5. Conclusions and Future Work

This study presented a comprehensive approach to real-time muscle fatigue monitoring using a wearable, IoT-enabled surface electromyography system. The integration of advanced signal processing techniques with machine learning algorithms yielded a robust framework for quantifying fatigue progression in the Vastus Medialis muscle during isometric contractions.

5.1. Key Findings

This research demonstrated that a multi-faceted approach to feature extraction provides more reliable fatigue detection than traditional single-metric methods. The combination of time–domain features (RMS, ARV), frequency-domain metrics (mean frequency), and hybrid features (MNF/ARV ratio, IMA Difference) effectively captured the complex physiological manifestations of fatigue. Notably, the Instantaneous Mean Amplitude Difference, which quantified the spectral shift toward lower frequencies during sustained contractions, emerged as a particularly sensitive indicator of fatigue progression.
Window size analysis revealed that an 800-sample window with 75% overlap (200-sample step) offered an optimal balance between feature stability and computational efficiency, allowing for real-time signal processing at a 4 Hz update frequency while maintaining sufficient signal representation. Among the multiple fatigue estimation approaches evaluated, Principal Component Analysis (PCA) demonstrated superior performance in dimensionality reduction while preserving fatigue-related trends across diverse participants. This enhanced the subsequent machine learning models by ensuring that only the most informative, fatigue-sensitive components were used as inputs, contributing to improved predictive accuracy.
The machine learning comparative analysis identified random forest as the most effective algorithm for fatigue prediction, outperforming other models in terms of accuracy and generalizability while maintaining computational efficiency suitable for real-time applications. The effectiveness of ensemble learning methods suggests that fatigue-related features exhibit complex, non-linear dependencies that tree-based models can capture effectively. While deep learning approaches such as LSTM and CNNs showed potential for tracking temporal dependencies, their computational complexity remains a challenge for real-time deployment.

5.2. Contributions of This Work

This study makes several significant contributions to the field of muscle fatigue monitoring. First, the development of a standardized, baseline establishment technique addresses a persistent challenge in sEMG analysis by enabling meaningful cross-subject comparisons despite physiological variations. The method of normalizing active-phase metrics by the RMS of the first active window proved effective in creating consistent metric ranges across participants while preserving sensitivity to fatigue-induced changes.
Second, the systematic evaluation of fatigue-related metrics across multiple signal processing domains advanced our understanding of which features most reliably track muscle fatigue progression. The identification of fluctuation-based metrics and EMD-derived features as strong fatigue indicators extends beyond conventional amplitude and frequency analyses, providing a more comprehensive fatigue assessment framework.
Third, the integration of Bluetooth Low Energy (BLE) communication within the sEMG monitoring system overcomes the mobility constraints of wired setups, enabling real-time, practical applications in sports training and rehabilitation. The ability to wirelessly transmit and process data in real time makes this system well-suited for dynamic, field-based applications, ensuring usability beyond controlled laboratory environments.
Finally, the development of a machine learning pipeline for personalized fatigue estimation represents a significant advancement over threshold-based approaches, offering adaptability to individual fatigue patterns while maintaining cross-population generalizability. This adaptability makes the system suitable for diverse user groups, from high-performance athletes to rehabilitation patients, where personalized fatigue monitoring can optimize performance and recovery strategies.

5.3. Limitations

Despite the promising results, several limitations must be acknowledged to contextualize the scope of this study and guide future work. First, the system was evaluated exclusively using isometric contractions of the Vastus Medialis muscle, which, while offering stability for signal acquisition, does not account for the variability introduced by dynamic movements or alternative muscle groups. Fatigue behavior during isotonic or functional tasks may involve different activation patterns and signal characteristics, limiting the generalizability of our findings to broader physical activities or clinical use cases. Expanding the system to support multi-muscle or full-body configurations would be necessary to assess its adaptability in more realistic or ambulatory scenarios.
Additionally, the sample size was limited to eleven participants, with a gender imbalance (10 males, 1 female), due to time constraints and the academic nature of this study. While this dataset sufficed for proof-of-concept validation and repeated-trial consistency analysis, it constrained the statistical power and diversity needed for full-scale generalization. Future iterations of this study should prioritize a larger, gender-balanced cohort to validate findings across varying physiological profiles and fitness levels. Moreover, all recordings were conducted in controlled conditions, which minimized noise and allowed for consistent electrode placement per SENIAM guidelines. However, these ideal conditions do not account for signal degradation or noise factors encountered in real-world environments. Manual electrode placement also introduces variability across sessions and users. To enhance the system’s usability, future efforts could explore automated placement systems or adaptive filtering techniques that compensate for electrode shift and inconsistent skin contact.
From a modeling perspective, alternatives or complementary approaches—such as autoencoders, manifold learning, or non-linear kernel PCA—could be enforced as they may uncover additional dimensions of fatigue behavior, especially when applied to high-resolution or multi-channel datasets. Similarly, the selected machine learning models, while yielding stable performance, may require personalized retraining or transfer learning techniques to accommodate inter-subject variability in fatigue response.

5.4. Future Work

Several concrete directions for future research and development arise from the findings of this study. First and foremost, expanding the dataset to include a larger and more diverse cohort—encompassing varied genders, age ranges, physical conditions, and training backgrounds—is essential to improve the robustness, fairness, and generalizability of the proposed fatigue estimation models. In addition, testing the system on different muscle groups (e.g., upper limbs, core muscles) and under dynamic movement conditions would help assess its adaptability to more complex motor tasks and practical applications in athletic performance, occupational safety, and physical therapy.
From a technological perspective, a critical next step involves the field deployment of the system in wearable embedded platforms. This includes the optimization of the signal processing and machine learning pipeline for real-time inference on low-power microcontrollers. Techniques such as lightweight feature selection, model quantization, and the use of edge AI frameworks (e.g., TinyML) could enable the migration of the current software stack from PC-based analysis to on-device processing. Building a fully autonomous wearable unit—incorporating a BLE-enabled microcontroller, battery-efficient architecture, and onboard processing—would significantly enhance usability in mobile or clinical environments.
Moreover, the development of a mobile application or companion dashboard is recommended to provide real-time visual feedback to users or clinicians. This interface could support fatigue alerts, performance summaries, and session tracking, enabling immediate, actionable insights in both sports and rehabilitation settings. Connectivity with cloud-based platforms could also allow for remote monitoring, long-term trend analysis, and integration with electronic health records.
In terms of algorithmic evolution, future work should explore online learning techniques and personalized calibration methods that adapt the fatigue model to each user over time, accounting for changing fitness levels or rehabilitation progress. Implementing unsupervised or semi-supervised adaptation could enable more scalable deployments across diverse user populations. Furthermore, integrating additional sensing modalities such as inertial measurement units (IMUs), force sensors, or heart rate monitors could enhance the context-awareness of the system, offering a multi-dimensional perspective on neuromuscular fatigue.
Lastly, longitudinal field studies are needed to validate the long-term effectiveness of the system in real-world applications. These studies should examine how continuous fatigue monitoring correlates with injury prevention, performance optimization, or rehabilitation outcomes, thereby providing empirical support for broader clinical or athletic adoption. Also, a future goal is to benchmark our composite fatigue index against established fatigue scoring systems, such as the Borg Rating of Perceived Exertion (RPE) scale and traditional EMG-based slope analysis methods, to validate its alignment with both subjective and physiological indicators of fatigue.

Author Contributions

Conceptualization, D.M., I.S. and S.K.; methodology, D.M., I.S. and S.K.; software, D.M. and I.S.; validation, D.M. and I.S.; formal analysis, D.M., I.S. and S.K.; investigation, D.M., I.S. and S.K.; resources, S.K.; data curation, D.M. and I.S.; writing—original draft preparation, D.M. and I.S.; writing—review and editing, D.M. and I.S.; visualization, D.M. and I.S.; supervision, S.K.; project administration, S.K.; funding acquisition, S.K. All authors have read and agreed to the published version of the manuscript.

Funding

This research received no external funding.

Institutional Review Board Statement

The study was conducted in accordance with the Declaration of Helsinki, and approved by the Institutional Review Board of University of Patras (protocol code 17269 and date of approval on 19 May 2025).

Informed Consent Statement

Informed consent was obtained from all subjects involved in the study.

Data Availability Statement

Dataset available on request from the authors.

Conflicts of Interest

The authors declare no conflicts of interest.

References

  1. Al-Ayyad, M.; Owida, H.A.; De Fazio, R.; Al-Naami, B.; Visconti, P. Electromyography Monitoring Systems in Rehabilitation: A Review of Clinical Applications, Wearable Devices and Signal Acquisition Methodologies. Electronics 2023, 12, 1520. [Google Scholar] [CrossRef]
  2. Liu, S.H.; Lin, C.B.; Chen, Y.; Chen, W.; Huang, T.S.; Hsu, C.Y. An EMG Patch for the Real-Time Monitoring of Muscle-Fatigue Conditions During Exercise. Sensors 2019, 19, 3108. [Google Scholar] [CrossRef] [PubMed]
  3. Wencong, X. A Surface EMG System: Local Muscle Fatigue Detection. Master’s Thesis, Delft University of Technology, Delft, The Netherlands, 2020. [Google Scholar]
  4. Samann, F.; Schanze, T. EMG based muscle fatigue detection using autocorrelation and k-means clustering. In Proceedings on Automation in Medical Engineering; Infinite Science: Lübeck, Germany, 2023. [Google Scholar]
  5. Guzu, A.; Neacşu, A.; Georgian, N. Automatic Muscle Fatigue and Movement Recognition Based on sEMG Signals. In Proceedings of the International Symposium ELMAR, Zadar, Croatia, 16–18 September 2024; pp. 259–262. [Google Scholar] [CrossRef]
  6. Wu, Y.D.; Ruan, S.J.; Lee, Y.H. An Ultra-Low Power Surface EMG Sensor for Wearable Biometric and Medical Applications. Biosensors 2021, 11, 411. [Google Scholar] [CrossRef] [PubMed]
  7. Sun, J.; Liu, G.; Sun, Y.; Lin, K.; Zhou, Z.; Cai, J. Application of Surface Electromyography in Exercise Fatigue: A Review. Front. Syst. Neurosci. 2022, 16, 893275. [Google Scholar] [CrossRef] [PubMed]
  8. Yousif, H.; Zakaria, A.; Abdul Rahim, N.; Salleh, A.; Sabry, M.; Alfarhan, K.; Kamarudin, L.; Syed Zakaria, S.M.M.; Hasan, A.; K Hussain, M. Assessment of Muscles Fatigue Based on Surface EMG Signals Using Machine Learning and Statistical Approaches: A Review. IOP Conf. Ser. Mater. Sci. Eng. 2019, 705, 012010. [Google Scholar] [CrossRef]
  9. Qassim, H.; Hasan, W.; Ramli, H.; Harith, H.; Mat, L.; Ismail, L. Proposed Fatigue Index for the Objective Detection of Muscle Fatigue Using Surface Electromyography and a Double-Step Binary Classifier. Sensors 2022, 22, 1900. [Google Scholar] [CrossRef] [PubMed]
  10. Kinugasa, R.; Kubo, S. Development of Consumer-Friendly Surface Electromyography System for Muscle Fatigue Detection. IEEE Access 2023, 11, 6394–6403. [Google Scholar] [CrossRef]
  11. BioAmp EXG Pill v1.0b Schematic. Available online: https://raw.githubusercontent.com/upsidedownlabs/BioAmp-EXG-Pill/main/graphics/docs/BioAmp-EXG-Pill-v1.0b-schematic.png (accessed on 1 October 2023).
  12. Myoware 2.0 Muscle Sensor Advanced Guide/Technical Specifications. Available online: https://myoware.com/products/muscle-sensor/ (accessed on 3 October 2023).
  13. Recommendations for Sensor Locations in Vastus Medialiss. Available online: http://seniam.org/quadricepsfemorisvastusmedialis.html (accessed on 10 December 2023).
  14. Palumbo, A.; Vizza, P.; Calabrese, B.; Ielpo, N. Biopotential Signal Monitoring Systems in Rehabilitation: A Review. Sensors 2021, 21, 7172. [Google Scholar] [CrossRef] [PubMed]
  15. Granados, J.; Rahmani, A.M.; Nikander, P.; Liljeberg, P.; Tenhunen, H. Web-Enabled Intelligent Gateways for eHealth Internet-of-Things. In Internet of Things, User-Centric IoT; Springer: Cham, Switzerland, 2015; pp. 248–254. [Google Scholar] [CrossRef]
  16. Fernando, J.B.; Yoshioka, M.; Ozawa, J. Estimation of muscle fatigue by ratio of mean frequency to average rectified value from surface electromyography. In Proceedings of the 2016 38th Annual International Conference of the IEEE Engineering in Medicine and Biology Society (EMBC), Orlando, FL, USA, 16–20 August 2016; pp. 5303–5306. [Google Scholar] [CrossRef]
  17. Candotti, C.; Loss, J.; La Torre, M.; Melo, M.; Araújo, L.; Marcks, V. Use of electromyography to assess pain in the upper trapezius and lower back muscles within a fatigue protocol. Braz. J. Phys. Ther. 2009, 13, 144–151. [Google Scholar] [CrossRef]
  18. Kiryu, T.; Sasaki, I.; Shibai, K.; Tanaka, K. Providing appropriate exercise levels for the elderly. IEEE Eng. Med. Biol. Mag. 2001, 20, 116–124. [Google Scholar] [CrossRef] [PubMed]
  19. Liu, S.H.; Chang, K.M.; Cheng, D.C. The Progression of Muscle Fatigue During Exercise Estimation With the Aid of High-Frequency Component Parameters Derived From Ensemble Empirical Mode Decomposition. IEEE J. Biomed. Health Inform. 2014, 18, 1647–1658. [Google Scholar] [CrossRef] [PubMed]
  20. Wang, C. Analyzing the influencing factors of sports fatigue based on algorithm. Rev. Bras. Med. Esporte 2021, 27, 377–380. [Google Scholar] [CrossRef]
  21. Molinari, F.; Knaflitz, M.; Bonato, P.; Actis, M. Electrical manifestations of muscle fatigue during concentric and eccentric isokinetic knee flexion-extension movements. IEEE Trans. Biomed. Eng. 2006, 53, 1309–1316. [Google Scholar] [CrossRef] [PubMed]
  22. Tsai, A.C.; Hsieh, T.H.; Luh, J.J.; Lin, T.T. A comparison of upper-limb motion pattern recognition using EMG signals during dynamic and isometric muscle contractions. Biomed. Signal Process. Control 2014, 11, 17–26. [Google Scholar] [CrossRef]
  23. Zhang, X.; Gu, Z. High accuracy recognition of muscle fatigue based on sEMG multifractal and LSTM. J. Theor. Appl. Mech. 2024, 62, 117–128. [Google Scholar] [CrossRef] [PubMed]
  24. Chalard, A.; Belle, M.; Montané, E.; Marque, P.; Amarantini, D.; Gasq, D. Impact of the EMG normalization method on muscle activation and the antagonist-agonist co-contraction index during active elbow extension: Practical implications for post-stroke subjects. J. Electromyogr. Kinesiol. 2020, 51, 102403. [Google Scholar] [CrossRef] [PubMed]
  25. Halaki, M.; Ginn, K. Normalization of EMG Signals: To Normalize or Not to Normalize and What to Normalize to? In Computational Intelligence in Electromyography Analysis—A Perspective on Current Applications and Future Challenges; InTechOpen: Rijeka, Croatia, 2012; pp. 175–194. [Google Scholar] [CrossRef]
  26. Junquera-Godoy, I.; Gomis-Tena Dolz, J.; Martínez-de-Juan, J.L.; Saiz Rodríguez, F.J.; Prats-Boluda, G. Analysis of Surface Electromyographic Parameters for the Assessment of Muscle Fatigue During Moderate Exercises; Universidad de Valladolid: Valladolid, Spain, 2022; pp. 35–38. [Google Scholar]
  27. Brown, N.; Bichler, S.; Fiedler, M.; Alt, W. Fatigue detection in strength training using three-dimensional accelerometry and principal component analysis. Sport. Biomech. Soc. Biomech. Sport. 2016, 15, 139–150. [Google Scholar] [CrossRef] [PubMed]
  28. John, C.; Omekara, C.; Okwara, G. The Principal Component Analysis Biplot Predictions versus the Ordinary Least Squares Regression Predictions: The Anthropometric Case Study. Asian J. Probab. Stat. 2019, 3, 1–10. [Google Scholar] [CrossRef]
  29. Rogers, D.; Macisaac, D. EMG-based muscle fatigue assessment during dynamic contractions using principal component analysis. J. Electromyogr. Kinesiol. Off. J. Int. Soc. Electrophysiol. Kinesiol. 2011, 21, 811–818. [Google Scholar] [CrossRef] [PubMed]
  30. Oliveira, F.H.; Machado, A.; Andrade, A. On the Use of t-Distributed Stochastic Neighbor Embedding for Data Visualization and Classification of Individuals with Parkinson’s Disease. Comput. Math. Methods Med. 2018, 2018, 8019232. [Google Scholar] [CrossRef] [PubMed]
Figure 1. A participant preparing to perform the isometric leg-extension exercise. Experimental setup: our device inside a white box attached on the clothes of the subject, from which electrodes came out and were placed on surface of the muscle.
Electronics 14 02097 g001
Figure 2. Identification of anterior spina iliaca superior and the joint space in front of the anterior border of the medial ligament (illustrating placement on Vastus Medialis, following SENIAM guidelines).
Electronics 14 02097 g002
Figure 3. Hardware setup for wireless sEMG monitoring device. The system, powered by a power bank on the left, enables wireless signal transmission to multiple computing devices for real-time muscle fatigue analysis.
Electronics 14 02097 g003
Figure 4. Selected metrics indicating muscle fatigue. Above are the normalized metrics for one subject, consisting of 3 active phases (3 sessions) consecutively, segmented by a red line.
Electronics 14 02097 g004
Figure 5. Equal-weighted sum, average, PCA, and t-SNE estimated fatigue indexes plotted in time along with their smoothed version through an LP filter. Figure shows each index on four subjects, side by side, separated by red lines, each one consisting of 3 different active phases.
Electronics 14 02097 g005
Figure 6. Random forest model evaluation on test data of a single subject. For this model, all subjects, except the one plotted above, were used as input with a 0.99 train size, and the results of real scenario model performance were evidently sufficient, using the LOSO cross-validation strategy.
Electronics 14 02097 g006
Table 1. Parameter analysis results for various window and step size combinations. Each metric of interest evaluated by variance, max–min, max differential, and computation time for various window and step sizes.
Metric CategoryWindow Size 200 Samples (0.250 s)Window Size 400 Samples (0.500 s)Window Size 800 Samples (1.000 s)Window Size 1600 Samples (2.000 s)
Step Size (Samples)Step Size (Samples)Step Size (Samples)Step Size (Samples)
1501005025300200100506004002001001200800400200
VarianceMNF/ARV8.008.058.088.087.237.157.157.156.676.666.676.686.456.396.366.38
IMA28.7728.9929.0128.9913.6113.6113.6213.626.506.546.546.543.173.163.173.17
EMD767.65755.85755.00758.81506.94520.80519.62517.02391.65388.95384.56386.74315.48298.99298.54297.91
Fluct (× 10 12 )4.485.214.884.704.284.194.364.103.353.443.463.562.812.982.972.95
Max–MinMNF/ARV25.1325.2733.1036.3919.0119.0419.0919.4116.3516.5618.6518.6516.0616.4416.4516.57
IMA30.5730.5734.8634.8619.5618.8119.5619.6112.2812.2912.3012.337.947.797.947.96
EMD260.00280.00280.00280.00244.00246.00246.00246.00175.00167.00179.00187.00201.56182.81201.56201.56
Fluct (× 10 6 )62.5770.0870.0871.2547.0537.7647.5147.5122.2623.2023.3128.3619.1419.9319.9319.93
Max DifferentialMNF/ARV10.6713.8212.7911.107.707.345.894.739.488.946.854.118.649.026.625.60
IMA17.0214.9713.0111.978.187.306.486.225.194.562.972.252.962.391.911.24
EMD216.00196.00236.00240.00202.00204.00204.00188.00118.00129.00118.00150.00134.38139.06101.56113.28
Fluct (× 10 6 )60.8561.7160.7755.3743.0933.8039.2339.3019.5119.2617.7322.3515.0411.1611.019.60
Computation Time (s)0.0570.0570.0360.0350.0530.0610.0510.0940.1470.1530.1320.1530.3060.2820.162090.159
Table 2. Standardized metric value ranges. Each metric standardized as Metric (Active/RMS (1st Active)).
ParticipantMNF/ARV RatioIMA DifferenceEMDFluctuation
Subject 120–700.1–0.3530–1200–17
Subject 230–800.1–0.330–1250–12
Subject 330–800.12–0.32530–1100–13
Subject 440–1000.1–0.2235–1200–7
Subject 530–700.125–0.335–1100–10
Subject 650–950.1–0.1935–1400–7
Subject 735–900.1–0.2535–1400–6
Subject 850–1100.08–0.1625–1000–5
Subject 935–850.1–0.2235–1250–6
Subject 1030–800.1–0.27530–950–12
Subject 1140–900.1–0.2730–1150–9
Table 3. Machine learning regression model evaluation (train size = 0.8).
ModelR2MSE
Random Forest0.52091.4059
Gradient-Boosting0.51981.4090
LSTM0.48761.5037
Simple Linear0.47181.5499
SVR0.47041.5542
KNN0.45981.5853
CNN0.43031.6717
Disclaimer/Publisher’s Note: The statements, opinions and data contained in all publications are solely those of the individual author(s) and contributor(s) and not of MDPI and/or the editor(s). MDPI and/or the editor(s) disclaim responsibility for any injury to people or property resulting from any ideas, methods, instructions or products referred to in the content.

