1. Introduction
The skin serves as a physical and chemical barrier, effectively protecting us against the external environment and rendering it a key component of overall well-being. Understanding human skin types is essential for dermatologists. Michelle Lazar et al. [
1] found that, for liquid sclerotherapy, skin types I-VI have a higher likelihood of blistering as a common side effect, while skin types IV-VI exhibit a higher rate of post-inflammatory hyperpigmentation (PIH) in darker skin tones compared to lighter skin tones, as classified by the Fitzpatrick skin phototypes. On the other hand, cosmetics interact directly with the skin’s surface to achieve aesthetic and transformative effects. However, they can yield both positive and negative outcomes. Improper application may result in adverse effects such as dull complexion, allergic reactions, and enlarged facial pores. Therefore, accurately determining one’s skin type and selecting appropriate therapies and cosmetics using precise measuring tools is crucial [
2].
Several methods exist for classifying skin types, including traditional classifications such as dry, oily, combination, or sensitive skin; the Fitzpatrick skin phototypes; and the Taylor Hyperpigmentation Scale, which primarily focus on skin hydration status, color, and response to UV radiation [
3]. The Baumann skin type indicator (BSTI), developed by doctor Baumann [
4], meticulously classifies skin types into four dimensions, each consisting of two levels: dry/oily (DO), sensitive/resident (SR), pigmented/nonpigmented (PN), and wrinkled/tight (WT), resulting in a total of 16 distinct skin types. Ultimately, conclusions are derived from consumer self-reports gathered through a questionnaire. Comparison of data gathered in China, Korea, and the US indicate no significant difference in skin type prevalence between Asian and Caucasian populations [
5], which supports the BSTI as a valuable and comprehensive tool for determining skin types [
6,
7,
8].
The BSTI questionnaire consists of 66 questions and typically requires an average of 25 min to complete. Standardizing the evaluation results for skin issues remains a challenging task, indicating that there is still room for improvement in obtaining accurate outcomes. Conversely, relying solely on doctor consultations to determine skin types often incurs expensive fees and may result in judgment errors due to variations in doctors’ clinical experiences.
The use of computer-assisted technologies offers the advantage of generating consistent outcomes, thereby minimizing potential errors arising from human observation. Sabina et al. [
9] have employed computer vision and image processing techniques, such as the Active Appearance Model and Hessian filter, for skin texture analysis. Numerous studies [
10,
11,
12,
13] have explored skin type classification systems utilizing deep learning methods. For instance, Saiwaeo et al. [
5] developed an algorithm to classify normal, oily, and dry skin types. Wanus et al. [
14] used a distance-based integration method to identify skin types based on the Fitzpatrick skin scale. However, these oversimplified criteria fail to meet the diverse skincare needs of today’s society, especially in the context of constantly changing environments and increasingly complex skin issues.
Moreover, Yuan Liu et al. [
15] verified that the accuracy of using a deep learning system (DLS) to identify the 26 most common skin diseases in adult patients is not inferior to that of dermatologists and is even more accurate than that of general practitioners. Andre Esteva et al. [
16] demonstrated that deep convolutional neural networks (DCNNs) achieve comparable performance to expert dermatologists in accurately recognizing the most prevalent types of cancer and identifying the deadliest skin cancers, thereby demonstrating the capacity of artificial intelligence to classify skin cancer at a level equivalent to that of medical professionals. Rayan Shaik [
17] utilized the convolutional neural network (CNN) architecture MobileNetV2 to construct and train a model for diagnosing skin diseases from images, providing detailed information about the conditions and recommending medication treatments. In the study of Muhammad Mujahid et al. [
18] for pneumonia classification from X-ray images, they similarly used different pre-trained convolutional neural network (CNN) variants including VGG16, Inception-v3, and ResNet50. Integration was accomplished by combining the CNNs with Inception-V3, VGG-16, and Integration is achieved by combining the CNN with Inception-V3, VGG-16, and ResNet50. The final experimental results also show that Inception-V3 with CNN achieves the highest accuracy and recall of 99.29% and 99.73%, respectively. Cheng Wang [
19] uses the Inception-v3 transfer learning model to classify lung images and finally obtains a practical and feasible computer-aided diagnosis model. Computer-aided diagnostic models can improve the accuracy and speed of doctors’ diagnosis of chest diseases. The migration learning-based experiments are proved to be meaningful for lung image classification with maximum sensitivity and specificity of 95.41% and 80.09%, respectively. Wenli Wu et al. [
20] constructed three pre-trained deep CNN models (Alexnet, ResNet-50, and Inception-v3) to differentiate between gliomas simulating encephalitis and encephalitis using deep learning based on multi-parameter MR.
CNN models have shown relatively better performance in image processing due to their high robustness [
21]. However, the aforementioned deep learning methods have thus far been exclusively employed to assist in the diagnosis of skin diseases, with limited research conducted on automated identification of comprehensive skin types. Therefore, to reinforce the importance of understanding precise individual skin types, this paper aims to provide a scientific and rigorous method for classifying skin types based on BSTI.
In this study, we utilize a deep learning framework to construct a modified Inception-v3 model and enhance the questionnaire format of the BSTI evaluation method, significantly reducing the classification time. The main objectives of this paper are as follows:
Develop a Rapid, Non-Invasive Assessment Tool: To create an innovative method for the classification of human skin types that leverages deep learning and image processing techniques, allowing for quicker and more efficient skin typing compared to traditional methods.
Enhance Accuracy Using Advanced Models: To improve the accuracy of skin type classification by implementing a modified Inception-v3 model, strategically selecting ROI, and utilizing transfer learning to achieve higher precision in assessing various skin characteristics.
Facilitate Dermatological and Cosmetic Applications: To provide dermatologists and cosmetic professionals with a reliable and objective tool that enhances skin type assessment, ultimately aiding in the selection of appropriate skincare products and treatments tailored to individual skin characteristics.
This paper is organized as follows.
Section 1 describes the related work used in this paper.
Section 2 presents the proposed methods in detail.
Section 3 and
Section 4 present the results and discussion, respectively.
Section 5 provides the conclusion and suggestions for future work.
2. Materials and Methods
2.1. Volunteer Recruitment
A total of 91 Chinese volunteers were initially recruited for this study, ranging from 18 to 60 years. After a preliminary screening for visible facial blemishes, fifty-four healthy volunteers met the inclusion criteria and were enrolled in the study. Written informed consent was obtained from all participants prior to their inclusion.
The exclusion criteria were as follows: (a) Menstruation, pregnant, or breast-feeding women; (b) used hormone drugs or received anti-immunologic therapy within 1 month or during the study period; (c) undergone cosmetic surgery, cosmetic treatment, tattooing, maintenance, spotted nevus, facial fine-tuning, or cosmetic needle injection; (d) severe systemic, immunodeficiency, or autoimmune diseases; (e) obvious skin allergy symptoms, facial damage, swelling, or scars; (f) having a cold, headache, or fever on the test day; (g) lack of consent, incomplete information, or participating in other clinical trials.
2.2. Images and Non-Invasive Biophysical Parameters Collection
The volunteers were initially allowed to cleanse their facial skin with water and then remained seated quietly for 30 min, during which they filled out the BSTI questionnaires and had their skin type results recorded across four dimensions. The VISIA-CR (Canfield Co., Ltd., Parsippany, NJ, USA) system was utilized to capture images of the volunteers’ faces from multiple angles, including the left side, front, and right side, under various lighting conditions such as standard light, parallel polarized light, and cross-polarized light to enhance visualization. The standard light, also referred to as normal light, closely resembles the appearance of the skin surface as perceived by the naked eye and simulates lighting conditions typically encountered in everyday situations. Polarized light filters out interference caused by external color differences, shadowing, facial oils, and reflective light, allowing for hemoglobin imaging to analyze the vascular condition of the skin and the uniformity of skin tone. Both lighting sources are readily accessible for such analyses. Three types of images were taken using cross-polarized light: standard cross-polarized, brown spot, and red spot images (
Figure 1).
Seven skin parameters were measured using the multi-probe adapted instruments MPA580 and MPA10 (Courage + Khazaka Electronic GmbH, Cologne, Germany), which include skin elasticity (R2, R7), melanin content (MI), individual typology angle (ITA°), skin yellowness (b*), skin hydration (CM), and transepidermal water loss (TEWL). Tests were conducted on symmetrical parts of the left and right sides of the face, and the final data were obtained by averaging results from six tests.
2.3. Image Processing
ROI plays a critical role in medical imaging, particularly for initial diagnosis, analysis, and consultation [
22], while also reducing the complexity of training algorithms. The optimal ROI was determined based on four levels of categorical requirements and the assessment of non-invasive indicators. We took full-face images and left- and right-side images of volunteers under all light sources for subsequent optimal ROI determination.
Image metrics, including pore count, pore size, glossiness, crow’s feet area, number of pigmentation spots, and pigmentation area, were subsequently extracted using Image Pro Plus 6.0 (IPP 6.0).
2.4. Statistical Analysis
We conducted correlation and difference analyses between indicators using IBM SPSS Statistics 25.0 software (IBM, New York, NY, USA). The statistical tests were two-tailed, with a significance level set at 0.05 (p < 0.05). All data were presented as mean ± standard deviation (SD). The differences in physiological skin parameters (R2, R7, MI, ITA°, b*, CM, TEWL) across different Baumann skin types were assessed using independent sample t-tests. Kendall’s Tau-b correlation analysis was employed to explore the relationships between apparent skin data—such as the number of pores, pore diameter, glossiness, crow’s feet area, number of pigmentation spots, and pigmentation area—and Baumann skin types.
2.5. Image Dataset
2.5.1. Dataset
Gaussian filtering was employed to preprocess the ROI image, effectively mitigating noise. The dataset comprising skin image data was divided into training and validation sets in a 7:3 ratio for each dimension analyzed. Subsequently, the training set underwent offline data augmentation to enhance data variability.
2.5.2. Data Augmentation
Offline data augmentation involved two specific techniques: flipping and rotating. The dataset was augmented through both horizontal and vertical flipping, alongside random rotations of 90 degrees. This augmentation strategy increased the total number of skin images to 648, thereby enhancing the robustness of the dataset.
2.6. Classification Algorithm Model Development
The model was constructed using the transfer learning approach, leveraging the TensorFlow (version 2.10.0) deep learning framework to construct the Inception-v3 model. In the field of deep learning, accuracy [
23,
24] is one of the bases for evaluating model performance. To evaluate the proposed method, all four models used the accuracy and loss of the validation set as a benchmark. The pretrained ImageNet dataset is trained to acquire optimized initial parameters, thereby accelerating the model training speed, enhancing the recognition accuracy, and improving the generalization capabilities. The model includes four detection models (
Figure 2).
2.6.1. DO Detection Model
The loaded image is subjected to normalization in the preprocessing unit after being fed into the DO type detection model. The dimensions are uniformly scaled to 299 × 299 pixels. The scaled image is subsequently utilized as the input for the Inception-v3 network. Following the retention of the top global average pooling layer within the Inception-v3 network, the model was fine-tuned. To mitigate overfitting, a 3 × 3 convolution layer is introduced along with L2 weight regularization. Additionally, an average pooling layer, a fully connected layer, and three dense layers (comprising 1024, 10, and 1 unit, respectively) are appended. The first two dense layers employ the rectified linear unit (ReLU) activation function, while the final dense layer utilizes the sigmoid classifier to yield DO detection outcomes (
Table 1).
2.6.2. SR Detection Model
The image was initially resized to 299 × 299 pixels using uniform scaling in the preprocessing unit after being loaded into the skin SR type detection model. The scaled image was then utilized as input for the Inception-v3 network. The model preserves the top-level global average pooling layer of the Inception-v3 network and conducts fine-tuning by incorporating an additional average pooling layer and a fully connected layer. To mitigate overfitting, dropout was employed to discard 30% of the features. Furthermore, two dense layers with a ReLU activation function were added, followed by a sigmoid classifier in the last dense layer to yield SR detection outcomes (
Table 2).
2.6.3. PN Detection Model
After the image was loaded into the PN-type detection model, it underwent initial preprocessing involving mean filtering to reduce image noise and enhance spot characteristics. The image was resized to 299 × 299 pixels. Subsequently, the scaled image was utilized as input for the Inception-v3 network. The top-level global average pooling layer of the Inception-v3 network was retained and fine-tuned in this model. To mitigate overfitting, an additional average pooling layer and a fully connected layer were incorporated into the model with a dropout rate of 30%. Furthermore, two dense layers employing ReLU activation functions were appended, while a softmax classifier was employed in the final layer to yield PN detection outcomes (
Table 3).
2.6.4. WT Detection Model
The image was initially normalized in the preprocessing unit after being loaded into the WT-type detection model. The size was uniformly adjusted to 299 × 299 pixels. The scaled image was then utilized as input for the Inception-v3 network. The model preserves the top-level global average pooling layer of the Inception-v3 network and conducts fine-tuning. It incorporates an additional average pooling layer and a fully connected layer, applies dropout to discard 20% of the features to mitigate overfitting, introduces two dense layers with the ReLU activation function, and ultimately employs a sigmoid classifier in the last dense layer to generate WT detection results (
Table 4).
3. Results
The following results were obtained based on different designs in the method.
3.1. Description and Correlation of BSTI and Skin Biophysical Properties
An independent samples
t-test was performed to analyze the variance in skin parameters among volunteers across four categorial dimensions (
Table 5,
Table 6,
Table 7 and
Table 8). The results indicate that, in the dry skin group, MI, b*, individual typology angle (ITA°), pore size, and crow’s feet area were slightly higher, while CM, TEWL, and pigmentation area were slightly lower. No significant differences were found between dry and oily skin for R2 and R7 parameters, although oily skin exhibited significantly larger pore sizes and diameters, with
p-values of 0.016 and 0.020, respectively.
In the resistant group, MI and spot size were marginally higher, while the sensitive group demonstrated higher CM and crow’s feet area. Most parameters showed that sensitive and resistant skin types share similar biophysical properties with no significant differences.
For the pigmented skin type, there were slight increases in ITA°, CM, TEWL, and pore size. Additionally, the melanin index was significantly higher in pigmented skin compared to nonpigmented skin, with no other parameters showing significant differences.
The wrinkle-prone skin type showed slightly higher MI, ITA, CM, TEWL, and pore size, whereas the tight skin type exhibited slightly increased areas of crow’s feet and pigmentation. Significant differences were noted in R2 and R7 between wrinkled and tight skin dimensions, with average values of 0.053 and 0.33 for wrinkled skin, being higher than those in the tight skin group. Differences in pore diameter and glossiness were also observed, with tight skin having smaller pores and less glossiness.
We also performed a correlation analysis for seven of the parameters (
Figure 3). The results show that TEWL showed significant correlation in sensitive and tolerant skin types (
p = 0.014 < 0.05), and the b-value was correlated with discoloration and non-discoloration skin types (
p = 0.045). R2,R7 were significantly correlated with tight and wrinkled skin types with
p-values of less than 0.05, and the other parameters did not show correlation.
Based on the analysis of various parameters, significant statistical differences were observed in pore size and diameter, TEWL, and MI among certain skin types. However, most parameters did not demonstrate sufficient discriminatory power to effectively differentiate between skin types. This indicates that relying solely on individual biophysical parameters often falls short in effectively classifying skin conditions. While the sample size and data collection methods might contribute to these observations, it does not detract from the fact that traditional physiological parameters have limitations in skin type classification.
Based on these observations, further investigation into the potential applications of the Inception-v3 model and exploration of methods to enhance its performance were conducted.
3.2. Results of Data Enhancement and Optimum
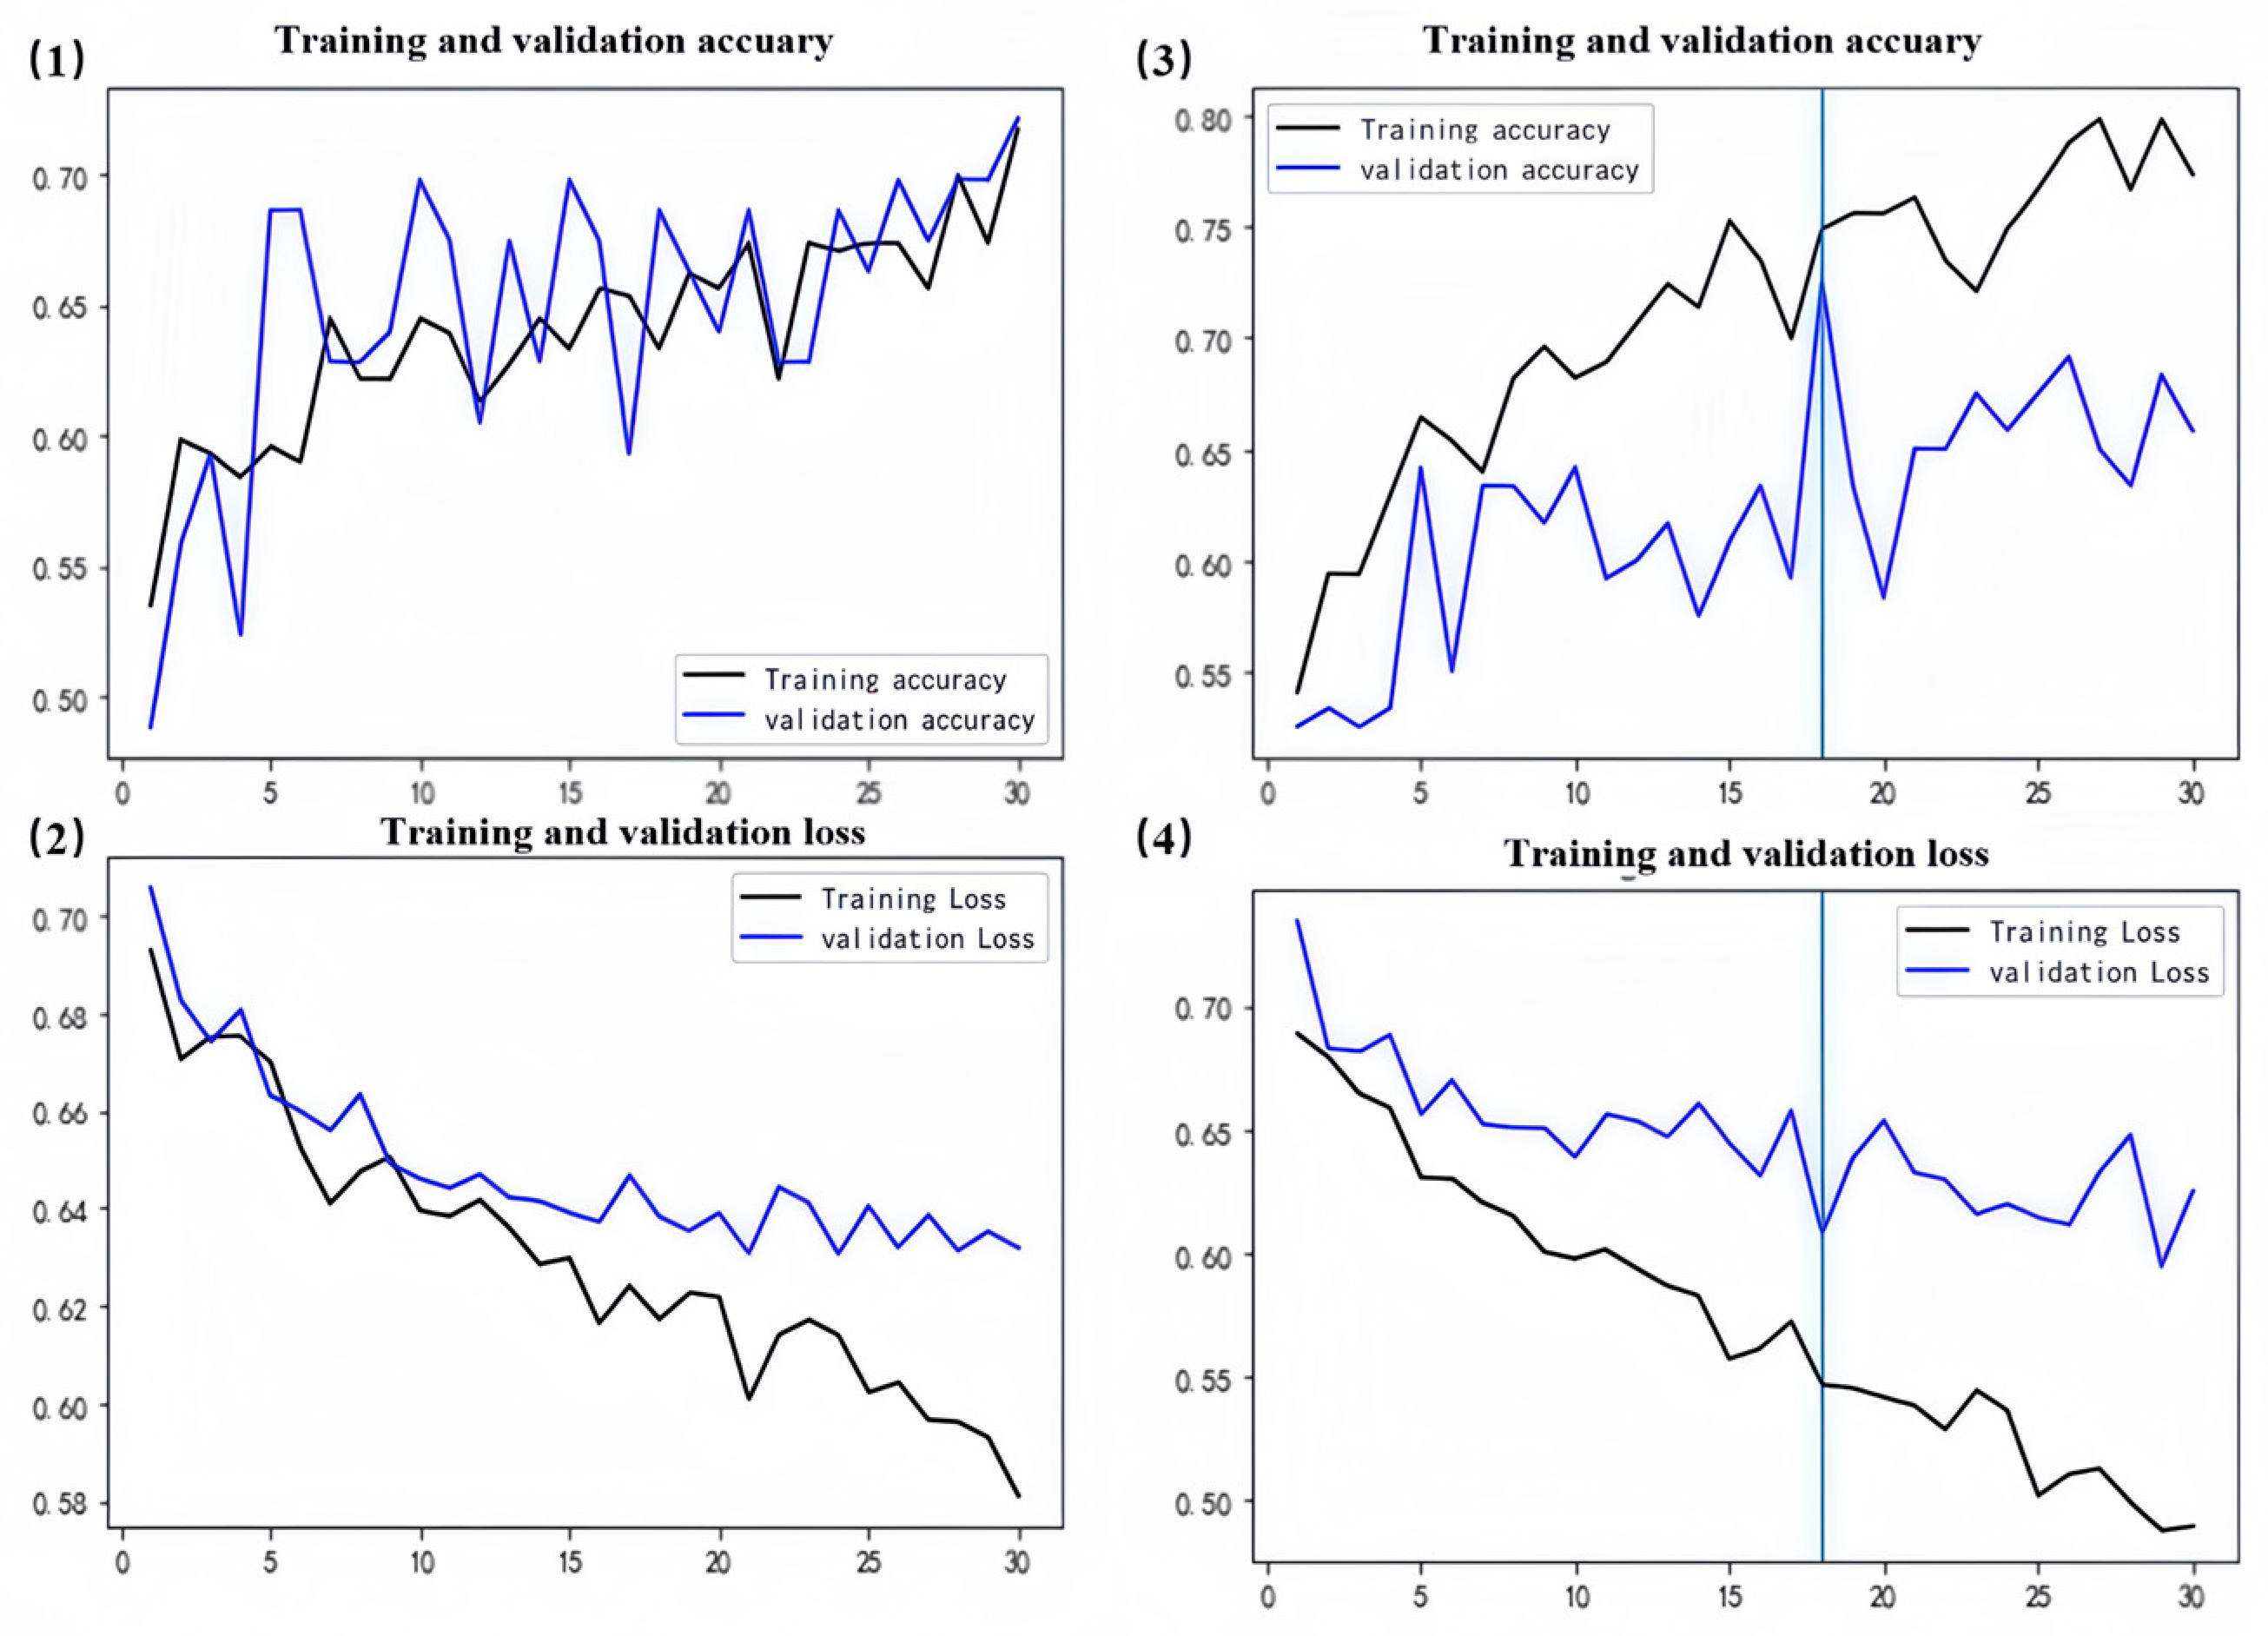
The datasets for the four classification models were subjected to realistic yet randomized transformations applied to the training images including rotations and horizontal flips. These modifications were designed to introduce sample diversity and increase data volume, which aids in exposing the models to varied facets of the training data, thereby helping to mitigate overfitting. Following dataset augmentation, each model underwent specific optimizations (
Figure 4).
For the DO model, image binarization was employed to accentuate bright regions, with the size of the white areas serving as a criterion for classifying skin as oily or dry. This was followed by the exclusion of anomalous images and adjustments for inconsistencies between labels and image data (
Figure 5(1,2)). Similarly, the datasets for the SR (
Figure 5(3,4)) and WT models were refined by removing anomalous images.
Enhancements to the PN model’s dataset included noise reduction via Gaussian filtering, followed by binarization to exclusively highlight freckle information. Subsequent corrections were made for label-image discrepancies, using the size and number of spots as indicators; images with larger and more numerous spots were categorized as having hyperpigmentation, while those with fewer or smaller spots were classified otherwise (
Figure 5(5,6)).
3.3. Comparison of Four Classical CNNs Performance
3.3.1. Performance of Improved Inception Network
Based on the solid performance of Inception-v3 as determined through a literature review, we ultimately chose Inception-v3 to develop the Baumann skin classification model. All four classification models utilize the Inception-v3 architecture preloaded with ImageNet-trained weights. For the DO, SR, and PN models, the network layers are frozen, effectively immobilizing the weights during training. The DO model extends the base architecture by adding an average pooling layer and a flatten layer, culminating in a dense layer that compresses the feature vector to one dimension. To combat overfitting, the base model is augmented with additional convolutional layers employing L2 weight regularization. Similarly, the SR and PN models integrate an average pooling layer followed by a flattening layer, and incorporate a 30% dropout rate in the feature vector to further mitigate overfitting. The WT model adopts a strategy of freezing the convolutional base to preclude updates to the weights within these layers during the training phase. It includes an average pooling layer and a flattening layer, with a 20% dropout to lessen overfitting, and concludes with a dense layer that reduces the feature vector to two dimensions.
Ultimately, the optimized model demonstrates increased accuracy across validation sets, exhibits reduced loss in the validation sets, and overall, its performance was enhanced (
Figure 6,
Figure 7,
Figure 8 and
Figure 9). Specifically, the DO accuracy improved by 28.61%, the SR model improved by 12.38%, the PN model improved to 91.72%, and the WT model improved to 74.9% (
Figure 10).
3.3.2. Comparison of Other Models’ Performmance
Meanwhile, we compared the improved model with VGG16, ResNet-50 [
25], and MobileNet models (
Figure 10). The results reveal that MobileNet demonstrated poor performance in the DO layer recognition, with training and validation accuracies of 68% and 55%, respectively. ResNet-50 exhibited overfitting issues in the SR task, achieving 100% training accuracy but only 67.85% validation accuracy. In the PT and WT recognition tasks, VGG16 displayed a more balanced performance with 67% and 54% accuracy in the validation set; however, its validation accuracies were still below the desired levels.
Despite its higher parameter count, Inception-v3 proves to be the most effective model for skin type classification under well-resourced conditions with all four classification models yielding higher results than the other model results. The VGG16, while having the highest parameter count and computational complexity, does not yield superior performance in the PN and WT dimensions.
3.4. Model Evaluation Under Different Light Sources
To explore the precision of our model across different tasks under varying lighting conditions, we compared the accuracy under optimal and non-optimal (comparative) light source conditions. The classification accuracies of the models under the optimal and comparative light source conditions are illustrated in
Figure 11. The results indicate that, in all four classification dimensions, the model accuracy under our chosen optimal light source is significantly higher than that under the comparative light source, achieving better classification accuracy.
In the DO task, the model achieved an accuracy of 91.11% under optimal lighting conditions, significantly outperforming the comparative light source condition at 60.9%. For the SR task, under optimal lighting, the model’s accuracy was 81.13%, compared to 62.58% under comparative lighting, indicating that, while the model is relatively robust to the quality of lighting, it still shows a considerable impact. In the PN task, the model demonstrated excellent robustness under optimal lighting conditions, reaching an accuracy of 91.72%. In contrast, under comparative lighting, the accuracy dropped to 56.41%, highlighting the task’s high dependency on favorable lighting conditions. The WT task also showed significant fluctuations in model performance with changes in lighting conditions.
3.5. ROI Optimization and Model Performance of Different ROI
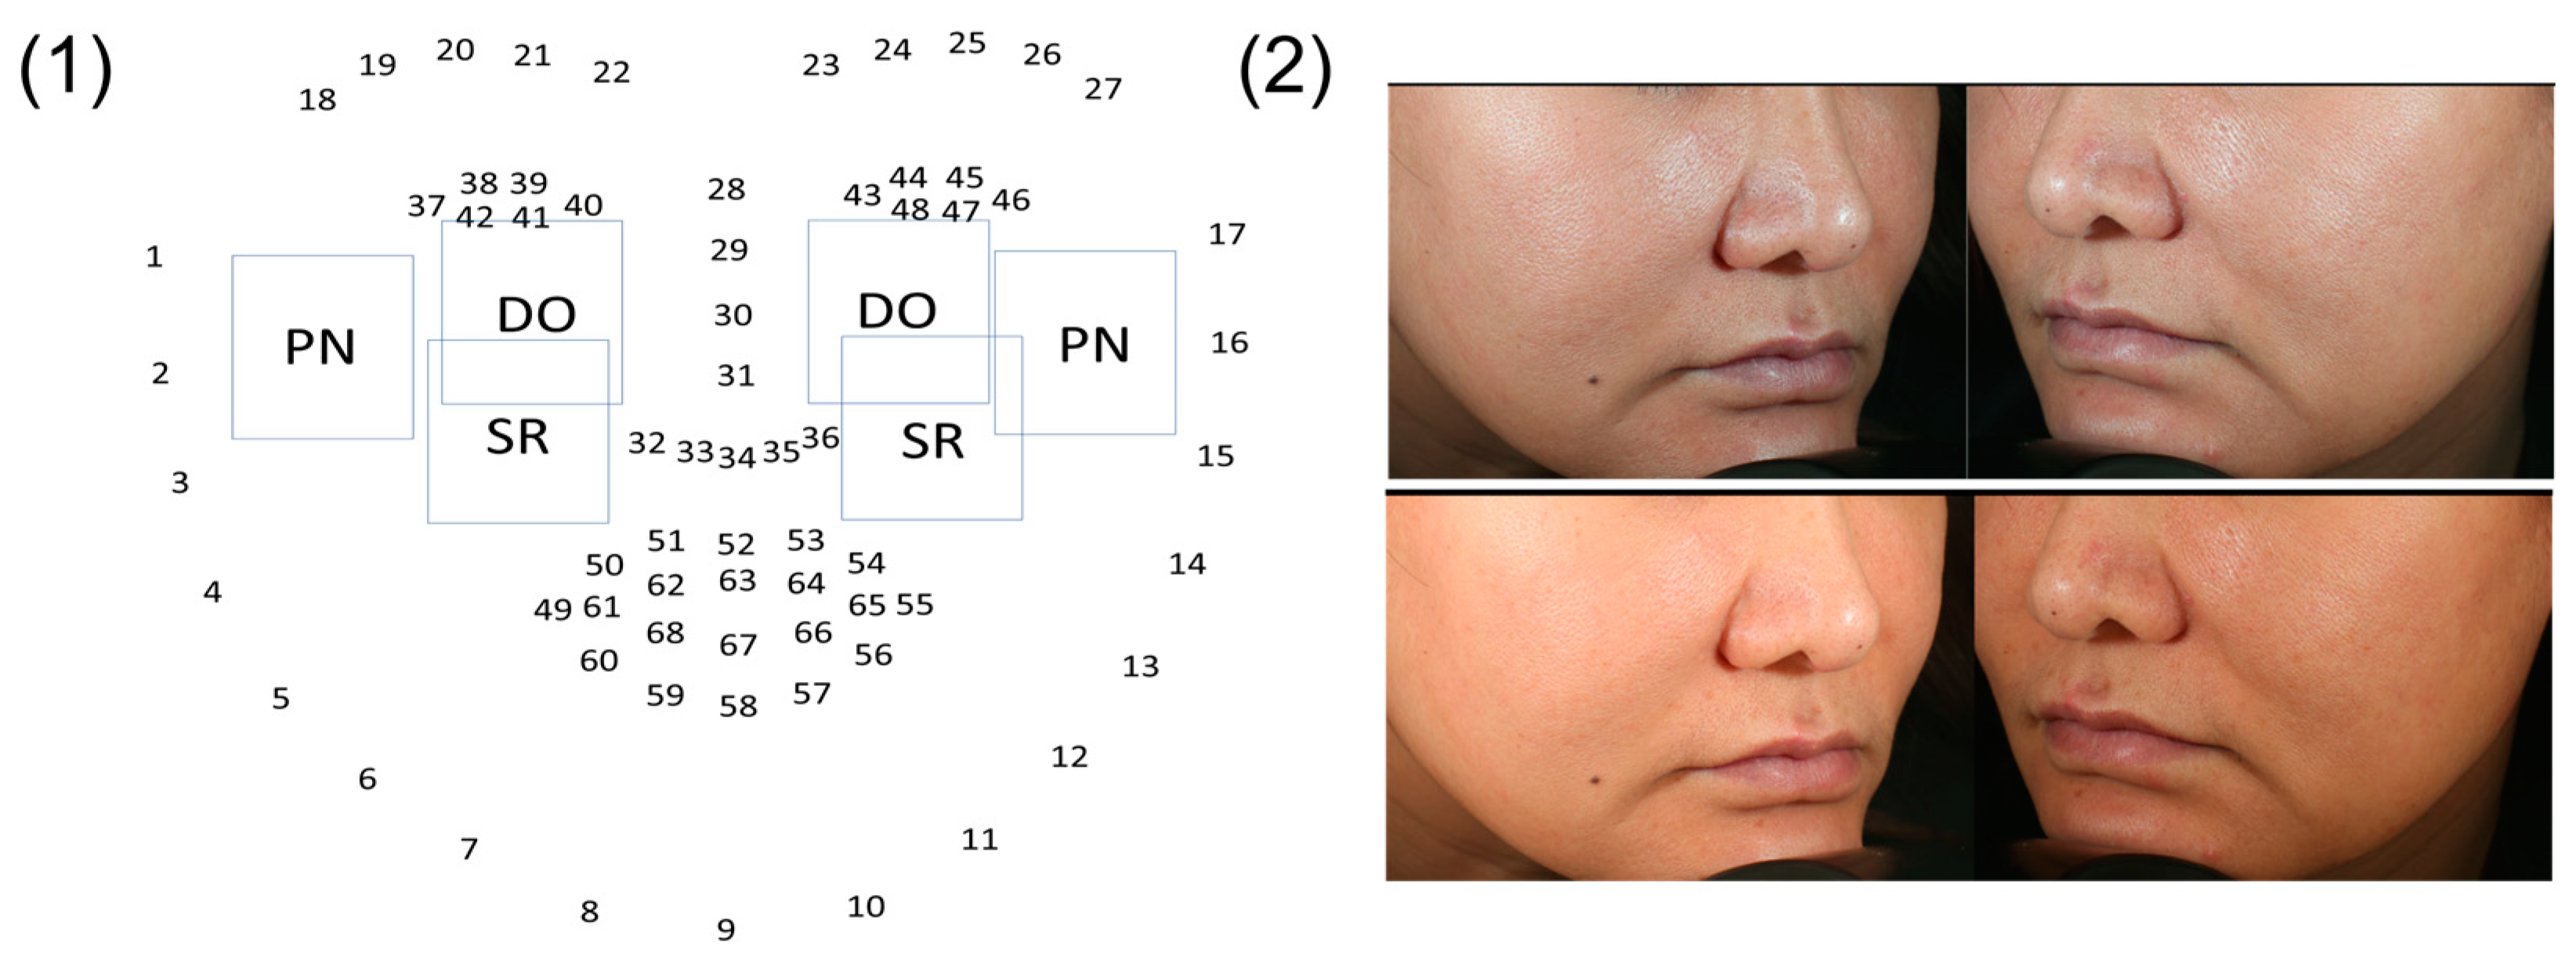
Different levels of ROI were identified based on the dlib-68 points (
Figure 12), and models for selecting various ROI were evaluated. The impact of these different ROI on the classification results was investigated. It is obvious that the selected ROI generally outperform the entire face or other specific regions in terms of model training and validation accuracy, especially on dry and pigmented skin types. These findings highlight the significant impact of targeted ROI selection on improving model accuracy (
Figure 13).
3.5.1. DO
Considering that the T-zone images of volunteers typically exhibit sebum secretion, which lacks significant discriminatory power between dry and oily skin types, we prioritized the use of the cheek areas near the nose and the forehead as data sources to differentiate between dry and oily skin. These regions were automatically selected based on a facial localization model, and their images were subsequently input into the model for comparison of results. The outcomes demonstrated that using the cheek as the input region achieved a training accuracy of 100% and a validation accuracy of 91.11%. In contrast, the model performed less effectively with the forehead region, achieving only a 68% training accuracy and a 67.86% validation accuracy, partly due to poor localization in the algorithm’s automatic selection process. Ultimately, the cheek was confirmed as the optimal ROI.
3.5.2. SR
Red spot images indicate the condition of the skin’s capillaries. A smaller number suggests thinner skin, thereby increasing sensitivity. Due to their relatively uniform skin tone and lack of disturbances, the bilateral cheek areas were selected as data sources, with the full face used for comparison. Images from both the cheek areas and the entire face were extracted from frontal erythema images under cross-polarized light. In this dataset, the model achieved a training accuracy of 85.57% and a validation accuracy of 81.13% in the cheek dataset, demonstrating good adaptability and stable generalization capabilities. In contrast, the validation accuracy for the full-face dataset was only 72.92%, indicating poorer results. Therefore, the cheek is confirmed as the optimal ROI.
3.5.3. PN
Brown spot images reveal pigmentation at the surface or deeper layers of the skin, providing an effective method for assessing levels of pigmentation. The areas around the cheekbones are particularly susceptible to excessive pigmentation. Therefore, under cross-polarized light, images of the cheekbone area were extracted from facial brown spot images, with full facial area images selected for comparison. The model exhibited excellent performance in the cheekbone dataset, achieving a validation accuracy of 91.72%. Consequently, the cheekbone area is confirmed as the optimal ROI for this model.
3.5.4. WT
A complete facial image allows for a comprehensive assessment of wrinkles, thereby facilitating more accurate evaluations. Additionally, nasolabial folds and crow’s feet, being the most common facial wrinkles, were specifically targeted for classification. Therefore, we chose to analyze the left and right sides of the face, as well as the periocular and perioral regions, under standardized lighting conditions using both cross-polarized and parallel-polarized light. However, due to individual facial characteristics of the volunteers, automated localization of the eye corners was inconsistent and unreliable, leading to the exclusion of the eye corner regions. The classification results show that the model achieved a training accuracy of 72.5% and a validation accuracy of 74.9% in the bilateral facial regions. In the nasolabial fold region, the model exhibited a lower training accuracy of 56%, though the validation accuracy improved to 65.3%, both of which were inferior to the performance in the side face regions. Ultimately, the left and right cheeks under standard lighting conditions were selected as the optimal ROI.
4. Discussion
In this study, we propose a rapid skin classification method for the BSTI using deep learning models and image recognition techniques. The key strengths of our approach lie in its acceptable and valuable performance results and contribution to deep learning in the medical field, which can serve as an auxiliary diagnostic tool for dermatologists. In addition, this approach is advantageous for addressing consumers’ specific skincare needs and comprehending individual skin types. Specifically, this method offers distinct advantages across all four dimensions.
An accuracy of 91.11% was achieved in classifying dimensions of dry and oily skin. In contrast, Kothari [
11] reported that their CNN-based skin classification model, which gathered skin sections of dry and oily plants through a network, achieved an accuracy of approximately 85%, lower than that of the present model. Moreover, discrepancies were noted in the identification of images depicting oily skin. Sudarma [
26] used computer-aided techniques to extract facial image features for classifying neutral, oily, and mixed skin types, employing a support vector machine (SVM) as the classifier. The average classification accuracy reported was comparable to the DO dimension in this study. However, the use of cellphone cameras and SLR cameras, which do not adequately account for variations in lighting conditions, introduced certain inaccuracies. The ROI was selected and the area on both sides of the nose was extracted under standard lighting conditions, minimizing interference from oil-prone areas and external light sources. Through an understanding of skin physiology, an optimal ROI was determined by breaking pairings with corresponding areas in common skin evaluation dimensions, which not only achieved high accuracy but also conserved computational resources.
When assessing facial wrinkles, we carefully selected left and right profile images because they are particularly adept at detecting wrinkles holistically, resulting in an impressive accuracy rate of 74.9%. However, there is a scarcity of image-based algorithms in the literature for computing and evaluating facial wrinkles. SWIRL [
27] is an objective and quantitative approach for assessing facial wrinkles. This methodology necessitates highly reproducible image capture to ensure accurate and reliable analysis. The L’Oréal Scale [
28] encompasses a substantial collection of photographs employed for the assessment of skin aging, and its efficacy is evaluated based on visual assessment criteria. However, employing images as benchmarks introduces uncertainty in human correspondence and complicates comparisons. G. O. Cula [
29] developed an algorithm for the automatic detection of facial wrinkles and demonstrated a strong correlation between the wrinkle score and clinical score. However, their method solely focused on selecting forehead images as a dataset, which may lead to inaccurate results in wrinkle detection.
Previous artificial intelligence research [
30] has traditionally focused on the early detection of pigmented skin lesions rather than identifying healthy skin with pigmentation or nonpigmentation. The Taylor Hyperpigmentation Scale [
31] commonly employed for assessing skin tone and pigmentation improvement is cost-effective and convenient but lacks objectivity. In this study, regions on the cheekbone were selected as ROI since they are also called acquired bilateral nevus-of-Ota-like macules (ABNMs), which are common skin dyspigageneses in Asian females [
32] and are easily pigmented first. An objective classification algorithm was utilized to identify PN with a classification accuracy of 91.72%, demonstrating its significance.
The method directly classified skin tissue as sensitive or resistant through the optimal model Inception-v3, with an accuracy of 81.13%, which was good. Alessandro Borghi [
33] employed a self-assessment questionnaire for the diagnosis of sensitive skin, yielding accuracies of 76.6% and 72.8% when the skin sensitivity score was 4 and 5, respectively; however, these accuracies were found to be inferior to those reported in this study. Furthermore, studies [
34,
35] exist on the assessment of skin barrier function and identification of various subtypes of sensitive skin using capsaicin stimulation experiments [
36] and the lactic acid sting test [
37] to determine current sensation thresholds, but these methods are highly specialized. The execution of both of these tests necessitates the involvement of skilled operators and the use of professional reagents within a laboratory setting.
5. Conclusions
In this study, skin type recognition and analysis were conducted using the TensorFlow deep learning framework, with transfer learning employed to build the model. The proposed model was compared with the original Inception-v3, ResNet-50, VGG16, and MobileNet models. We also assessed different light sources and ROI to identify the optimal ROI and light source under four dimensions for pre-detection. Notably, the model achieved significant accuracies of 91.11% and 91.72% in the DO and PN dimensions, respectively. The optimal light sources for the DO and WT classification models are commonly used in everyday life, ensuring high accessibility. In addressing the challenge of integrating BSTI with artificial intelligence, our algorithm resolves this issue by carefully selecting ROI and designing algorithms based on a deep understanding of skin physiology and metrology.
However, our study has some limitations. The volunteers were all East Asians, and due to objective constraints, only 54 participants were included in the image classification study after exclusions. We plan to recruit additional volunteers to expand the dataset and enhance the model’s generalizability. Additionally, we aim to further validate and improve our model by addressing domain shift and open-set issues [
38]. Furthermore, BSTI mainly focuses on recognizing healthy skin types with high similarity and does not involve participants with pathological skin conditions. Our current study also did not include comparisons with the latest models, such as K-UAN. Future research will involve comparative analysis with the latest models, particularly the U-KAN model, to improve the segmentation of pathological skin images, thus enhancing the model’s generalization and applicability.


