Abstract
Due to the characteristics of large size differences and shape variations in the sealing surface of electric vehicle electronic water pump housings, and the shortcomings of traditional YOLO defect detection models such as large volume and low accuracy, a lightweight defect detection algorithm based on YOLOv8n (You Only Look Once version 8n) is proposed for the sealing surface of electric vehicle electronic water pump housings. First, on the basis of introducing the MoblieNetv3 module, the YOLOv8n network structure is redesigned, which not only achieves network lightweighting but also improves the detection accuracy of the model. Then, DualConv (Dual Convolutional) convolution is introduced and the CMPDual (Cross Max Pooling Dual) module is designed to further optimize the detection model, which reduces redundant parameters and computational complexity of the model. Finally, in response to the characteristics of large size differences and shape variations in sealing surface defects, the Inner-WIoU (Inner-Wise-IoU) loss function is used instead of the CIoU (Complete-IoU) loss function in YOLOv8n, which improves the positioning accuracy of the defect area bounding box and further enhances the detection accuracy of the model. The ablation experiment based on the dataset constructed in this paper shows that compared with the YOLOv8n model, the weight of the proposed model is reduced by 61.9%, the computational complexity is reduced by 58.0%, the detection accuracy is improved by 9.4%, and the mAP@0.5 is improved by 6.9%. The comparison of detection results from different models shows that the proposed model has an average improvement of 6.9% in detection accuracy and an average improvement of 8.6% on mAP@0.5, which indicates that the proposed detection model effectively improves defect detection accuracy while ensuring model lightweighting.
1. Introduction
Precise temperature control of electric vehicle motors is critical to ensuring their long-term, efficient, and stable operation [1,2,3]. As a key component of the cooling system, the quality of the electronic water pump significantly affects the cooling performance of the system. The presence of defects on the sealing surface of the electronic water pump housing is closely related to the overall quality of the pump. Therefore, defect detection of the sealing surface of electronic water pump housings prior to shipment is an essential procedure.
Currently, sealing surface defect detection is primarily performed through manual visual inspection or machine vision techniques. The former is highly subjective and prone to errors, as prolonged manual inspection can lead to fatigue, resulting in missed or incorrect detections, ultimately compromising product quality. With advancements in computer and image processing technologies, machine vision detection has rapidly evolved in recent years. Traditional vision detection methods typically involve segmenting images of the sealing surface and comparing them with manually created templates of defect-free samples to determine whether defects are present. When defects are relatively uniform in size and regular in shape, these methods are more efficient and exhibit lower rates of missed and incorrect detections compared to manual inspection. However, when defect sizes vary significantly, and shapes become irregular, traditional vision detection methods experience higher rates of both missed and incorrect detections.
Machine learning and deep learning are both important technologies in computer vision. Machine learning algorithms rely on manually designed features to extract useful features from raw data, typically suitable for scenarios with small data volumes and simpler problems. However, machine learning often encounters limitations when dealing with complex problems. In contrast, deep learning models automatically learn complex feature representations through multi-layer neural networks, without relying on manually designed features. This makes deep learning demonstrate significant advantages in handling more complex pattern recognition tasks, especially on large-scale datasets.
In recent years, deep learning has garnered significant attention for its ability to extract meaningful features from large datasets during image recognition and processing. This artificial intelligence approach effectively overcomes the limitations of traditional vision methods, which rely on manually designed templates and fixed rules. Deep learning offers strong adaptability and high accuracy in object detection tasks.
To effectively and efficiently identify defects on sealing surfaces with significant size variations and irregular shapes, this study introduces YOLOv8n as the base model, leveraging its advantages of high detection accuracy and fast detection speed. The model is further improved to enhance its ability to extract defect features and accurately localize defect bounding boxes. Additionally, the proposed modifications reduce the number of model parameters, improving operational efficiency and minimizing resource consumption.
2. Comparison and Application of Deep Learning Algorithms
2.1. Comparison of Deep Learning Algorithms
Deep learning not only enables the automatic learning of image information through data training but also facilitates the extraction of multidimensional features from images with its multi-layer network architecture. Additionally, leveraging the parallel computing capabilities of modern hardware, deep learning significantly enhances the accuracy and efficiency of image processing tasks [4,5]. Consequently, research on defect detection based on deep learning has achieved remarkable progress in recent years [6].
Defect detection algorithms based on deep learning can generally be classified into three categories: one-stage, two-stage, and Detection Transformer (DETR) [7]. One-stage defect detection algorithms are widely used due to their high detection speed. However, compared to other algorithms, their accuracy is relatively low. A typical representative algorithm is YOLO [8]. In contrast, two-stage defect detection algorithms typically have higher detection accuracy but at the cost of slower detection speed, with Mask R-CNN [9] being a typical example. DETR was the first model to introduce Transformer into object detection, simplifying the traditional detection process by implementing end-to-end detection without Anchors and Non-Maximum Suppression (NMS). However, the self-attention mechanism of DETR has a high computational complexity, requiring more computing resources and time, which leads to slower detection speed. For general surface defect detection tasks, the accuracy of the one-stage algorithm is typically sufficient to meet most practical application requirements. This type of algorithm can simultaneously classify and locate targets in a single forward inference, demonstrating significant advantages in scenarios with high real-time requirements. YOLO, a representative one-stage detection algorithm, has become one of the most widely used and classic algorithms in the field, thanks to continuous optimization by numerous scholars. YOLOv8 is launched on this basis, consisting of five different versions, namely YOLOv8n, YOLOv8s, YOLOv8m, YOLOv8l, and YOLOv8x, each increasing in size in sequence.
2.2. The Application of Deep Learning
Wang et al. [10] developed a defect detection system for impurities in injection-molded components. The system first optimized the light source to improve image quality and then employed image filtering, adaptive thresholding, and Canny edge detection techniques to detect defects, achieving a false positive rate of only 0.046. However, the detection accuracy for defects smaller than 1 mm remains a challenge. Similarly, Xie et al. [11] successfully implemented surface defect detection for wipers by combining morphological image processing with Gabor filtering, achieving a detection accuracy of 95%. While effective for distinct defect features, this method faces challenges with smaller defects.
Li et al. [12] proposed the YOLO-Oring model by improving YOLOv8n, which significantly enhanced the detection capability for small-sized defects on O-ring surfaces, achieving a mean average precision (mAP) of 94.1%. However, the model’s computational load was only reduced by 16%, indicating room for improvement in lightweight optimization. Shan et al. [13] addressed defect detection for the sealing surfaces of internal thread connectors by improving YOLOv4. The modified model utilized the K-means++ algorithm to optimize anchor boxes and embedded the SENet attention mechanism into the backbone network, enhancing the detection accuracy of small defect targets. However, the K-means++ algorithm demonstrated limited adaptability for defects of varying sizes and irregular shapes.
Chun et al. [14] implemented defect detection for automotive adhesives based on an improved YOLOv8n model, which enhanced detection efficiency. However, the mAP@0.5 of the model was only 0.762, indicating a need for further improvements in detection accuracy.
In summary, accurately identifying defect features of varying sizes and shapes within complex backgrounds remains a significant challenge in surface defect detection. Additionally, achieving a lightweight model design while maintaining high detection accuracy is an essential research topic that warrants further exploration.
The YOLO model, first introduced for its simple architecture and fast detection speed, quickly garnered attention from researchers worldwide. Over time, with continuous iterations and optimizations, YOLO has become a dominant model in the field of object detection. However, the large size variations and irregular shapes of defects on the sealing surfaces of electronic water pump housings present significant challenges for detection models, particularly in handling defects at different scales. Additionally, existing YOLO models are often plagued by issues such as a high number of parameters and large model sizes, limiting their practical applicability. To address these challenges, this study proposes a lightweight algorithm for defect detection on the sealing surfaces of electronic water pump housings based on the YOLOv8n model.
3. Research on Defect Detection Methods
3.1. Dataset Construction and Analysis
The quality of the sealing surface of the electronic water pump housing is directly related to the overall quality of the electronic water pump. Currently, defects in the sealing surface of electronic water pump housings mainly arise from material manufacturing, transportation, or factory handling during storage and transfer. A small portion of defects result from the reworking of defective products during production. With the deep integration of information technology and manufacturing, as well as continuous social and economic development, product manufacturing has gradually shifted from merely increasing quantity to focusing more on quality improvement. To ensure high-quality production of electronic water pumps for electric vehicles, comprehensive defect detection is essential for every housing entering the production line.
Since there is currently no publicly available dataset for defect detection for electronic water pump housing sealing surfaces, this study created its own dataset based on the collection setup shown in Figure 1. The setup consists of a camera, a light source, and VM software. A total of 954 image samples in JPG format were collected, and the defects in these images were annotated using the Labeling tool. The annotated images were then randomly split into training, validation, and test sets in an 8:1:1 ratio.
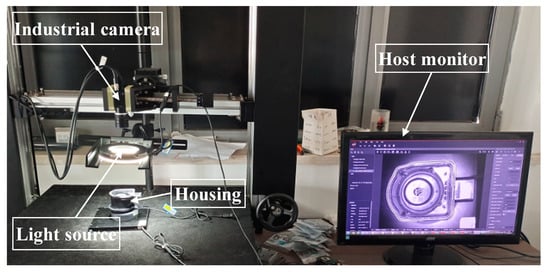
Figure 1.
Electronic water pump image acquisition device.
According to the severity of the defects, they are classified into three categories: scratches, dents, and damages, as shown in Figure 2. Scratches refer to shallow abrasions on the surface of the sealing face of the electronic water pump housing. Dents are depressions formed on the sealing surface due to compression. Damages are characterized by the partial loss of material on the surface of the sealing face.
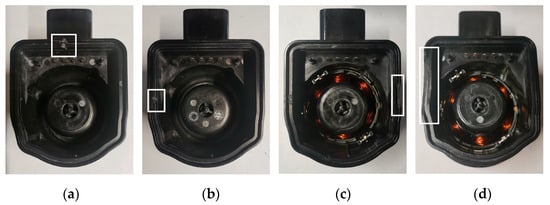
Figure 2.
Electronic water pump sealing surface defect categories diagram: (a) Scratch; (b) Dent.; (c) Minor damage; (d) Serious damage.
Scratches and dents have relatively small feature areas and can thus be regarded as small-object defects. In contrast, damages are larger in size and exhibit more diverse shapes.
An analysis of the defect characteristics of the sealing surface of the electronic water pump housing reveals significant differences in defect sizes. Damage defects are not only larger but also feature more complex shape variations. These differences increase the challenges for deep learning models in defect detection and recognition.
3.2. Design of Defect Detection Model Based on YOLOv8n
The YOLOv8 model incorporates design advantages from previous iterations [15], with its main structure consisting of four parts: image input, backbone network, neck network, and head network.
In the image input phase, YOLOv8 retains the Mosaic data augmentation strategy [16], which enhances the model’s learning ability by randomly applying transformations such as rotation, scaling, and stitching to input images. For the backbone network, YOLOv8 adopts the CSPDarkNet structure [17] and replaces the original C3 module with the C2f module, effectively reducing computational overhead. In the neck network, YOLOv8 continues to utilize the PAFPN structure, replacing the C3 modules with C2f modules to better integrate multi-scale feature maps from the backbone and neck networks, thereby enhancing feature representation capabilities. The head network draws inspiration from the decoupled head structure in YOLOX [18], employing two parallel paths to separately extract class and position features, improving the efficiency and precision of feature extraction.
In response to the defect detection requirements of the sealing surface of the electronic water pump housing in electric vehicles, as well as the shortcomings of the basic YOLOv8 detection model such as large volume and low detection accuracy, the improvement of the object detection model is studied in this paper. First, the MobileNetv3 [19] module is incorporated into the YOLOv8n structure to redesign the network, reducing computational resource consumption during feature extraction while improving detection accuracy. Next, a new CMPDual module is introduced to replace the C2f module in the neck network. This module maintains strong feature representation capabilities while reducing redundant parameters, achieving a more lightweight model. Finally, the Inner-WIoU loss function is employed to enhance the localization accuracy of bounding boxes for defect regions, addressing the shortcomings of the CIoU loss function in multi-scale detection tasks.
The proposed network model for defect detection on the sealing surfaces of electronic water pump housings is illustrated in Figure 3.
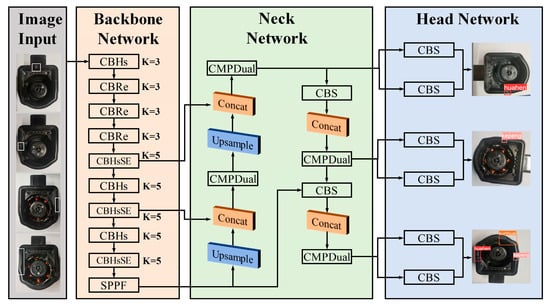
Figure 3.
Defect detection model for sealing surfaces of electronic water pump housings.
3.2.1. Design of the Backbone Network
In the defect detection of sealing surfaces for electronic water pump housings, the standard convolution used in the YOLOv8n backbone network faces two major issues. First, the standard convolution has a large number of parameters, resulting in high computational complexity for the model. Second, it is insensitive to the scale variations in defect features, making it ineffective in capturing defects of different sizes, thereby reducing the detection accuracy of the model.
To address these issues, enhance detection accuracy, and reduce the model size, this study incorporates the lightweight blocks of MobileNetv3 into the YOLOv8n backbone network. These blocks replace the CBS (Conv-BN-SiLU) and C2f modules, leading to a redesigned network structure. MobileNetv3, building on the depthwise separable convolution concept of MobileNets, splits standard convolution into depthwise and pointwise convolutions. This design significantly reduces the number of parameters and computational cost, achieving a lightweight model structure.
A comparison of the convolution kernels in depthwise separable convolution and standard convolution is illustrated in Figure 4.
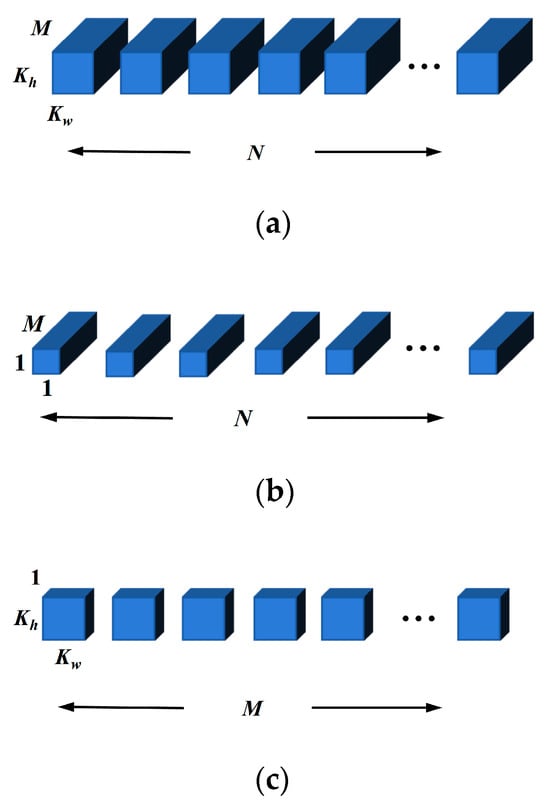
Figure 4.
Structure diagram of standard convolution and depthwise convolution kernels: (a) Standard convolution kernel; (b) Depthwise convolution kernel; (c) Pointwise convolution kernel.
Assuming the input feature map size is Wi × Hi, the number of input channels is M (representing the channels of the standard convolution kernel), the size of the convolution kernel is Kw × Kh, the size of the output feature map is Wo × Ho, and the number of output channels is N (representing the number of standard convolution kernels), the parameter count PB for a standard convolution, excluding bias parameters, can be defined as:
Unlike standard convolution, depthwise convolution assigns each kernel to a single channel, with the kernel size being Kw × Kh and the number of channels being 1. The number of kernels equals the number of input feature map channels M, and its parameter count PDC is defined as the following:
The kernel size of pointwise convolution is 1 × 1, and the number of channels equals the number of input feature map channels (M). The number of kernels equals the number of output feature map channels (N), and its parameter count PPC is defined as the following:
The parameter count P for depthwise separable convolution is defined as the following:
Compared to standard convolution, depthwise separable convolution reduces the parameter count by decreasing the number of convolution kernels. In depthwise separable convolution, depthwise convolution independently applies a convolution kernel to each input channel, allowing the model to extract spatial features of each channel more precisely. Since each kernel operates exclusively on a single input channel, it focuses on capturing local features of that channel without interference from features of other channels.
Pointwise convolution, on the other hand, is responsible for performing a linear combination of the output feature maps from the depthwise convolution, effectively fusing information across different channels. This operation not only integrates features from different channels but also enhances the network’s expressive power, enabling the model to learn richer and more complex feature combinations.
This design allows depthwise separable convolution to significantly reduce computational costs while maintaining efficient feature extraction and improving the model’s representational capacity.
The block structure of MobileNetv3 is shown in Figure 5. When the stride is 1 and the number of input channels equals the number of output channels, an inverted residual connection is used. This module begins with a 1 × 1 convolution to increase the channel dimensions without changing the feature map size, enhancing the model’s nonlinear representation capability through activation functions.
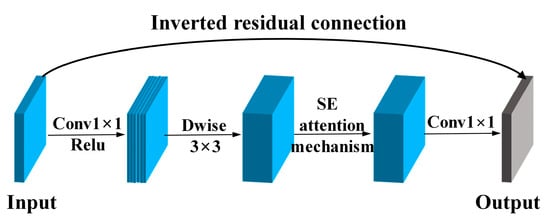
Figure 5.
MobileNetv3 network architecture diagram.
Next, the depthwise convolution is responsible for extracting spatial information from the input feature map. The SE [20] (Squeeze-and-Excitation) attention mechanism further improves the focus on key features by increasing feature interactions across channels and modeling the relationships between them.
Finally, the module reduces the channel dimensions through a 1 × 1 convolution without an activation function, performing a linear combination of channel features. This step effectively fuses features across channels, contributing to improved feature integration.
The SE module automatically learns the importance of each channel (i.e., the weights of the feature map layers) through a two-step process. First, the “Squeeze” operation compresses the spatial information of each channel into a global descriptor using global average pooling. Next, the “Excitation” operation learns the importance weights of each channel through a fully connected layer and applies these weights to the original feature map. This process highlights the features of important channels while suppressing those of less important ones, thereby enhancing the model’s representational capacity and performance. The structure of this module is shown in Figure 6.

Figure 6.
SE module structure diagram.
The workflow of the SE module is as follows. First, the input feature map is processed through the Ftr operation to generate the feature map U. Then, global average pooling Fsq (Squeeze) compresses the feature map U into a global descriptor. Next, during the Fex (Excitation) operation, two fully connected layers are used to process the vector obtained in the previous step, resulting in the weight values for each channel. Finally, the Fscale operation multiplies each channel’s weight with the corresponding channel in the feature map U, producing the weighted output.
Based on stride 1, stride 2, and the model’s validation results, the block structure of MobileNetv3 is refined into the following three types of network structure modules. Each module adopts different design strategies according to varying strides and network requirements to optimize performance and computational efficiency. The detailed structure of the modules is illustrated in Figure 7.
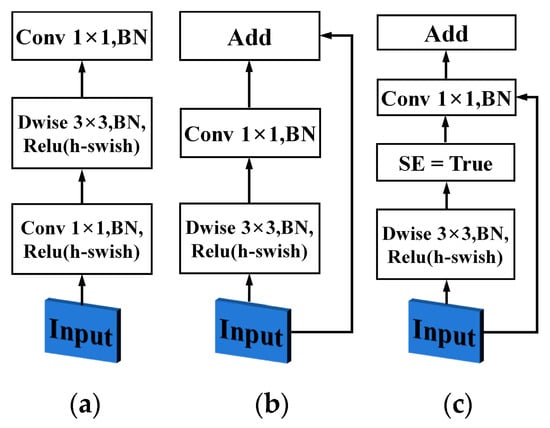
Figure 7.
Refined network modules of MobileNetv3 blocks: (a) Feature downsampling network modules; (b) Feature fusion module without SE attention mechanism; (c) Feature fusion module with SE attention mechanism.
In the backbone network structure, the network module shown in Figure 7a is used to replace the CBS module in the YOLOv8n backbone network to achieve downsampling and feature extraction. The input features first go through pointwise convolution to increase channel dimensions (with activation functions to enhance the nonlinear representation capability of the network model). Then, depthwise convolution is used to extract spatial features. Subsequently, pointwise convolution (without activation functions) performs channel dimension reduction and linear fusion of channel features, enriching the extracted feature information and facilitating its deeper propagation.
Next, the network module shown in Figure 7b replaces the C2f module in the second layer of the YOLOv8n backbone network. In this module, the input and output channel numbers remain consistent. The input features are processed by depthwise convolution to extract spatial features, followed by pointwise convolution for linear fusion of channel features. The inverted residual structure is utilized to fuse spatial features, better preserving the original input features.
Additionally, the network module shown in Figure 7c is used to replace the C2f modules in the fourth, sixth, and eighth layers of the YOLOv8n backbone network. Unlike the module in the second layer, this module introduces the SE attention mechanism, which enhances the network’s ability to represent important features by weighting channel features.
To further improve the network’s performance in multi-scale feature extraction and enhance its ability to perceive features of different sizes in images, 3 × 3 convolution kernels (K = 3) are used in the first four layers of the network, and 5 × 5 convolution kernels (K = 5) are used in the last five layers. The 3 × 3 convolution kernels are designed to capture fine details in images, while the 5 × 5 convolution kernels extract features over a larger range, providing extensive contextual information. This design helps the network learn more hierarchical features.
The detection model designed in this paper is shown in Figure 3. In the figure, CBHs (Conv-BN-Hswish) indicates that the network module of this layer consists of a convolutional layer, batch normalization layer, and H-swish [19] activation function. CBRe (Conv-BN-Relu) indicates that the network module of this layer consists of a convolutional layer, batch normalization layer, and ReLU [21,22] activation function. CBHsSE (Conv-BN-Hswish-SE) indicates that the network module of this layer consists of a convolutional layer, batch normalization layer, H-swish activation function, and SE attention mechanism. The newly designed backbone network in this paper can not only capture defect features of different sizes and improve defect detection accuracy, but also achieves a lightweight detection network model, significantly saving computational resources and improving defect detection efficiency.
3.2.2. Design of CMPDual Module
The role of the neck network is to fuse feature maps from different paths. In YOLOv8n, the neck network uses the C2f module for feature fusion. Although the C2f module improves feature extraction and information transmission efficiency through feature fusion across multiple stages, it also increases computational and parameter costs due to the repeated use of standard convolutions.
The C2f module employs a “partial connection” strategy rather than full connection, which limits its ability to fully utilize all the information from each level. As a result, while the C2f module excels in enhancing the model’s expressiveness, it inevitably adds computational burden and memory consumption. The structure of the C2f module is shown in Figure 8.
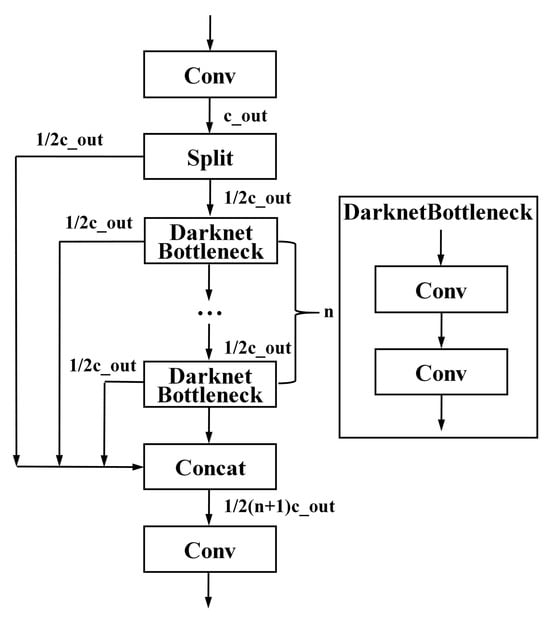
Figure 8.
C2f structural diagram.
To further improve the lightweight design and feature fusion capability of the defect detection model for the sealing surface of the electronic water pump housing, this study introduces a lightweight convolution module called DualConv [23] (Dual Kernel Convolution). The core idea is to process input feature maps using group convolution [24] and pointwise convolution in parallel. Specifically, group convolution processes a subset of the input feature maps, while the remaining subsets are processed by pointwise convolution. This approach not only better learns the original feature information but also reduces redundant parameters.
The structural diagram of the DualConv module is shown in Figure 9. In the figure, M represents the number of input channels, N the number of output channels, and g the number of convolution groups. In group convolution, the input feature channels M are divided into g groups, with each group containing M/g channels. The number of filter channels for each group is reduced to N/g. This grouping strategy significantly reduces the number of filter channels in group convolution, thereby lowering the parameter count and computational complexity. Finally, the module fuses the output features of group convolution and pointwise convolution through a concatenation operation to ensure the final output has N channels.

Figure 9.
Schematic diagram of DualConv structure.
To address the challenges posed by the significant variations in defect size and shape on the sealing surface of the electronic water pump housing, this study adopts max pooling to extract salient local features while preserving critical information across defects of different sizes and shapes. Max pooling retains the most representative parts from local regions by taking the maximum value, effectively preserving key features for larger defects and highlighting the most significant parts for smaller defects. Even for defects with varying shapes, max pooling can extract prominent features from diverse shapes, enabling the model to handle various defect forms without being influenced by specific shapes.
Based on this, the study designed the CMPDual module to replace the C2f module in the original model’s neck network. This module maintains the feature representation capability while reducing redundant parameters, thereby lowering the model’s computational complexity. The detailed structure of the module is shown in Figure 10.
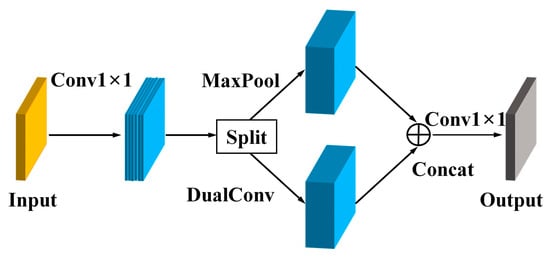
Figure 10.
Schematic diagram of CMPDual structure.
Table 1 convolution is applied to the input feature map for feature fusion, enhancing information exchange between channels while preserving the original input features, thereby supporting the extraction of effective features in subsequent layers. Next, a split operation divides the input feature map channels into two equal groups: one group is processed through the DualConv module to better extract and share feature information, while the other group is processed using MaxPool to strengthen the representation of salient features and suppress the influence of irrelevant details.

Table 1.
Ablation experiment results.
Afterward, the two groups of feature maps are concatenated through a Concat operation to integrate their respective key information. Finally, a 1 × 1 convolution is applied to fuse and transform the information across channels, enhancing the diversity and effectiveness of the feature representation.
3.2.3. Loss Function
The loss function used in YOLOv8n is CIoU [25], which measures the difference between the predicted and ground truth bounding boxes by considering their position, size, and aspect ratio. However, in actual samples of electronic water pump sealing surfaces, the defects exhibit significant variations in size and shape. CIoU tends to overly emphasize the size and shape of the bounding box, leading to excessively high loss when dealing with defects with large size differences, which in turn impacts the model’s performance.
To address this issue, this study introduces the Inner-WIoU dynamic non-monotonic FM loss function to improve the accuracy of predicted bounding boxes. The Inner-WIoU loss function is based on the WIoU [26] loss function, with the introduction of a scaling factor (Ratio) [27] to weight the IoU calculation. This modification focuses more on the core region of the object. Based on experimental validation, a Ratio value of 1.2 is chosen in this study.
Unlike CIoU, WIoU does not use aspect ratio calculations but instead evaluates the quality of the predicted bounding box using dispersion. The calculation of WIoU is as follows:
where r represents the non-monotonic aggregation coefficient and RWIoU is the distance attention mechanism between the center points of the predicted and actual bounding boxes, primarily used to amplify the LIoU of low-quality predicted boxes. LIoU, expressed as the overlap degree between the predicted and actual boxes in proportional form, is mainly used to reduce the RWIoU of high-quality predicted boxes.
In object detection, IoU is the ratio of the intersection area to the union area between the predicted bounding box and the ground truth bounding box, and its calculation is as follows:
The calculation formulas for LIoU, RWIoU, and r in the WIoU loss function are as follows:
where (x, y) and (xg, yg) represent the center coordinates of the predicted box and the ground truth box, respectively. Hg and Wg denote the height and width of the smallest enclosing box, as shown in Figure 11. In formula (8), the superscript * indicates that Hg and Wg are decoupled from the computational graph and assigned different weights to make the model focus more on the size characteristics of defects.
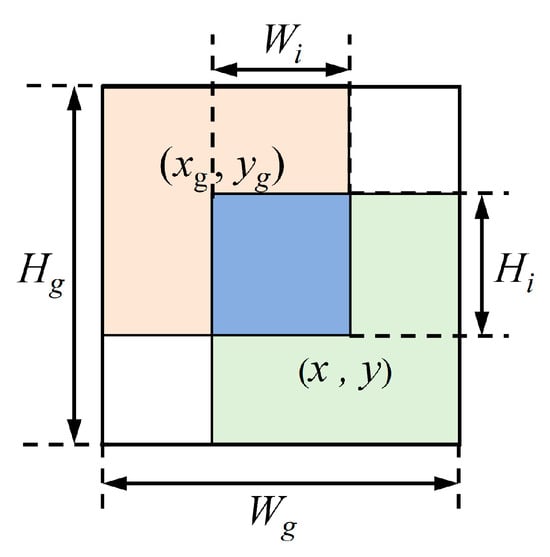
Figure 11.
The center coordinates of the predicted box and the ground truth box, as well as the smallest enclosing box.
r is a non-monotonic aggregation coefficient formed by the outlier degree β. Since LIoU is dynamic, the quality division standard for samples is also dynamic. WIoU dynamically assigns the most appropriate gradient gain based on the actual situation.
The Inner-WIoU loss function improves the calculation method of the traditional IoU loss function by introducing a weighted inner overlap region. This adjustment reduces the impact of factors such as scale differences and shape mismatches on detection accuracy, thereby improving the defect detection accuracy of the model.
4. Experimental Results and Analysis
4.1. Experimental Environment and Configuration
To validate the effectiveness of the defect detection algorithm for the sealing surface of the electronic water pump housing proposed in this study, the algorithm’s performance was tested using the PyTorch [28] deep learning framework based on Python. The experimental environment includes Python 3.8.18, PyTorch 2.1.0, and CUDA 12.3. The hardware platform runs on the Windows 11 operating system with an Intel i7-8700 CPU.
In the defect detection model used in this study, the input image size was uniformly adjusted to 640 × 640 pixels. Data augmentation techniques, such as random cropping, random rotation, and horizontal flipping, were employed to enhance the model’s robustness and generalization ability. The batch size was set to 8, the learning rate to 0.01, and the Adam optimizer was used. Both training and testing of the model were conducted on a GPU to accelerate the computation process and improve training efficiency.
4.2. Evaluation Metrics
In defect detection tasks, to verify that the network model exhibits good performance, the following metrics are used to evaluate the network’s performance: Precision (Pr) and Recall (Re). Their calculation formulas are as follows:
In the formulas, TP represents the number of true positive samples (correctly predicted positive samples), FP represents the number of false positive samples (incorrectly predicted positive samples), and FN represents the number of false negative samples (missed positive samples).
AP (Average Precision) integrates precision and recall, calculating the average value of the precision–recall relationship for a single category. mAP (mean Average Precision) is the average of AP values across all categories in a multi-class detection task. The mAP calculation formula is as follows:
where N is the total number of categories.
4.3. Ablation Study
To verify the effectiveness of different modules in the defect feature detection task for the sealing surface of the electronic water pump housing, the lightweight backbone network, CMPDual module, and the introduced Inner-WIoU loss function were validated in the ablation experiments using a stepwise addition method. Training was conducted on the dataset established in this study. The runtime environment of the network model is described in Section 4.1.
The evaluation metrics include model weights, floating-point operations (FLOPs), precision, and mean Average Precision at a threshold of 0.5 (mAP@0.5). In the table, “√” indicates the use of the corresponding module. The results of the ablation experiments are shown in Table 1.
From Table 1, it can be observed that compared to the YOLOv8n model, the proposed model reduces weights by 61.9%, decreases computational cost by 58%, improves detection precision by 9.4%, and increases mAP@0.5 by 6.9%. After redesigning the backbone network, the weight size is reduced by 58.73%, the number of floating-point operations decreases by 55.55%, precision improves by 4.6%, and mAP@0.5 increases by 3.1%. This validates the finding that that the newly designed backbone network can significantly reduce the parameters and computational cost of the model, achieving a lightweight design while improving detection precision. Therefore, the backbone network designed in this study is suitable for defect detection on the sealing surface of electronic water pump housings.
On this basis, to further optimize the network architecture and reduce redundant parameters, the CMPDual module was designed to replace the C2f module in the neck network, thereby achieving a lightweight network. This module effectively reduces redundant parameters, bringing the weight size down to 2.4 MB and the number of floating-point operations to 3.4 GB. Although this improvement stabilizes the detection precision of the model, mAP@0.5 decreases slightly by 0.5%. This is because the lightweight model may experience a slight loss in bounding box localization precision, leading to a reduced IoU, which affects the mAP@0.5 calculation.
Finally, the Inner-WIoU loss function was introduced. The WIoU loss function better focuses on the size of defect features, enhancing the localization precision of predicted bounding boxes. Additionally, the use of the scaling factor ratio adjusts auxiliary bounding boxes of different scales, allowing the model to focus more effectively on defect feature regions, thereby improving detection precision.
The P–R curve results of the YOLOv8n model and the proposed model are shown in Figure 12. The horizontal axis represents the recall (R), and the vertical axis represents the precision (P). From the P–R curve results of the YOLOv8n model and the proposed model, it can be observed that the overall detection precision of the proposed model improves by 6.9%. The detection precision for scratches, dents, and damage improves by 5.7%, 4.4%, and 10.6%, respectively. This demonstrates that the proposed model performs better in balancing precision and recall.
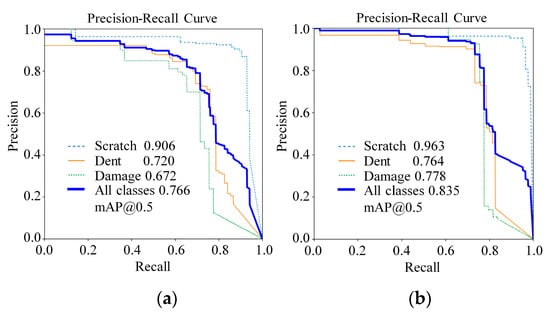
Figure 12.
P–R curve chart of YOLOv8n model and the proposed model: (a) P–R results of the YOLOv8n model; (b) P–R results of the proposed model in the study.
4.4. Comparison Experiment of Different Loss Functions
To evaluate the impact of different IoU loss functions on the defect detection performance of the sealing surface of electronic water pump housings, a comparison experiment of various IoU loss functions was conducted. All experiments were trained and tested on the dataset established in this study, and the results are shown in Table 2.

Table 2.
Comparison experiment of different loss functions.
As observed from the data, these loss functions did not significantly affect the model’s weight size or computational cost. In the experiments, the proposed model was compared using different loss functions, including SIoU [29], EIoU [30], WIoU, Inner-SIoU, Inner-EIoU, and Inner-WIoU. While there were variations in detection precision across different loss functions, models trained with SIoU and Inner-EIoU achieved lower precision on the test set compared to the baseline model. Conversely, models trained with other loss functions outperformed the baseline model on the test set.
Overall, all loss functions effectively improved mAP@0.5, with the Inner-WIoU loss function showing the most significant improvement. In summary, the proposed network model achieved the best detection performance on the test set when using the Inner-WIoU loss function.
4.5. Comparison Experiment of Different Models
To validate the superior performance of the proposed model in defect detection on the sealing surface of electronic pump housings, its test results were compared with those of mainstream models currently in use. The comparison included performance metrics such as weight size, computational cost, accuracy, and mAP@0.5. The results are shown in Table 3.

Table 3.
Experimental results of different model comparisons.
As shown in Table 3, compared with other algorithms, the proposed model achieves the smallest weight size and computational cost, with an average improvement of 6.9% in detection accuracy and 8.6% in mAP@0.5. Models such as SSD, YOLOv7-tiny, and YOLOv8n have larger weight files and lower mAP@0.5 values. Among them, SSD has a computational cost as high as 30.4 G, indicating its high resource consumption when handling complex tasks.
Although YOLOv5s demonstrates better overall performance in terms of weight file size, floating-point operations, detection accuracy, and mAP@0.5 compared to other models, its network architecture still has room for optimization. Compared with YOLOv7-tiny, the proposed model improves detection accuracy by 3.6% and mAP@0.5 by 5.7%, showing that it not only maintains high efficiency but also significantly reduces computational overhead and storage requirements, thereby enhancing detection efficiency.
Through comparative analysis, it is evident that the proposed model outperforms other mainstream models across all performance metrics. It not only has smaller weight files and lower computational cost, but also achieves higher detection accuracy, validating its superior performance in defect detection on the sealing surface of electronic water pump housings.
4.6. Analysis of Defect Detection Results
From the comparative experimental results of different models, it is evident that the proposed model demonstrates the highest accuracy, being able to correctly identify and classify defects in most samples, showcasing strong generalization capability. Additionally, the model achieves the highest mAP@0.5 value, indicating that it performs well in detecting multiple categories of defects, especially in accurately identifying defect regions and determining defect types.
To provide a more intuitive comparison of the performance of various detection models in defect detection for the sealing surface of electronic pump housings, models with relatively high detection accuracy, including YOLOv5s, YOLOv7-tiny, YOLOv8n, and the proposed model, were selected to display detection results for some defects, as shown in Figure 13.
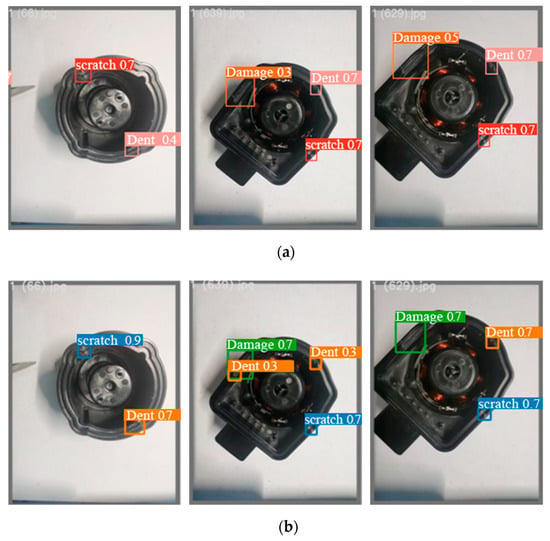
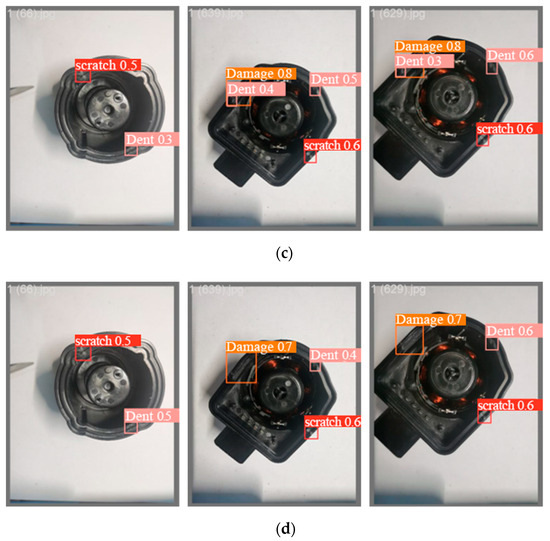
Figure 13.
Illustration of defect detection results for each model: (a) Defect detection results of the YOLOv5s model; (b) Defect detection results of the YOLOv7-tiny model; (c) Defect detection results of the YOLOv8n model; (d) Defect detection results of the proposed model.
From the figure, it can be observed that the YOLOv5s model exhibits high detection accuracy for small targets such as scratches and dents. However, its detection accuracy decreases for damage defects with significant size variations and irregular shapes, indicating that the YOLOv5s model is more sensitive to small targets but less adaptive to larger targets. The main reason for this phenomenon may lie in YOLOv5s using anchor boxes to predict object boundaries, making it perform poorly when handling defects with large size variations.
The YOLOv7-tiny model shows certain advantages in detecting both small targets like scratches and dents and damage defects with significant size variations and irregular shapes. However, it has some errors in category recognition. YOLOv7-tiny is a lightweight version designed to reduce computational resources and parameter sizes, which may result in a lack of sufficient distinction for defect detection on the sealing surface of electronic pump housings.
Compared with YOLOv5s and YOLOv7-tiny models, the YOLOv8n model shows certain shortcomings in defect category recognition and detection accuracy for electronic pump housing sealing surface defects.
In contrast, the proposed model achieves improvements in both category recognition and detection accuracy, demonstrating higher accuracy in detecting most defects. Nonetheless, there is still room for improvement in the precision of bounding boxes for small targets like scratches and dents.
5. Conclusions
To address the challenges posed by the large size variations and irregular shapes of defects on the sealing surface of electronic pump housings in electric vehicles, as well as the limitations of existing detection models such as large model size and low detection accuracy, this study proposed a defect detection network model for this specific application based on YOLOv8n. The following conclusions can be drawn from numerical testing and analysis:
- To address the shortcomings of deep learning models, such as large size and low detection accuracy, this study introduces the lightweight MobileNetV3 module and redesigns the backbone network structure, effectively reducing the model’s parameters and computational cost. In feature fusion, the inverted residual structure is used to better retain low-level feature information, enhancing the model’s feature extraction capability. Additionally, the network model adopts convolution kernels of different sizes, using 3 × 3 kernels to effectively extract detailed features and 5 × 5 kernels to capture broader contextual information. This allows the network to extract multi-level information at multiple scales, enabling improved defect category recognition accuracy and detection precision even with a lightweight design.
- To reduce redundant parameters and further optimize the model, this study introduces the DualConv convolution and redesigns the lightweight CMPDual module to replace the C2f module in the neck network. By using this module, the model’s parameter size and computational cost are reduced by 0.2 MB and 0.2 GB, respectively, effectively eliminating redundant parameters and achieving a lightweight model design.
- To address the challenges of large size variations and shape irregularities in defects on the sealing surfaces of electronic pump housings, this study adopts the Inner-WIoU loss function to replace the traditional CIoU loss function. Compared to CIoU, the WIoU loss function places greater emphasis on the relative position and size matching between the predicted and ground truth boxes. Additionally, a scale factor is introduced in the WIoU loss function to adjust loss calculations based on the size of different targets, enabling faster network convergence and improving the localization accuracy of the predicted boxes.
In summary, the network model designed in this study demonstrates excellent performance in defect detection across different scales while maintaining a lightweight design, thereby validating its effectiveness and superiority. In future, the research team will continue to optimize the network structure, enhance its resolution, discrimination capability, and detection accuracy, and further reduce the hardware requirements. These efforts aim to better advance the development of defect detection technology for electronic pump housing sealing surfaces.
Author Contributions
Methodology, L.S. and Y.S.; validation, L.S., J.L. and M.Y.; original draft preparation, L.S., Y.S. and X.B.; writing, L.S. and W.J. All authors have read and agreed to the published version of the manuscript.
Funding
This research was funded by the Natural Science Foundation of Jiangsu Province, China (BK20201002), and 2024 Industry-University-Research Pre-research Fund Project of Zhangjiagang City (ZKYY2427).
Data Availability Statement
Data are contained within the article.
Conflicts of Interest
The authors declare no conflicts of interest.
References
- Chen, Y.H.; He, L.J. Analysis on thermal management technology of new energy Vehicle power battery. Auto Time 2023, 19, 76–78. [Google Scholar] [CrossRef]
- Yang, X.G.; Lou, H.Y.; Zhang, M. Design of cooling water channels for electric vehicle motors. Agric. Equip. Veh. Eng. 2024, 62, 132–137. [Google Scholar] [CrossRef]
- Zhu, B.; Zhou, Y.F.; Yao, M.Y. Research on pump control strategy of battery thermal management system for electric Vehicle. Automot. Appl. Technol. 2023, 48, 1–8. [Google Scholar] [CrossRef]
- Elizar, E.; Zulkifley, M.A.; Muharar, R.; Zaman, M.H.M.; Mustaza, S.M. A review on multiscale-deep-learning application. Sensors 2022, 22, 7384. [Google Scholar] [CrossRef]
- Jiao, L.C.; Zhao, J. A survey on the new generation of deep learning in image processing. IEEE Access 2019, 7, 172231–172263. [Google Scholar] [CrossRef]
- Gu, P.; Lan, X.S.; Li, S.X. Object detection combining CNN and adaptive coloe prior features. Sensors 2021, 21, 2796. [Google Scholar] [CrossRef] [PubMed]
- Zhu, Y.; Xia, Q.Y.; Jin, W. SRDD: A lightweight end-to-end object detection with transformer. Connect. Sci. 2022, 34, 2448–2465. [Google Scholar] [CrossRef]
- Joseph, R.; Santosh, D.; Ross, G. You Only Look Once: Unified real-time object detection. In Proceedings of the IEEE Conference on Computer Vision and Pattern Recongnition, Las Vegas, NV, USA, 26 June–1 July 2016; pp. 779–788. [Google Scholar] [CrossRef]
- He, K.; Gkioxari, G.; Dollár, P.; Girshick, R. Mask R-CNN. IEEE Trans. Pattern Anal. Mach. Intell. 2020, 42, 386–397. [Google Scholar] [CrossRef]
- Wang, Y.C.; Feng, X.H.; Shi, P.F. Research on defect detection system for injection parts based on Machine vision. Control. Instrum. Chem. Ind. 2024, 51, 113–119. [Google Scholar] [CrossRef]
- Xie, D.; He, F.Q.; He, H. Surface defects detection of wiper based on machine vision. Comput. Digit. Eng. 2024, 52, 1221–1227. [Google Scholar] [CrossRef]
- Li, Q.; Shi, Y.; Fan, T. Research on O-ring surface defect detection algorithm based on improved YOLOv8n. Comput. Eng. Appl. 2024, 60, 126–135. [Google Scholar] [CrossRef]
- Shan, M.T.; Gao, W.W. Improved YOLOv4’s algorithm for detecting defects on the sealing surface of inner wire joints. J. Electron. Meas. Instrum. 2022, 36, 120–127. [Google Scholar] [CrossRef]
- Wang, C.J.; Sun, Q.B.; Dong, X.G. Automotive adhesive defect detection based on improved YOLOv8. Signal Image Video Process. 2024, 18, 2583–2595. [Google Scholar] [CrossRef]
- Liu, F.C.; Zhang, J.; Xue, T. YOLO-VDCW: A new surface defect detection algorithm for lightweight strip steel. China Metall. 2024, 34, 125–135. [Google Scholar] [CrossRef]
- Tan, X.; Zhao, J. Enhancing YOLOv8 for improved instance segmentation of automotive surface damage. Comput. Eng. Appl. 2024, 60, 197–208. [Google Scholar] [CrossRef]
- Bochkovskiy, A.; Wang, C.Y.; Liao, H.Y. YOLOv4: Optimal speed and accuracy of object detection. arXiv 2020, arXiv:2004.10934. [Google Scholar] [CrossRef]
- Ge, Z.; Liu, S.T.; Wang, F. YOLOX: Exceeding YOLO series in 2021. arXiv 2021, arXiv:2107.08430. [Google Scholar] [CrossRef]
- Howard, A.; Sandler, M.; Chu, G. Searching for MoblieNetV3. In Proceedings of the IEEE/CVF Internation Conference on Computer Vision, Seoul, Republic of Korea, 27 October–20 November 2019; pp. 1314–1324. [Google Scholar] [CrossRef]
- Hu, J.; Shen, L.; Albanie, S. Squeeze-and-Excitation networks. IEEE Trans. Pattern Anal. Mach. Intell. 2020, 42, 2011–2023. [Google Scholar] [CrossRef] [PubMed]
- Liu, A.L.; Chen, Z.X. Construction and approximation of ReLU activation function deep network. J. Shaoxing Univ. 2024, 44, 58–68. [Google Scholar] [CrossRef]
- Liu, X.; Wang, D. Universal consistency of deep ReLU neural networks (in China). Sci. Sin. Inform. 2024, 54, 638–652. [Google Scholar] [CrossRef]
- Zhong, J.C.; Chen, J.Y.; Mian, A. DualConv: Dual convolutional kernels for Lightweight deep neural networks. IEEE Trans. Neural Netw. Learn. Syst. 2023, 34, 9528–9535. [Google Scholar] [CrossRef] [PubMed]
- Gibson, P.; Cano, J.E.; Turner, J. Optimizing grouped convolutions on edge devices. In Proceedings of the IEEE International Conference on Application-Specific Systems, Manchester, UK, 6–8 July 2020; pp. 189–196. [Google Scholar] [CrossRef]
- Zheng, Z.H.; Wang, P.; Ren, D.W. Enhancing geometric factors in model learning and inference for object detection and instance segmentation. IEEE Trans. Cybern. 2022, 52, 8574–8586. [Google Scholar] [CrossRef] [PubMed]
- Wu, J.T.; Dai, G.J.; Zhou, W.H. Multi-scale feature fusion with attention mechanism for crowded road object detection. J. Real Time Image Process. 2024, 21, 29. [Google Scholar] [CrossRef]
- Zhang, T.; Pan, P.F.; Zhang, J. Steel surface defect detection algorithm based on improved YOLOv8n. Appl. Sci. 2024, 14, 5325. [Google Scholar] [CrossRef]
- Paszke, A.; Gross, S.; Massa, F. Pytorch: An imperative style, high-performance deep learning Library. In Proceedings of the Neural Information Processing Systems, Vancouver, BC, Canada, 8–14 December 2019; pp. 70–78. [Google Scholar] [CrossRef]
- Du, S.J.; Zhang, B.F.; Zhang, P. Scale-Sensitive IoU loss: An improved regression loss function in remote sensing object detection. IEEE Access 2021, 9, 141258–141272. [Google Scholar] [CrossRef]
- Zhang, Y.F.; Ren, W.Q.; Zhang, Z. Focal and efficient IOU loss for accurate bounding box regression. Neurocomputing 2022, 506, 146–157. [Google Scholar] [CrossRef]
Disclaimer/Publisher’s Note: The statements, opinions and data contained in all publications are solely those of the individual author(s) and contributor(s) and not of MDPI and/or the editor(s). MDPI and/or the editor(s) disclaim responsibility for any injury to people or property resulting from any ideas, methods, instructions or products referred to in the content. |
© 2025 by the authors. Licensee MDPI, Basel, Switzerland. This article is an open access article distributed under the terms and conditions of the Creative Commons Attribution (CC BY) license (https://creativecommons.org/licenses/by/4.0/).