Article

Multi-Objective Site Selection and Capacity Determination of Distribution Network Considering New Energy Uncertainties and Shared Energy Storage of Electric Vehicles

by
Guodong Wang
1,
Haiyang Li
1,
Xiao Yang
1,
Huayong Lu
1,
Xiao Song
2,
Zheng Li
2 and
Yi Wang
3,*
1
State Grid Henan Electric Power Company, Zhengzhou 450018, China
2
State Grid Jiaozuo Electric Power Supply Company, Jiaozuo 454003, China
3
School of Electrical and Information Engineering, Zhengzhou University, Zhengzhou 450001, China
*
Author to whom correspondence should be addressed.
Electronics 2025, 14(1), 151; https://doi.org/10.3390/electronics14010151
Submission received: 5 December 2024 / Revised: 28 December 2024 / Accepted: 31 December 2024 / Published: 2 January 2025

Abstract

:
In recent years, the share of renewable energy in the distribution network has been increasing. To deal with high renewable energy penetration, it is important to improve the energy efficiency and stability of the distribution network. In this paper, the optimal configuration of a distribution network with a high proportion of new energy and electric vehicles is investigated. Firstly, based on the copula theory, the clustered new energy data are obtained by optimizing the wind and solar output scenarios. Secondly, the uncertainty of renewable energy output is fully considered in the planning stage of the distribution network. Subsequently, an improved multi-objective particle swarm optimization algorithm is adopted to determine the optimal capacity and location of charging stations. Finally, the IEEE 33-node distribution network is used for case analysis. Through the comparison of network loss, voltage change, and other related parameters, the advantages of shared energy storage characteristics of electric vehicles in smoothing the uncertainty of the high proportion of new energy are verified.

1. Introduction

With the increasing proportion of distributed generation (DG) involved in the active distribution network (ADN) at the power supply end, the load peak-to-valley difference of each node is increasing. An advanced distribution network has the ability to combine and control various distributed energy resources (distributed power, controllable load, energy storage, demand-side management, etc.). At the same time, the uncertainty of DG output increases the risks and challenges of ADN optimal scheduling. The potential risk can be reduced as much as possible by predicting the output of DG. In addition, the utilization of electric vehicle (EVs) as energy storage devices can suppress the impact of the voltage and load fluctuations of ADN to a certain extent. Therefore, the topics of multi-objective site selection and the capacity determination of ADN with new energy and shared energy storage in EVs are worthy of further study.
DG owns an inexhaustible nature, is absent of carbon emissions, and has been widely used in ADNs in recent years [1,2,3]. However, compared with the characteristics of stable output of traditional energy sources such as coal, the output of DG is highly uncertain due to the influence of various factors [4,5,6]. Since DG can help ADNs to deal with the problem of supply and demand imbalance, some scholars have conducted research on the combination of ADNs with DG and added DG to nodes with insufficient loads in ADNs [7,8]. Considering the security risks and frequency modulation performance of DG, a multi-timescale scheduling strategy was designed and investigated in references [9,10,11]. In references [12,13], in order to deal with the issue of DG output uncertainty, the typical scenario of wind speed was investigated by combining the Elbow method with the K-means clustering algorithm. In references [14,15], the SVG equipment is used to dynamically regulate voltage to deal with reactive power programming problems under large-scale DG. Reference [16] analyzes the correlation between wind turbines and photovoltaic equipment, where a two-layer opportunity constraint model was established with the optimal power flow as the optimization goal. Undoubtedly, the above methods have played a positive role in improving the stability of the new energy distribution network. However, most of above studies do not take into account the influence of the uncertain output prediction of new energy, or the siting and capacity determination of energy storage devices, in stabilizing DG output fluctuations.
With the increasing proportion of new energy in ADN systems, the fluctuation uncertainty of DG output brings the problems of load-side power balance and new energy curtailment to the system. By strengthening the nonlinear rules of input DG data, reference [17] further improved the prediction accuracy of DG output. In reference [18], a wind and solar output scenario model considering K-means clustering was established for systematic planning research. Based on this, it was noticed that energy storage devices have the effect of stabilizing DG output. With the continuous increase of EV ownership, the role of energy storage devices based on the dispatchable potential of EV clusters is prominent. In reference [19], a potential model of EV cluster schedulable was established to assist ADNs in achieving peak and frequency regulation. In 4eference [20], to reduce the operating cost of the system, a bidding model for charging stations was constructed to fully tap the dispatchable potential of EV clusters. In reference [21], the EV cluster was utilized as the energy storage devices to participate in the ADN scheduling process. However, due to the output uncertainty of the EV cluster, it was necessary to further process the output of the EV cluster.
Based on the above discussion, it can be observed that most existing studies only consider the influence of the location of distributed power supply on the active distribution network system. Regarding how to reduce the influence of DG, the existing literature mainly deals with the addition of energy storage devices, which does not consider the uncertainty of DG. As an emerging unit of energy use, electric vehicles can also play the role of mobile energy storage, which can provide maximum flexibility and reduce costs compared to traditional energy storage components. In addition, the electric vehicle group has a relatively clear time pattern, which is consistent with the output of wind turbines and photovoltaic cells. Therefore, the questions of how to analyze the impact of electric vehicle integration on ADNs and then smooth the uncertainty of DG through electric vehicles are worthy of further study.
To deal with these issues, in this paper, we propose a novel multi-objective site selection and capacity determination of distribution networks considering new energy uncertainties and the shared energy storage of electric vehicles. Firstly, based on the kernel density estimation and Frank copula function, the wind and solar output scenarios are generated to reduce the influence of DG uncertainty. Secondly, the CNN-BiLSTM method is used to process the data of EV clusters. Subsequently, a multi-objective site selection and capacity determination model is established for EV charging stations based on the dispatchable potential of EV clusters. Then, the multi-objective particle swarm optimizer (MOPSO) is used to optimize the vulnerability, network loss, and optimal capacity of the energy storage of ADN. Finally, the effectiveness and advantages of the proposed method are verified by extensive tests under different scenarios.
The rest of this paper is organized as follows: In Section 2, the scheduling model of ADNs is established. In Section 3, the DG output prediction model is developed, which includes DG and copula functions. Then, Section 4 describes the model of EV cluster scheduling. Subsequently, Section 5 presents extensive test results under various situations. Finally, conclusions are drawn and future work suggestions are proposed in Section 6.

2. ADN Scheduling Model Considering Multi-Objective Optimization

Due to the large number of parameters in the ADN model compared with the traditional research scheme that takes a single variable as the target for optimization, this paper considers the multi-objective optimization algorithm to reflect the specific situation of ADNs more reasonably.
The access of DG will have a significant impact on the voltage stability, network loss, and power quality of ADNs. The changes in power quality will directly affect the stability of the system voltage, which in turn will exacerbate the fluctuation of load [22,23,24]. Energy storage and other devices can stabilize the influence of DG by adjusting their own output when DG’s output fluctuates to achieve the purpose of peak shaving and valley filling. However, the upfront investment of energy storage equipment in the early planning stage of ADNs is expensive. Therefore, the question of how to plan the location of energy storage is an urgent problem to be solved. To deal with the issue, this paper establishes an ADN multi-objective optimal scheduling model for node voltage fluctuations and network losses, with an optimal energy storage device capacity as the goal.
(1)
Node voltage fluctuation: According to Reference [10], voltage stability is an important indicator of power system stability. The access of DG will influence the node voltage of system by affecting the balance of reactive power. In this paper, the sum of node voltage fluctuations is selected as the objective f 1 , which is expressed in Equation (1):
f 1 = i = 1 N b u s j = 1 T | V i j V i ¯ | ,
where N b u s represents the total number of nodes; T stands for 24 h; V i j is the voltage between the nodes; and V i ¯ denotes the standard voltage.
(2)
Network loss: After large-scale DG is connected, the reactive power of the power system may be insufficient. If the access location of the DG is far away from the main line of the ADN, the electrical distance will increase, which in turn leads to an increase in the network loss of system. The objective function f 2 represents the sum of the network losses of the ADN system, which can be expressed as Equation (2)
f 2 = c l o s s t = 1 T i j E l i n e I i j , t 2 r i j ,
where c l o s s denotes the unit network loss cost; E l i n e represents the set of branches in the ADN; I i j , t means the branch current; and r i j indicates the branch resistance.
(3)
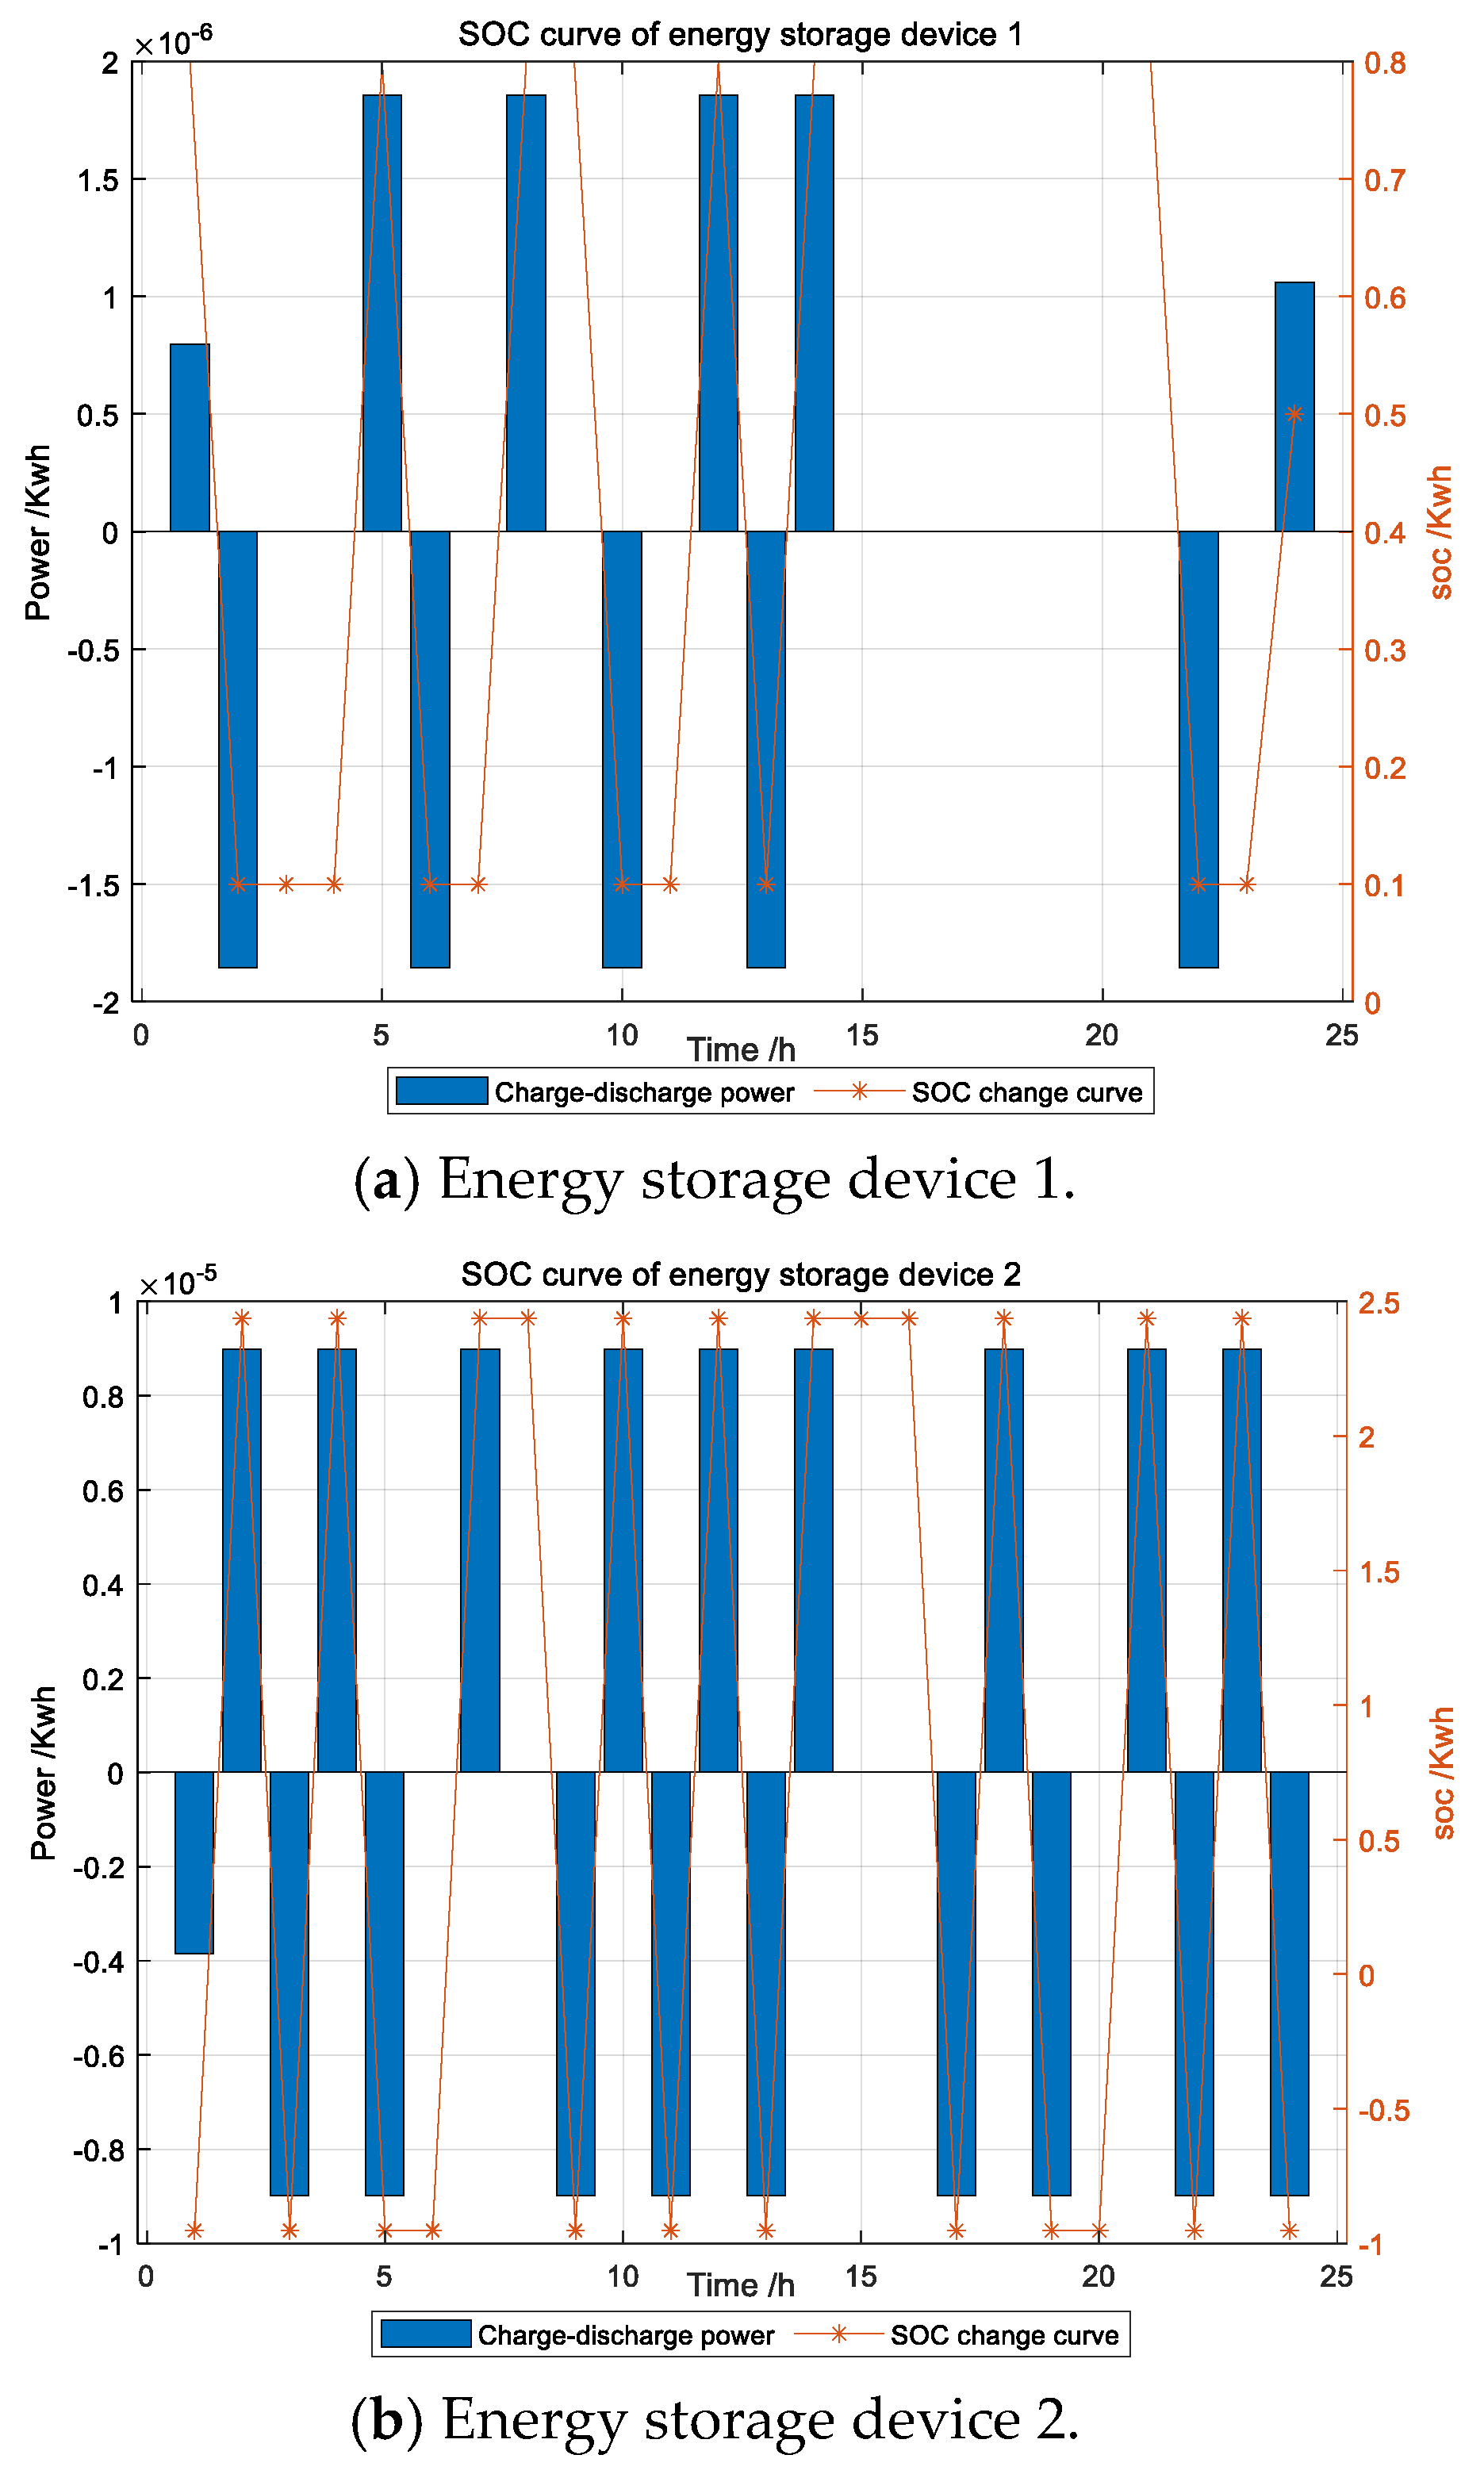
Energy storage system capacity: In the early construction stage of ADN, to avoid the large investment and the low utilization rate of energy storage capacity, the capacity allocation of the energy storage device should be considered in advance based on its economic benefits. Therefore, the total capacity of the energy storage device is selected as the objective function. Based on this, the cost, contribution to network loss, and voltage stability can be balanced by a multi-objective algorithm. f 3 is the objective function of the optimal capacity of the energy storage system, which is presented in Equation (3)
f 3 = j = 1 2 i j E l i n e t 0 + n Δ t P c h a ( j ) / P d i s ( j ) Δ t ,
where t 0 denotes the time when charging starts; P c h a / d i s represents the charging and discharging power; and Δ t indicates the charging and discharging time of the energy storage device.
When determining the location and capacity of EV charging stations in ADN, it is necessary to optimize the location and power of EV charging stations. In addition, the network loss and node voltage fluctuation of ADNs should be also taken into account. Then, an ADN model with multi-objective optimization is established.

3. DG Output Prediction Model

In recent years, the number of wind turbines and photovoltaic units operated by ADN systems increased [25]. Although the addition of DG can reduce the output of gas units in the system and thus reduce the carbon emissions of the system, the impact of the fluctuation of DG output on ADNs cannot be ignored [26]. In order to reduce the adverse impact of DG output uncertainty, the influence of randomness and correlation of DG should be considered before it is put into ADNs [27].
At present, some scholars have studied the randomness of the output of wind turbines and photovoltaic units. There are mainly two schemes to deal with the issue: (1) assuming that the wind speed obeys the Weibull distribution and the light intensity obeys the Beta distribution, then the historical results can be utilized to obtain the estimation of wind speed and light intensity. However, this scheme only carries out reliability evaluation and analysis, which cannot be applied to calculate the annual cost because it ignores the time scale of DG data. (2) Based on the day-ahead output prediction data of wind speed and light intensity, the stochastic analysis of wind speed and photovoltaic power is realized by the error sampling of the data. However, the prediction limitations of this scheme are obvious; further processing is needed for the predicted steps.
Firstly, the non-parametric kernel density estimation method is used to fit the historical data of DG, and the kernel density estimation expressions of wind turbines and photovoltaic units are obtained, which can be expressed as follows:
f ^ ( x ) = 1 n h t = i T K ( x X i h ) ,
Equation (4) represents the specific process of WT and PV generation, where n is the sample size; h is the width of the window; K (·) is a kernel function; x is the output of hourly PV/WT; and X i denotes the output of hourly PV/WT of the i -th day. This method does not need to assume the distribution of historical data, and its advantage is that the output data of DG units can be directly processed to obtain the output probability density function of DG units in each period of the day.
Then, the optimal copula joint probability distribution was used to generate the annual output scenarios of wind turbines and photovoltaic units. Due to the large number of types of copula functions, it is necessary to distinguish and select the goodness of fit according to the actual situation of the model. Since the output of DG usually has a negative correlation and complementarity, the Frank copula function is selected to describe the wind–solar correlation. The Frank copula function is an improvement on the copula function. Frank copula can work with both non-negative and negative correlations of variables [28]. In general, the joint probability of a wind scene can be expressed as follows:
F n ( x i , y i ) = C ( F X i ( x i ) , F Y i ( y i ) ) ,
Equation (5) represents the probability function of the joint output of the wind and solar; Where C (·) denotes a copula connection function; F X i ( x i ) , F Y i ( y i ) are the probability functions for wind turbines and photovoltaics, respectively. The specific process of the Frank copula function is shown in Figure 1.
After that, the Frank copula function of each period is sampled. Then, the output of each period can be calculated according to the joint probability distribution function of sampling results and DG output. Finally, a typical daily curve is generated considering DG correlation and randomness.

4. Exploration of Schedulable Potential of EV Fleets

In this subsection, the shared energy storage characteristics of EV clusters are taken into account [29]. At first, the data processing method for EV clusters is developed. Then, the schedulable potential model for EV clusters is established.

4.1. Data Processing Process of EV Cluster

Via the cluster processing of electric vehicles, the prediction error can be significantly eliminated. However, the historical data bias of EVs is still one of the reasons for the error. To deal with this issue, a method to process the historical data of EV clusters is developed by combing the convolutional neural networks (CNNs) with bi-directional long short-term memory (Bi-LSTM), which can effectively its error. CNN processes the initial data through local connection and weight sharing, which effectively reflects the data characteristics. At the same time, the number of parameters in the training process is greatly reduced, which is convenient for extracting the feature information of the data [30]. A schematic diagram of the CNN process is shown in Figure 2.
Compared with traditional LSTM, Bi-LSTM displays a reverse LSTM process, which can better connect historical data with future data [17]. CNN-Bi-LSTM can further explore the relationship between the current data and the data at each time point to improve the prediction accuracy. After knowing the maximum charge/discharge power of EVs and the historical data of SOC, the data are divided into training groups and test groups. Firstly, the data of the training group were used to explore the internal connection, and secondly, the data of the test group were used to verify the accuracy. The schematic diagram of the Bi-LSTM method is shown in Figure 3.

4.2. Establishment of the Schedulable Potential Model for EV Clusters

Compared with a single-EV model, the multi-type EV cluster model in an electric vehicle station (EVS) can better reflect the state of the actual EV. Assuming that each type of EV has a fixed arrival and departure time T arrive / T l e a v e and state of charge (SOC) S 0 , a potential energy storage model for EVS cluster dispatchable can be established. The SOC constraints and charge–discharge power constraints of an EV can be expressed as [31,32] follows:
S t EVS = S t 1 EVS + i = 1 T n = 1 N η P c h a i = 1 T n = 1 N P d i s η ,
S T EVS = S exp EVS ,
S min EVS S t EVS S max EVS ,
0 P c h a P c h a , max 0 P d i s P d i s , max ,
Equation (6) represents the total SOC of the EV in the charging station. The charging and discharging status of the EV is determined using historical data. Equation (7) represents the expected SOC of the EVS. Equation (8) denotes the upper and lower limits of the SOC allowed by EVS. Equation (9) indicates the upper and lower limits of EVS charge and discharge power. Here, S t EVS indicates the power level of the EVS at time t ; N denotes the total number of EVs; η means the charge–discharge efficiency; P c h a represents the charging power; P d i s represents the discharging power; S exp EVS is the expected amount of power; S min EVS and S max EVS are the allowable scope of SOC; and P c h a , max and P d i s , max are the allowable range of charge and discharge power, respectively [33].

5. Case Analysis

In this paper, the IEEE33-node ADN system is used for scenario analysis, and the detailed parameters are shown in Reference [18]. The total load is 3715 kw + j2300 kvar, and the rated voltage of the system is 12.66 kV. The flowchart of the algorithm in this paper is shown in Figure A1 of the Appendix A.
In the example of this study, the wind turbines are installed at nodes 20 and 14, and the photovoltaic units are installed at nodes 9 and 30. The Frank copula function is used to predict the historical data of wind and solar output, and the typical sunrise force curves of the two are extracted, as shown in Figure 1. The number of system nodes that can connect to EVS energy storage ranges from 2 to 33, the maximum number of nodes that can be connected to EVS is 2, and the maximum installed power is 400 kW.
Firstly, the scenario generation of wind turbine PV and the data of EV cluster are processed [30,34,35]. The DG output probability density curve obtained from the Frank copula function is shown in Figure 4 and Figure 5. Based on the DG output prediction model established in Section 3, 500 wind–solar complementary scenarios are generated. Then, the generated new energy output scenarios can be reduced, and the corresponding probability of each scenario can be calculated.
According to Figure 4 and Figure 5, it can be seen that the results generated by the DG scenario can more accurately generate the randomness and correlation of the DG unit output in the selected area. The DG data processed through the above data are conducive to the overall planning of the ADN system in the early stage of construction, and further improve the operational reliability of the AND system.
As can be seen from Figure 6, after using the CNN-BiLSTM model to mine and predict the rules of the historical data of EV clusters, the accuracy is improved to be higher than that of the non-predicted scenario and other initial algorithms, which can meet the actual needs of ADN planning well.
In order to verify the effectiveness of the proposed method, the following four scenarios are selected for comparison:
  • scenario 1: DG is not connected.
  • scenario 2: Access to DG without energy storage.
  • scenario 3: Connect to DG and add EVS energy storage.
  • scenario 4: Connect to DG and add normal energy storage.
Table 1 shows the results of the multi-objective functions in the four scenarios. As can be seen from Table 1, the vulnerability of the ADN network in scenario 2 is improved compared with that in scenario 1; scenario 3 reduces the network vulnerability compared with scenario 2 and further reduces the network loss of the system compared with scenario 1. Compared with scenario 3, the voltage fluctuation rate and network loss of scenario 4 are improved. These results show that EVS energy storage can better stabilize the influence of DG output on voltage fluctuation compared with ordinary energy storage.
Figure 7 shows the voltage curve for scenarios 1–3. Comparing and analyzing the node voltage curves of the three scenarios, it can be seen that, compared with scenario 1 without DG, the voltage fluctuation of scenario 2 is significantly improved after considering DG, indicating that the access of DG has a large impact on the voltage of the ADN system. In scenario 3, the voltage stability of the ADN system is significantly improved after the energy storage model with the dispatchable potential of EV clusters is added. Taking the voltage of node 16 as an example, the voltage deviation of node 16 in scenario 3 is 9.4% compared with that of node 16 in scenario 1, and the voltage deviation of node 16 in scenario 2 compared with node 16 in scenario 1 is 40%, which fully verifies the effectiveness of the proposed scheme.
Figure 8 shows the output curve of EV cluster energy storage in scenario 3. From the data in the figure, it can be observed that the two energy storage devices maintain the SOC range during the period of 10:00–15:00, with high DG outputs used to cope with the impact of DG output uncertainty. When the DG output is high, the energy storage device conducts a charging process to absorb the additional output of the DG. A discharge operation is carried out when the DG output is low to compensate for the lack of DG output. Furthermore, the effectiveness of the proposed scheme in this paper is verified in stabilizing DG fluctuations.
Figure 9 shows the final location of the EVS. After considering the site selection and capacity setting model of EVS, the average voltage of node 13 is reduced by 29.5% compared to the level before the consideration of EVS, and the average voltage of node 33 is reduced by 21.5% compared to the level before the consideration of EVS. These test results demonstrate the advantages of energy storage devices in smoothing out ADN voltage fluctuations and verify the role of EVS in the substitution of energy storage devices.
The above model can provide a preliminary scheme for EVS site selection and capacity determination. However, the solution efficiency of MOPSO is slow and needs to be further improved and the model does not take into account more practical issues such as EV queuing times, which will be left for further study and discussion in the future.

6. Conclusions

To deal with the problems of ADN load fluctuation caused by DG access, a multi-objective site selection and capacity determination method for distribution networks is proposed. We consider new energy uncertainties and shared energy storage of electric vehicles. The proposed method can reduce the uncertainty of ADN systems by introducing energy storage devices based on EV clusters and predicting DG and EV data. The main conclusions are as follows:
(1)
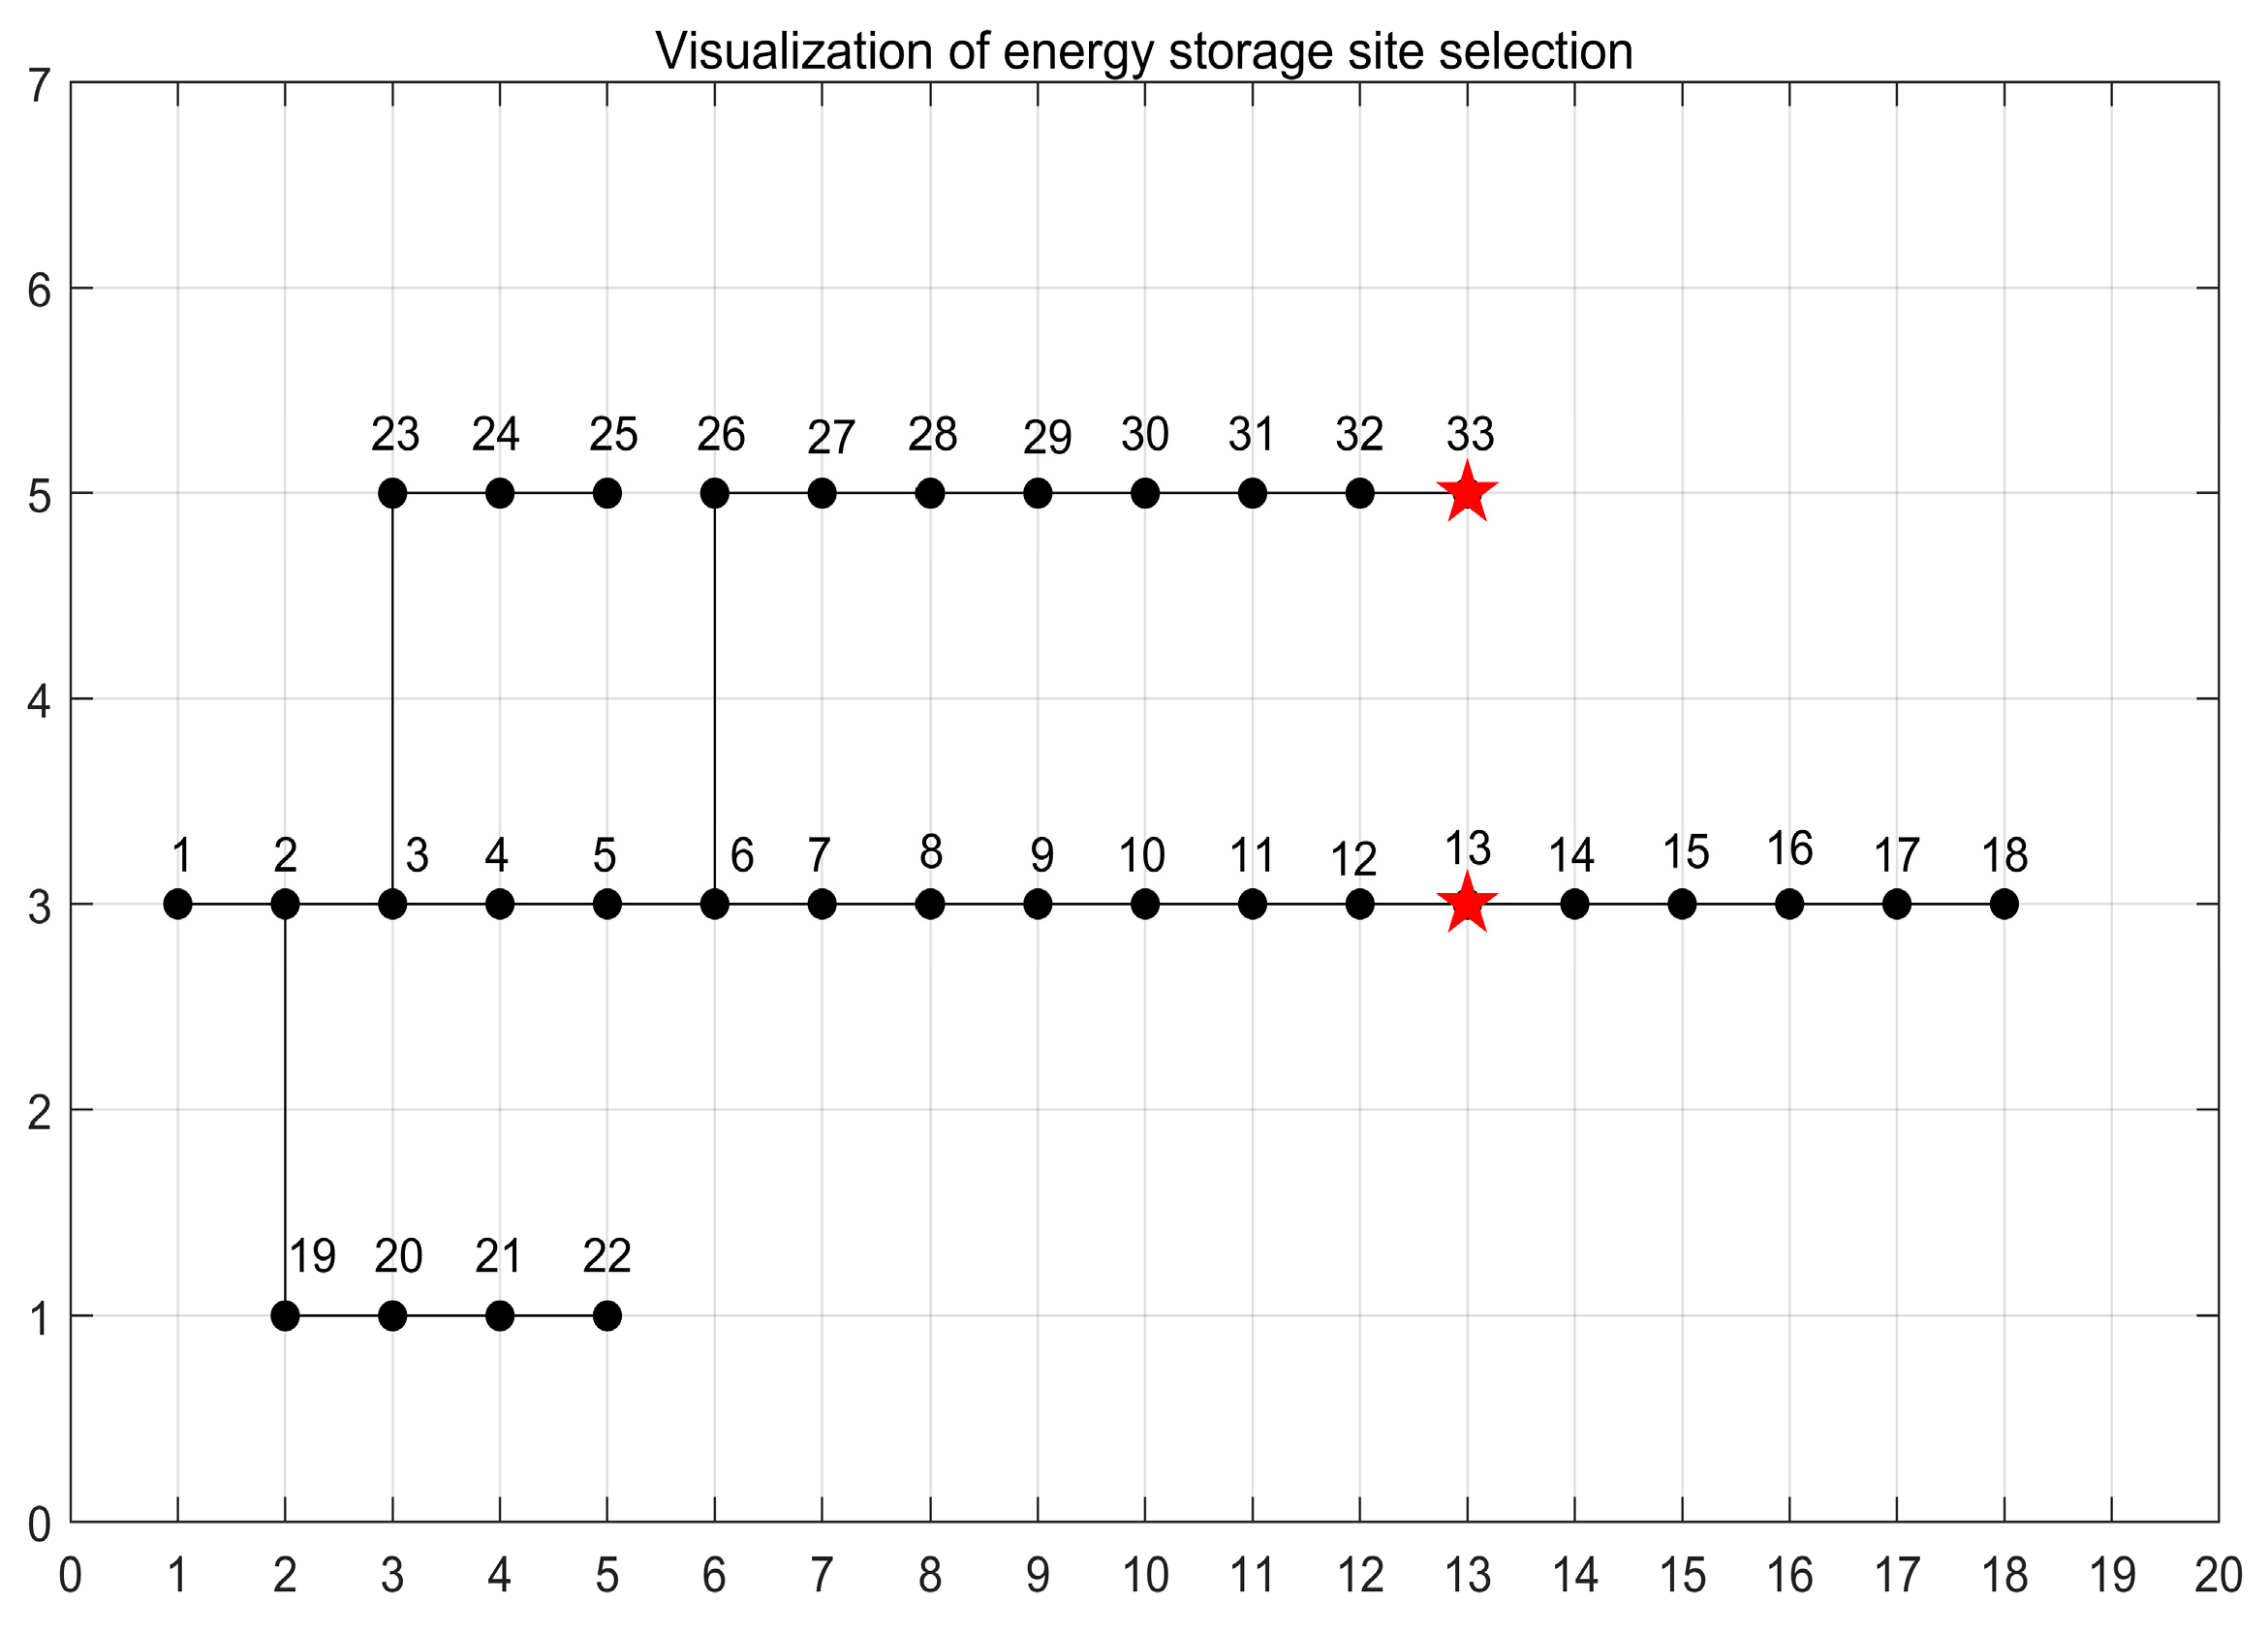
The EV cluster energy storage device can better stabilize the voltage fluctuation of the ADN system caused by the uncertainty of DG outputs. Compared with traditional energy storage devices, EV cluster energy storage reduces the upfront construction cost and improves energy utilization. After considering the site selection and capacity setting model of EVs, the average voltage of node 13 is reduced by 29.5% compared to the scenario without EVs, and the average voltage of node 33 is reduced by 21.5% compared to the scenario without EVs.
(2)
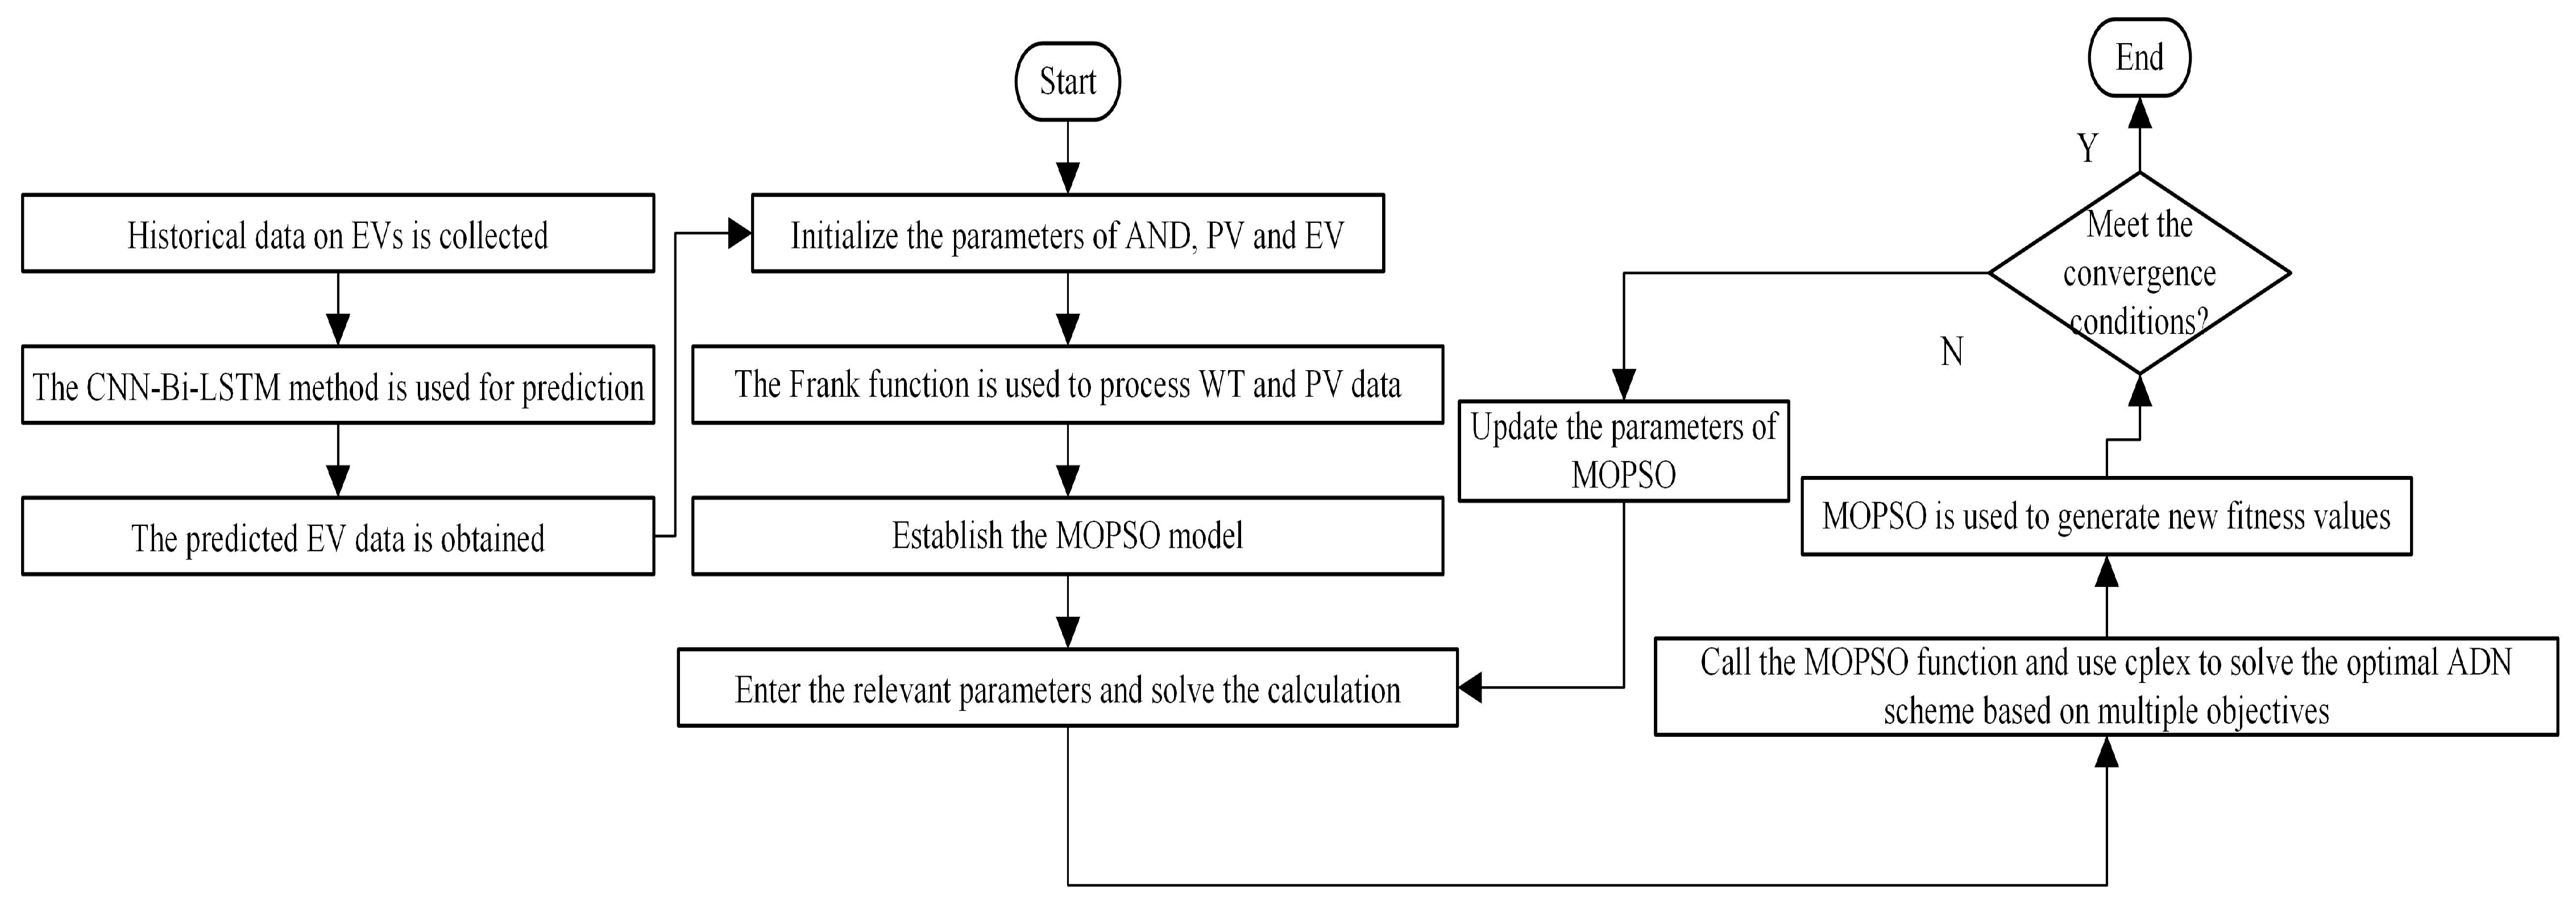
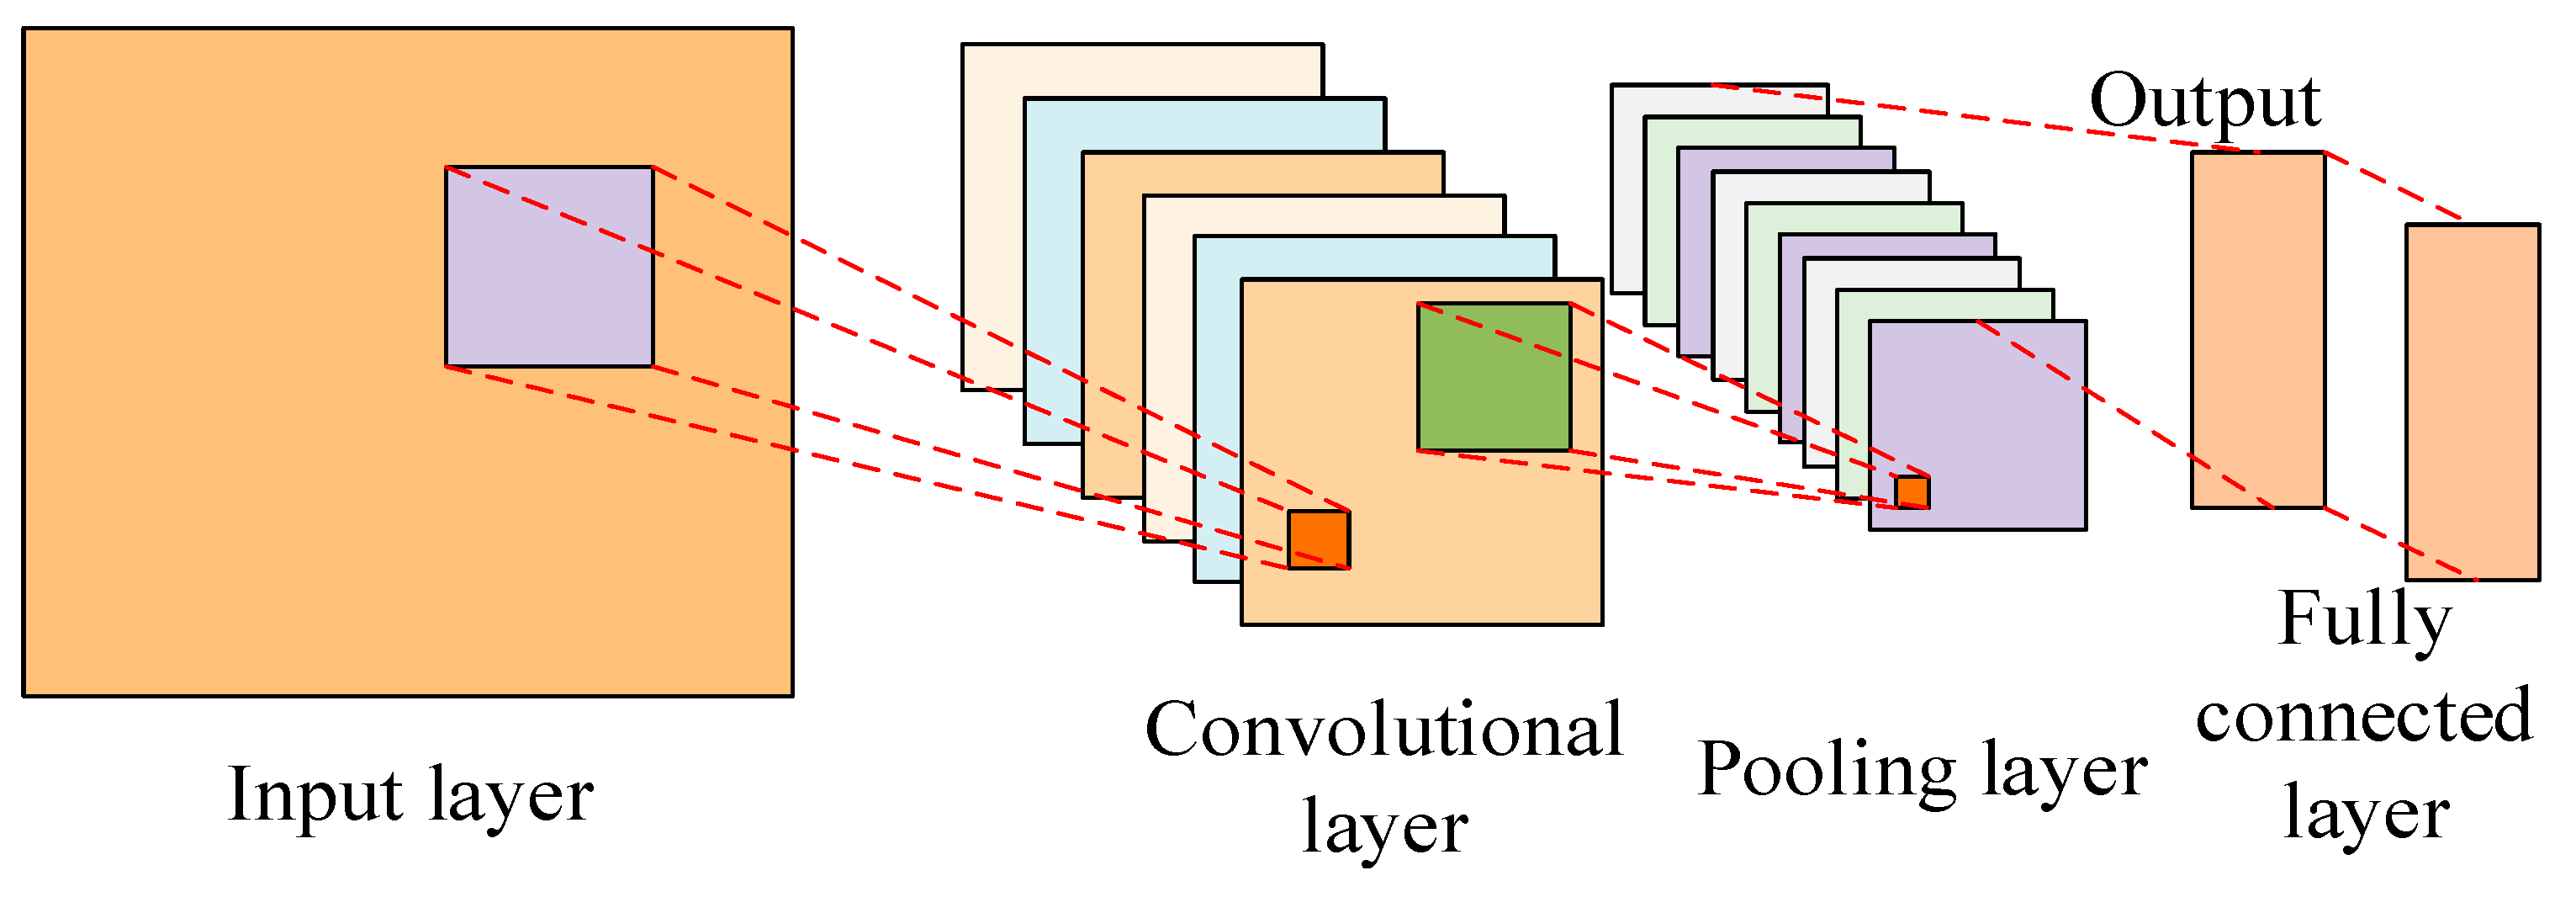
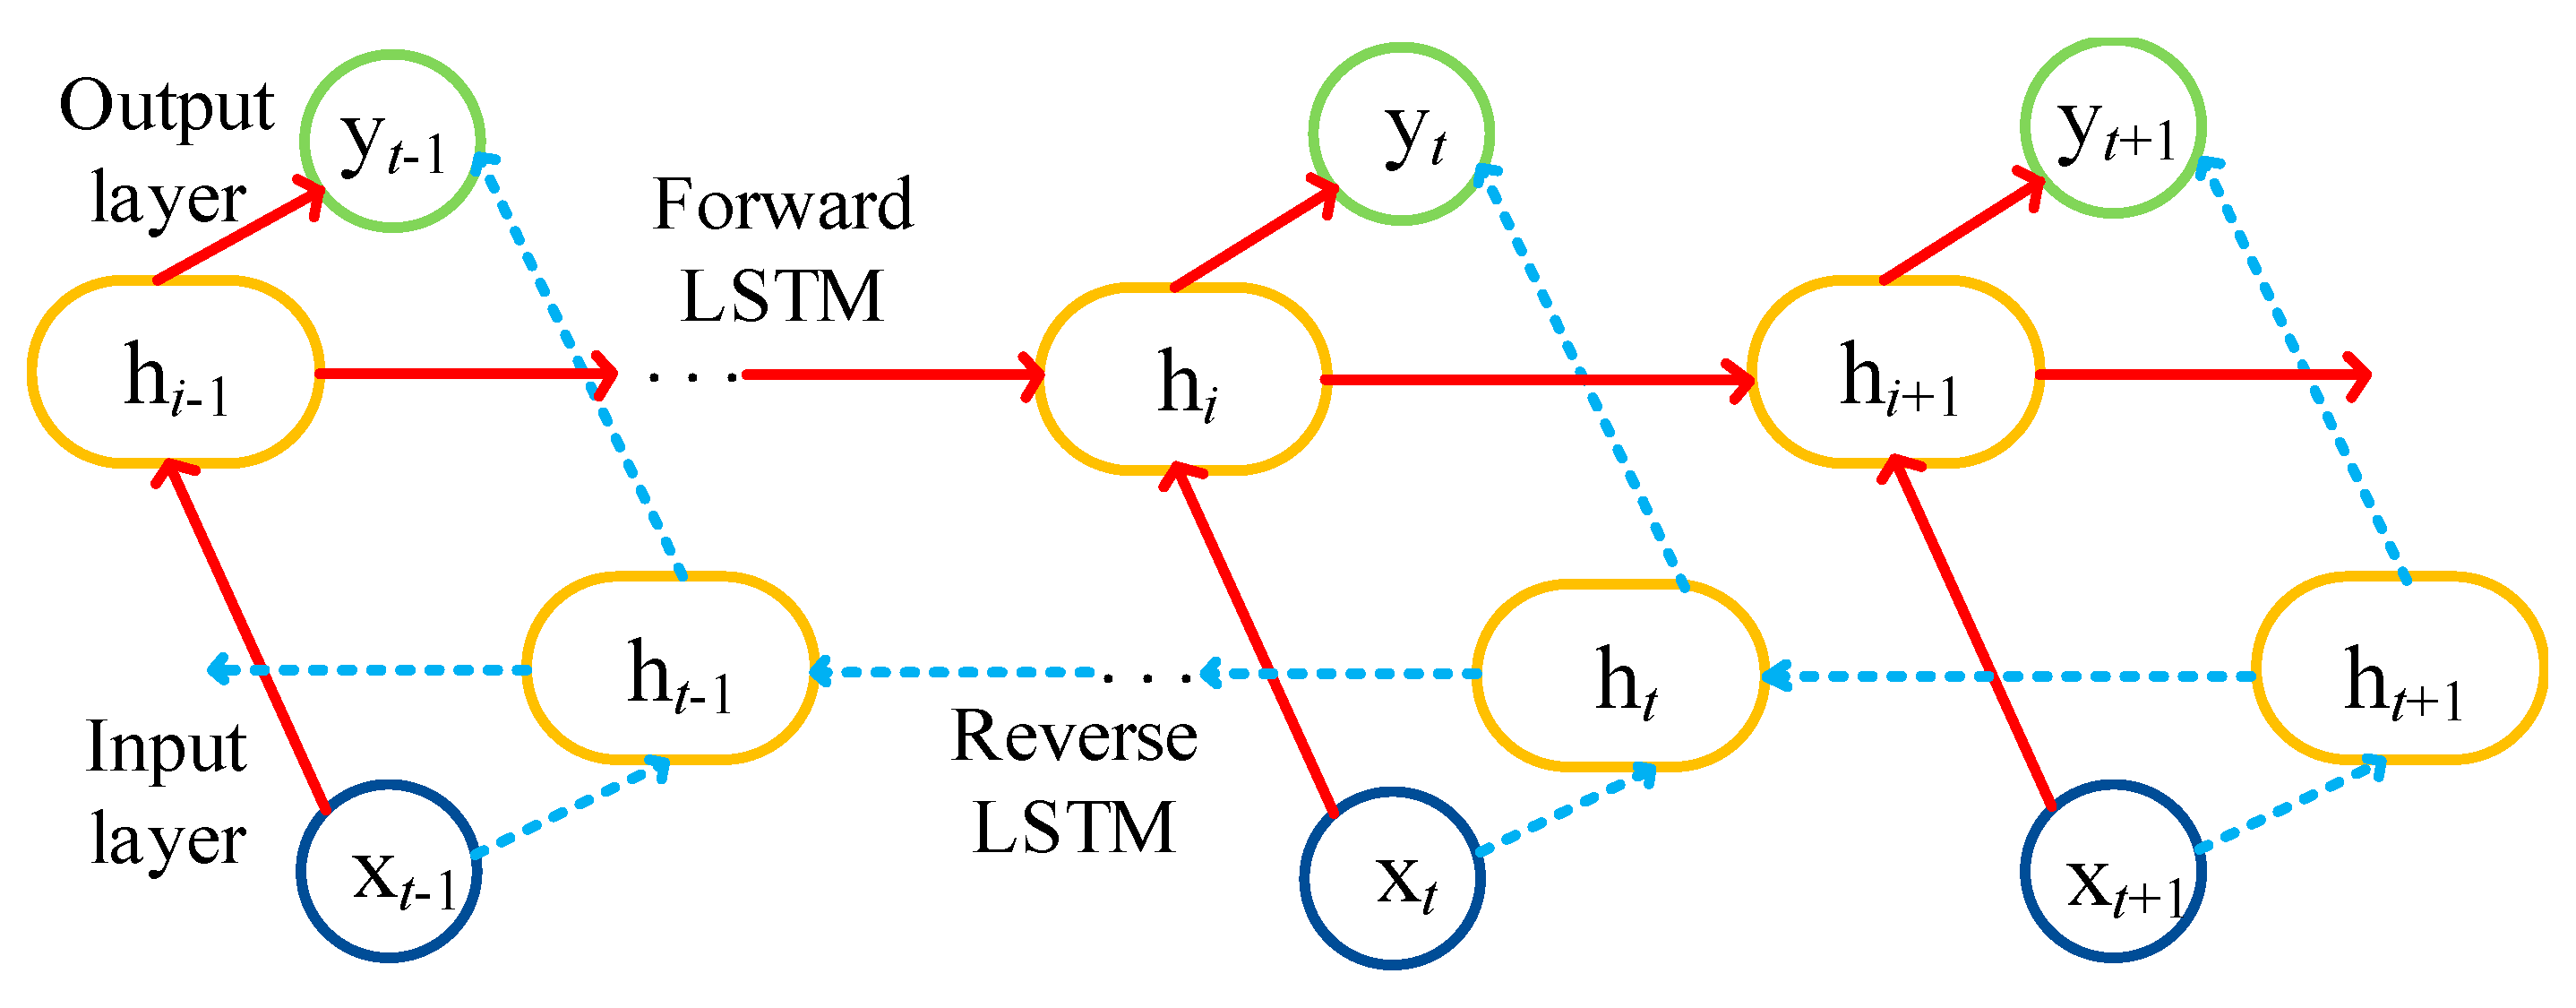
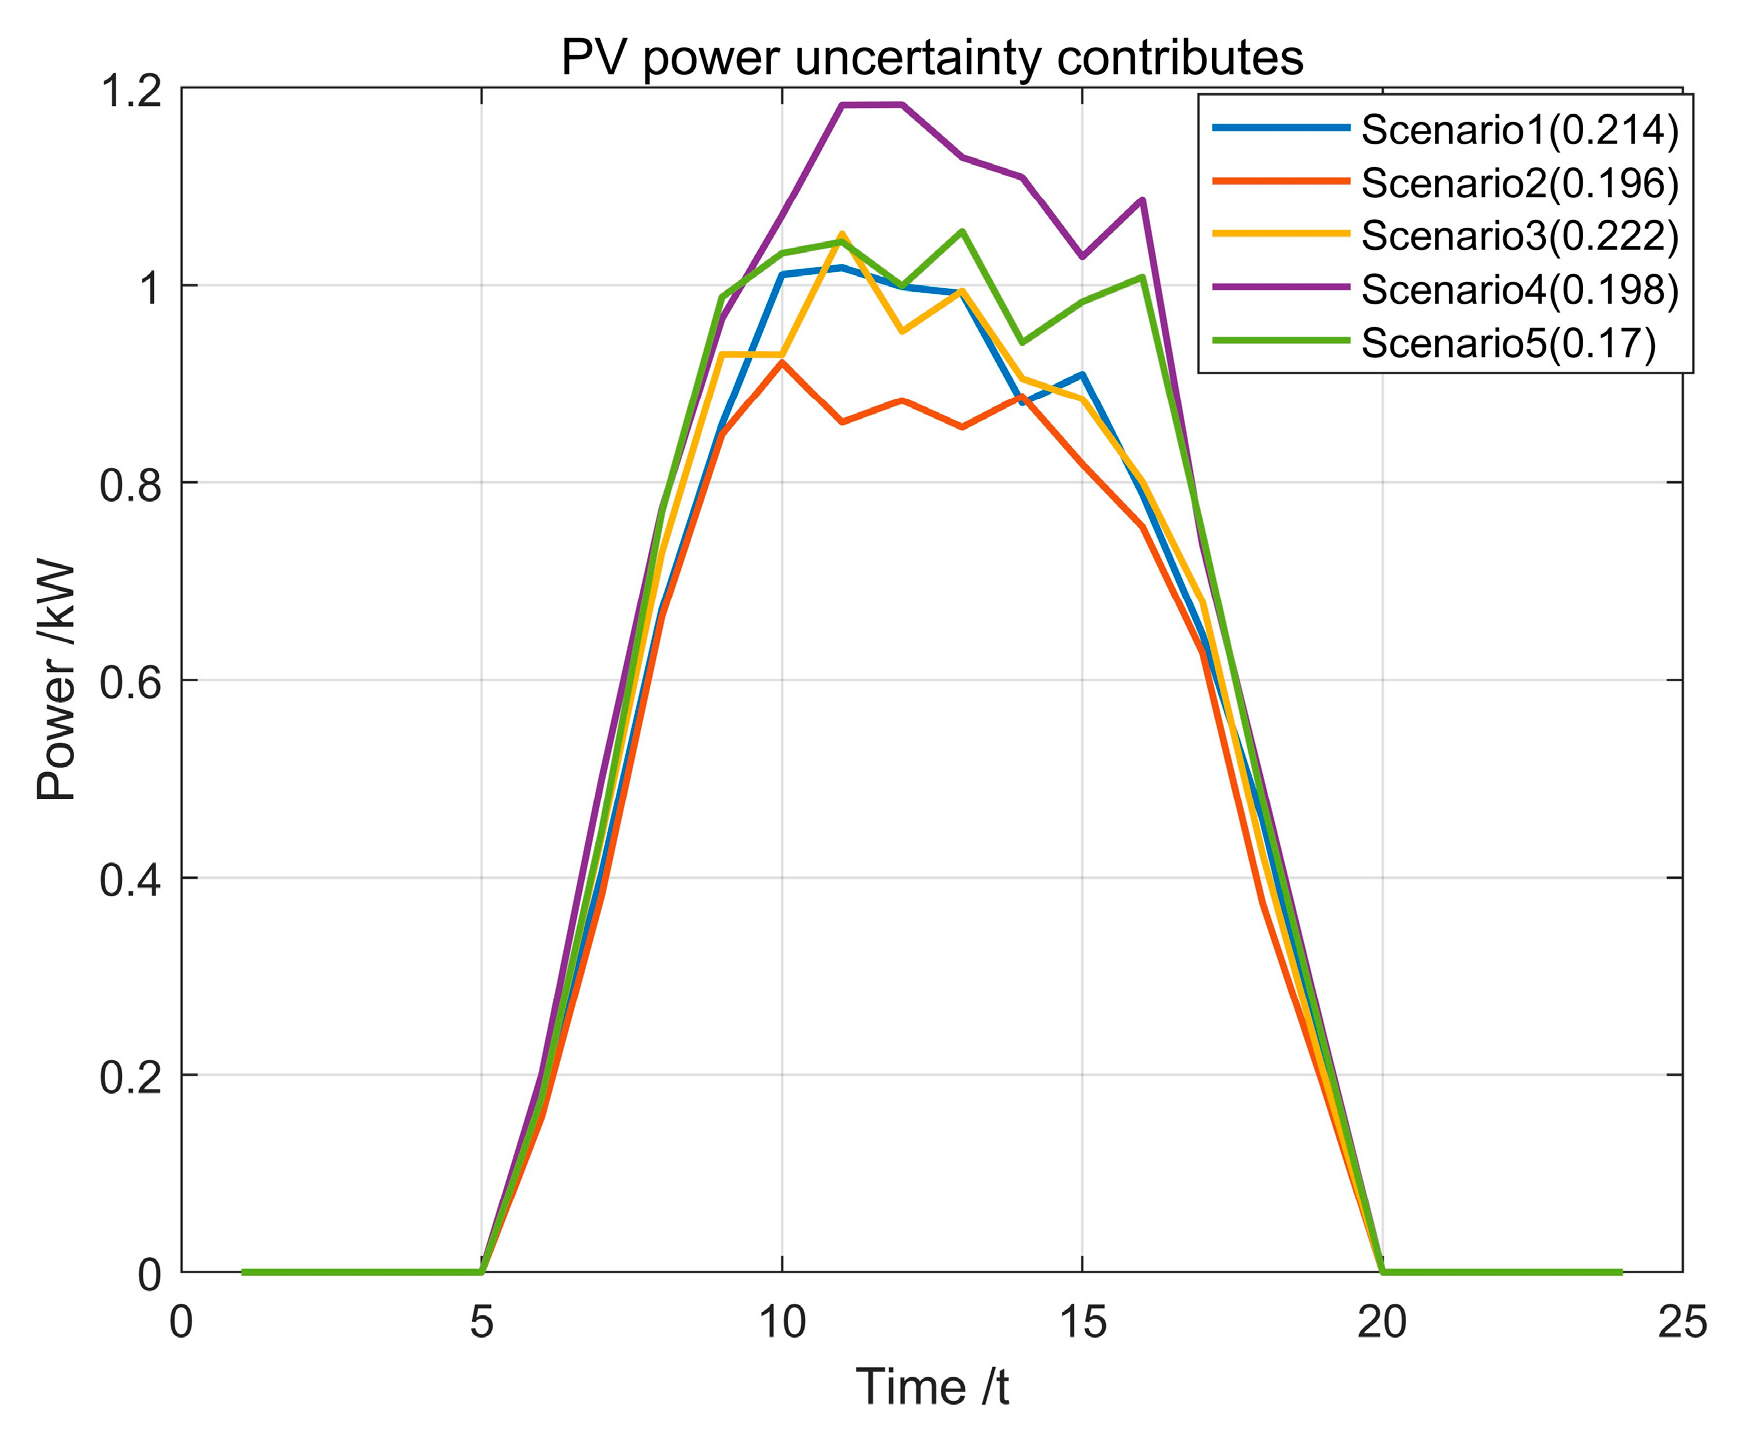
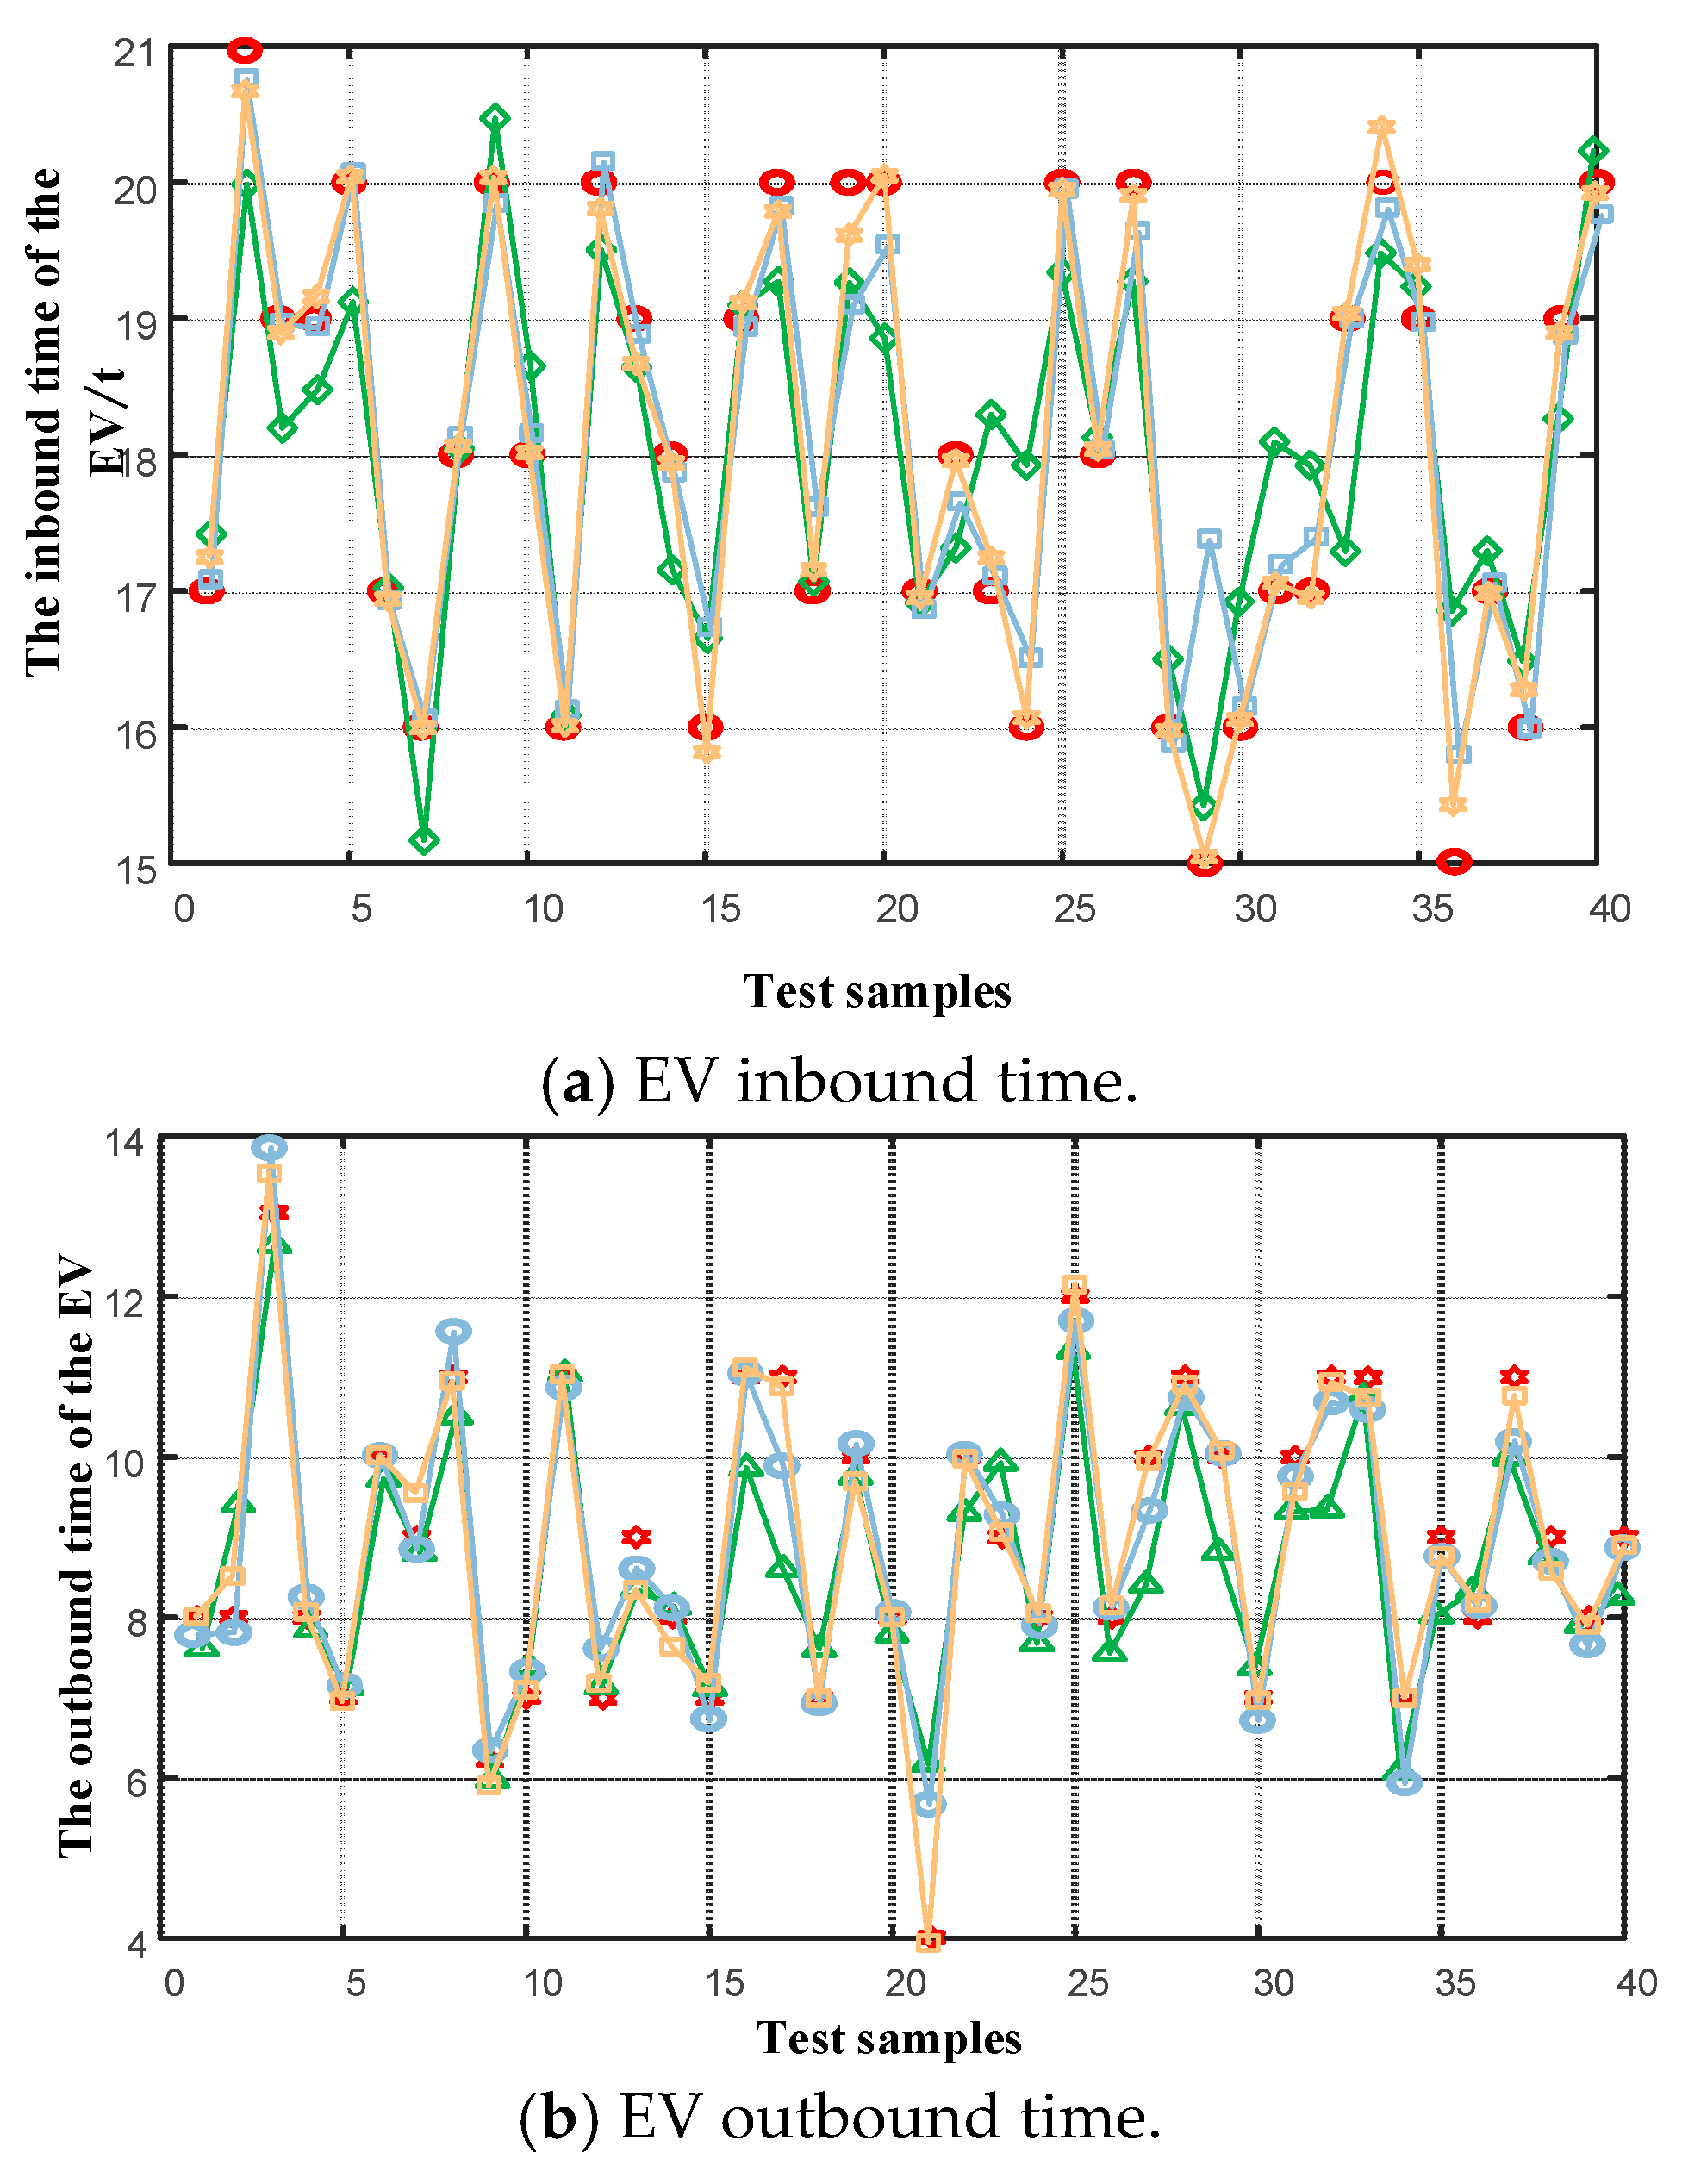
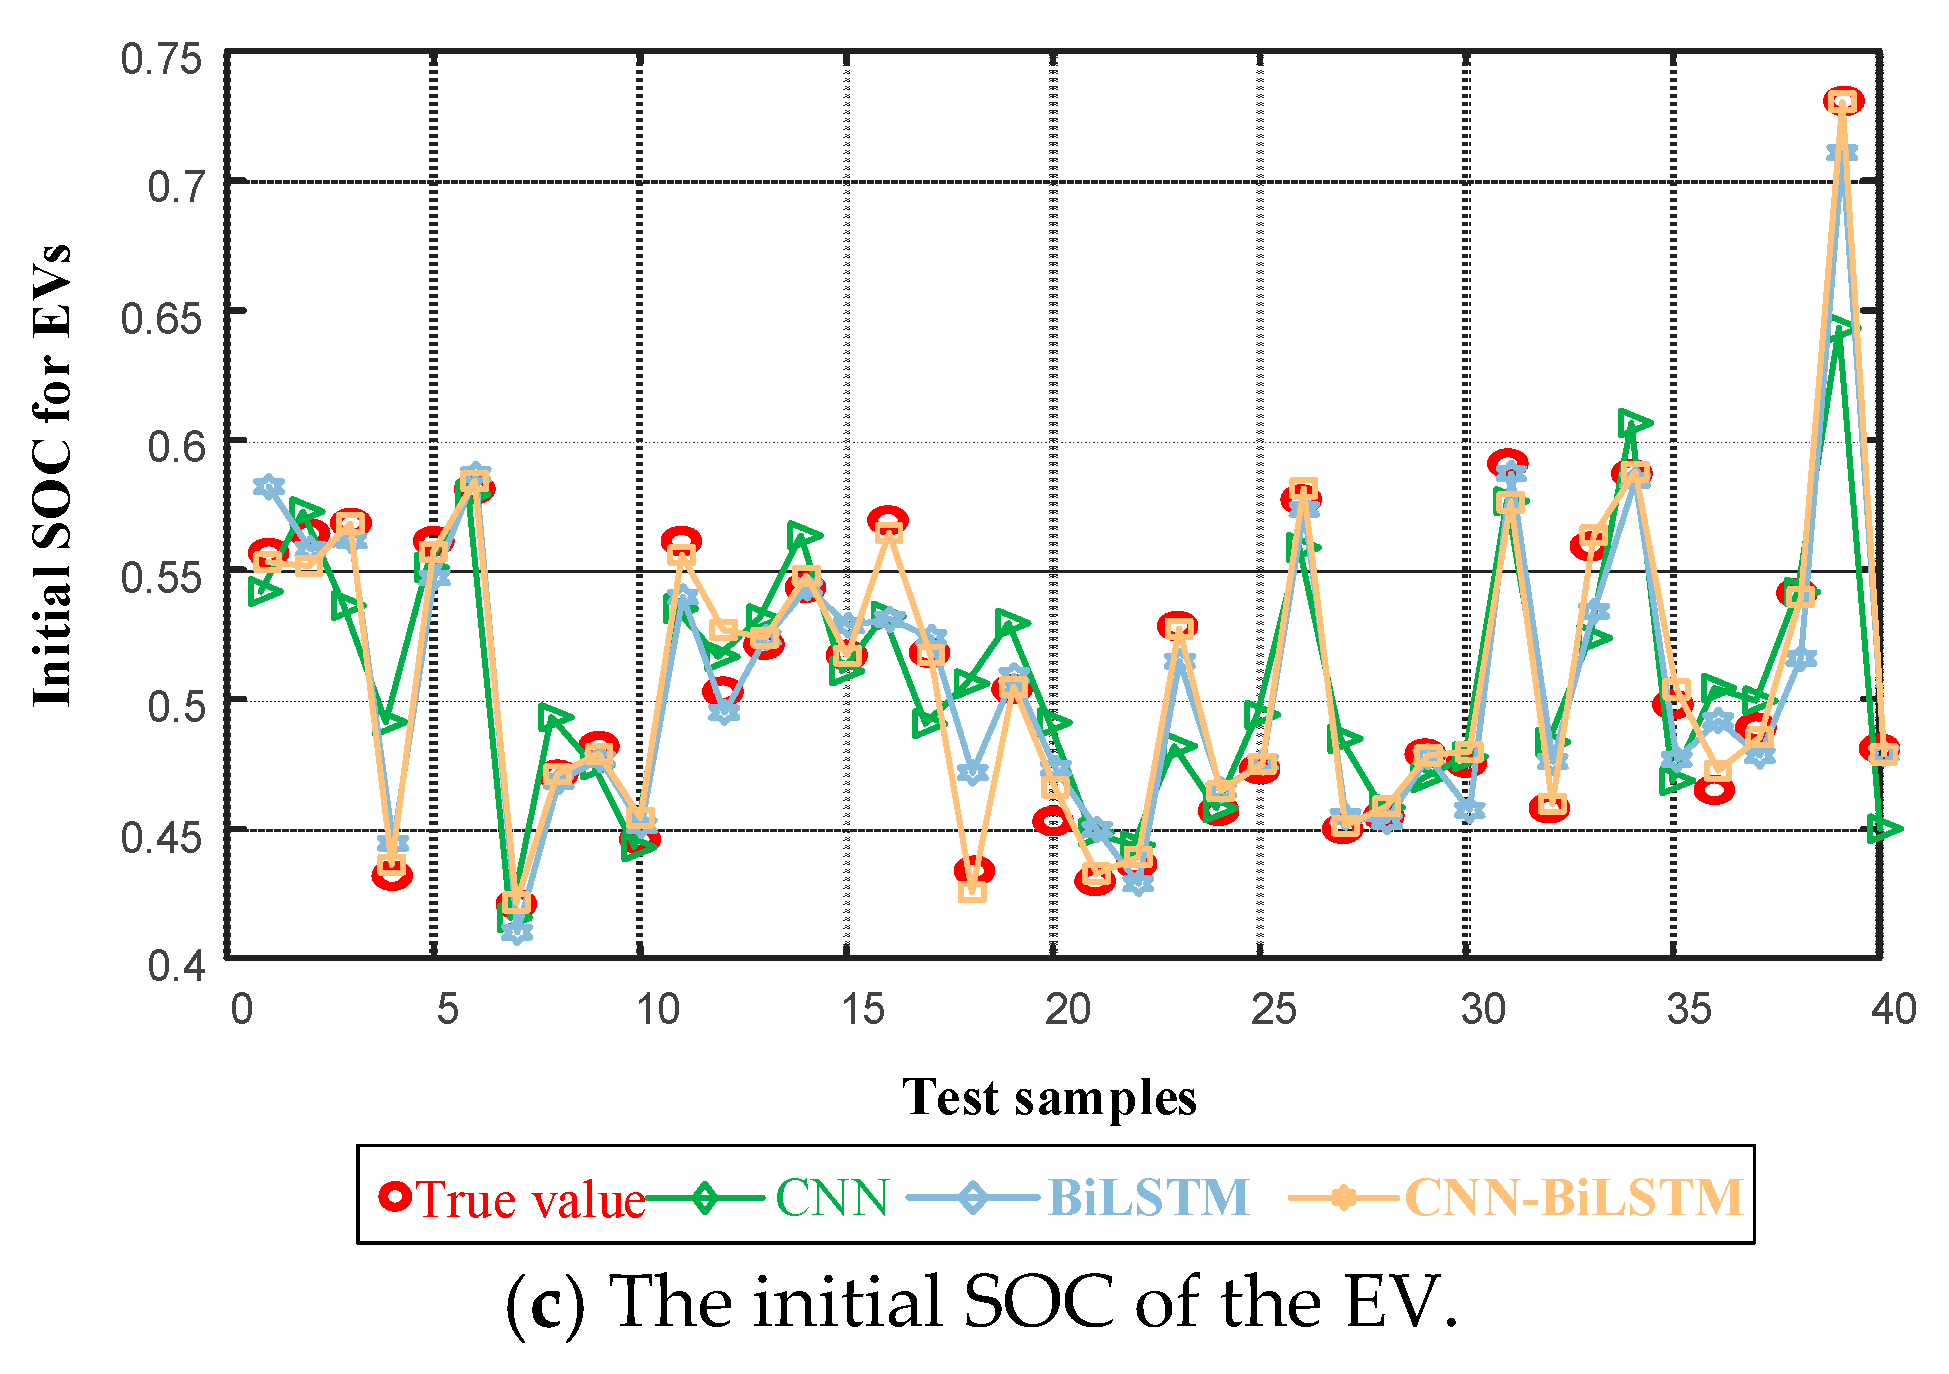
The probability density curve of DG output obtained based on the Frank copula function can better reflect the actual situation of DG output and reduce the prediction bias compared with the traditional prediction algorithm. The EV data predicted based on CNN-BiLSTM can also reflect the actual situation of EV more realistically, reducing the uncertainty of EV output. The CNN-BiLSTM algorithm used in this paper can further reduce the data error of EV, which is 10.2% higher than the ordinary CNN method and 8.3% higher than that of the Bi-LSTM algorithm.
(3)
The multi-objective distribution network siting and capacity setting model can optimize the ADN model with DG via the aspects of node voltage fluctuation and ADN network loss, which further improves the feasibility compared with the single-target model.
In future research, we will further study the multi-objective optimization algorithm to improve the solution efficiency of MOPSO. In addition, the model combining EV path planning and ADN networks will be also investigated to enrich the factors of EVS site selection and capacity determination.

Author Contributions

G.W. and H.L. (Haiyang Li). were responsible for methodology, simulation, and validation. H.L. (Huayong Lu) conducted the analysis and wrote the paper. Conceptualization was handled by H.L. (Huayong Lu) and X.Y.; resource management by H.L. (Haiyang Li) and X.S.; data curation by Z.L. and X.S.; original draft preparation by H.L. (Huayong Lu) and X.S.; review and editing by Y.W; visualization by H.L. (Huayong Lu) and X.S.; supervision by Y.W.; project management by H.L. (Haiyang Li); and funding acquisition by Y.W. All authors have read and agreed to the published version of the manuscript.

Funding

This work is supported by the State Grid Henan Electric Power Company Technology Project (5217C0240001).

Data Availability Statement

The data presented in this study are available in this article.

Conflicts of Interest

Authors Guodong Wang, Haiyang Li, Xiao Yang, Huayong Lu were employed by the State Grid Henan Electric Power Company; Authors Xiao Song and Zheng Li were employed by the State Grid Jiaozuo Electric Power Supply Company. The remaining authors declare that the research was conducted in the absence of any commercial or financial relationships that could be construed as a potential conflict of interest.

Abbreviations

DGdistributed generation
ANDactive distribution network
EVelectric vehicle
MOPSOmulti-objective particle swarm optimizer
SOCstate of charge
CNNconvolutional neural network
Bi-LSTMbi-directional long short-term memory

Appendix A

Figure A1. Flowchart of the algorithm in this article.
Electronics 14 00151 g0a1
Table A1. Sampling parameters of EV.
EV T arrive T leave S 0 The Number of EVs Within 1 Charging StationThe Number of EVs Within 2 Charging StationsThe Number of EVs Within 3 Charging StationsThe Number of EVs Within 4 Charging Stations
1N (18, 4)N (8, 4)U (0.4, 0.6)U (180, 210)U (180, 210)0U (380, 400)
2N (21, 1)N (7, 1)U (0.2, 0.4)U (190, 220)U (90, 120)U (90, 120)0
3N (9, 2)N (17, 2)U (0.4, 0.6)0U (380, 400)U (380, 400)0

References

  1. Wang, S.; Chen, S.; Ge, L.; Wu, L. Distributed generation hosting capacity evaluation for distribution systems considering the robust optimal operation of OLTC and SVC. IEEE Trans. Sustain. Energy 2017, 7, 1111–1123. [Google Scholar] [CrossRef]
  2. Heidari, S.; Firuzabad, M. Integrated planning for distribution automation and network capacity expansion. IEEE Trans. Smart Grid 2018, 10, 4279–4288. [Google Scholar] [CrossRef]
  3. Wan, C.; Lin, J.; Guo, W.; Song, Y. Maximum uncertainty boundary of volatile distributed generation in active distribution network. IEEE Trans. Smart Grid 2016, 9, 2930–2942. [Google Scholar] [CrossRef]
  4. Fang, X.; Hodge, B.M.; Du, E.; Kang, C.; Li, F. Introducing uncertainty components in locational marginal prices for pricing wind power and load uncertainties. IEEE Trans. Power Syst. 2019, 34, 2013–2024. [Google Scholar] [CrossRef]
  5. Zhang, H.; Wang, X.; Guo, H. Multi-objective optimization of day-ahead and intraday rolling scheduling considering unit energy coordination. In Proceedings of the 2021 IEEE/IAS Industrial and Commercial Power System Asia (I&CPS Asia), Chengdu, China, 18–21 July 2021; pp. 958–964. [Google Scholar]
  6. Elkadeem, M.R.; Abd Elaziz, M.; Ullah, Z.; Wang, S.; Sharshir, S.W. Optimal planning of renewable energy-integrated distribution system considering uncertainties. IEEE Access 2019, 7, 164887–164907. [Google Scholar] [CrossRef]
  7. Li, Q.; Wang, S.; Zhou, X.; Zhang, A.; Zaman, R. Modeling and optimization of RIES based on composite energy pipeline energy supply. IEEE Trans. Appl. Supercond. 2021, 31, 1–5. [Google Scholar] [CrossRef]
  8. Zhang, T.; Liu, S.; Qiu, W.; Lin, Z.; Zhu, L.; Zhao, D.; Qian, M.; Yang, L. KPI-based real-time situational awareness for power systems with a high proportion of renewable energy sources. CSEE J. Power Energy Syst. 2020, 8, 1060–1073. [Google Scholar]
  9. Chen, J.; Sun, S.; Huang, Y.; Hao, Y.; Xu, Y.; Liang, Y.; Shen, X.; Han, K. Bidding strategies for energy supplier in multi-time scale power and gas coupled market. In Proceedings of the 2022 7th International Conference on Power and Renewable Energy (ICPRE), Shanghai, China, 23–26 September 2022; pp. 1217–1222. [Google Scholar]
  10. Sun, Q.; Yao, J.; Wang, Y. From virtual power plant to real electricity: Summary and prospect of virtual power plant research. Power Gener. Technol. 2023, 44, 583–601. [Google Scholar]
  11. Shi, Y.; Guo, C.; Ding, X. Integrated energy system economic dispatch based on affine adjustable robust optimization. Power Gener. Technol. 2020, 41, 118–125. [Google Scholar]
  12. Sun, X.; Liu, C.; Niu, X.; Zhao, L. Research on typical design of wind-solar coupled hydrogen production system. South. Energy Constr. 2023, 10, 112–119. [Google Scholar]
  13. Xing, H.; Xu, Q.; Ren, X.; Shen, Y. A Time-phased Order Charging Strategy for an Electric Vehicle Photovoltaic Charging Station. South. Energy Constr. 2020, 7, 112–118. [Google Scholar]
  14. Li, J.; You, H.; Qi, J.; Kong, M.; Zhang, S.; Zhang, H. Stratified optimization strategy used for restoration with photovoltaic-battery energy storage systems as black-start resources. IEEE Access 2019, 7, 127339–127352. [Google Scholar] [CrossRef]
  15. Gao, X.; Fu, L. SOC Optimization based energy management strategy for hybrid energy storage system in vessel integrated power system. IEEE Access 2020, 7, 54611–54619. [Google Scholar] [CrossRef]
  16. Ghiani, E.; Pilo, F. Smart inverter operation in distribution networks with high penetration of photovoltaic systems. J. Mod. Power Syst. Clean Energy 2015, 3, 504–511. [Google Scholar] [CrossRef]
  17. Sudipta, G.; Sukumar, K. An energy function-based optimal control strategy for output stabilization of integrated DFIG-Flywheel energy storage system. IEEE Trans. Smart Grid 2016, 8, 1922–1931. [Google Scholar]
  18. Zhang, R.; Xiao, S.; Rao, Y.; Tao, P.; Guo, W. Dynamic reactive power optimization considering load uncertainty and period optimization. In Proceedings of the 2023 IEEE 6th Information Technology, Networking, Electronic and Automation Control Conference (ITNEC), Chongqing, China, 24–26 February 2023; pp. 1710–1714. [Google Scholar]
  19. Lu, X.; Wang, L. Cloud-Edge collaboration control strategy for electric vehicle aggregators participating in frequency and voltage regulation. IEEE Open J. Veh. Technol. 2024, 5, 1532–1544. [Google Scholar] [CrossRef]
  20. Zhan, X.; Yang, J.; Han, S.; Zhou, T.; Wu, F.Z.; Liu, S. Two-stage market bidding strategy of charging station considering schedulable potential capacity of electric vehicle. Autom. Electr. Power Syst. 2021, 45, 86–96. [Google Scholar]
  21. Huang, Z.; Fang, B.; Deng, J. Multi-objective optimization strategy for distribution network considering V2G-enabled electric vehicles in building integrated energy system. Prot. Control Mod. Power Syst. 2020, 5, 1–8. [Google Scholar] [CrossRef]
  22. Goswami, S.; Basu, S. A new algorithm for the reconfiguration of distribution feeders for loss minimization. IEEE Trans. Power Deliv. 1992, 7, 1484–1491. [Google Scholar] [CrossRef]
  23. Qin, M.; Yang, Y.; Zhao, X. Low-carbon economic multi-objective dispatch of integrated energy system considering the price fluctuation of natural gas and carbon emission accounting. Prot. Control Mod. Power Syst. 2023, 8, 1–18. [Google Scholar] [CrossRef]
  24. Dong, W.; Zhang, J.; Zhou, Q.; Zhang, L.; Gong, H. An overview of the evolution of security and stability of China’s power system. Electr. Power 2024. Available online: https://kns.cnki.net/kcms/detail/11.3265.TM.20240528.1355.004.html (accessed on 4 December 2024).
  25. Zhou, Y.; Wang, Z.; Zhang, M.; Yang, J.; Shu, D. A grid cell based distribution network planning method adapting to the increasing permeability of distributed resources. Power Syst. Technol. 2024. [Google Scholar] [CrossRef]
  26. Li, H.; Liu, D.; Qin, J. Stochastic planning method for UHVDC transmission of renewable energy power base considering wind and photovoltaic output uncertainties. Power Syst. Technol. 2024, 48, 2795–2803. [Google Scholar]
  27. Zhang, X.; Li, Y.; Liu, X.; Han, J.; Li, J.; Lin, Q.; Zhang, G.; Peng, L. Distribution network planning of new AC/DC energy storage system with high penetration new energy. South. Power Syst. Technol. 2022, 16, 60–67. [Google Scholar]
  28. Ding, M.; Liu, X.; Bi, R.; Hu, D.; Ye, B. Method for cluster partition of high penetration distributed generators based on comprehensive performance index. Autom. Electr. Power Syst. 2018, 42, 47–52. [Google Scholar]
  29. Zhu, L.J.; Xun, Z.H.; Wang, Y.X.; Cui, Q.; Chen, W.Y.; Lou, J.C. Short-term power load forecasting based on CNN-BiLSTM. Power Syst. Technol. 2021, 45, 4532–4539. [Google Scholar]
  30. Wang, K.; Du, H.; Jia, R.; Liu, H.; Liang, Y.; Wang, X.Y. Short-term interval probability prediction of photovoltaic power based on similar daily clustering and QR-CNN-BiLSTM model. High Volt. Eng. 2022, 48, 4372–4384. [Google Scholar]
  31. Gao, S.; Dai, R. Charging control strategy for electric vehicle cluster participating in frequency regulation ancillary service market. Autom. Electr. Power Syst. 2023, 47, 60–67. [Google Scholar]
  32. You, L.; Jin, X.; Liu, Y. Research on the charging load calculation method for electric vehicle cluster. South. Energy Constr. 2024, 11, 159–167. [Google Scholar]
  33. Zhang, P.Z.; Xie, L.R.; Ma, R.Z.; Lu, P.; Song, X.F.; Yang, J.B. Multi-player two-stage low carbon optimal operation strategy considering electric vehicle cluster schedulability. Power Syst. Technol. 2022, 46, 4809–4825. [Google Scholar]
  34. Zhou, J.; Zhang, R.; Xu, G.; Xue, X.; Chen, H. Two stage stochastic optimization of green methanol synthesis system for solar hydrogen production based on COPULA SHUFLE method. Acta Solaria Sin. 2024, 45, 70–79. [Google Scholar]
  35. Zhao, S.; Yao, J.; Li, Z. Wind power scenario reduction based on improved K-means clustering and SBR algorithm. Power Syst. Technol. 2021, 45, 3947–3954. [Google Scholar]
Figure 1. Generation of wind and photovoltaic daily curve.
Electronics 14 00151 g001
Figure 2. Structure of CNN.
Electronics 14 00151 g002
Figure 3. A schematic diagram of Bi-LSTM.
Electronics 14 00151 g003
Figure 4. Wind power output reduction scenarios.
Electronics 14 00151 g004
Figure 5. PV output reduction scenarios.
Electronics 14 00151 g005
Figure 6. A comparison of data from different algorithms.
Electronics 14 00151 g006aElectronics 14 00151 g006b
Figure 7. Node voltage curves for different scenarios.
Electronics 14 00151 g007
Figure 8. EVS output and SOC curve.
Electronics 14 00151 g008
Figure 9. EVS location curve.
Electronics 14 00151 g009
Table 1. A comparison of objective functions under three scenarios.
scenario 1scenario 2scenario 3scenario 4
Target 10.3197360.3691320.363450.36784
Target 21.6572250.9470591.1701431.268574
Target 3//2.5652992.325875
Disclaimer/Publisher’s Note: The statements, opinions and data contained in all publications are solely those of the individual author(s) and contributor(s) and not of MDPI and/or the editor(s). MDPI and/or the editor(s) disclaim responsibility for any injury to people or property resulting from any ideas, methods, instructions or products referred to in the content.

