


Optimizing Cardiovascular Health Monitoring with IoT-Enabled Sensors and AI: A Focus on Obesity-Induced Cardiovascular Risks in Young Adults

 ,
,
Abstract

1. Introduction
- This study introduced an advanced noninvasive heart blood sensor with an accuracy rate as high as 73.33%. Compared to the existing system that only measures heart rate, pulse pressure, and systolic blood pressure [24], CI value prediction has been improved by 10%.
- Through statistical analysis, the study identifies optimal physiological parameters for evaluating cardiac function, demonstrating that these parameters can enhance prediction accuracy by approximately 20%.
- The application of data enhancement techniques resulted in CI value predictions exceeding 90.01% accuracy, which is 30% higher than current evaluation methods [25].
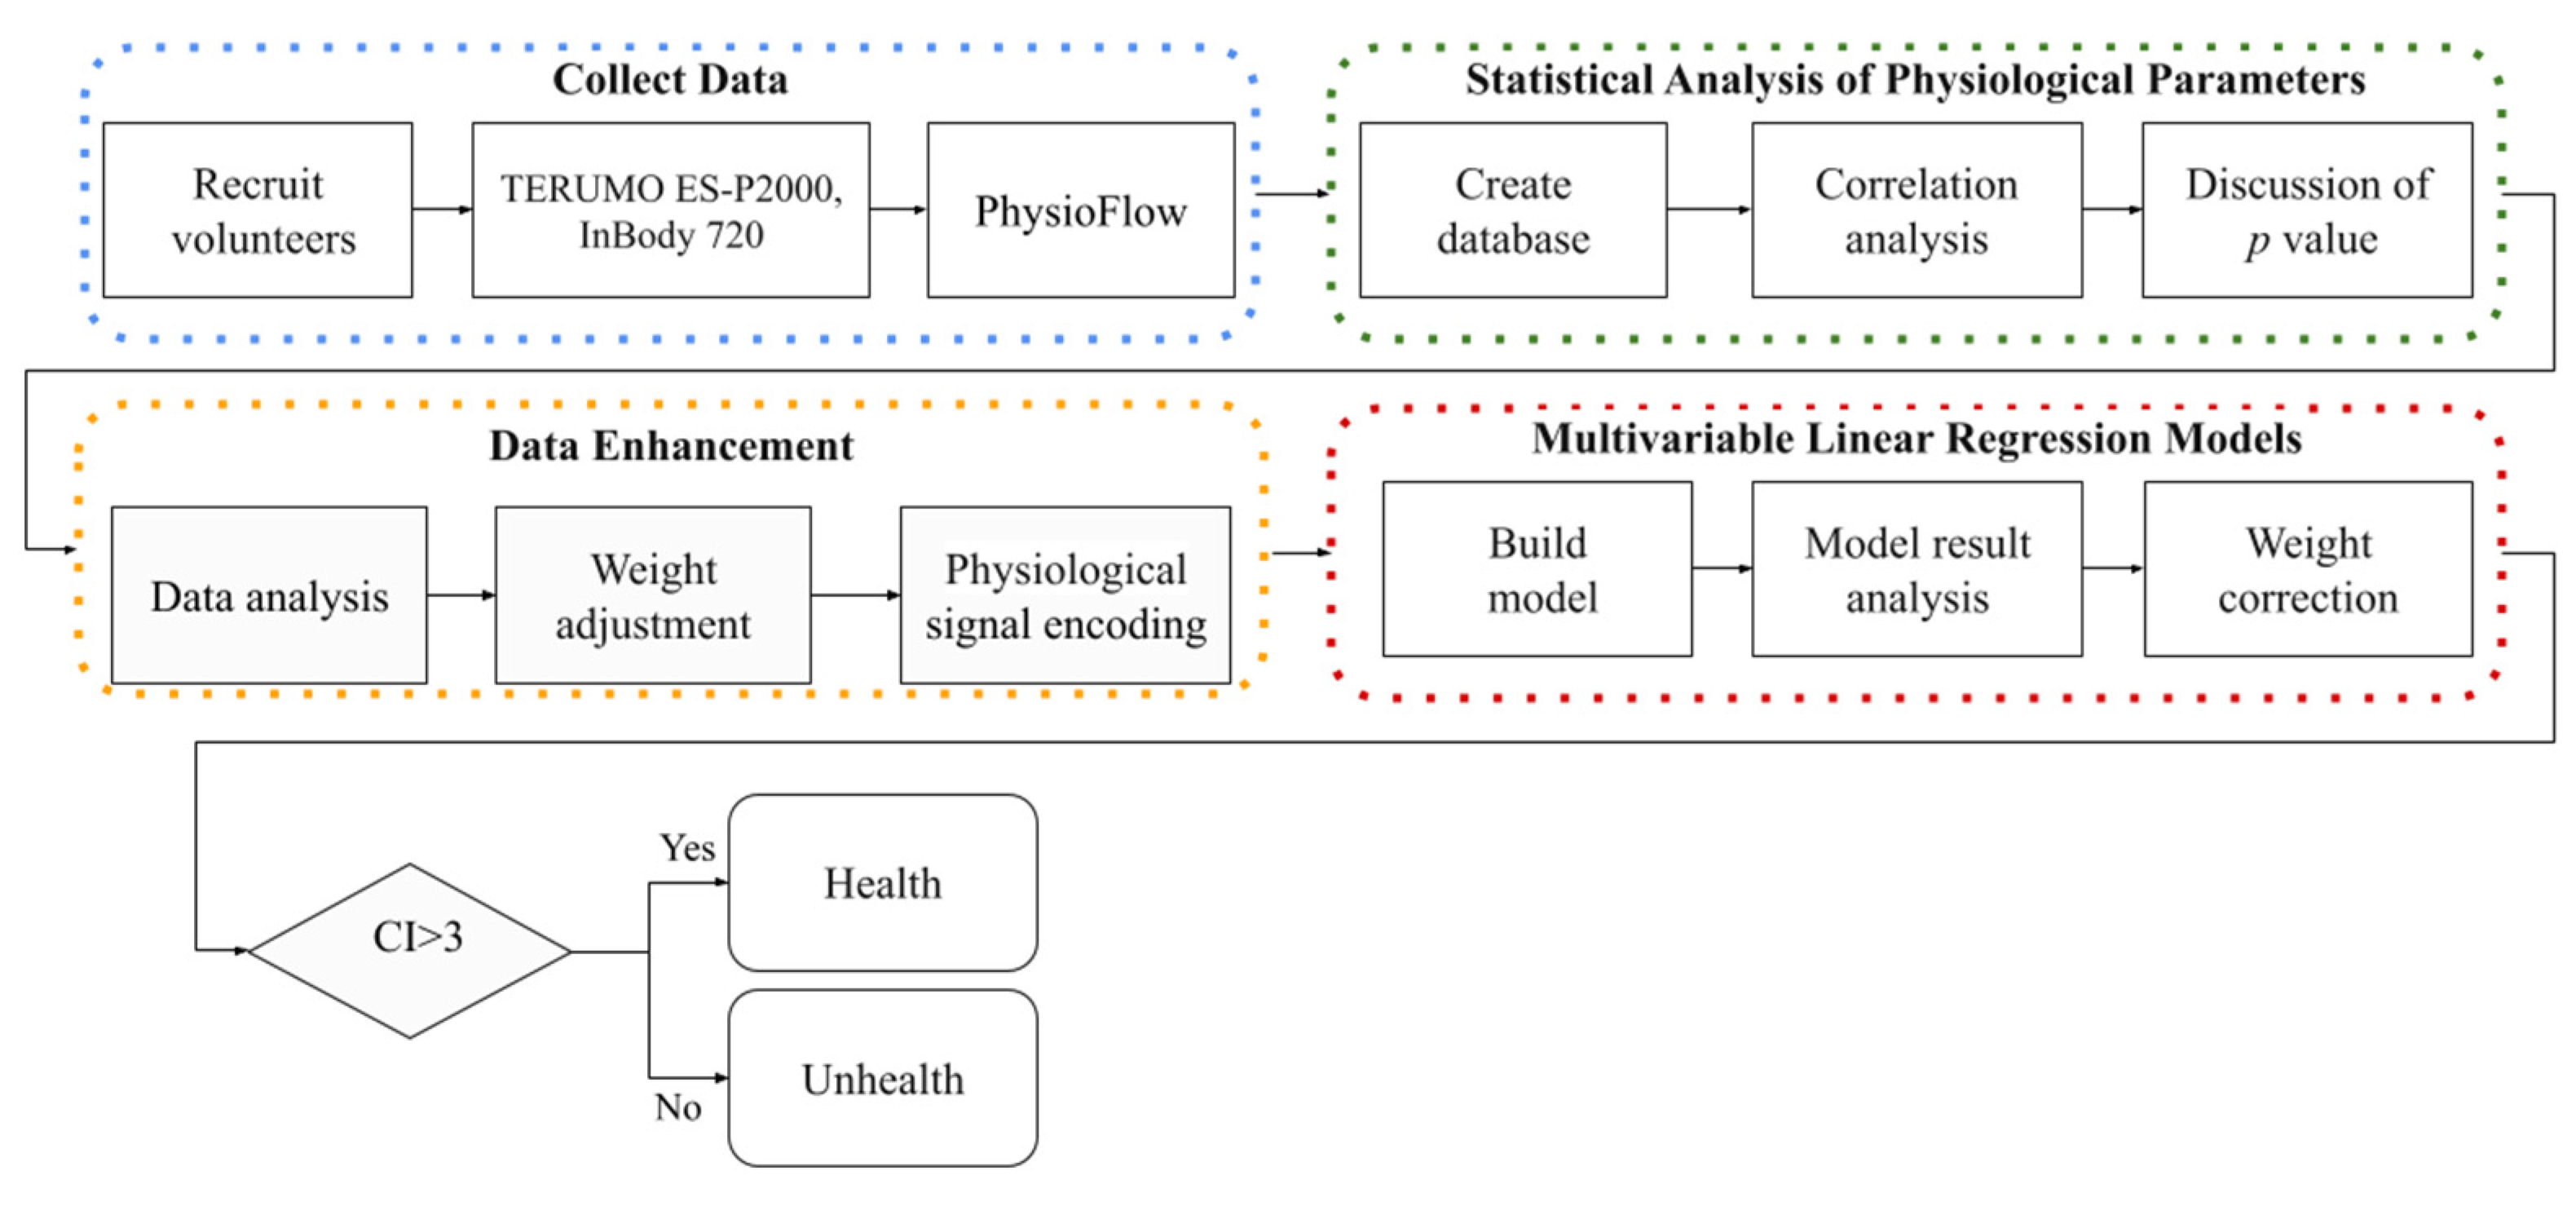
2. Materials and Methods
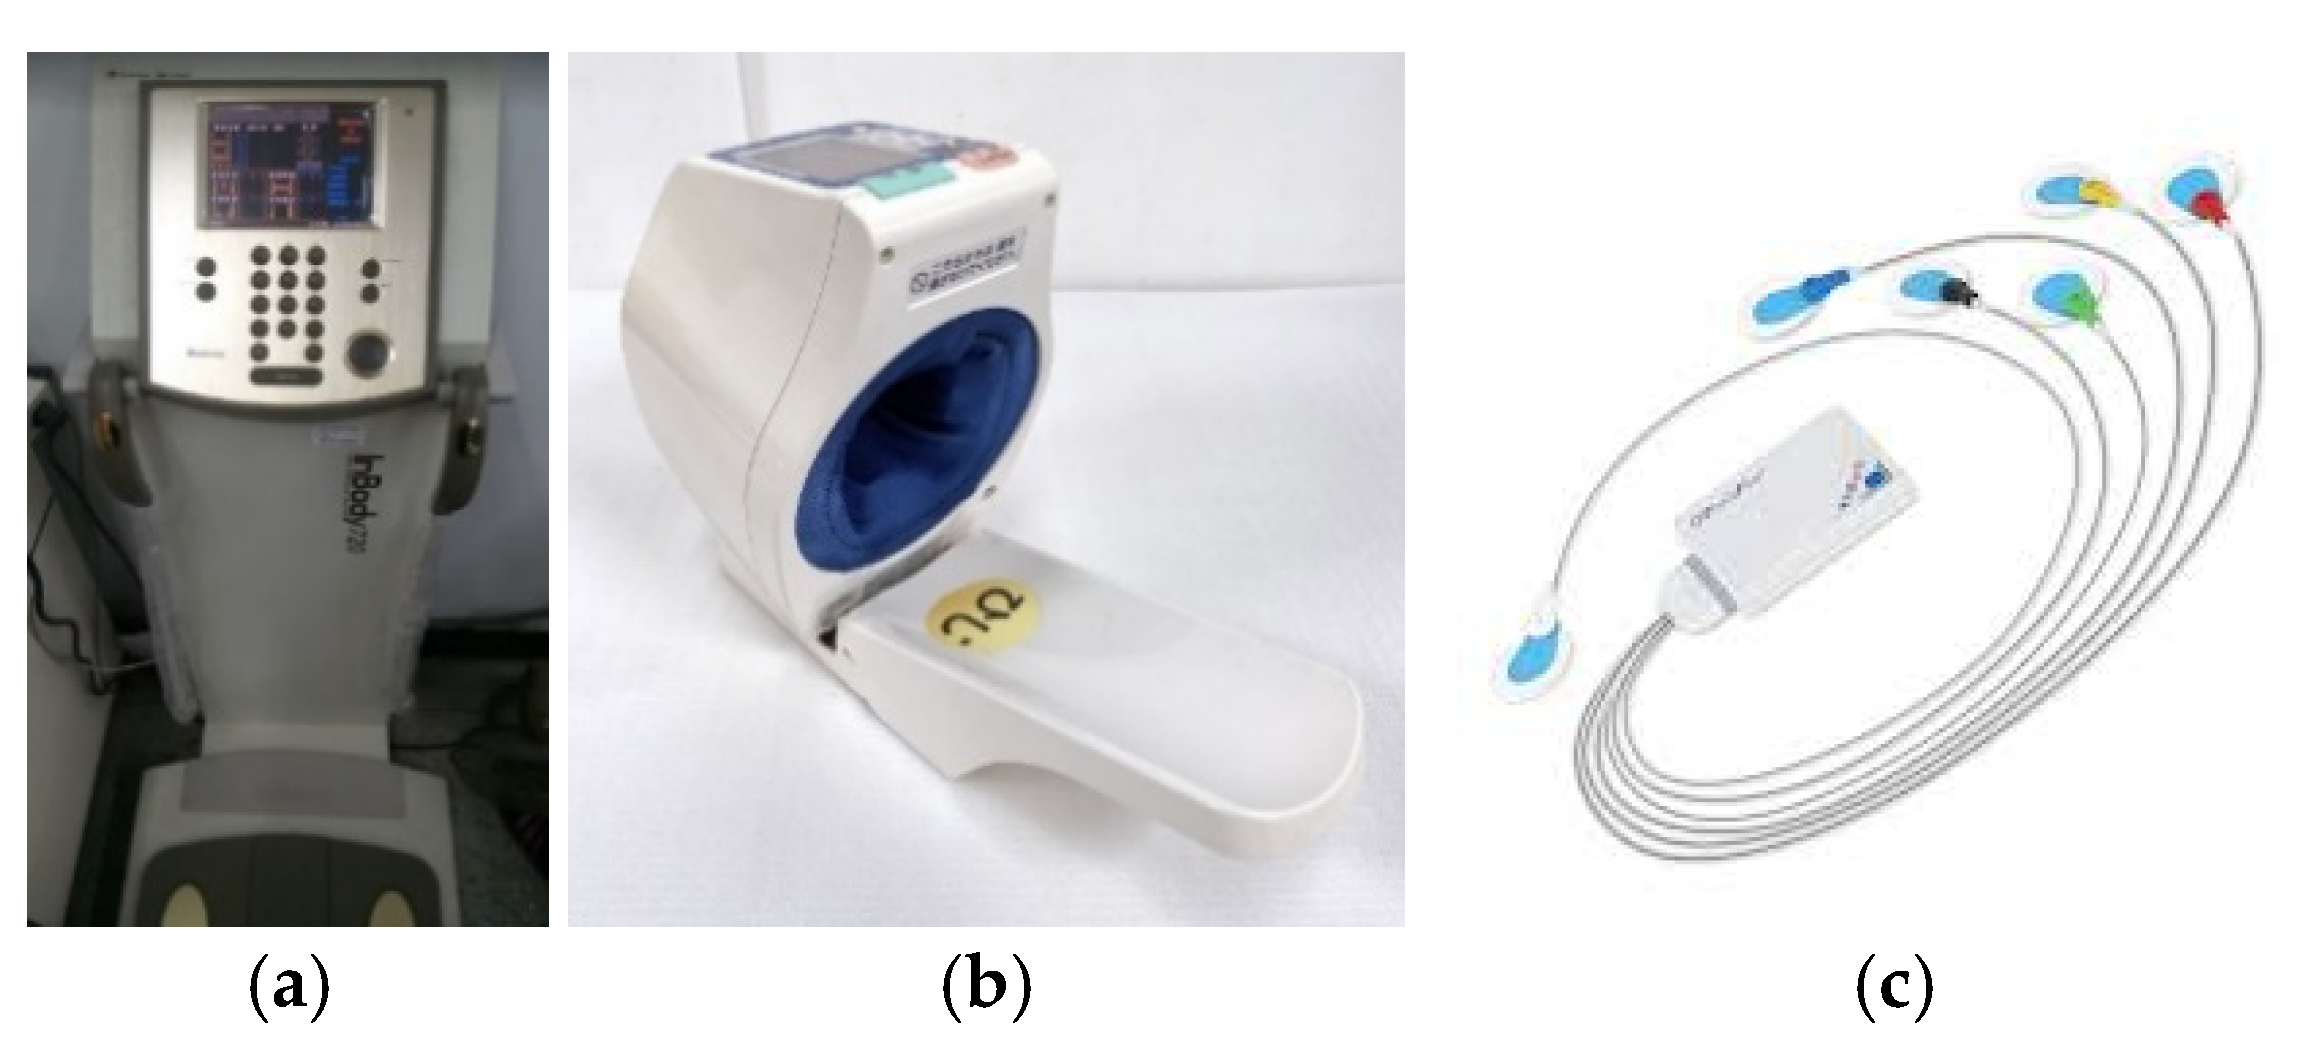
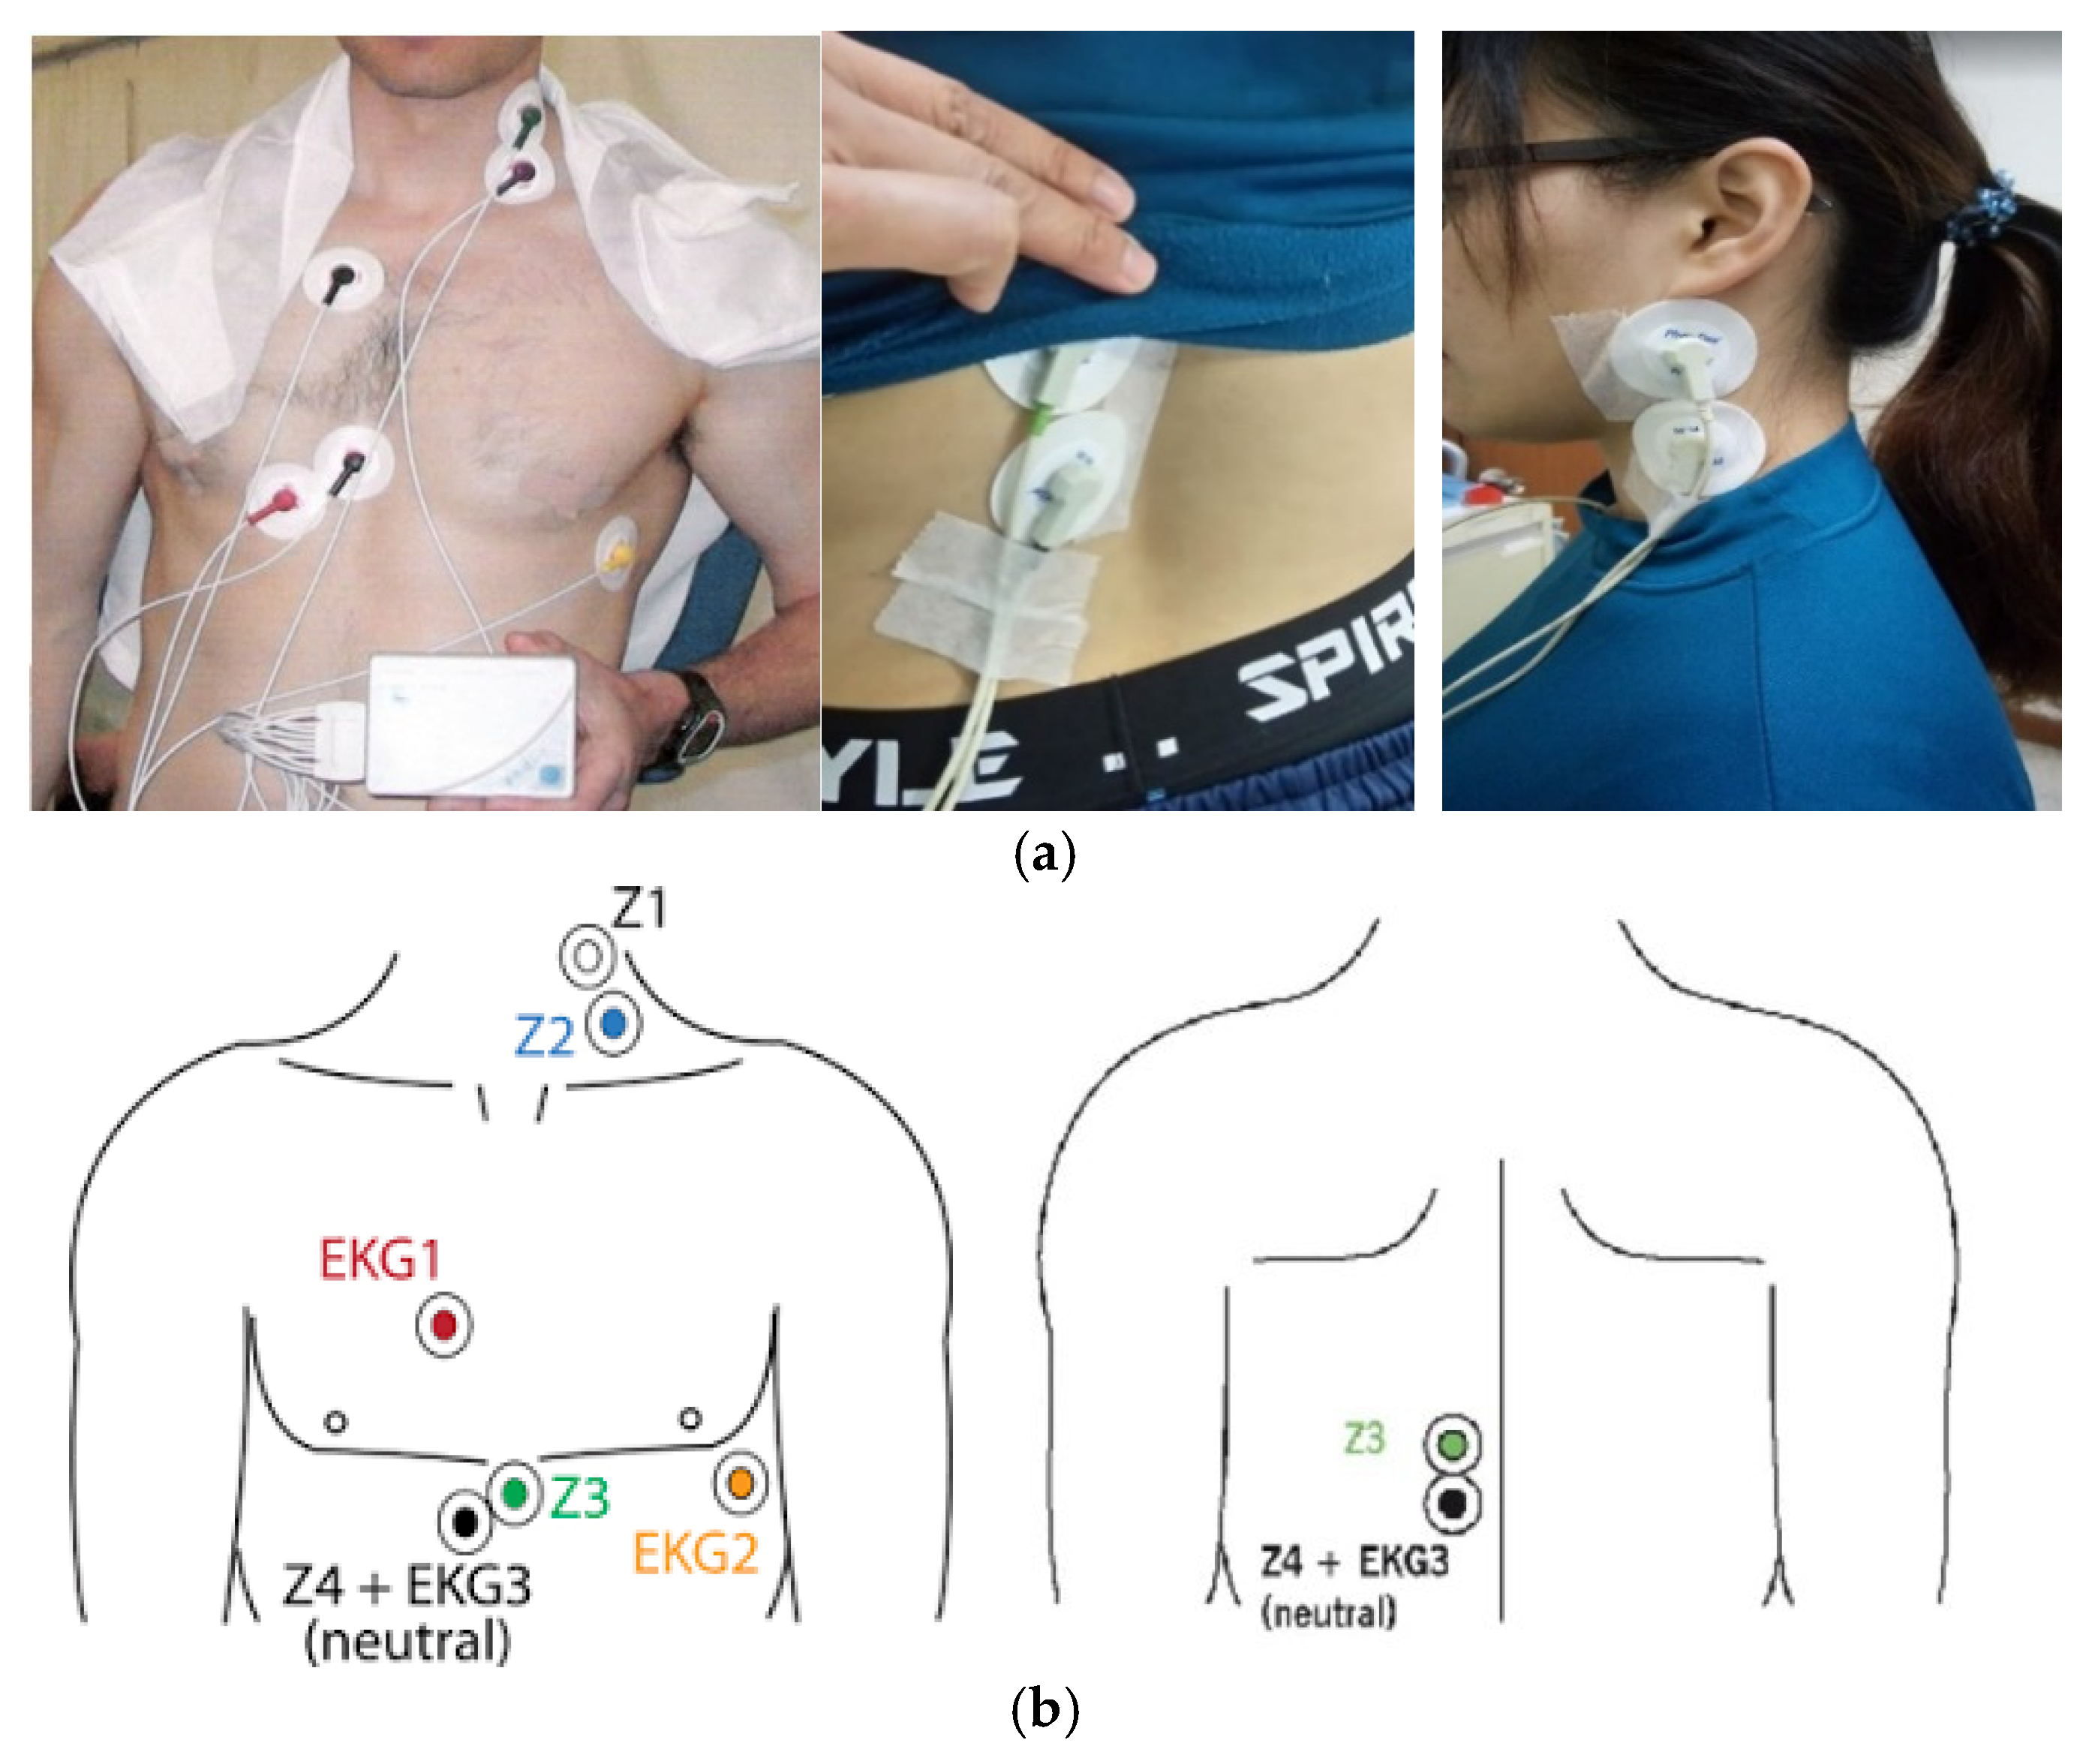
2.1. Collecting Data
2.2. Statistical Analysis of Physiological Parameters
2.3. Data Enhancement
- For HRs below the midpoint:
- b.
- For HRs above the midpoint:
| Algorithm 1. Data Enhancement for CI Prediction. |
| Input: HR, BMI, Additional Physiological Signals (SV, SVI, CO) Output: Preprocessed data for model, Significant parameters for CI prediction Optimal parameter combinations for accurate CI prediction #Step 1: Collect and preprocess the data 1.1 Collect HR, BMI, SV, SVI, CO data 1.2 Preprocess the data for model input #Step 2: Statistical analysis to find significant parameters 2.1 For each physiological parameter in [HR, BMI, SV, SVI, CO]: 2.1.1 Calculate correlation with CI 2.1.2 If p-value < threshold (0.05): 2.1.2.1 Assign higher weight to the parameter in the model #Step 3: Test different parameter combinations for CI prediction 3.1 Combinations to test: 3.1.1 HR + BMI 3.1.2 HR + BMI + 1 physiological signal (SV, SVI, or CO) 3.1.3 HR + BMI + 2 physiological signals 3.1.4 HR + BMI + 3 physiological signals 3.2 Goal: Find the minimum number of parameters for accurate CI prediction #Step 4: Conversion of HR to RGB Code Function: convert_HR_to_RGB(hr_value, min_hr, mid_hr, max_hr, min_rgb, mid_rgb, max_rgb) Input: hr_value, min_hr, mid_hr, max_hr, min_rgb, mid_rgb, max_rgb Output: target_rgb 4.1 If hr_value < mid_hr: 4.1.1 Normalize HR: norm_hr = (hr_value − min_hr)/(mid_hr − min_hr) 4.1.2 Compute target RGB: target_rgb = min_rgb + norm_hr * (mid_rgb − min_rgb) 4.2 Else: 4.2.1 Normalize HR: norm_hr = (hr_value − mid_hr)/(max_hr − mid_hr) 4.2.2 Compute target RGB: target_rgb = mid_rgb + norm_hr * (max_rgb − mid_rgb) 4.3 Return target_rgb |
2.4. Multivariable Linear Regression Models
| Algorithm 2. Multivariable Linear Regression CI Prediction. |
| #Define Model Input: Physiological parameters (X1, X2, …, Xn) Output: CI Equation: Y = β0 + β1X1 + β2X2 + … + βnXn Where: - Y = CI - β0 = Intercept - β1 to βn = Regression coefficients #Data Collection Input: Physiological parameters dataset (X1, X2, …, Xn) Output: Raw data for model training #Data Augmentation a. Increase data quantity and diversity using augmentation techniques b. Train the model on augmented data to enhance feature learning #Model Training a. Train the MLR model using the processed data b. Optimize model parameters (β0, β1, …, βn) for best fit using an optimization method such as Stochastic Gradient Descent (SGD). #Prediction Input: Physiological parameters (X1, X2, …, Xn) Output: Predicted CI Predicted CI = Y #Health Status Assessment a. If 2.5 ≤ Predicted CI ≤ 4: - Output: “Subject is healthy, good cardiac status.” b. Else: - Output: "Health risk detected, further medical examination needed." End Algorithm |
3. Results
3.1. Result of Statistical Analysis of Parameters
3.2. Result of MLR Models
4. Discussion
5. Conclusions
Author Contributions
Funding
Institutional Review Board Statement
Informed Consent Statement
Data Availability Statement
Conflicts of Interest
References
- Masoudkabir, F.; Mohammadifard, N.; Mani, A.; Ignaszewski, A.; Davis, M.K.; Vaseghi, G.; Mansourian, M.; Franco, C.; Gotay, C.; Sarrafzadegan, N. Shared Lifestyle-Related Risk Factors of Cardiovascular Disease and Cancer: Evidence for Joint Prevention. Sci. World J. 2023, 2023, 2404806. [Google Scholar] [CrossRef] [PubMed]
- Ghodeshwar, G.K.; Dube, A.; Khobragade, D.; Ghodeshwar, G.K.; Dube, A.H.; Khobragade, D. Impact of Lifestyle Modifications on Cardiovascular Health: A Narrative Review. Cureus 2023, 15, e42616. [Google Scholar] [CrossRef]
- Mendis, S. Global progress in prevention of cardiovascular disease. Cardiovasc. Diagn. Ther. 2017, 7 (Suppl. 1), S32–S38. [Google Scholar] [CrossRef]
- Manavi, T.; Zafar, H.; Sharif, F. An Era of Digital Healthcare—A Comprehensive Review of Sensor Technologies and Telehealth Advancements in Chronic Heart Failure Management. Sensors 2024, 24, 2546. [Google Scholar] [CrossRef] [PubMed]
- Després, J.P. Obesity and Cardiovascular Disease: Weight Loss Is Not the Only Target. Can. J. Cardiol. 2015, 31, 216–222. [Google Scholar] [CrossRef]
- Czapla, M.; Karniej, P.; Juárez-Vela, R.; Łokieć, K. The Association between Nutritional Status and In-Hospital Mortality among Patients with Acute Coronary Syndrome—A Result of the Retrospective Nutritional Status Heart Study (NSHS). Nutrients 2020, 12, 3091. [Google Scholar] [CrossRef] [PubMed]
- Hall, J.E.; do Carmo, J.M.; da Silva, A.A.; Wang, Z.; Hall, M.E. Obesity-Induced Hypertension. Circ. Res. 2015, 116, 991–1006. [Google Scholar] [CrossRef]
- Jin, X.; Qiu, T.; Li, L.; Yu, R.; Chen, X.; Li, C.; Proud, C.G.; Jiang, T. Pathophysiology of obesity and its associated diseases. Acta Pharm. Sin. B 2023, 13, 2403–2424. [Google Scholar] [CrossRef]
- Bendor, C.D.; Bardugo, A.; Pinhas-Hamiel, O.; Afek, A.; Twig, G. Cardiovascular morbidity, diabetes and cancer risk among children and adolescents with severe obesity. Cardiovasc. Diabetol. 2020, 19, 79. [Google Scholar] [CrossRef]
- Blüher, M. Metabolically Healthy Obesity. Endocr. Rev. 2020, 41, bnaa004. [Google Scholar] [CrossRef]
- Volpe, M.; Gallo, G. Obesity and cardiovascular disease: An executive document on pathophysiological and clinical links promoted by the Italian Society of Cardiovascular Prevention (SIPREC). Front. Cardiovasc. Med. 2023, 10, 1136340. [Google Scholar] [CrossRef]
- Manickam, P.; Mariappan, S.A.; Murugesan, S.M.; Hansda, S.; Kaushik, A.; Shinde, R.; Thipperudraswamy, S.P. Artificial Intelligence (AI) and Internet of Medical Things (IoMT) Assisted Biomedical Systems for Intelligent Healthcare. Biosensors 2022, 12, 562. [Google Scholar] [CrossRef]
- Rejeb, A.; Rejeb, K.; Treiblmaier, H.; Appolloni, A.; Alghamdi, S.; Alhasawi, Y.; Iranmanesh, M. The Internet of Things (IoT) in healthcare: Taking stock and moving forward. Internet Things 2023, 22, 100721. [Google Scholar] [CrossRef]
- Osama, M.; Ateya, A.A.; Sayed, M.S.; Hammad, M.; Pławiak, P.; El-Latif, A.A.A.; Elsayed, R.A. Internet of Medical Things and Healthcare 4.0: Trends, Requirements, Challenges, and Research Directions. Sensors 2023, 23, 7435. [Google Scholar] [CrossRef] [PubMed]
- Almujally, N.A.; Aljrees, T.; Saidani, O.; Umer, M.; Bin Faheem, Z.; Abuzinadah, N.; Alnowaiser, K.; Ashraf, I. Monitoring Acute Heart Failure Patients Using Internet-of-Things-Based Smart Monitoring System. Sensors 2023, 23, 4580. [Google Scholar] [CrossRef]
- Giordano, N.; Rosati, S.; Balestra, G.; Knaflitz, M. A Wearable Multi-Sensor Array Enables the Recording of Heart Sounds in Homecare. Sensors 2023, 23, 6241. [Google Scholar] [CrossRef]
- Shumba, A.T.; Montanaro, T.; Sergi, I.; Bramanti, A.; Ciccarelli, M.; Rispoli, A.; Carrizzo, A.; De Vittorio, M.; Patrono, L. Wearable Technologies and AI at the Far Edge for Chronic Heart Failure Prevention and Management: A Systematic Review and Prospects. Sensors 2023, 23, 6896. [Google Scholar] [CrossRef] [PubMed]
- Nishimoto, M.; Tagawa, M.; Matsui, M.; Eriguchi, M.; Samejima, K.-I.; Iseki, K.; Iseki, C.; Asahi, K.; Yamagata, K.; Konta, T.; et al. A Prediction Model with Lifestyle in Addition to Previously Known Risk Factors Improves Its Predictive Ability for Cardiovascular Death. Sci. Rep. 2019, 9, 12953. [Google Scholar] [CrossRef]
- Koh, H.B.; Heo, G.Y.; Kim, K.W.; Ha, J.; Park, J.T.; Han, S.H.; Yoo, T.-H.; Kang, S.-W.; Kim, H.W. Trends in the association between body mass index and blood pressure among 19-year-old men in Korea from 2003 to 2017. Sci. Rep. 2022, 12, 6767. [Google Scholar] [CrossRef]
- Sanghavi, F.; Jinadu, O.; Oludare, V.; Panetta, K.; Kezebou, L.; Roberts, S.B. An Individualized Machine Learning Approach for Human Body Weight Estimation Using Smart Shoe Insoles. Sensors 2023, 23, 7418. [Google Scholar] [CrossRef]
- Victor, O.A.; Chen, Y.; Ding, X. Non-Invasive Heart Failure Evaluation Using Machine Learning Algorithms. Sensors 2024, 24, 2248. [Google Scholar] [CrossRef] [PubMed]
- Huang, C.; Wang, J.; Wang, S.; Zhang, Y. Internet of medical things: A systematic review. Neurocomputing 2023, 557, 126719. [Google Scholar] [CrossRef]
- Muthulakshmi, M.; Kavitha, G. Deep CNN with LM learning based myocardial ischemia detection in cardiac magnetic resonance images. In Proceedings of the 2019 41st Annual International Conference of the IEEE Engineering in Medicine and Biology Society (EMBC), Berlin, Germany, 23–27 July 2019; Volume 2019, pp. 824–827. [Google Scholar] [CrossRef]
- Sangeetha, R.G.; Sreevatsan, B.; Kumar, V. Cardiac arrhythmia detection using artificial neural network. Heliyon 2024, 10, e33089. [Google Scholar] [CrossRef]
- Lai, K.; Wang, X.; Cao, C. A Continuous Non-Invasive Blood Pressure Prediction Method Based on Deep Sparse Residual U-Net Combined with Improved Squeeze and Excitation Skip Connections. Sensors 2024, 24, 2721. [Google Scholar] [CrossRef] [PubMed]
- Lavie, C.J.; Milani, R.V.; Ventura, H.O. Obesity and Cardiovascular Disease: Risk Factor, Paradox, and Impact of Weight Loss. J. Am. Coll. Cardiol. 2009, 53, 1925–1932. [Google Scholar] [CrossRef]
- Chen, S.L.; Ma, E.D. VLSI Implementation of an Adaptive Edge-Enhanced Color Interpolation Processor for Real-Time Video Applications. IEEE Trans. Circuits Syst. Video Technol. 2014, 24, 1982–1991. [Google Scholar] [CrossRef]
- Khalil, M.; Sharif, M.I.; Naeem, A.; Chaudhry, M.U.; Rauf, H.T.; Ragab, A.E. Deep Learning-Enhanced Brain Tumor Prediction via Entropy-Coded BPSO in CIELAB Color Space. Comput. Mater. Contin. 2023, 77, 2031–2047. [Google Scholar] [CrossRef]
- Ali, S.; Abuhmed, T.; El-Sappagh, S.; Muhammad, K.; Alonso-Moral, J.M.; Confalonieri, R.; Guidotti, R.; Del Ser, J.; Díaz-Rodríguez, N.; Herrera, F. Explainable Artificial Intelligence (XAI): What we know and what is left to attain Trustworthy Artificial Intelligence. Inf. Fusion 2023, 99, 101805. [Google Scholar] [CrossRef]
- Yan, Z.; Zhong, S.; Lin, L.; Cui, Z. Adaptive Levenberg–Marquardt Algorithm: A New Optimization Strategy for Levenberg–Marquardt Neural Networks. Mathematics 2021, 9, 2176. [Google Scholar] [CrossRef]
- Schober, P.; Vetter, T.R. Linear Regression in Medical Research. Anesth. Analg. 2020, 132, 108–109. [Google Scholar] [CrossRef]
- Santiago, C.B.; Guo, J.Y.; Sigman, M.S. Predictive and mechanistic multivariate linear regression models for reaction development. Chem. Sci. 2018, 9, 2398–2412. [Google Scholar] [CrossRef]
- Khaire, U.M.; Dhanalakshmi, R. Stability of feature selection algorithm: A review. J. King Saud. Univ.—Comput. Inf. Sci. 2022, 34, 1060–1073. [Google Scholar] [CrossRef]
- Figueiro-Filho, E.A.; Robinson, N.T.S.; Carvalho, J.; Keunen, J.; Robinson, M.; Maxwell, C. Hemodynamic Assessment of Pregnant People with and without Obesity by Noninvasive Bioreactance: A Pilot Study. AJP Rep. 2022, 12, e69–e75. [Google Scholar] [CrossRef] [PubMed]
- Chicco, D.; Warrens, M.J.; Jurman, G. The coefficient of determination R-squared is more informative than SMAPE, MAE, MAPE, MSE and RMSE in regression analysis evaluation. PeerJ Comput. Sci. 2021, 7, e623. [Google Scholar] [CrossRef] [PubMed]


| 10 min | 3 min | 10 min | 5 min | 20 min |
| Sit and rest | Blood pressure | Paste electrodes | Sit and rest | Detection of cardiac hemodynamic parameters |
| Parameter | Description | Formula | Reference Value |
|---|---|---|---|
| Stroke Volume (SV) (mL) | The volume of blood ejected by the heart per beat. | 70 mL | |
| Stroke volume index (SVI) (mL/m2) | Stroke volume per body surface area. | 40–50 mL/m2 | |
| Cardiac Output (CO) (L/min) | The amount of blood ejected by the left ventricle per minute. | 4.0–6.5 L/min | |
| Cardiac Index (CI) (L/min/m2) | Cardiac output per minute per body surface area. | 3 L/min/m2 | |
| End Diastolic Volume (EDV) (mL) | The volume of blood when the left ventricles are filled with oxygenated blood. | 108 + 24 mL | |
| End Systolic Volume (ESV) (mL) | The amount of blood remaining in the ventricle after ejection. | 45 + 46 mL | |
| Ejection Fraction % (EF%) | The ratio of the volume of blood ejected from each ventricle. | 65–70% |
| Level | Range |
|---|---|
| Normal Value | 67% |
| Low Risk | >50% |
| Moderate Risk | 35–49% |
| High Risk | <35% |
| LV Dysfunction | <40% |
| M ± SD | Min | Max | |
|---|---|---|---|
| Age | 21.72 ± 1.78 | 20 | 29 |
| Height | 159.41 ± 5.21 | 147 | 171 |
| Body Weight | 75.81 ± 8.76 | 62 | 103.9 |
| BMI | 29.61 ± 3.42 | 24.22 | 40.59 |
| Waist Circumference | 87.03 ± 9.45 | 70 | 122 |
| Hip Circumference | 106.24 ± 8.9 | 94 | 155.5 |
| Waist-to-Hip ratio | 0.82 ± 0.07 | 0.62 | 1.04 |
| Parameters | Unit | Value (M ± SD) | r | p | |
|---|---|---|---|---|---|
| Body Weight | (kg) | 75.81 ± 8.76 | |||
| Blood Pressure Values | SBP | (mmHg) | 111.83 ± 13.18 | 0.363 | 0.007 ** |
| DBP | (mmHg) | 69.09 ± 11.32 | 0.068 | 0.625 | |
| HR | (bpm) | 88.61 ± 13.48 | 0.228 | 0.097 | |
| PP | (mmHg) | 42.74 ± 13.77 | 0.292 | 0.032 * | |
| MAP | (mmHg) | 83.34 ± 10.05 | 0.209 | 0.129 | |
| Body Weight | SBP | DBP | HR | PP | MAP | |
|---|---|---|---|---|---|---|
| Body Weight | 1 | 0.363 ** | 0.068 | 0.228 | 0.292 * | 0.209 |
| SBP | 1 | 0.376 ** | 0.305 * | 0.648 ** | 0.719 ** | |
| DBP | 1 | −0.076 | −0.462 ** | 0.915 ** | ||
| HR | 1 | 0.355 ** | 0.076 | |||
| PP | 1 | −0.063 | ||||
| MAP | 1 |
| Parameters | Unit | Value (M ± SD) | r | p | |
|---|---|---|---|---|---|
| Body Weight | (W) | (kg) | 75.81 ± 8.76 | ||
| Cardiac Hemodynamic | SV | (mL) | 77.48 ± 8.9 | 0.234 | 0.089 |
| SVI | (mL/m2) | 42.14 ± 5.11 | −0.31 | 0.023 * | |
| CO | (L/min) | 6.61 ± 1.1 | 0.238 | 0.084 | |
| CI | (L/min/m2) | 3.59 ± 0.59 | −0.153 | 0.27 | |
| VET | (ms) | 320.55 ± 45.55 | 0.034 | 0.809 | |
| EDV | (mL) | 123.01 ± 16.98 | 0.381 | 0.004 ** | |
| ESV | (mL) | 43.56 ± 11.97 | 0.35 | 0.009 ** | |
| EF% | (%) | 64.75 ± 6.41 | −0.213 | 0.121 |
| Body Weight | SV | SVI | CO | CI | VET | EDV | ESV | EF% | |
|---|---|---|---|---|---|---|---|---|---|
| Body Weight | 1 | 0.234 | −0.310 * | 0.238 | −0.153 | 0.034 | 0.381 ** | 0.350 ** | −0.213 |
| SV | 1 | 0.837 ** | 0.529 ** | 0.445 ** | −0.022 | 0.601 ** | 0.103 | 0.353 ** | |
| SVI | 1 | 0.371 ** | 0.521 ** | −0.035 | 0.361 ** | −0.097 | 0.458 ** | ||
| CO | 1 | 0.914 ** | −0.204 | 0.163 | −0.292 * | 0.593 ** | |||
| CI | 1 | −0.214 | 0.002 | −0.445 ** | 0.694 ** | ||||
| VET | 1 | 0.177 | 0.205 | −0.132 | |||||
| EDV | 1 | 0.796 ** | −0.395 ** | ||||||
| ESV | 1 | −0.858 ** | |||||||
| EF% | 1 |
| Color Space Conversion | ||||
|---|---|---|---|---|
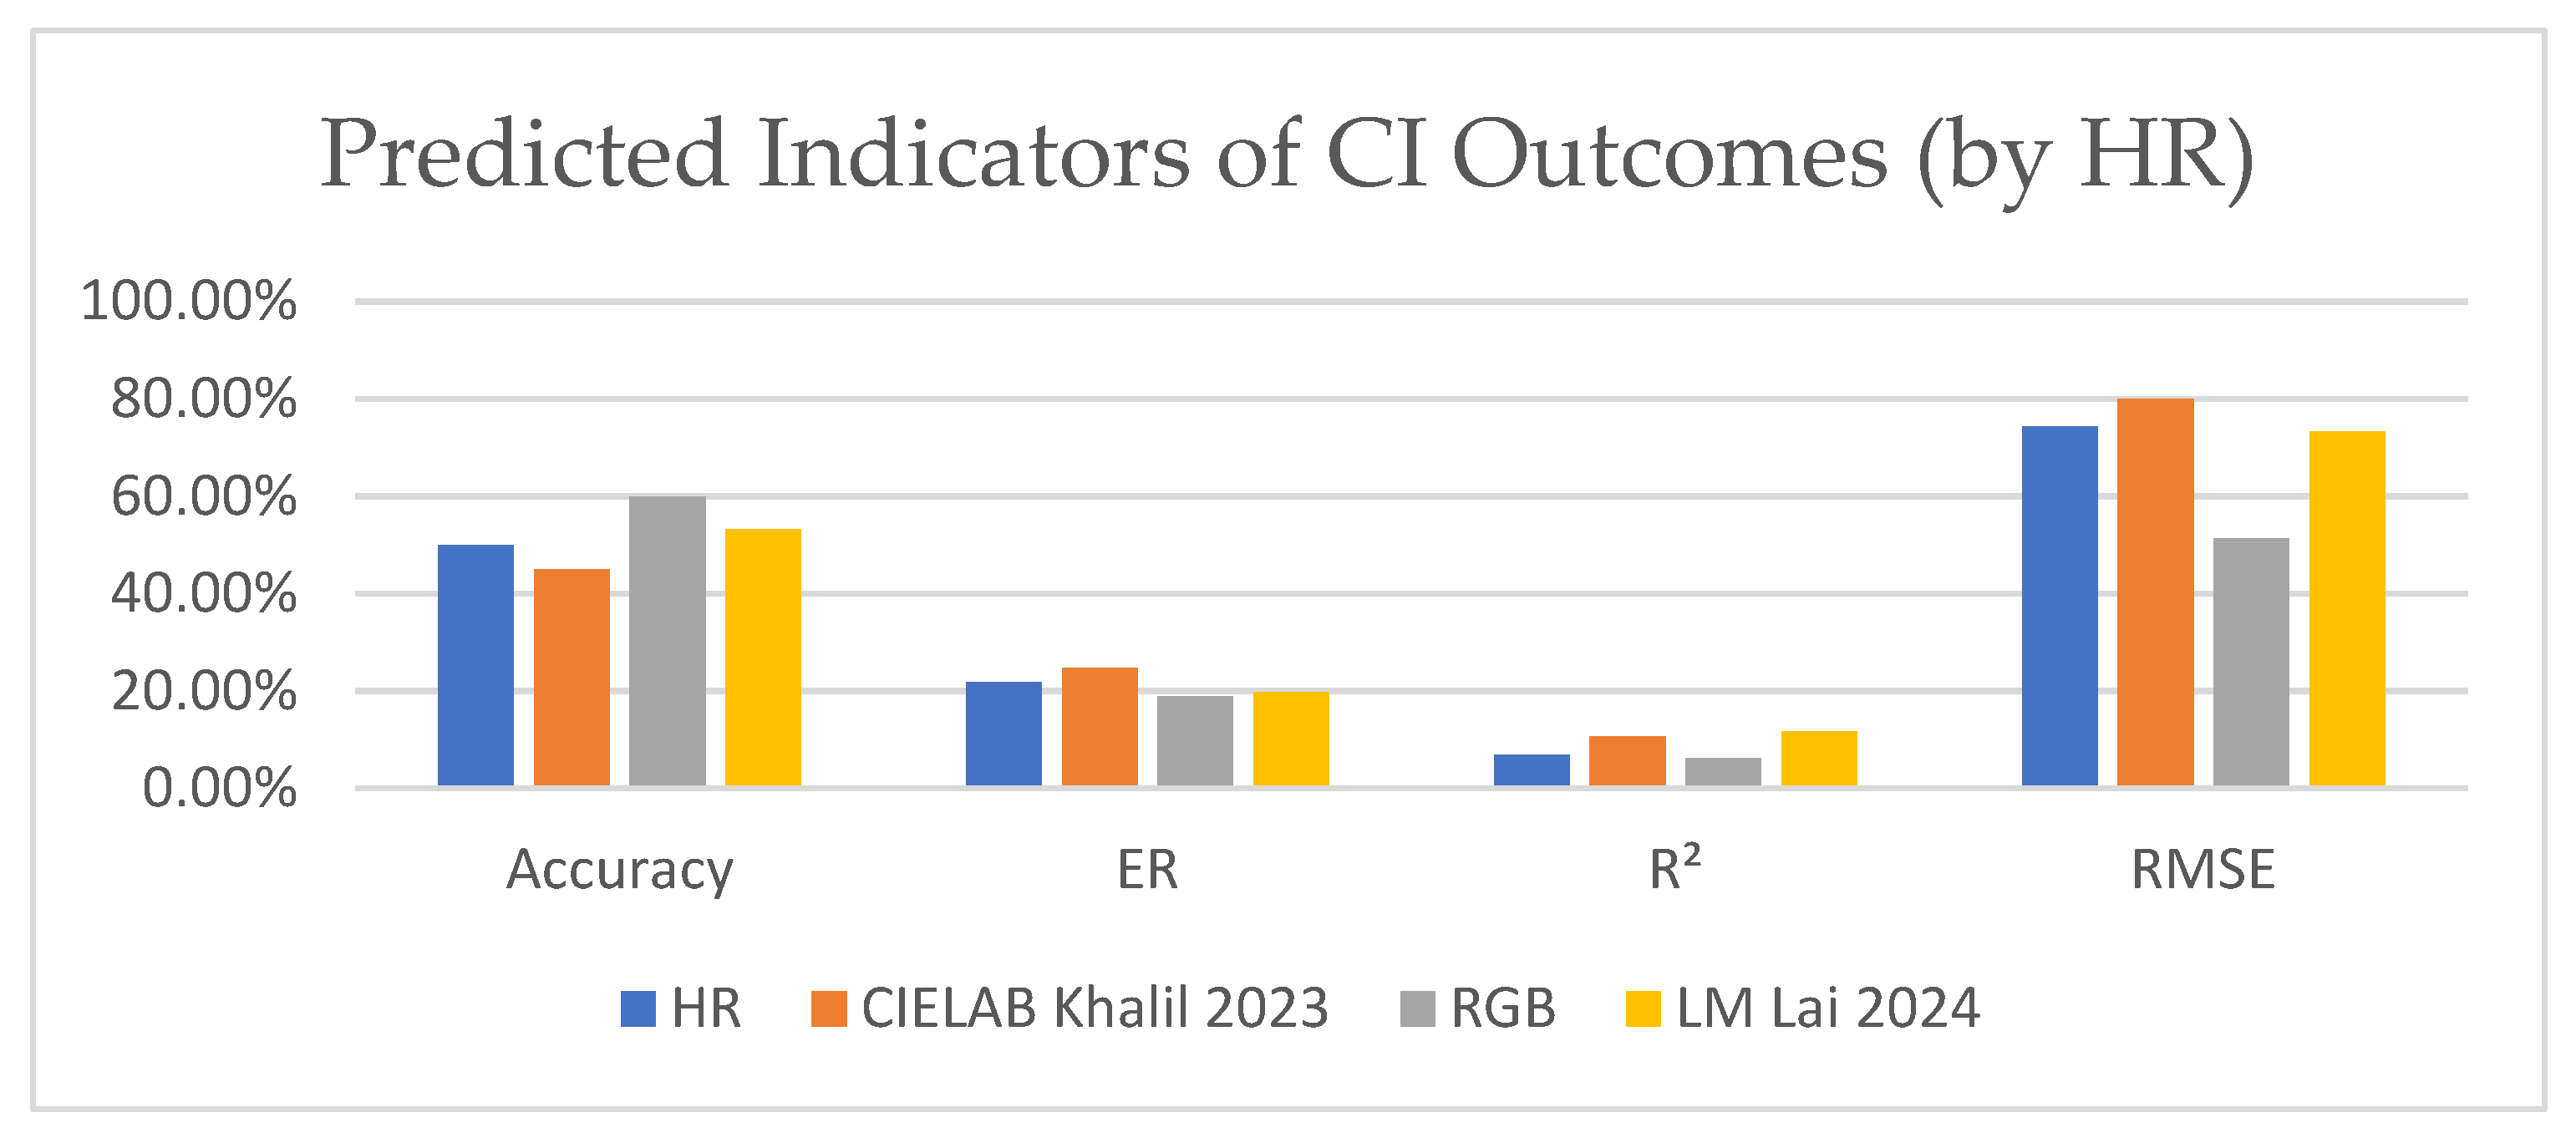
| HR | CIELAB [28] | RGB | LM [25] | |
| Accuracy | 50.00% | 45.00% | 60.00% | 53.33% |
| ER | 21.88% | 24.67% | 18.98% | 19.71% |
| R2 | 0.06933 | 0.10728 | 0.062188 | 0.11772 |
| RMSE | 0.74238 | 0.79957 | 0.51346 | 0.73299 |
| HR + Any Parameter | HR + Any 2 Parameters | HR + 3 Parameters | |||||||
|---|---|---|---|---|---|---|---|---|---|
| HR + SV | HR + SVI | HR + CO | Average | HR + SVI + CO | HR + SV + CO | HR + SV + SVI | Average | HR + SV + SVI + CO | |
| Accuracy | 20.00% | 27.00% | 33.00% | 26.67% | 53.33% | 40.00% | 33.33% | 42.22% | 100.00% |
| ER | 2.09% | 5.27% | 4.12% | 3.83% | 1.90% | 0.15% | 0.46% | 0.84% | 0.00% |
| R2 | 0.34288 | 0.62239 | 0.88123 | 0.6155 | 0.94192 | 0.82482 | 0.52019 | 0.76231 | 0.99595 |
| RMSE | 0.60441 | 0.39152 | 0.22015 | 0.40536 | 0.22459 | 0.21733 | 0.38391 | 0.275276667 | 0.03 |
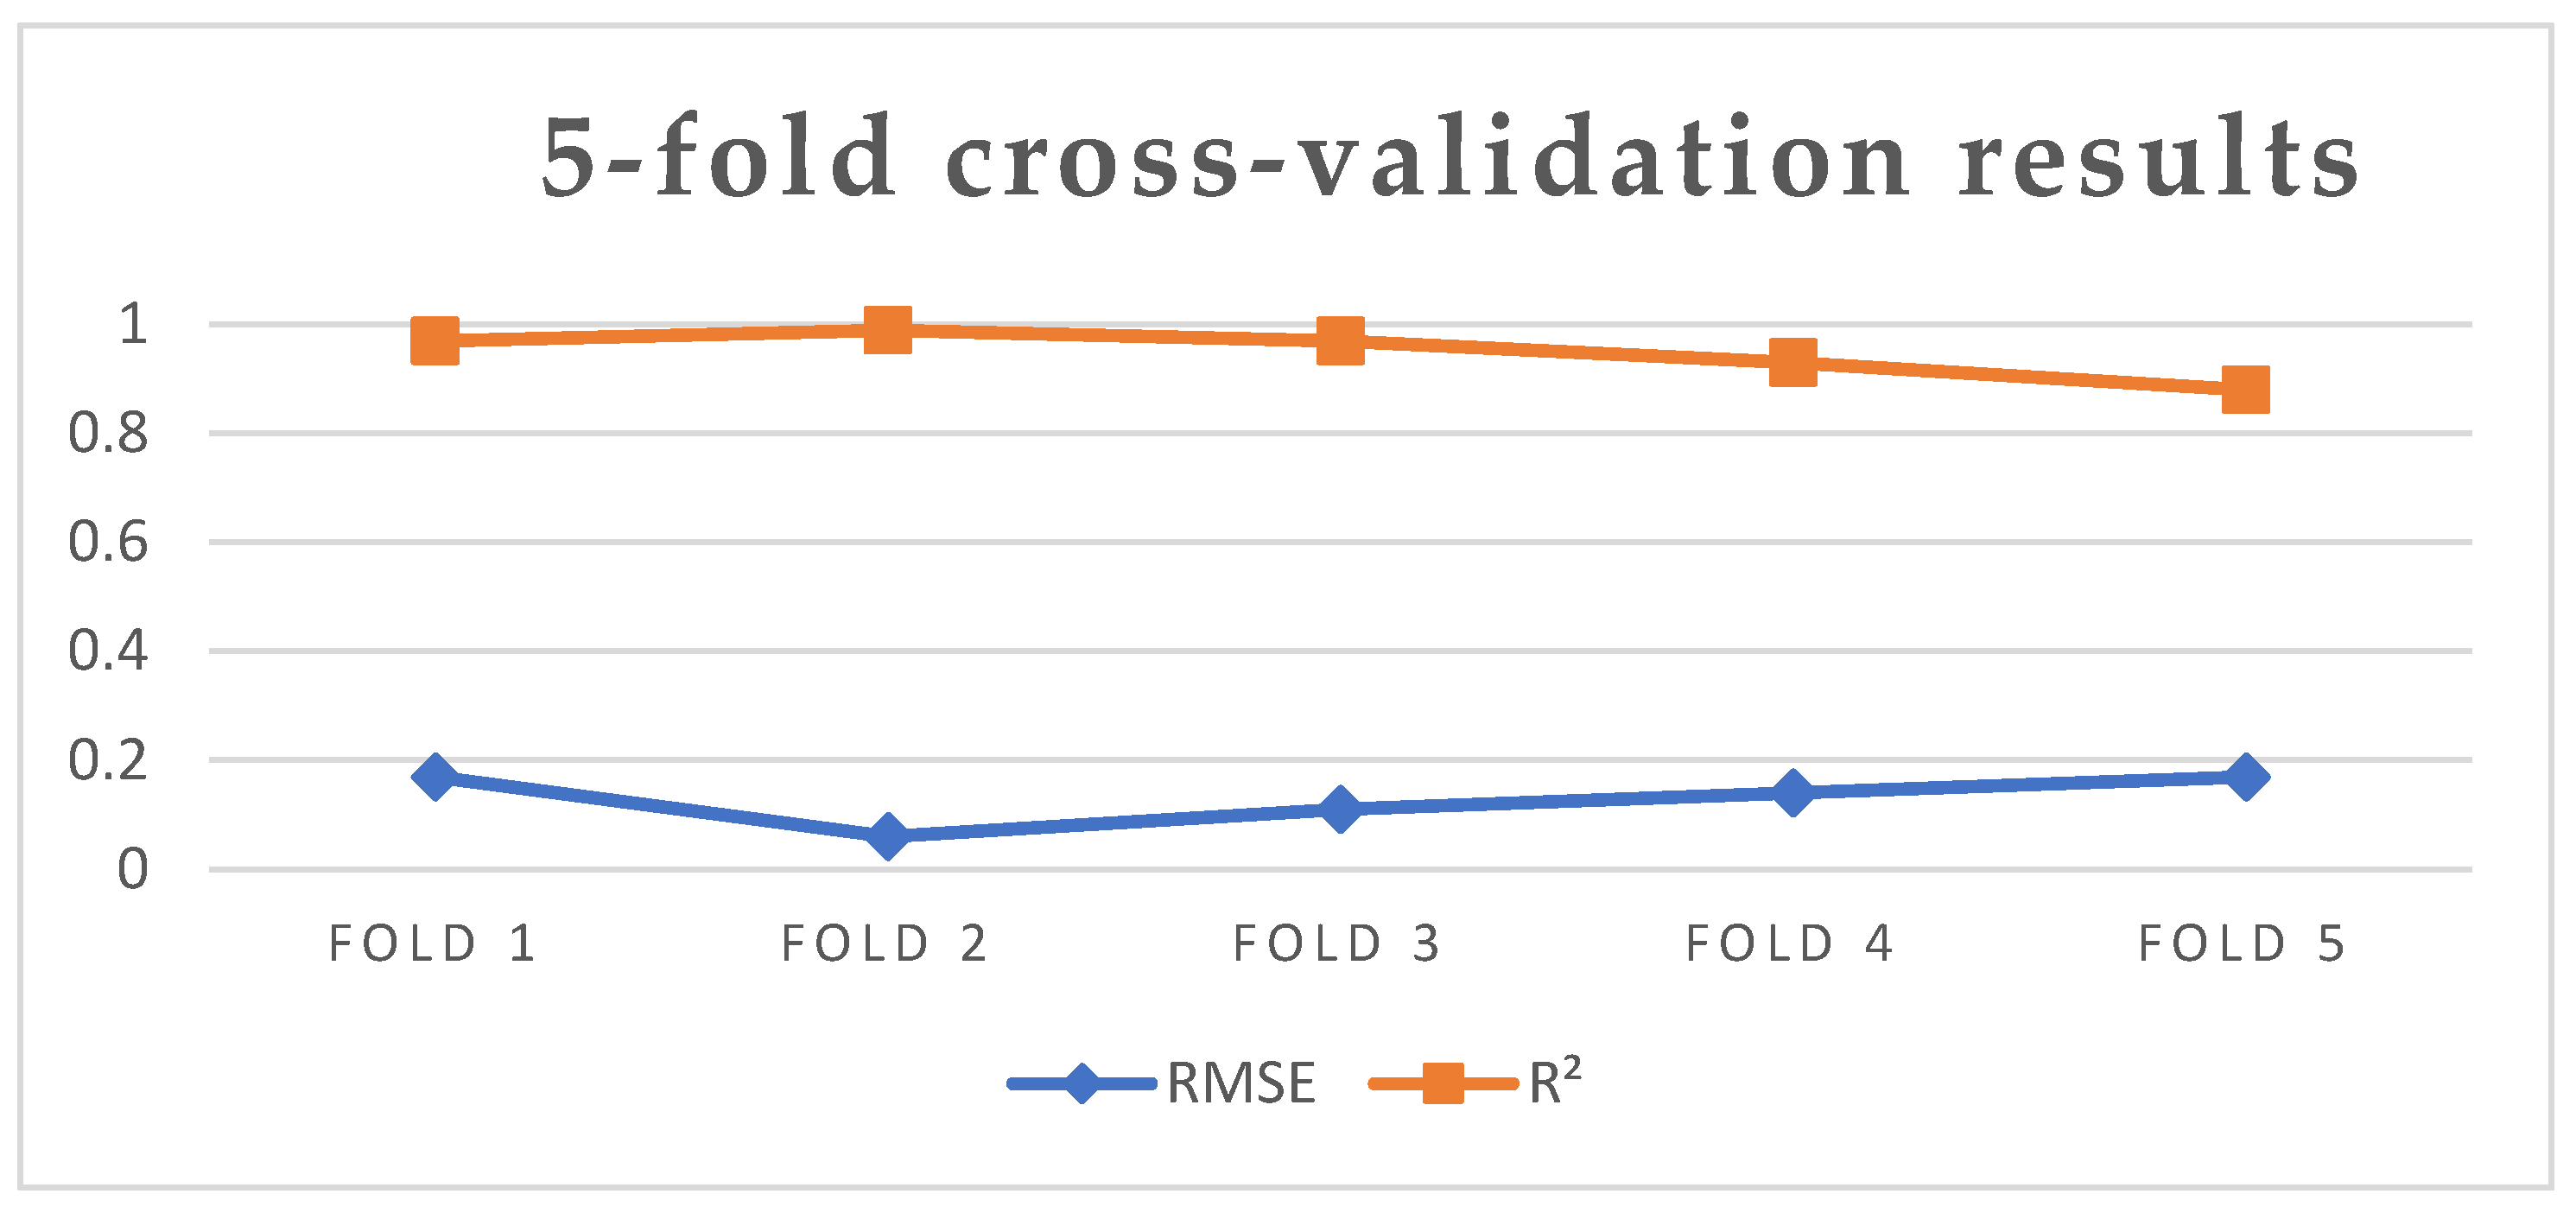
| Fold 1 | Fold 2 | Fold 3 | Fold 4 | Fold 5 | Average | |
|---|---|---|---|---|---|---|
| RMSE | 0.17 | 0.06 | 0.11 | 0.14 | 0.17 | 0.13 |
| R2 | 0.97 | 0.99 | 0.97 | 0.93 | 0.88 | 0.95 |
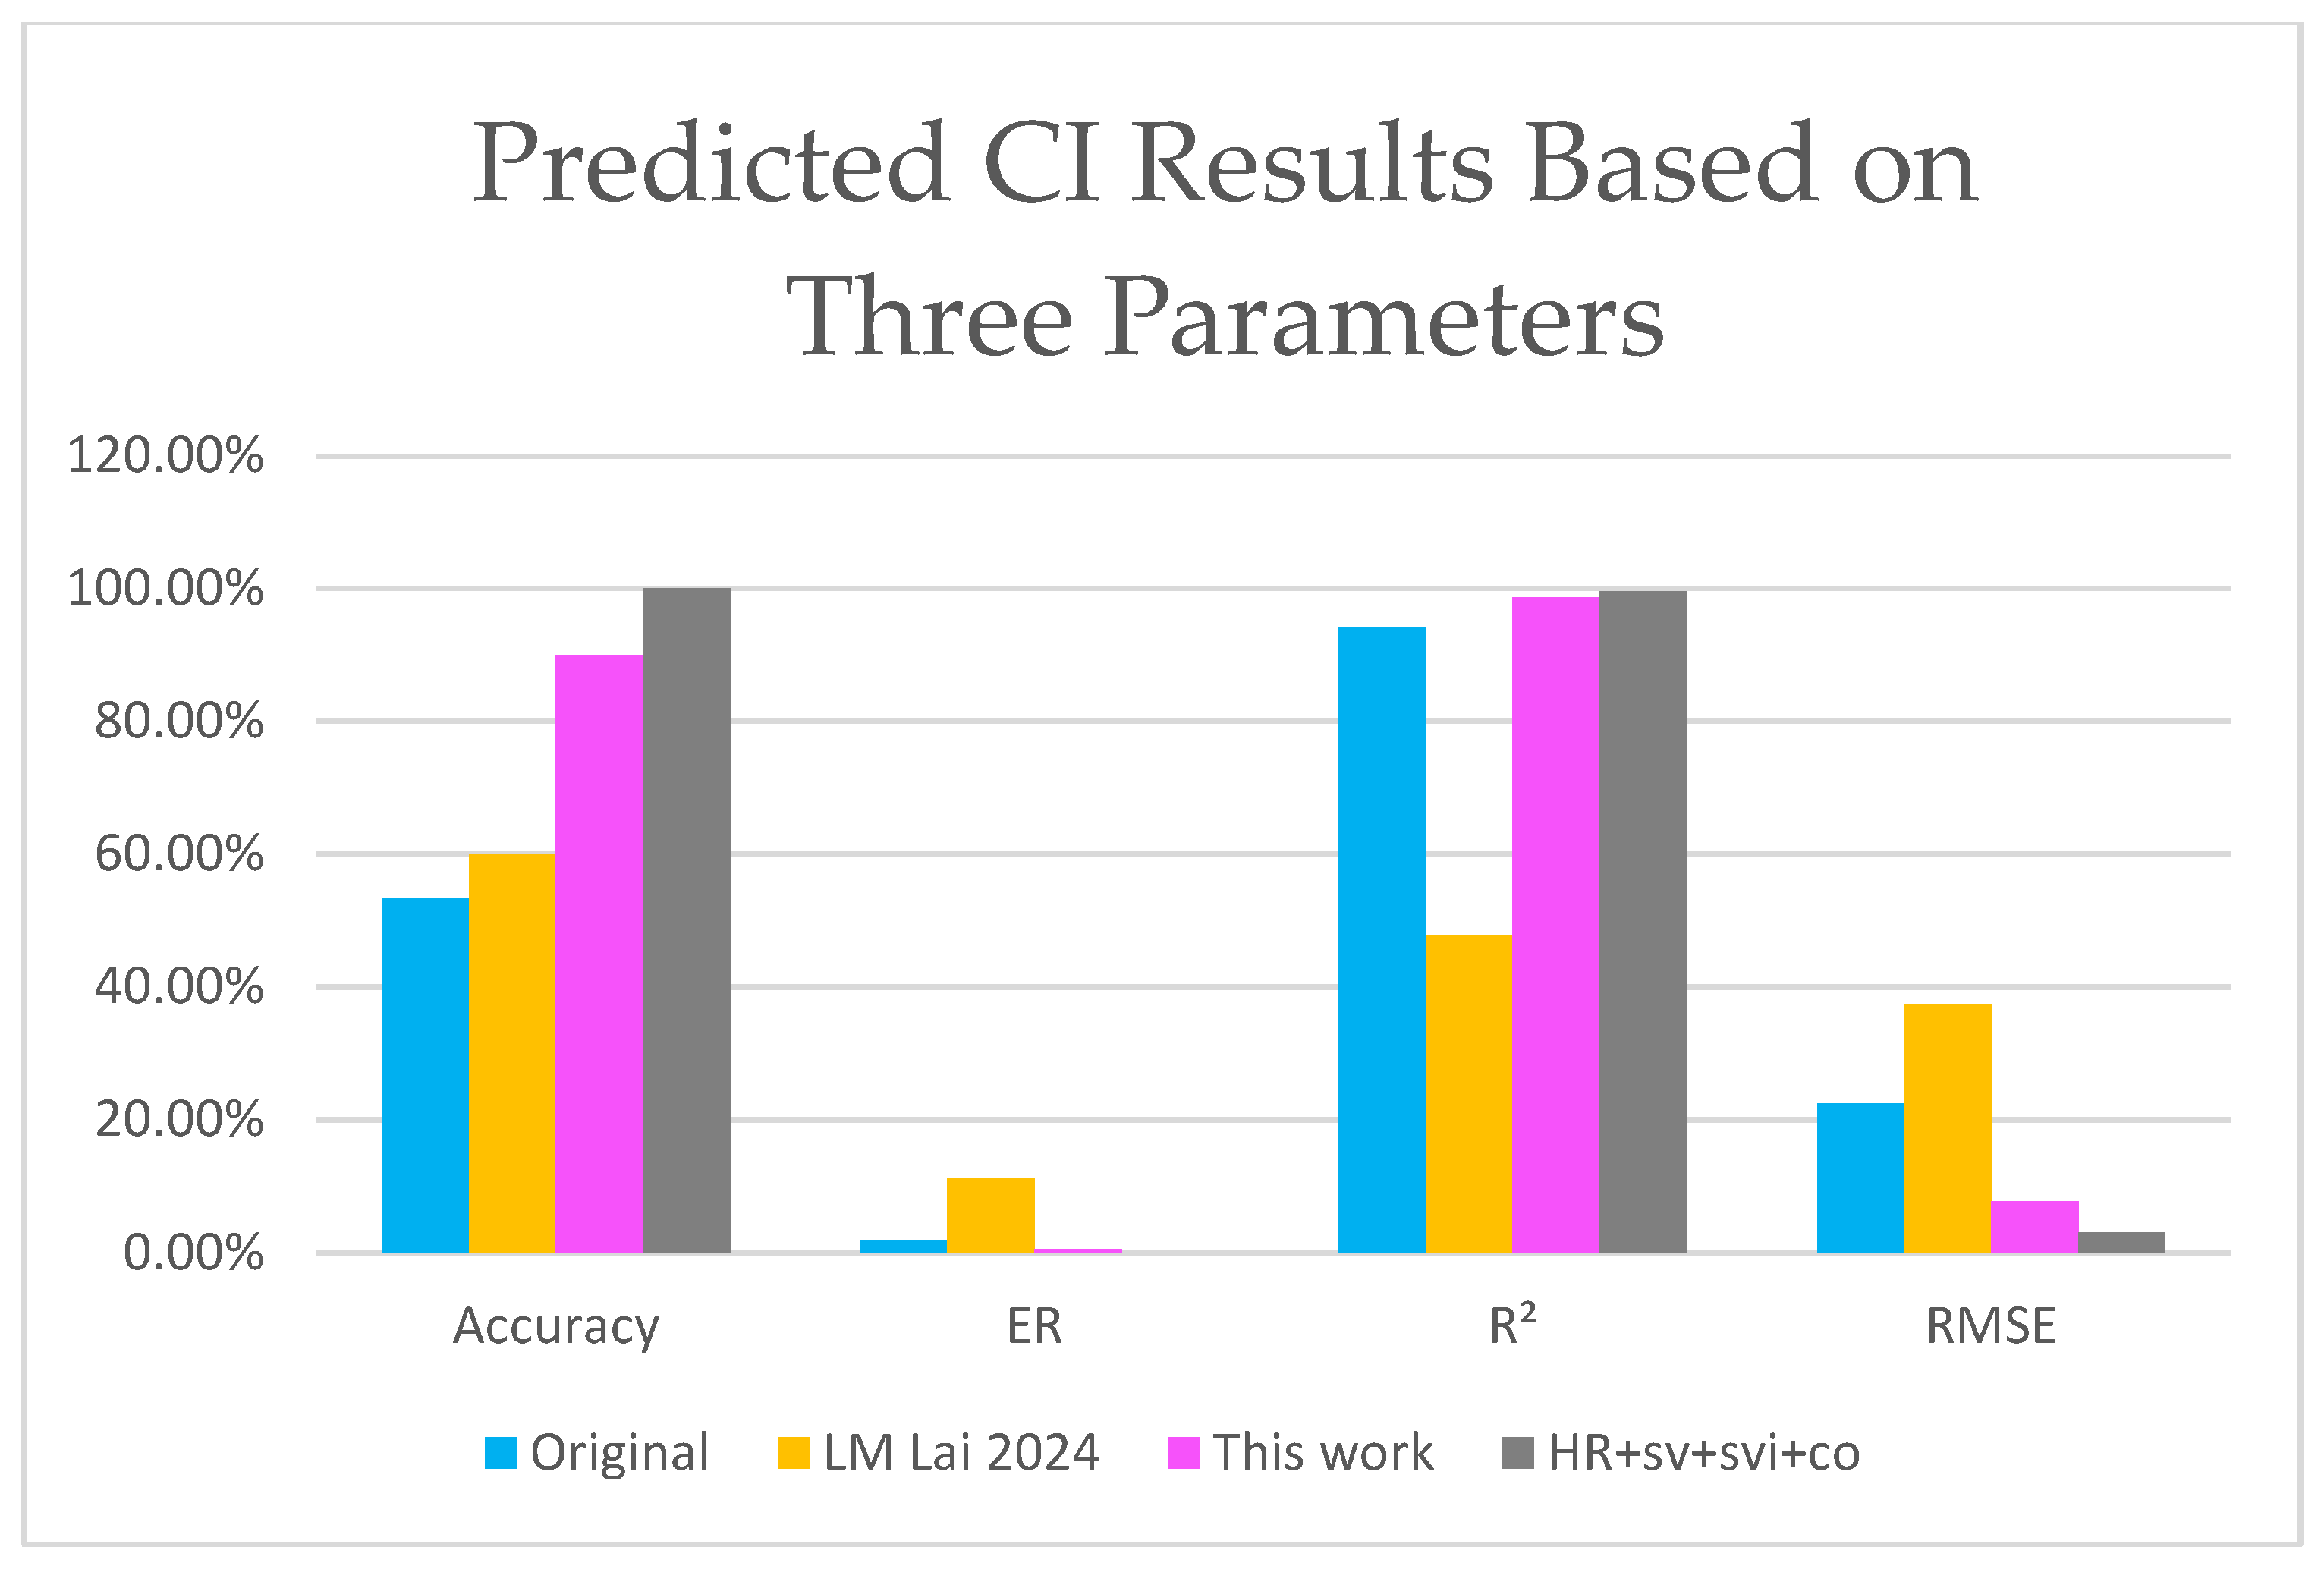
| Accuracy | ER | R2 | RMSE | ||
|---|---|---|---|---|---|
| HR + co | Original | 33.00% | 4.12% | 0.88123 | 0.22015 |
| LM [25] | 60.00% | 23.06% | 0.0046979 | 0.69737 | |
| This work | 73.33% | 0.41% | 0.9839 | 0.07367 | |
| HR + svi + co | Original | 53.33% | 1.90% | 0.94192 | 0.22459 |
| LM [25] | 60.00% | 11.08% | 0.47657 | 0.37362 | |
| This work | 90.01% | 0.56% | 0.98705 | 0.07668 | |
| HR + sv + svi + co | Original | 100.00% | 0.00% | 0.99595 | 0.03 |
| LM [25] | 100.00% | 0.00% | 0.99572 | 0.03 | |
| This work | 100.00% | 0.00% | 0.99692 | 0.02 |
Disclaimer/Publisher’s Note: The statements, opinions and data contained in all publications are solely those of the individual author(s) and contributor(s) and not of MDPI and/or the editor(s). MDPI and/or the editor(s) disclaim responsibility for any injury to people or property resulting from any ideas, methods, instructions or products referred to in the content. |
© 2024 by the authors. Licensee MDPI, Basel, Switzerland. This article is an open access article distributed under the terms and conditions of the Creative Commons Attribution (CC BY) license (https://creativecommons.org/licenses/by/4.0/).
Share and Cite
Chan, M.; Yu, Y.; Chang, P.; Chen, T.-Y.; Wong, H.-L.; Huang, J.-H.; Zhang, W.; Chen, S.-L. Optimizing Cardiovascular Health Monitoring with IoT-Enabled Sensors and AI: A Focus on Obesity-Induced Cardiovascular Risks in Young Adults. Electronics 2025, 14, 121. https://doi.org/10.3390/electronics14010121
Chan M, Yu Y, Chang P, Chen T-Y, Wong H-L, Huang J-H, Zhang W, Chen S-L. Optimizing Cardiovascular Health Monitoring with IoT-Enabled Sensors and AI: A Focus on Obesity-Induced Cardiovascular Risks in Young Adults. Electronics. 2025; 14(1):121. https://doi.org/10.3390/electronics14010121
Chicago/Turabian StyleChan, Meiling, Ying Yu, Pohan Chang, Tsung-Yi Chen, Hok-Long Wong, Jian-Hua Huang, Wiping Zhang, and Shih-Lun Chen. 2025. "Optimizing Cardiovascular Health Monitoring with IoT-Enabled Sensors and AI: A Focus on Obesity-Induced Cardiovascular Risks in Young Adults" Electronics 14, no. 1: 121. https://doi.org/10.3390/electronics14010121
APA StyleChan, M., Yu, Y., Chang, P., Chen, T.-Y., Wong, H.-L., Huang, J.-H., Zhang, W., & Chen, S.-L. (2025). Optimizing Cardiovascular Health Monitoring with IoT-Enabled Sensors and AI: A Focus on Obesity-Induced Cardiovascular Risks in Young Adults. Electronics, 14(1), 121. https://doi.org/10.3390/electronics14010121