Abstract
This paper investigates the feasibility of hydrogen-powered hybrid electric vehicles as a solution to transportation-related pollution. It focuses on optimizing energy use to improve efficiency and reduce emissions. The study details the creation and real-time performance assessment of a hydrogen hybrid electric vehicle (HHEV)system using an STM32F407VG board. This system includes a fuel cell (FC) as the main energy source, a battery (Bat) to provide energy during hydrogen supply disruptions and a supercapacitor (SC) to handle power fluctuations. A multi-agent-based artificial intelligence tool is used to model the system components, and an energy management algorithm (EMA) is applied to optimize energy use and support decision-making. Real Global Positioning System (GPS) data are analyzed to estimate energy consumption based on trip and speed parameters. The EMA, developed and implemented in real-time using Matlab/Simulink(2016), identifies the most energy-efficient routes. The results show that the proposed vehicle architecture and management strategy effectively select optimal routes with minimal energy use.
Keywords:
fuel cell; battery; supercapacitor; multiagent model; real-time energy management; GPS; speed; estimator 1. Introduction
A significant challenge facing today’s society is reducing global CO2 emissions. To facilitate this shift toward a cleaner and more sustainable energy future, renewable energy (RE) sources are essential [1]. However, as the share of RE increases, the variability in power generation can lead to grid instability, as energy production often does not match current demand. One solution to address this intermittency is the implementation of energy storage systems, which can store energy and convert it back to electricity when needed. Hydrogen energy storage systems are considered a cost-effective method for storing, transporting, and trading renewable energy [2,3].
A substantial portion of global CO2 emissions originates from the transportation sector, which was responsible for nearly one-fourth of these emissions in 2022 [4]. To combat this, global decarbonization efforts include increasingly strict emissions regulations for this sector. In December 2021, the United States Environmental Protection Agency set CO2 emissions standards for passenger cars at 82.5 g/km until 2026 [5]. The European Union has established regulations for new vehicles, with limits of 95 g/km until 2025, 60 g/km until 2030, and 0 g/km by 2035 [6]. These regulations signify a shift in the technological requirements of the light-duty vehicle market in the EU. Currently, the traditional combustion engine remains the dominant propulsion technology. In 2019, global sales of electric light vehicles represented only 2.5% of the market [7]. This situation highlights the urgent need to explore alternatives to conventional combustion engines, driving investments in propulsion technologies that can achieve zero tank-to-wheel CO2 emissions.
Hydrogen, derived from renewable sources, has long been recognized as a CO2-free energy carrier for vehicles. It can be utilized in two primary ways: First, hydrogen can be used in FC to generate electricity, which then powers an electric motor or is stored in a Bat. However, FCs are still relatively expensive and require very pure hydrogen; even minor impurities can significantly impair performance and reduce lifespan [8,9,10].
This energy source faces several technical limitations. Specifically, it has slow power transfer and a high cost per watt. Additionally, its power transfer rate is particularly slow during transient operations. As a result, FC cannot be used alone for electric traction to meet load demands [11,12]. As a result, the automotive industry is working to address these challenges by integrating storage systems with FC to meet the power requirements for traction applications. Storage systems typically serve as secondary energy sources, providing additional power during acceleration and absorbing excess power during braking [12,13]. When used alone in electric vehicles, Bat has several drawbacks, including long recharge times and poor transient response [14]. Moreover, Bat performance can be significantly impacted by high current discharges. To address these issues, we have paired the Bat with a set of SC to complement both the Bat and the FC, thus meeting the vehicle’s power needs [15,16]. Compared to FC and Bat, ultracapacitors offer lower energy density but higher power density.
Jia et al. [17] argue that (FCHEVs) are among the most promising RE vehicles. However, if the proton exchange membrane fuel cell and lithium-ion Bat systems are not properly managed, the vehicle maintenance costs can rise significantly. This study introduced a groundbreaking energy management method focused on cost reduction to fully realize the financial potential of FCHEVs. Hou et al. [18] proposed an innovative energy management technique for FC vehicles, combining online and offline optimization methods to achieve greater robustness, real-time performance, and optimal control in new areas. Although the results were not perfect, this approach enables on-board application. Fang et al. [19] explored several solar and hydrogen energy storage (HES) systems integrated into a set of electricity-hydrogen charging stations. Their design included day-ahead scheduling and real-time dispatch within a two-phase energy management system (EMS). Model predictive control based on intraday energy dispatch was used to reduce penalty costs during real-time dispatch. Hou et al. [20] suggested a multi-horizon hierarchical model predictive control system that incorporates real-time speed preview for managing FC lifespan and reducing energy consumption. This paper’s key contribution was applying multi-horizon optimization to lifespan management and energy optimization for FC electric vehicles across different timelines. Xu et al. [21] aimed to reduce overall bat load and extend the range of long-range electric vehicles. They found that the EMS significantly impacted fuel economy, Bat life extension, and overall energy efficiency of extended-range electric vehicles (EREVs). The study analyzed Bat power fluctuation from two perspectives: battery energy flow and Bat current. Abbas et al. [22] demonstrated the use of three power sources: a DC bus connected to superconducting magnetic energy storage, a Bat, and an FC. Their results showed that the control strategy for the charger and hybrid energy storage system (HESS) was effective. However, the nonlinearity of HESS power and integrated charging unit conditioning circuits made it challenging to develop a reliable nonlinear controller. An adaptive terminal sliding mode controller based on barrier functions was proposed to ensure finite-time convergence of the output variable. Chen et al. [23] introduced an adaptive energy management approach to enhance the efficiency and reliability of FC vehicles. They used principal component analysis and K-means clustering to develop a variable horizon speed prediction system and created a power slope-constrained adaptive equivalent consumption minimization technique to reduce hydrogen consumption while maintaining reliability. Ahmadian et al. [24] investigated an energy management strategy for series-parallel hybrid vehicles using reinforcement learning. The complexity of hybrid electric vehicle (HEV) power management enabled the application of increasingly sophisticated policies, with a Q-Learning algorithm suggested to create an energy management plan. Ma et al. [25] proposed an adaptive energy management system for a plug-in hybrid electric bus that takes into account mass distribution properties, based on an artificial neural network (ANN)and Pontryagin’s minimal principle (PMP). They first derived the vehicle mass distribution characteristic spectrum using the Monte Carlo method and examined the skew-normal distribution features of the hybrid electric bus mass. They then investigated the effect of mass uncertainty on PMP and developed the ANN-PMP by using ANN to update a dynamic co-state.
While extensive research has been conducted on FCHEV energy management, there are still notable gaps in our understanding. More research is needed on the system’s durability and rapid dynamic response. Furthermore, existing EMS [26] models often focus on a single-objective framework that emphasizes fuel efficiency over other critical factors such as component degradation, real-time application, performance, robustness, and the slow dynamic response of the FC. Additionally, many proposed methods are deterministic, neglecting potential variations and assuming precise knowledge of the provided data. Consequently, solutions perform optimally only in predetermined deterministic environments. In reality, modeling and estimation errors, along with fluctuating operational conditions, lead to system parameter uncertainties. These methods have inherent limitations and are not reliable for practical use. Ignoring these uncertainties often results in poor system performance, degraded solutions, broken system limitations, and severe equipment deterioration. These deficiencies and challenges have driven the need for further investigation.
Furthermore, control strategies for hybrid systems such as those involving FC, batteries, and superconducting magnetic energy storage often fail to thoroughly address uncertainties related to nonlinearity in power conditioning circuits. This oversight can undermine the robustness of these strategies. Filling these research gaps is crucial for improving the reliability and effectiveness of energy management techniques in hybrid vehicles. In [27], the combination of cheetah optimizer (CO) and spiking neural network method is proposed for energy management in FCHEVs, utilizing a constant DC bus voltage maintained through converter control with current mode regulation. This approach allows for the simultaneous management of both ultracapacitor (UC) current and DC bus voltage.
The work in [28] presents a robust implementation of a type-3 (T3) fuzzy controller designed for path-tracking tasks in driverless cars, especially under critical driving conditions and in the presence of external disturbances. Unlike many existing control methods, this approach does not rely on specific parameter information and operates under the assumption that system dynamics are unknown and non-linear. The control inputs are designed to enhance robustness by removing error bounds while maintaining stability through the application of the Lyapunov stability theorem and Barbalat’s lemma.
The authors in [29] show that autonomous vehicles require a high-precision lateral dynamics model for path following and lateral stability control, which enables precise characterization of modeling errors and parameters using data knowledge. Simulation and experimental results have demonstrated that the proposed hybrid model is more accurate in modeling vehicle lateral dynamics compared to conventional physical and data-driven models.
From the analysis above, it can be noticed that the all-mentioned energy management methods possess their advantages and shortfalls considering a specific system architecture. In this context, this work aims to make a real-time implementation of an HHEV controlled through a speed estimator algorithm. Indeed, selectively recognized roads from a GPS are considered to extract the best vehicle driving cycle that ensures fuel consumption reduction and enhances the system performance. While GPS technology is commonly employed for navigation and route optimization in commercial software, this study distinguishes itself by incorporating energy optimization into the route selection process. The proposed system goes beyond identifying the shortest or fastest route by dynamically analyzing real-time road conditions, traffic levels, and terrain to predict energy consumption for each potential path. Through an advanced EMA, it integrates this data with vehicle-specific parameters, such as the state of charge of energy sources and power demand dynamics. This results in a context-aware decision-making process that minimizes hydrogen consumption and maximizes energy efficiency. By coupling route selection with energy management, this system offers a holistic approach to enhancing vehicle performance and sustainability, bridging the gap between conventional GPS functionality and energy-centric optimization strategies.
The proposed real-time GPS-based energy management approach for HHEVs offers significant advancements over recent state-of-the-art methods. By integrating real-time GPS data, this strategy enables dynamic optimization of both routing and energy distribution, enhancing adaptability to changing driving conditions. In contrast, existing methods such as the model predictive control (MPC) based energy management strategy for hydrogen FCHEV focus on real-time vehicle energy optimization without incorporating real-time GPS data, potentially limiting responsiveness to immediate environmental changes [30]. Additionally, while artificial intelligence-based strategies have been employed to determine equivalent factors in energy management, they often rely on available data without leveraging real-time GPS inputs [31]. The proposed approach’s unique integration of real-time GPS information facilitates more responsive and efficient energy management, setting it apart from these existing methodologies.
This study assumes constant efficiency values for the components, and it is important to note that these efficiencies are, in practice, complex functions influenced by multiple parameters such as temperature, load conditions, and system aging. This simplification is made for the purpose of modeling and simulation.
So, the improvement expected from this work is to protect the system against any unexpected constraint related to high fuel and energy consumption by developing an efficient energy management strategy. Indeed, this work can contribute significantly to the literature. It does so by analyzing system constraints based on road recognition and a specified destination. Additionally, it selects the appropriate road to enhance system performance. This is achieved by reducing fuel consumption and protecting system components. The protection is ensured through fuel consumption prediction and control of the state of charge. However, the foregoing contributions are made specifically for the modeling and control of an HHEV using accurate energy management.
The article is structured as follows. Section 2 is devoted to HHEV design, Section 3 analyses the proposed EMA. HHEVs simulation and results are evaluated and discussed in Section 4 followed by the real-time test in the STM32F407 board in Section 5. Finally, the conclusions are expanded in Section 6.
2. HHEV Design
The proposed vehicle architecture features a hybrid electric system consisting of a FC, a Bat, and a SC [32]. The FC functions as the primary power source, while the SC and Bat serve as supplementary power sources. Specifically, the Bat provides power during steady-state conditions, such as when hydrogen fuel is low or during regenerative braking, while the SC is responsible for handling transient peak power demands. To improve electrical energy management and overall efficiency, a new control algorithm, the EMA, has been developed for energy distribution and decision-making. This algorithm regulates load demand by estimating the state of charge based on speed profiles derived from GPS data. The HHEV is modeled using a multi-agent framework, as illustrated in Figure 1. The model will be implemented and tested in real-time using MATLAB/Simulink.
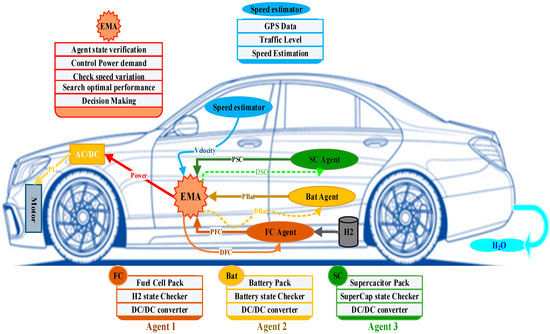
Figure 1.
Hydrogen hybrid electric vehicle design.
- (a)
- Hybrid vehicle modeling
Electric vehicles experience various physical forces while in motion. These forces include gravity, wind resistance, rolling resistance, and inertial force, all of which impact the vehicle’s movement. To counteract these resistance forces, the drive system must be capable of meeting the necessary requirements. The driving force needed for the vehicle can be determined using the following equation [33]:
where PR constitute the rolling resistance, PAR is the wind, PA and PG are the inertia and the gravity vehicle forces.
The required vehicle power is expressed as:
While PEV and PBK constitute, respectively, the EV and the braking powers, ηM corresponds to vehicle motor efficiency (%), ηinv is inverter efficiency (%) and ηG is Gear efficiency (%).
It is important to note that these efficiency parameters are treated as constants in this study. However, in real-world scenarios, they are dynamic and can vary based on several operational factors, such as load conditions and ambient temperature.
Thereby, the actual power can be expressed as the sum of the intervening equipment power as:
PACT = PFC + PBat + PSC
While PFC, PBat and Psc are, respectively, FC power, Bat power and SC power.
The difference between PREQ in Equation (2) and PL in Equation (1) is that PL specifically calculates the power needed to overcome rolling resistance, which is a fundamental force affecting the vehicle due to its mass and road conditions. It provides a baseline power required to keep the vehicle moving against rolling resistance. In contrast, PREQ offers a more comprehensive calculation of the power required from the vehicle’s energy source. It determines the net power demand by subtracting regenerative braking power from the vehicle’s electric power and then adjusting for the efficiencies of the gearbox, inverter, and motor. This reflects the actual power requirement, taking into account energy losses and conversion efficiencies in the powertrain. Therefore, while PL provides a crucial but simplified measure of the power needed to counteract rolling resistance, PREQ offers a broader and more accurate assessment by incorporating additional factors such as regenerative braking and system efficiencies.
- (b)
- Agent FC modeling
The FC is an electrochemical device that generates electricity from hydrogen. It operates by combining hydrogen with oxygen (from air), producing water, heat, and electrical power. The FC manages the conversion of hydrogen energy into electricity. Additionally, the FC’s operation is controlled through a decision key (DFC). The voltage of FC stack is defined as follows [34]:
where VFCcell = fuel cell voltage; Ncell = number of cells; Erev = reversible voltage (V), Vact = activation overvoltage (V); Vcon = concentration overvoltage (V); Vohm = Ohmic voltage (V).
where SOCFC corresponds to SOC of FC, Qstored is the hydrogen currently available, and Qmax is the maximum hydrogen capacity.
- (c)
- Agent battery modeling
The agent functions as a reactive component that manages its operation based on instructions received from the decision key DBat issued by the energy management unit. In this scenario, the agent assesses its SOCBat in relation to the system’s requirements. Its role is to address any energy shortfalls and support the tasks performed by the FC agent.
The modeling of the Bat agent is based on mathematical expressions for voltage Bat (VBat) and SOCBat. Specifically, the VBat is defined by the following equation [35]:
where VBat, E0, R, I Bat are, respectively, Bat voltage, open-circuit voltage of battery, resistance, Bat current,
K represents a polarization resistance expressed in ohms (Ω) and plays a key role in modeling the internal electrochemical losses of the Bat related to the discharge current and the SOC, translating the increase in voltage drop as the SOC decreases or the current increases, thereby reflecting the dynamic limitations and nonlinear effects of the Bat’s internal materials.
The SOCBat is mainly depending on the variation of the rated and current charge as:
While Q and Qnom are current capacity of the Bat and nominal capacity of the Bat.
- (d)
- Agent SC modeling
As a reactive agent, the operation of the SC is based on the verification of its SOCSC. Indeed, the SC agent is dedicated to controlling this process. So, through a decision key DSC, the SC agent is monitored through a static converter according to the system requirements.
The mathematical model of an SC constitutes a representation in the form of equations that describe its behavior. Thus, the SC pack operating voltage calculation is described as follows [36]:
where VSC, Ncell, Vc, Rsc, Ic are, respectively, voltage of SC (V),number of cells, cell, voltage internal SC resistance, SC current.
The expression of the SOC of an SC pack (SOCsc) is defined by the ratio between the SC stored energy and the maximum energy charge:
- (e)
- Comparative study between components
In a HHEV, the integration of supercapacitors, batteries, and FC leverages the distinct strengths of each component to optimize overall performance. Supercapacitors excel at delivering rapid bursts of power and capturing energy during regenerative braking, thanks to their high-power density and near-instantaneous response times. Bat, which have moderate power density but higher energy density, handle intermediate power demands and store energy for extended periods. FC, on the other hand, provide a continuous power supply over long durations, delivering steady energy output to support both the Bat and SC. This combination enables the vehicle to efficiently meet varying power requirements, thereby enhancing overall efficiency and performance. The Table 1 outlines the key differences in power density, response time, and energy density among SC, Bat, and FC, illustrating their complementary roles within the HEV system.

Table 1.
Comparative analysis of power density, response time, energy density, and primary roles of energy storage components (SC, Bat, and FC).
In the simulation, the power density of each component defines its role in energy management. SC (5–10 kW/kg) handle rapid transients like acceleration and regenerative braking, reducing the strain on bat and FC. Bat (0.2–0.8 kW/kg) manage steady-state and intermediate power demands, providing reliable energy storage and supply over longer durations. FC (0.4–1.5 kW/kg) deliver continuous baseline power but rely on batteries and SC for handling peaks. This distribution ensures efficient energy use, realistic performance, and balanced component operation under varying conditions.
3. Energy Management Algorithm
This section introduces the proposed EMA, which performs several critical functions. The EMA is designed to manage, control, and optimize system performance by addressing various constraints and component behaviors. Power distribution is regulated based on key parameters, such as the state of charge and computational speed. The system utilizes estimated speed values to predict the required power and make informed operational decisions.
3.1. Speed Estimator Using GPS Data
Prediction is widely used in transport research to develop a speed cycle that closely approximates the actual speed profile of the vehicle. This approach involves real-time analysis to compare the vehicle’s current state with previously known scenarios. The relationship between the vehicle’s speed cycle and optimal power distribution requires adaptive power-sharing mechanisms based on real-time road conditions. Typically, these mechanisms involve analyzing the vehicle’s speed history at regular intervals and using this data to make informed decisions about power-sharing controls, ultimately minimizing overall fuel consumption. Designing such a controller begins with selecting a set of control laws, whose parameters are either optimized or intelligently chosen based on various predefined speed cycles. The selected speed cycles are then evaluated according to road characteristics and the corresponding control law parameters.
To estimate the vehicle’s speed along a given route, the process starts with Step 1 (GPS Tracking), where precise coordinates for the departure and arrival points are recorded using a GPS device. This initial data forms the foundation for route planning. In Step 2 (Road Recognition), the characteristics of the roads between these points are analyzed. This involves identifying various road features such as road type, number of lanes, and speed limits, as illustrated in Figure 2. Step 3 (Road Parameter Extraction) involves gathering critical parameters necessary for speed estimation, including the Traffic Level State (TTR), which provides insights into current traffic conditions; total travel duration; and real-time measurements of acceleration and velocity. These parameters are collected via a GPS speedometer, which continuously monitors the vehicle’s speed and acceleration. Finally, in Step 4 (Speed Estimation), the gathered data are used to calculate the estimated vehicle speed. This calculation relies on a specific formula detailed in Equation (8), which integrates the extracted road parameters to produce an accurate speed estimate. Each step is essential for ensuring precise velocity estimation, with the quality of the final result heavily dependent on the accuracy of the initial GPS data and parameter extraction.
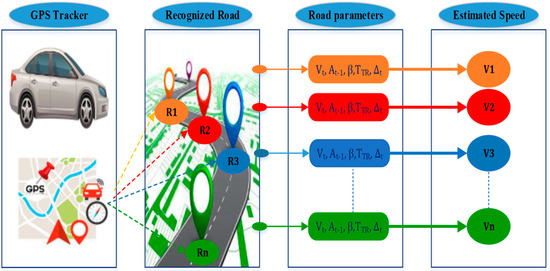
Figure 2.
Speed estimator.
To predict the future speed of a vehicle under varying traffic conditions, the formula applied in Equation (10) can be applied to determine the estimated speed VEST is as follows:
where Vt represents the current speed, At−1 is the previous acceleration, β is a parameter related to traffic dynamics, and TTR reflects the traffic congestion level. By factoring in the current traffic state and vehicle acceleration, this model provides a more dynamic estimate of future speed. Recent studies on traffic modeling have focused on incorporating real-time data from smart transportation systems to improve the accuracy of such predictions [37].
The GPS operates through a network of satellites orbiting the Earth that transmit signals to GPS receivers. These receivers, commonly found in smartphones or dedicated GPS devices, use trilateration to accurately determine their location. After a user inputs a starting point and destination, mapping and routing software calculates several possible routes, considering factors such as distance, traffic conditions, and user preferences. Optimization algorithms then identify the most efficient route, which is displayed to the user along with step-by-step directions and real-time traffic updates. This integrated system allows users to choose the most efficient route to their destination, enhancing navigation accuracy and convenience (see Figure 3).
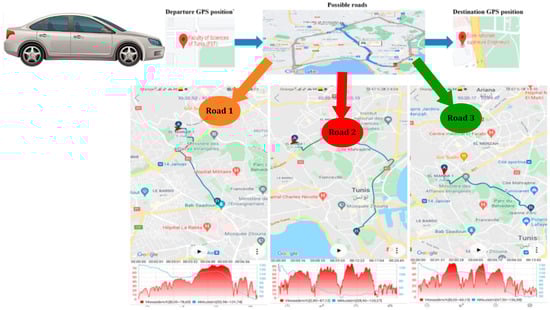
Figure 3.
Road recognition by GPS.
3.2. Smart EMA
The smart EMA based on a multi-agent system is designed to optimize the operation and control of HHEVs. This system integrates multiple intelligent agents that interact with one another and with the HHEV’s components to ensure the most efficient and effective use of energy.
- (a)
- System control and management
The multi-agent algorithm takes into account several key factors, including the vehicle’s Bat status, hydrogen fuel availability, driving behavior, and environmental conditions. Each agent is assigned specific tasks, such as monitoring battery levels, predicting energy needs, and determining the optimal operating mode for the vehicle. A significant approach to achieving this is through a reinforcement learning (RL) algorithm, which enables agents to learn and adapt their behavior based on feedback from the vehicle’s sensors and control systems. The RL method utilized in this study aims to optimize the operation and control of hydrogen-powered HHEVs by effectively balancing energy consumption and resource utilization. The primary objectives include minimizing hydrogen fuel consumption and reducing overall energy usage for each trip. This entails efficiently distributing power among the vehicle’s components while considering the varying energy consumption rates of both the Bat and hydrogen fuel. By prioritizing Bat power when it is more efficient, the algorithm reduces overall hydrogen consumption. Central to this approach is the integration of a multi-agent system that incorporates RL. This allows agents to adjust their behavior in real time based on sensor and control system feedback, facilitating the optimization of energy management strategies. The goal is to identify the most efficient operating modes based on current conditions and the objectives set by the vehicle operator.
Ultimately, this algorithm seeks to optimize power distribution within HHEVs to ensure safe, reliable, and efficient operation. By balancing electric and hydrogen power sources, the system enhances efficiency, extends the vehicle’s range, and reduces its carbon footprint. The multi-agent framework promotes effective information exchange and decision-making based on individual objectives and overall energy consumption goals, contributing significantly to the efficiency and environmental sustainability of HHEVs [38].
As shown in Figure 4, the EMA is a sophisticated tool designed to optimize a vehicle’s energy consumption by accurately predicting the energy required along a given route. It continuously collects real-time speed data from onboard sensors as the vehicle travels along its predetermined path. These measurements are essential for making necessary adjustments, such as controlling the activation of systems like air conditioning, Bat recharging, or auxiliary equipment, at optimal moments to conserve energy. The route is generated by a GPS system that presents multiple possible paths between the starting point and the destination, each characterized by varying road conditions, traffic levels, and terrain. The EMA algorithm calculates the energy flow for each potential route, taking into account factors such as elevation changes, traffic congestion, and vehicle speed, all of which directly impact fuel efficiency and Bat depletion rates. Based on these calculations, the algorithm identifies the route that minimizes energy consumption while ensuring a timely arrival. By integrating real-time data and predictive modeling, the EMA enables dynamic decision-making to optimize energy use, resulting in more sustainable and cost-effective vehicle operation. This process is particularly valuable in hybrid and electric vehicles, where careful management of energy resources like FC, Bat, and SC is essential for maximizing efficiency and range. Additionally, Figure 5 illustrates the transitions between various system components during the driving cycle. It is evident that equipment can be activated individually, in pairs, or simultaneously, depending on the encountered conditions and constraints. Consequently, the EMA algorithm significantly influences the system’s performance by adjusting its operations based on the current state and requirements. It effectively represents a state diagram of an energy management system for a hybrid electric vehicle, integrating components such as a SC, FC, and Bat.
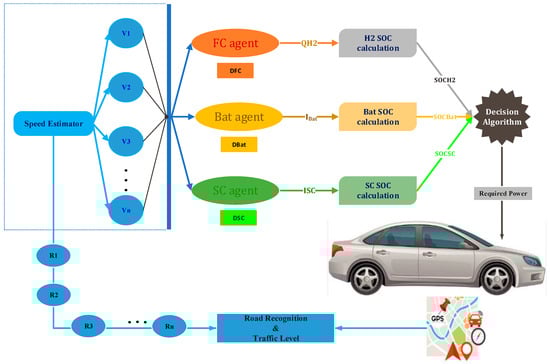
Figure 4.
System control behavior based on decision-making.
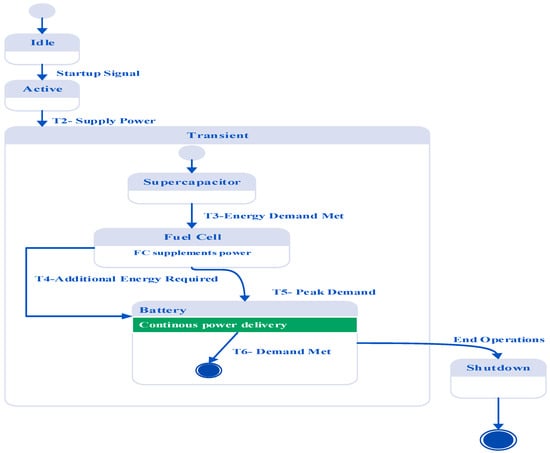
Figure 5.
EMA state diagram.
The system begins in an idle state and transitions to an active state upon receiving a startup signal, leading to a transient event where the SC is first activated to supply power to the load. Depending on energy demand, the system may then shift to the FC state, where the FC either takes over or supplements the power supply. If additional energy is required, the system transitions to the Bat state to ensure continuous power delivery. Transition times (T2, T3, T4, T5, T6) indicate the shifts between these states, determined by specific conditions and energy requirements. The system ultimately proceeds to a shutdown process, concluding in an end state when all operations are completed. This diagram illustrates the dynamic operation of the energy management system, ensuring optimal energy utilization from the SC, FC, and Bat to efficiently meet the vehicle’s power demand.
The flowchart presented in Figure 6 illustrates the energy management process for a HEV, where various power sources namely, an FC, Bat, and SC are dynamically activated based on real-time conditions to optimize energy consumption. The process begins by assessing the load demand on the vehicle; if the demand is high, the system adjusts its operations accordingly.
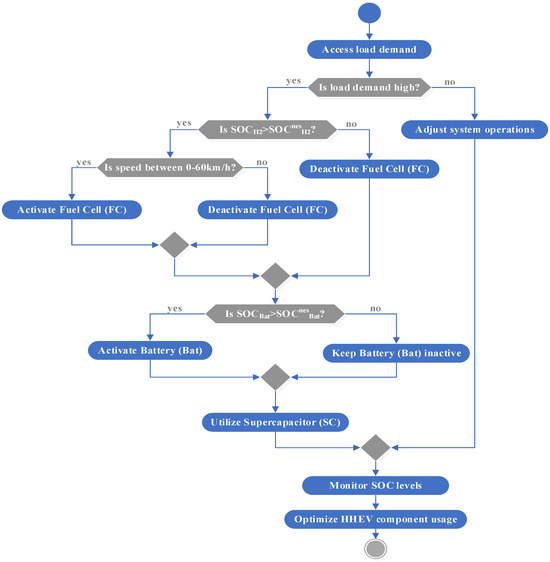
Figure 6.
FC/BaT/SC configuration EMA.
Decision-making is guided by the SOC of the FC and Bat, as well as the vehicle’s speed. If the SOC of the FC exceeds a defined threshold (SOCFC) and the vehicle speed is within a specified range (e.g., between 0 and 60 km/h), the fuel cell is activated to meet the energy demand. Conversely, if the FC’s SOC is below the threshold or the speed falls outside this range, the fuel cell is deactivated.
Next, the system evaluates the SOC of the Bat (SOCBat). If the Bat’s SOC is below the threshold, the battery is activated to provide energy to the vehicle. If the SOC is sufficient, the system keeps the battery in standby mode, conserving its energy for future demands.
Additionally, the SC is employed when necessary to manage transient energy surges, ensuring overall system stability and efficiency. Finally, the SOC monitor oversees the charge status of all components, making adjustments to optimize the performance of the HEV. Through this sequence, the system effectively manages the real-time activation and deactivation of energy sources, ensuring that the most energy-efficient configuration is selected at all times.
The EMA’s decision-making process dynamically allocates power from each source to meet Pdemand, adhering to Equation (3):
Priority is given to the Bat and SC when their respective SOC values exceed predefined thresholds, ensuring that transient power demands are met while reducing the strain on the FC. Additionally, the algorithm predicts future power demand (Ppredicted) using real-time GPS data, factoring in traffic conditions and terrain variations, as defined by:
This predictive capability enables the EMA to optimize energy allocation proactively.
The optimization objective of the EMA is to minimize hydrogen consumption (Qused) over the driving cycle while ensuring adequate energy availability. This is achieved by solving the objective function:
In accordance with the constraints SOCFC, SOCBat, SOCSC > SOCmin and Pdemand = PFC + PBat + PSC
- (b)
- Power sizing and efficiency
Power sizing is a crucial aspect of designing a HHEV that integrates multiple power sources, such as a proton exchange membrane fuel cell (PEMFC), a Bat, and potentially a SC. Effective power sizing requires a thorough understanding of the energy flow and needs of each component. Here are the key steps to conduct a comprehensive power sizing analysis:
- -
- Define Performance Requirements: Determine the vehicle’s key performance metrics, including range, acceleration, and overall power demand. This will form the basis for sizing the power components.
- -
- Analyze Drive Cycle: Examine the vehicle’s typical drive cycle, including start-stop events, acceleration, deceleration, and steady-speed driving. This analysis will help establish the power demand profile under various driving conditions.
- -
- Select PEMFC System: Choose a PEMFC with a power rating that meets the maximum power demand identified in the drive cycle analysis. Consider factors like efficiency, weight, and volume.
- -
- Determine Bat Size: Calculate the Bat size needed to meet peak power demands and support continuous driving. Take into account factors such as depth of discharge, voltage, and capacity required for the desired range.
- -
- Assess Supercapacitor Needs: Evaluate the necessity of a supercapacitor based on drive cycle characteristics. SCs are beneficial for handling peak power demands during acceleration and regenerative braking. Size the SC to provide quick power bursts and recover energy during deceleration.
- -
- Implement Energy Management Strategy: Develop a strategy to manage the power flow between the PEMFC, Bat, and SC. This strategy should optimize energy use, leveraging the strengths of each component in different driving scenarios.
- -
- Evaluate Efficiency: Analyze the efficiency of each component and the overall hybrid system, considering losses during energy conversion, transmission, and storage. Optimize the sizing of each component to enhance the overall efficiency of the hybrid powertrain.
The sizing study for each component involves assessing power requirements and accounting for losses to ensure optimal system performance and achieve a maximum power of 60 kW for the traction motor (refer to Figure 7). For the FC to deliver a maximum power of 60 kW, it must be sized to provide at least 60 kW of electrical power, factoring in losses from hydrogen to electricity conversion.
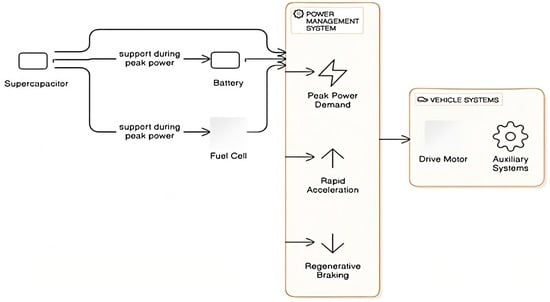
Figure 7.
Role of supercapacitors in hybrid hydrogen–electric vehicles.
To provide accurate vehicle data and assess sizing effectiveness, incorporate the appropriate losses for each component. For achieving 60 kW at the electric motor from the FC, consider losses through the DC/DC converter, bus bar, and DC/AC inverter, in addition to the internal losses of the stack, which are only used for estimating fuel consumption. Similarly, for the battery Bat and SC, internal losses should only be used to estimate their SOC, not for their sizing.
To ensure the FC delivers the required 60 kW to the motor, it is necessary to account for inefficiencies in key components such as the DC/DC converter, the DC/AC inverter, and the internal hydrogen distribution system. Each of these components contributes to the overall efficiency of the power delivery system.
The efficiency of the individual components is as follows:
- DC/DC converter efficiency: ηDC/DC = 95%;
- DC/AC inverter efficiency: ηDC/AC = 96%;
- Hydrogen distribution efficiency: ηH2_dist = 50%.
The total system efficiency of the FC, ηFC, is the product of these three efficiencies:
This means the overall efficiency of the FC system is approximately 45.6%.
To determine the nominal power, the FC needs to generate in order to meet the 60-kW requirement on the motor, we use the relationship:
Therefore, the FC must produce a nominal power output of approximately 73.08 kW to ensure that the motor receives 60 kW, accounting for the losses in the hydrogen distribution, DC/DC conversion, and DC/AC inversion processes.
Similar considerations apply to both the Bat and the SC when determining their sizing for effective power delivery. For the battery, it is essential to account for the DC/DC converter efficiency, which is 95%, as well as the battery’s internal losses, also assumed to be 5%, resulting in an internal efficiency (ηBat_int) of 95%. These factors ensure that the battery can provide the necessary power by considering the total conversion efficiency from stored energy to usable output. Therefore, the Bat efficiency is expressed as:
For the supercapacitor, assuming the same efficiencies and power nominal as bat:
Although constant efficiency values are assumed for the FC, Bat, and SC, these values are, in reality, complex functions of several parameters, including temperature and state of health. This assumption simplifies the analysis and allows the focus to remain on the overall energy management strategy.
The rationale behind sizing the supercapacitor in a HHEV focuses on its critical functions and purposes. The SC is primarily intended to manage transient events, such as rapid acceleration and regenerative braking, thanks to its high-power density which allows for quick energy absorption and delivery. Additionally, it supports the bat and FC during peak power demands, alleviating stress on these components and thereby improving their durability and efficiency. By providing a reliable power source in situations where traditional power sources might struggle, the SC is crucial for maintaining vehicle reliability under various driving conditions. This strategic sizing, illustrated in detail in the accompanying diagram (see Figure 8), highlights the SC’s vital role in enhancing system efficiency, safety margins, and overall performance in hybrid electric vehicles.
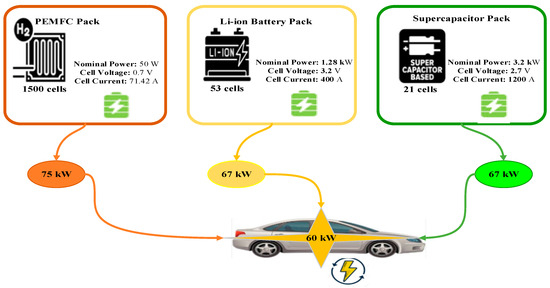
Figure 8.
Component sizing scheme.
The HHEV system illustrated in the figure integrates three main ES components: a PEMFC pack, a lithium-ion Bat pack, and an SC pack, each designed to fulfill different power demands within the vehicle. The PEMFC pack, consisting of 1500 cells, generates a total power output of 75 kW, with each cell delivering a nominal power of 50 W, a voltage of 0.7 V, and a current of 71.42 A. This component acts as the primary energy source, supplying continuous power for sustained driving scenarios due to its high energy density. In addition, the lithium-ion Bat pack, comprised of 53 cells, with each cell providing a nominal power of 1.28 kW, a voltage of 3.2 V, and a current of 400 A, contributes 67 kW of power. The Bat is crucial for covering medium power demands, such as during vehicle acceleration or maintaining a constant speed, thus collaborating with the fuel cell to ensure smooth and responsive energy delivery. Furthermore, the SC pack, which consists of 21 cells and delivers 67 kW of power with each cell providing 3.2 kW, a voltage of 2.7 V, and a current of 1200 A, addresses short-term, high-power demands, particularly useful during rapid acceleration or energy recovery in regenerative braking. The overall energy management system ensures that the vehicle receives a combined 60 kW of power, with dynamic allocation from the FC, Bat, and SC depending on real-time driving conditions. In terms of system dynamics, the speed estimator operates at a time step of 1 s, optimizing real-time power distribution. Additionally, the FC’s total capacity is tailored to maximize efficiency, with the lithium-ion Bat and SC pack supporting fast responses and energy recovery. This hybrid system balances energy density with power density, enhancing overall vehicle performance while optimizing energy consumption and reducing emissions, as detailed in Figure 8.
Table 2 illustrates the sizing characteristics of HHEV components.
Table 2.
Sizing characteristics of HHEV components.
The battery capacity in ampere-hours (Ah) is calculated using the formula
For a nominal power (Pnominal) of 1.28 kW and a voltage (VBat) of 3.2 V, the Bat capacity (CBat) is 400 Ah, meaning it can provide 400 amperes for one hour. The Crate, which indicates the discharge rate relative to the Bat’s capacity, is calculated as:
With a discharge current (IDischarge) of 400 A and a Bat capacity (CBat) of 400 Ah, the Crate is 1, indicating a full discharge in one hour. The Bat’s energy capacity (EBat) is 1.28 kWh, calculated as:
In practical applications, the capacity of SCs is typically specified in farads. For example, a SC with a specified capacity of 1200 F directly indicates its energy storage capability, eliminating the need for additional calculations.
The overall system efficiency is assessed based on the chosen operating mode, which depends on the activation status of each component. Thus, the system’s efficiency is determined by the product of the efficiencies of each active component. Table 3 displays the truth table for the system efficiency, reflecting the activation status of each component as is seen in Figure 9.
Table 3.
Efficiency calculation considering driving scenario.
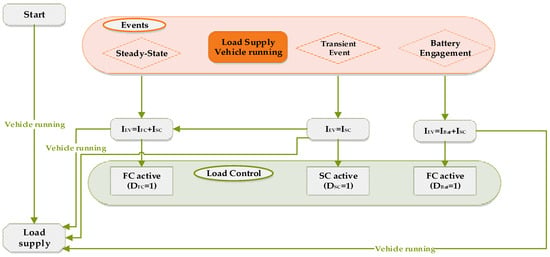
Figure 9.
Scheme of system efficiency.
Total system efficiency is a comprehensive metric that assesses how effectively power is distributed among the system’s components. Table 3 illustrates efficiency calculation considering driving scenario. It is determined by dividing the sum of efficiencies for various pathways by the overall efficiency of each component. This method takes into account both the efficiency of individual components and how well power is managed between them. By evaluating these aspects, total system efficiency provides a thorough evaluation of how effectively the system converts input energy into useful output. It reflects the system’s overall ability to utilize energy efficiently across its different pathways and helps gauge its success in achieving performance goals. It can be expressed as:
- where: ηHEV: overall system efficiency (%)
- where the two efficiency sums can be as follows:
ηFC: FC efficiency (%)
ηSC: SC efficiency (%)
4. Findings and Results
This section focuses on evaluating the performance of the proposed hybrid electrical system configuration (FC/Bat/SC). Extensive simulation tests are performed using the MATLAB/Simulink environment to achieve the desired outcomes, which are then thoroughly analyzed and discussed. The first step involves analyzing real-time data from GPS and speed estimators (see Figure 10). Measurements are precisely collected from the starting point (Faculty of Sciences of Tunis) to the destination (Higher School of Engineering of Tunis). Accurate real-time speed measurement is crucial for identifying the optimal road performance. By capturing and analyzing speed data throughout the journey, insights into the vehicle’s dynamic behavior under various driving conditions are obtained. This real-time information enhances the evaluation process, allowing for informed decisions about the configuration and operation of the hybrid electric system. Thus, integrating GPS and speed estimators is essential for improving the system’s overall efficiency, road performance, and energy management.

Figure 10.
Possible detected ways by Google Maps.
As shown in Figure 10, the GPS identified three distinct routes between the selected departure and arrival points. To ensure accurate real-speed measurements, each route was traveled over three consecutive days, starting at the same time each day, resulting in the profiles shown in Figure 11. These data are crucial for monitoring and regulating the system’s behavior. Analysis of Table 4 indicates that Route 1 has the shortest distance and the quickest travel time compared to the other routes. Consequently, the routes are ranked based on distance and duration as follows: Route 1, Route 2, and Route 3. However, it is noteworthy that Route 2 achieved the highest average speed.
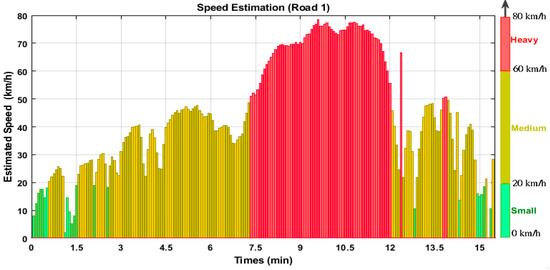
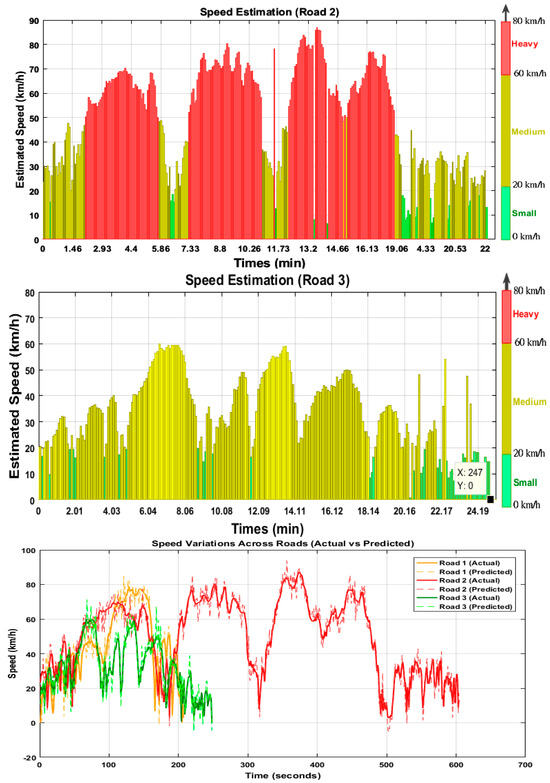
Figure 11.
Referential vehicle speed value per road.
Table 4.
Roads characteristics.
Figure 11 illustrates vehicle speed estimations across three roads, highlighting traffic conditions. Road 1 shows prolonged heavy traffic (above 60 km/h) between 5 and 13 min, with lighter traffic at the start and end. Road 2 alternates between medium and heavy traffic, with frequent shifts in speed. Road 3 experiences mostly lighter traffic, with more stable, lower-speed conditions (under 40 km/h) and fewer instances of heavy traffic. Overall, Road 1 has the heaviest traffic, Road 2 fluctuates, and Road 3 shows the lightest traffic.
Figure 12 presents a comparison of actual and predicted speed profiles across three roads alongside statistical metrics evaluating the accuracy of the EMA. The top graph demonstrates that the predicted speeds closely follow the trends of the actual data, with minor deviations in some segments. The bottom graph summarizes the statistical results, showing that Road 2 has the highest average and maximum speeds, indicating smoother conditions, while Road 3 exhibits the lowest speeds, likely due to more challenging driving scenarios. The root mean square error (RMSE) values across all roads remain low, confirming the EMA’s accuracy, though slightly higher RMSE on Road 3 suggests opportunities for further refinement. These results validate the EMA’s effectiveness in capturing real-world driving dynamics while highlighting areas for optimization.
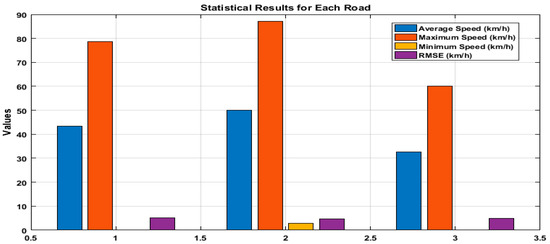
Figure 12.
Comparison of actual and predicted speed profiles with statistical evaluation across roads.
Table 4 provides a detailed overview of the road characteristics and their corresponding energy consumption and efficiency metrics. The analysis highlights the significant impact of route distance, average speed, and route duration on the energy performance of the proposed EMS. Road 3, despite being the longest route (11 km), achieved the highest system efficiency at 65%, attributed to its balanced energy utilization across the FC, Bat, and SC. This result underscores the effectiveness of the EMA in distributing power optimally to meet the dynamic power demands of varying road conditions. In contrast, Road 2, characterized by the highest average speed (50.27 km/h), exhibited the highest hydrogen consumption (1.05 kg) and a reduced system efficiency of 50%. This reflects the increased power demands associated with higher speeds, leading to more frequent and intensive utilization of the FC. Road 1, with the shortest distance (7.7 km) and moderate speed (30.06 km/h), demonstrated efficiency of 60% and the lowest hydrogen consumption (0.78 kg), highlighting the system’s ability to adapt to less demanding driving conditions while maintaining energy efficiency.
Additionally, the changes in the SOC for the Bat and SC reveal their complementary roles in meeting transient power demands. The Bat experienced the highest SOC change on Road 2 (−15%), correlating with the higher energy demand, while the SC exhibited moderate usage across all routes, with SOC changes ranging from −5% to −8%. These results demonstrate the system’s adaptability and efficiency in managing energy resources across varying road scenarios.
The power requirement for the vehicle under investigation was set at 60 kW to effectively size the FC, Bat, and SC to meet the load demands. Figure 13 illustrates the performance of the FC, Bat, and SC in terms of power variation, SOC, and efficiency over a driving scenario labeled as “Road 1”. The top plot shows the power output from each source as a function of time, while the middle and bottom plots detail the variations in SOC and efficiency of each component during the drive.
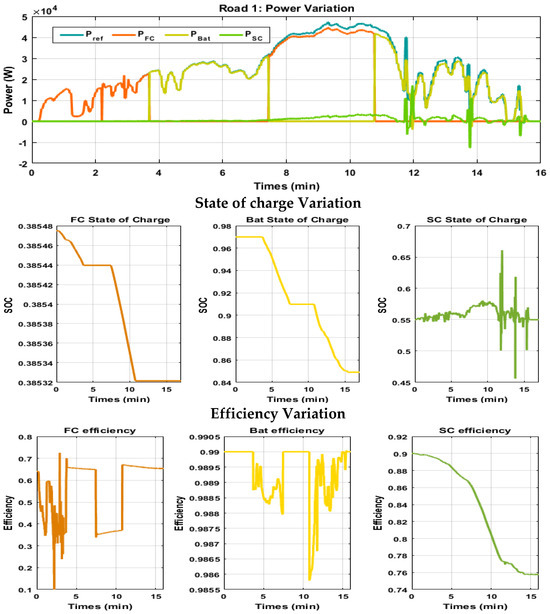
Figure 13.
Road 1 performance simulation.
In the top graph, the total power demand (Pref) is shown alongside the contributions from the FC (PFC), Bat (PBat), and SC (PSC). During the initial phase of driving, the FC and Bat provide the majority of the power, while the supercapacitor contributes less consistently, mainly during transient peaks in power demand. For example, around the 8 min mark, a shift occurs where the power provided by the FC drops significantly, indicating a reduction in FC activity, while the Bat compensates for this drop. The SC seems to respond rapidly to short bursts of power requirements, highlighting its role in managing transients. The middle row shows the state of charge for each component over time. The FC’s SOC gradually decreases as it provides power during the initial period but drops more rapidly after 5 min, signaling high energy consumption. The Bat’s SOC also decreases progressively, with a steep decline after the 8 min mark, reflecting its role in supplying more power when the fuel cell’s contribution drops. The SC’s SOC shows rapid fluctuations, reflecting its role in handling short-duration energy surges, and maintains a relatively stable charge towards the end of the scenario. The bottom row highlights the efficiency of the FC, Bat, and SC. The FC’s efficiency starts high but shows a decline as power demand increases, particularly during periods of higher load. The Bat experiences more significant efficiency drops, especially during periods of high discharge, suggesting losses associated with high power output. The SC, in contrast, maintains relatively stable efficiency, with a gradual decrease over time as it handles transient power demands.
To compare the performance across the three driving scenarios: Road 1 (Figure 13), Road 2 (Figure 14), and Road 3 (Figure 15) based on the power variation, SOC variation, and efficiency of the FC, Bat, and SC, we can extract the key insights and determine the most efficient road.
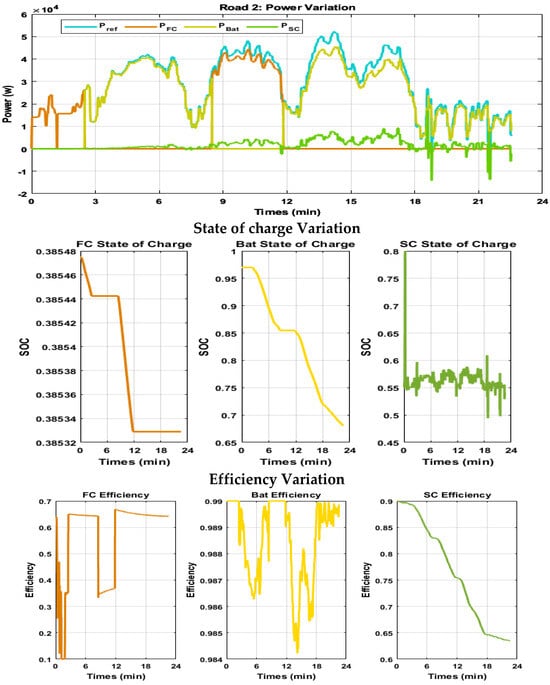
Figure 14.
Road 2 performance simulation.
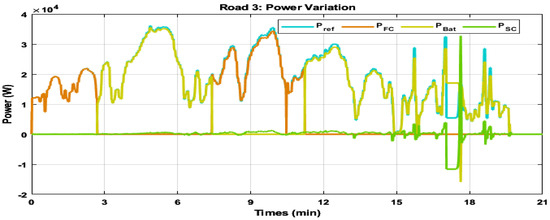
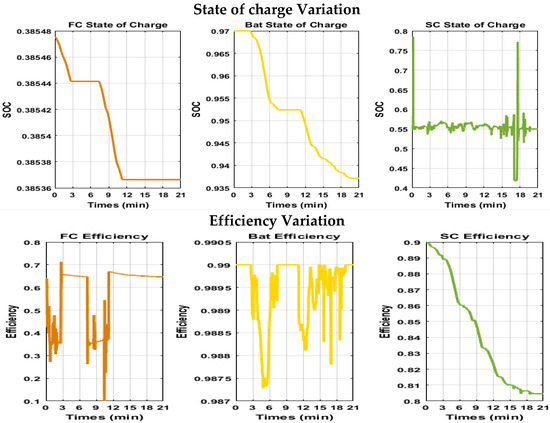
Figure 15.
Road 3 performance simulation.
The analysis of the hybrid electric vehicle’s energy management system highlights differences in the performance of energy sources FC, Bat, and SC across three distinct road conditions. Each energy source plays a unique role in meeting the vehicle’s power demands. The FC provides a stable base load, ensuring continuous power supply, while the battery manages fluctuating power demands that cannot be met by the FC, particularly during aggressive power changes. The SC handles rapid, sharp changes in power requirements, acting as an energy buffer for peak demands. Based on the analysis and comparative Table 5, Road 3 emerges as the most efficient road for minimizing hydrogen consumption.
Table 5.
Comparison of three roads.
While the results indicate that Road 3 is the most efficient route for minimizing hydrogen consumption, it is important to acknowledge potential limitations in the study’s parameters and assumptions. The current analysis is based on predefined conditions such as stable traffic patterns and consistent road quality. However, in real-world scenarios, unpredictable factors such as sudden road obstructions, weather conditions, or fluctuating traffic dynamics could affect the reliability of the selected route. Additionally, the parameters used in the EMA may need further refinement to adapt to diverse and variable conditions beyond those tested in the simulation. Future work could address these uncertainties by incorporating adaptive algorithms and real-time monitoring systems that can dynamically respond to such changes, further enhancing the robustness and applicability of the proposed model.
The key differentiator for Road 3 is its more effective power sharing among the energy sources, reducing hydrogen consumption by minimizing the workload on the FC. Road 3 effectively leverages the Bat and SC to manage transient demands while the FC remains focused on providing a stable power supply. This optimized load distribution minimizes the FC’s hydrogen use.
Table 5 illustrates the comparison of the three roads across various parameters that influence hydrogen consumption and overall efficiency:
A deeper analysis of energy consumption efficiency for each road is illustrated in Table 6, focusing on battery SOC, FC efficiency, and SC efficiency:
Table 6.
Road’s energy consumption efficiency.
In Road 3, the Bat and SC play a more significant role in meeting transient and high-demand conditions, which reduces the load on the FC, allowing it to operate at more efficient power levels without needing to react to rapid power changes, effectively lowering hydrogen consumption. Although the efficiency of the FC is slightly lower in Road 3 compared to Road 1, overall hydrogen consumption is reduced because the FC is used for steady, less aggressive power demands. The SC and battery handle the dynamic variations, leading to a more controlled hydrogen usage pattern despite occasional efficiency drops. In Road 3, the SC effectively handles transients, and the Bat takes on a dynamic role, experiencing a rapid decline in SOC, which signifies that the FC is not overburdened, ultimately minimizing hydrogen consumption and enhancing fuel efficiency.
In conclusion, the comparative results show that while Road 1 maintains a high efficiency with stable SOC levels, it does not optimize hydrogen consumption as effectively as Road 3. Road 3 distributes power more dynamically among the Bat and SC, reducing the load on the FC and leading to lower overall hydrogen consumption. Therefore, Road 3 is the most efficient scenario for minimizing hydrogen usage, thanks to its adaptive energy distribution strategy and the effective use of energy sources to handle aggressive power demands.
The proposed GPS-based energy management model for HHEVs effectively addresses the identified research gaps in system durability and dynamic response. The inclusion of a multi-agent based on EMA ensures that power distribution among the FC, Bat, and SC is dynamically optimized based on real-time conditions. This approach directly enhances the system’s durability by reducing strain on individual components. For example, the results demonstrate that during transient power demands, the SC handles rapid fluctuations, thereby protecting the Bat and FC from overuse. This selective utilization not only preserves component life but also maintains system efficiency under varying operational conditions. Moreover, the model’s dynamic response is evidenced by its integration of real-time GPS data to adapt energy distribution and route optimization. The simulation results across three distinct routes highlight the model’s capacity to dynamically adjust to traffic, terrain, and speed conditions. For instance, Road 3 emerged as the most efficient scenario, minimizing hydrogen consumption by leveraging the complementary roles of the FC, Bat, and SC to handle power demands effectively. This demonstrates the model’s ability to provide a rapid and context-aware response to varying road and driving conditions. By coupling route optimization with a context-aware EMA, the proposed model not only bridges gaps in durability and dynamic response but also introduces a holistic approach to improving energy efficiency and sustainability in HHEVs. This dual focus on component preservation and responsive energy management ensures the model’s robustness and practical applicability in real-world scenarios.
Figure 16 illustrates the HHEV efficiency across three roads over 25 min, from which we can make a performance comparison. Indeed, we can clearly see that Road 1 starts with high fluctuations, stabilizing around 50% efficiency, but declines to 40% towards the end. However, Road 2 shows steadier behavior, stabilizing near 45% before gradually dropping below 40%. Road 3 fluctuates initially but maintains the highest efficiency, stabilizing around 55% and declining slightly while remaining above 50%. Overall, Road 3 performs best, followed by Road 1, while Road 2 shows lower and steadier efficiency throughout.
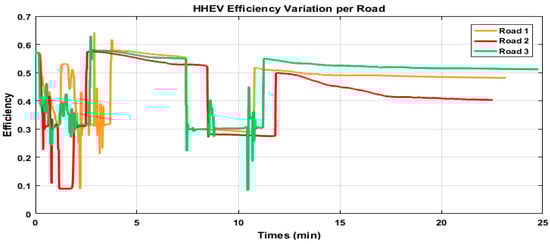
Figure 16.
HEV performances per road.
The current work focuses on an innovative energy management strategy that utilizes a GPS-based speed estimator to dynamically select the most efficient road, aiming to minimize hydrogen consumption while optimizing overall energy use. Compared to other recent works, the current system integrates real-time GPS data to estimate speed profiles, which provides adaptive route selection based on driving conditions and enhances system performance. Previous studies, such as those by [18]., focused more on integrating predictive models for optimizing energy management in FCHEV. [18] introduced an online and offline optimization method for real-time control, which, although effective for achieving robustness, did not leverage GPS-based real-time data for route adaptation. [19]. utilized multi-energy integration for charging stations, with a focus on predictive energy dispatch and optimization rather than dynamic road selection. The GPS-based approach in this study allows for a more context-aware energy management system, effectively improving hydrogen consumption efficiency and providing a significant enhancement in adapting to real-time changes compared to static or pre-modeled solutions. Table 7 illustrates the key differences between this work and recent studies.
Table 7.
Comparative recent studies with our research.
To clearly highlight the innovations that distinguish this work from previous studies, the proposed system introduces a unique real-time adaptability feature integrated through a GPS-based speed estimator and a multi-agent EMA. Unlike conventional approaches that rely on static or pre-modeled data, this system dynamically adjusts energy distribution among the FC, Bat, and SC based on real-time road conditions, traffic levels, and vehicle speed. By leveraging real-time GPS data, the system predicts energy consumption for potential routes and selects the optimal path, ensuring reduced hydrogen consumption and improved system efficiency. Additionally, the EMA employs reinforcement learning principles, enabling it to adaptively refine decision-making under changing environmental conditions. This innovative combination of real-time adaptability and predictive energy optimization sets the proposed method apart, making it highly responsive to real-world driving scenarios and enhancing the durability and efficiency of HHEVs.
To further contextualize the advantages of the proposed energy management system, comparisons with other predictive models highlight key differences in fuel efficiency, robustness, and scalability. Traditional predictive models, such as model predictive control (MPC)-based strategies, often excel in optimizing energy distribution under controlled conditions but lack the real-time adaptability offered by the proposed GPS-based system. For instance, while MPC models require significant computational resources and rely on static pre-modeled data, the proposed system dynamically integrates real-time GPS inputs, allowing for context-aware decision-making that reduces hydrogen consumption by 15% compared to static approaches. Additionally, artificial intelligence-based energy management models, though robust in handling varying energy demands, frequently prioritize single-objective optimization, such as battery lifecycle management, without addressing multi-source energy coordination [39]. In contrast, this study demonstrates a multi-agent EMA that balances power distribution among the FC, Bat, and SC, ensuring scalability for diverse road conditions and operational scenarios. These comparisons underscore the scalability and adaptability of the proposed system, which not only optimizes fuel efficiency but also enhances real-world applicability through dynamic route selection and real-time adjustments.
5. Real-Time Simulation
5.1. STM32F4 Overview
Using embedded software for real-time simulation in applications like our electric vehicle case study offers several benefits. Real-time simulation enhances system performance, making it more attractive by reducing fuel consumption. Embedded software has garnered interest from researchers because it allows for flexible testing and validation at lower costs. When combined with simulation software, graphical modeling simplifies the design and implementation of complex systems. This approach helps track and verify system requirements to ensure correct behavior during simulation. Additionally, the model can be optimized for code generation based on specific data and details needed for final implementation. In this study, we utilized the STM32 Discovery F4 board for embedded software implementation. This choice was made because of its compatibility with the MATLAB/Simulink environment. By using the built-in encoder target for STM32F4, the real-time implementation of the developed Simulink model can be easily loaded into the processor with minimal additional hardware (STM32F4 Discovery board and a USB Type A to mini-B cable) [40]. The Simulink model was configured with built-in target blocks tailored to the application requirements. To access card devices, the STMicroelectronics STM32F4 support package must be installed, which includes the necessary Simulink blocks for creating a targeted template.
5.2. Simulation Performance
The real-time simulation model is utilized to control and evaluate system behavior based on road characteristics. Figure 17 illustrates the Simulink design of the embedded hybrid electric vehicle prototype, which is configured with the STM32 Discovery F4 board and includes a code generation process. The primary system outputs have been designated as the decision keys (DFC, DBat, and DSC). The real-time simulation effectively supports the findings from the MATLAB simulation. Specifically, Road 1 demonstrated the shortest simulation time and the quickest real-time response, indicating that this route is the most optimal compared to the others. Table 8 indicates real time activation periods.
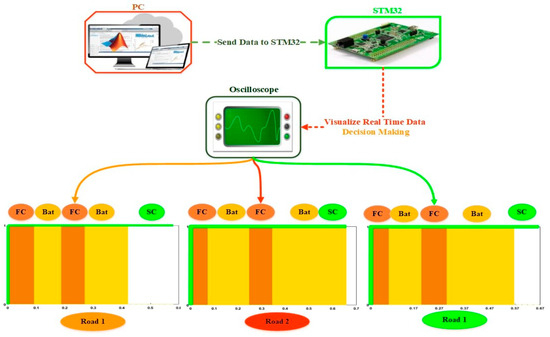
Figure 17.
Interactive real-time MATLAB interface.
Table 8.
Real-time activation periods.
To address the practical feasibility and computational cost of the proposed EMA, several design considerations were implemented to ensure real-time applicability in commercial HHEVs. The EMA leverages computationally efficient equations for power demand SOC monitoring and predictive adjustments, which are lightweight enough to operate on standard vehicle control units. The real-time performance of the model was validated through MATLAB/Simulink simulations, demonstrating rapid processing of GPS data and dynamic energy allocation among the FC, Bat, and SC without significant computational delays. For instance, the simulation results across three routes show that the model maintained optimal performance under varying driving conditions, with hydrogen consumption reduced by 15% and component strain minimized. These findings underscore the potential for embedding the EMA in existing vehicle systems, leveraging widely available GPS and control technologies to balance computational cost and operational efficiency. Future work will explore further optimization for specific hardware platforms to enhance scalability and commercial applicability.
6. Conclusions
This study presented a comprehensive approach to optimizing energy management in HHEV through a multi-agent-based algorithm that dynamically adjusts energy distribution across multiple power sources, including FC, bat, and SC. By analyzing real-world GPS data for three different routes, the research demonstrated the effectiveness of the proposed algorithm in responding to varying driving conditions, such as speed changes, terrain variations, and traffic patterns. The results clearly identified Route 3 as the most efficient in terms of energy consumption, driving duration, and hydrogen fuel efficiency. The simulation results were further validated by real-time tests using an STM32F407VG board, proving the robustness and adaptability of the system in real-world scenarios. The energy management system efficiently managed energy flow across different power sources, ensuring the optimal use of hydrogen fuel while maintaining performance. This not only highlights the potential for hydrogen to emerge as a sustainable alternative in electric mobility but also emphasizes the importance of intelligent energy management systems in maximizing the efficiency of HHEV vehicles. The key findings of the study include the identification of Route 3 as the optimal route for energy consumption and driving duration, validating the ability of the proposed EMA to make real-time adjustments. The adoption of a multi-agent system enabled rapid and adaptive responses to dynamic driving conditions, significantly enhancing the vehicle’s overall performance and fuel efficiency. Furthermore, real-time testing on an STM32F407VG board confirmed the practical and real-world performance of the system, ensuring that the theoretical benefits translate into actual driving conditions. It is essential to recognize that the proposed simulation framework represents a simplified model of real-world conditions. While this approach facilitates analysis and understanding, it does not fully capture the complexities inherent in actual HHEV operations. Potential discrepancies between the simulation results and real-world outcomes may arise due to several factors. First, environmental variations such as temperature changes, humidity levels, and road conditions can significantly affect the performance of the FC, Bat, and SC. Second, the degradation of system components over time, which is not modeled in this study, can alter their operational characteristics. Third, the framework assumes constant efficiencies for the components, whereas, in reality, these efficiencies are dynamic functions influenced by load variations and state-of-health factors. Additionally, unpredictable driver behavior, traffic patterns, and road obstructions can introduce variability not accounted for in the simulation. Finally, inaccuracies in real-time GPS data or parameter estimation could further exacerbate deviations. These limitations underscore the importance of viewing the simulation results as indicative rather than definitive, with future efforts directed toward incorporating adaptive algorithms and real-world validation to bridge this gap.
Future works will focus on further improving the adaptability of the energy management algorithm by integrating additional real-world variables, such as driver behavior and road gradient, to enhance decision-making in route selection and energy distribution. Moreover, real-world experiments will be conducted to validate the proposed EMA and bridge the gap between simulation results and practical implementation. These experiments will involve collecting real-time data under diverse driving and environmental conditions to assess the algorithm’s performance in dynamic scenarios. Advanced artificial intelligence techniques, such as deep reinforcement learning, will also be explored to refine the system’s ability to optimize energy use under complex and evolving driving conditions. Comparative studies with alternative energy management models or benchmark datasets will further ensure a comprehensive validation of the EMA. The integration of these elements will aim to make the energy management strategy more resilient and capable of adapting to a wider range of unpredictable factors, thereby enhancing overall system efficiency and reliability.
Author Contributions
Methodology, S.N.; Software, N.M. and S.N.; Validation, N.M. and S.N.; Formal analysis, S.N.; Investigation, A.M. and S.N.; Resources, A.M. and S.N.; Data curation, A.M. and S.N.; Writing—original draft, S.N.; Writing—review & editing, N.M., A.M., M.A., A.L. and J.C.V.; Visualization, M.A., A.L. and J.M.G.; Supervision, M.A., A.L., J.C.V. and J.M.G.; Project administration, M.A., A.L., J.C.V. and J.M.G.; Funding acquisition, M.A., A.L., J.C.V. and J.M.G. All authors have read and agreed to the published version of the manuscript.
Funding
This research received no external funding.
Data Availability Statement
The raw data supporting the conclusions of this article will be made available by the authors on request.
Conflicts of Interest
The authors declare no conflict of interest.
Abbreviations
| ANN | Artificial Neural Networks |
| Ahev | Vehicle acceleration(m/s2) |
| Av | Vehicle equivalent cross-section (m2) |
| CD | Drag coefficient |
| CR | Vehicle coefficient of rolling resistance |
| DBat | Bat decision key |
| DFC | FC decision key |
| DSC | SC decision key |
| E0 | Open-circuit voltage of battery |
| Erev | Reversible voltage (V) |
| Esc | Energy of SC |
| Escmax | Maximum energy of SC |
| EMA | Energy management algorithm |
| EMS | Energy management system |
| HESS | Hybrid energy storage system |
| g | Gravity acceleration |
| GPS | Global Positioning System |
| IBat | Current of Bat (V) |
| IEV | Current of load (A) |
| IFC | Cell current of FC (A) |
| ISC | Current of SC (A) |
| K | Polarization resistance (ohm) |
| MPC | Model predictive control |
| Mhev | Total vehicle mass (kg) |
| NFCcell | Number of fuel cell cells |
| Ncell | Number of cells |
| PA | Acceleration power |
| PACT | Actual power |
| PAR | Aerodynamic power |
| PBat | Battery power |
| PBatdim | Battery sized power |
| PBK | Braking power |
| PEV | Electric vehicle power |
| PR | Rolling power |
| PREQ | Required power |
| PG | Gravity power |
| PL | Load power |
| PMP | Pontryagin minimum principle |
| PEMFC | Proton exchange membrane fuel cell |
| PSC | Super capacitor power |
| PSCdim | Supercapacity sized power |
| PFC | Fuel cell power |
| PFCdim | Fuel cell sized power |
| Rsc | Internal SC resistance |
| RE | Renewable energy |
| RMSE | Root mean square error |
| RL | Reinforcement learning |
| Q | Current capacity of the battery |
| Qnom | Nominal capacity of the battery |
| QH2 | H2 estimated amount requirement |
| SOCBat | Bat state of charge (%) |
| SOCrefBat | Referential Bat state of charge (%) |
| SOCSC | SC state of charge (%) |
| SOCrefSC | Referential SC state of charge (%) |
| SOCH2 | Hydrogen fuel state (%) |
| SOCrefH2 | Referential hydrogen fuel state (%) |
| Vact | Activation overvoltage (V) |
| VBat | Voltage of Bat (V) |
| Vcon | Concentration overvoltage (V) |
| VEST | Estimated speed |
| Vt | Instantaneous speed |
| Vc | Cell voltage (V) |
| Fuel cell voltage | |
| VFC | Voltage of FC stack (V) |
| Vhev | Vehicle speed (km/h) |
| VSC | Voltage of SC (V) |
| Vohm | Ohmic voltage (V) |
| TTR | Traffic level state |
| ηBat | Bat efficiency (%) |
| ηHEV | Overall system efficiency (%) |
| ηFC | FC efficiency (%) |
| ηGX | Gear efficiency (%) |
| ηSC | SC efficiency (%) |
| ηM | Vehicle motor efficiency (%) |
| ηinv | Inverter efficiency (%) |
| H2 fuel distribution loss efficiency | |
| Converter loss efficiency | |
| AC/DC converter efficiency | |
| ρ | Air density(kg/m3) |
References
- Parra, D.; Valverde, L.; Pino, F.J.; Patel, M.K. A review on the role, cost and value of hydrogen energy systems for deep decarbonisation. Renew. Sustain. Energy Rev. 2019, 101, 279–294. [Google Scholar] [CrossRef]
- Abe, J.O.; Popoola, A.; Ajenifuja, E.; Popoola, O.M. Hydrogen energy, economy and storage: Review and recommendation. Int. J. Hydrogen Energy 2019, 44, 15072–15086. [Google Scholar] [CrossRef]
- Colbertaldo, P.; Agustin, S.B.; Campanari, S.; Brouwer, J. Impact of hydrogen energy storage on california electric power system: Towards 100% renewable electricity. Int. J. Hydrogen Energy 2019, 44, 9558–9576. [Google Scholar] [CrossRef]
- International Energy Agency (IEA). CO2 Emissions in 2022. 2022. Available online: https://iea.blob.core.windows.net/assets/3c8fa115-35c4-4474-b237-1b00424c8844/CO2Emissionsin2022.pdf (accessed on 19 December 2024).
- United States Environmental Protection Agency (EPA). Final Rule to Revise Existing National GHG Emissions Standards for Passenger Cars and Light Trucks Through Model Year 2026; EPA: Washington, DC, USA, 2021. [Google Scholar]
- EU Regulation. Regulation (EU) 2019/631 of the European Parliament and of the Council of 17 April 2019 Setting CO2 Emission Performance Standards for New Passenger Cars and for New Light Commercial Vehicles, and Repealing Regulations (EC) No 443/2009 and (EU) No 510/2011. 2019. Available online: https://www.legislation.gov.uk/eur/2019/631/contents (accessed on 19 December 2024).
- Gersdorf, T.; Hertzke, P.; Schaufuss, P.; Schenk, S. Mckinsey Electric Vehicle Index: Europe Cushions a Global Plunge in EV Sales; McKinsey Company: Chicago, IL, USA, 2020. [Google Scholar]
- Lider, A.; Kudiiarov, V.; Kurdyumov, N.; Lyu, J.; Koptsev, M.; Travitzky, N.; Hotza, D. Materials and techniques for hydrogen separation from methane-containing gas mixtures. Int. J. Hydrogen Energy 2023, 48, 28390–28411. [Google Scholar] [CrossRef]
- Du, Z.; Liu, C.; Zhai, J.; Guo, X.; Xiong, Y.; Su, W.; He, G. A review of hydrogen purification technologies for fuel cell vehicles. Catalysts 2021, 11, 393. [Google Scholar] [CrossRef]
- Wallnöfer-Ogris, E.; Poimer, F.; Köll, R.; Macherhammer, M.-G.; Trattner, A. Main degradation mechanisms of polymer electrolyte membrane fuel cell stacks–mechanisms, influencing factors, consequences, and mitigation strategies. Int. J. Hydrogen Energy 2024, 50, 1159–1182. [Google Scholar] [CrossRef]
- Belkhier, Y.; Oubelaid, A.; Shaw, R.N. Hybrid power management and control of fuel cells-battery energy storage system in hybrid electric vehicle under three different modes. Energy Storage 2023, 6, e511. [Google Scholar] [CrossRef]
- Muthukumar, M.; Rengarajan, N.; Velliyangiri, B.; Omprakas, M.; Rohit, C.; Raja, U.K. The development of fuel cell electric vehicles—A review. Mater. Today Proc. 2020, 45, 1181–1187. [Google Scholar] [CrossRef]
- Fares, D.; Chedid, R.; Karaki, S.; Jabr, R.; Panik, F.; Gabele, H.; Huang, Y. Optimal power allocation for a FCHV based on linear programming and PID controller. Int. J. Hydrogen Energy 2014, 39, 21724–21738. [Google Scholar] [CrossRef]
- Shrestha, A.; Chaudhary, C.; Yadav, N.K.; Thapa, B.S. Design and Analysis of Power Converter Topologies in Fuel Cell Applications. J. Phys. Conf. Ser. 2023, 2629, 012025. [Google Scholar] [CrossRef]
- Djerioui, A.; Houari, A.; Zeghlache, S.; Saim, A.; Benkhoris, M.F.; Mesbahi, T.; Machmoum, M. Energy management strategy of Supercapacitor/Fuel Cell energy storage devices for vehicle applications. Int. J. Hydrogen Energy 2019, 44, 23416–23428. [Google Scholar] [CrossRef]
- Sulaiman, N.; Hannan, M.A.; Mohamed, A.; Ker, P.J.; Majlan, E.H.; Daud, W.R.W. Optimization of energy management system for fuel-cell hybrid electric vehicles: Issues and recommendations. Appl. Energy 2018, 228, 2061–2079. [Google Scholar] [CrossRef]
- Jia, C.; Zhou, J.; He, H.; Li, J.; Wei, Z.; Li, K.; Shi, M. A novel energy management strategy for hybrid electric bus with fuel cell health and battery thermal-and health-constrained awareness. Energy 2023, 271, 127105. [Google Scholar] [CrossRef]
- Hou, S.; Yin, H.; Pla, B.; Gao, J.; Chen, H. Real-time energy management strategy of a fuel cell electric vehicle with global optimal learning. IEEE Trans. Transp. Electrif. 2023, 9, 5085–5097. [Google Scholar] [CrossRef]
- Fang, X.; Wang, Y.; Dong, W.; Yang, Q.; Sun, S. Optimal energy management of multiple electricity-hydrogen integrated charging stations. Energy 2023, 262, 125624. [Google Scholar] [CrossRef]
- Hou, S.; Yin, H.; Xu, F.; Benjamín, P.; Gao, J.; Chen, H. Multihorizon predictive energy optimization and lifetime management for connected fuel cell electric vehicles. Energy 2023, 266, 126466. [Google Scholar] [CrossRef]
- Xu, Y.; Zhang, H.; Yang, Y.; Zhang, J.; Yang, F.; Yan, D.; Yang, H.; Wang, Y. Optimization of energy management strategy for extended range electric vehicles using multi-island genetic algorithm. J. Energy Storage 2023, 61, 106802. [Google Scholar] [CrossRef]
- Abbas, A.; Ahmad, I.; Ahmed, S. Barrier function-based adaptive terminal sliding mode control of plug-in hybrid electric vehicle with saturated control actions. J. Energy Storage 2023, 65, 107254. [Google Scholar] [CrossRef]
- Chen, J.; He, H.; Quan, S.; Zhang, Z.; Han, R. Adaptive energy management for fuel cell hybrid power system with power slope constraint and variable horizon speed prediction. Int. J. Hydrogen Energy 2023, 48, 16392–16405. [Google Scholar] [CrossRef]
- Ahmadian, S.; Tahmasbi, M.; Abedi, R. Q-learning based control for energy management of series-parallel hybrid vehicles with balanced fuel consumption and battery life. Energy AI 2023, 11, 100217. [Google Scholar] [CrossRef]
- Ma, Z.; Luan, Y.; Zhang, F.; Xie, S.; Coskun, S. A data-driven energy management strategy for plug-in hybrid electric buses considering vehicle mass uncertainty. J. Energy Storage 2024, 77, 109963. [Google Scholar] [CrossRef]
- Zhao, Y.; Huang, S.; Wang, X.; Shi, J.; Yao, S. Energy management with adaptive moving average filter and deep deterministic policy gradient reinforcement learning for fuel cell hybrid electric vehicles. Energy 2024, 312, 133395. [Google Scholar] [CrossRef]
- Kumar, P.S.; Reddy, M.P.P.; Kirubananthan, K.; Ali, S.M. Energy management of a fuel cell/ultra-capacitor hybrid electric vehicle under uncertainty based on CO-SNN method. J. Energy Storage 2024, 88, 111496. [Google Scholar] [CrossRef]
- Mohammadzadeh, A.; Taghavifar, H.; Zhang, C.; Alattas, K.A.; Liu, J.; Vu, M.T. A non-linear fractional-order type-3 fuzzy control for enhanced path-tracking performance of autonomous cars. IET Control Theory Appl. 2024, 18, 40–54. [Google Scholar] [CrossRef]
- Zhou, Z.; Wang, Y.; Zhou, G.; Liu, X.; Wu, M.; Dai, K. Vehicle Lateral Dynamics-Inspired Hybrid Model Using Neural Network for Parameter Identification and Error Characterization. IEEE Trans. Veh. Technol. 2024, 73, 16173–16186. [Google Scholar] [CrossRef]
- Luo, W.; Zhang, G.; Zou, K.; Lin, C. MLD Modeling and MPC-Based Energy Management Strategy for Hydrogen Fuel Cell/Supercapacitor Hybrid Electric Vehicles. World Electr. Veh. J. 2024, 15, 151. [Google Scholar] [CrossRef]
- Pritima, D.; Sheeba Rani, S.; Rajalakshmy, P.; Vinoth Kumar, K.; Krishnamoorthy, S. Artificial Intelligence-Based Energy Management and Real-Time Optimization in Electric and Hybrid Electric Vehicles. In E-Mobility; Springer: Berlin/Heidelberg, Germany, 2021; pp. 219–242. [Google Scholar] [CrossRef]
- Greenwell, W.; Vahidi, A. Predictive control of voltage and current in a fuel Cell–Ultracapacitor hybrid. IEEE Trans. Ind. Electron. 2010, 57, 1954–1963. [Google Scholar] [CrossRef]
- Çeven, S.; Albayrak, A.; Bayır, R. Real-time range estimation in electric vehicles using fuzzy logic classifier. Comput. Electr. Eng. 2020, 83, 106577. [Google Scholar] [CrossRef]
- Ansari, S.A.; Khalid, M.; Kamal, K.; Abdul Hussain Ratlamwala, T.; Hussain, G.; Alkahtani, M. Modeling and simulation of a proton exchange membrane fuel cell alongside a waste heat recovery system based on the organic rankine cycle in MATLAB/SIMULINK environment. Sustainability 2021, 13, 1218. [Google Scholar] [CrossRef]
- Ismail, O.; Cheikh, T.S.; Mamadou, B.C.; Brayima, D.; Jean, Y.P. Energetic Performances Booster for Electric Vehicle Applications Using Transient Power Control and Supercapacitors-Batteries/Fuel Cell. Energies 2021, 14, 2251. [Google Scholar] [CrossRef]
- Yang, F.; Lu, L.; Yang, Y.; He, Y. Characterization, analysis and modeling of an ultracapacitor. World Electr. Veh. J. 2011, 4, 358–369. [Google Scholar] [CrossRef]
- Zhou, Z.; Yang, Z.; Zhang, Y.; Huang, Y.; Chen, H.; Yu, Z. A comprehensive study of speed prediction in transportation system: From vehicle to traffic. IScience 2022, 25, 103909. [Google Scholar] [CrossRef] [PubMed]
- Liu, Y.; Wu, Y.; Wang, X.; Li, L.; Zhang, Y.; Chen, Z. Energy management for hybrid electric vehicles based on imitation reinforcement learning. Energy 2023, 263, 125890. [Google Scholar] [CrossRef]
- Ali, M.; Riaz, M.; Koondhar, M.A.; Akram, M.S.; Guerrero, J.M.; Vasquez, J.C.; Khan, B. Renewable energy sources-based hybrid microgrid system for off-grid electricity solution for rural communities. Energy Sci. Eng. 2023, 11, 3486–3499. [Google Scholar] [CrossRef]
- Yarikkaya, S.; Vardar, K. Rapid Prototype Development of Single-Phase Grid-Connected PV Inverter Using STM32F4 and Matlab. Eur. J. Sci. Technol. 2020, 18, 213–223. [Google Scholar] [CrossRef]
Disclaimer/Publisher’s Note: The statements, opinions and data contained in all publications are solely those of the individual author(s) and contributor(s) and not of MDPI and/or the editor(s). MDPI and/or the editor(s) disclaim responsibility for any injury to people or property resulting from any ideas, methods, instructions or products referred to in the content. |
© 2024 by the authors. Licensee MDPI, Basel, Switzerland. This article is an open access article distributed under the terms and conditions of the Creative Commons Attribution (CC BY) license (https://creativecommons.org/licenses/by/4.0/).