1. Introduction
Insulation testing plays a pivotal role in ensuring the stable operation of equipment and systems, serving as a critical component in the automated evaluation of fundamental electrical properties, such as conductivity and insulation in cable networks [
1]. With the continuous advancement of science and technology, the diversification of equipment functionality and the expansion of system scale have posed higher demands on insulation testing for increasingly complex system architectures and cable network topologies [
2]. Traditional manual testing methods fail to meet the efficiency and accuracy requirements of these complex scenarios. Against this backdrop, enhancing the efficiency and intelligence of insulation testing has become an inevitable trend in its development [
3,
4,
5].
The team led by Zhang Baoqiang at Nanjing University of Aeronautics and Astronautics explored an aircraft cable testing architecture based on the CAN bus [
6]. While their work validated the CAN bus communication functionality, it did not address the accuracy and efficiency of insulation testing. Similarly, the team led by Wang Can at Wuhan University of Technology developed a cable detection system for automobiles [
7], which accurately identified issues such as open circuits, short circuits, and misconnections in the devices under test but lacked the capability to assess cable resistance and perform insulation testing. The team led by Han Chengjiang at the University of Electronic Science and Technology of China leveraged FPGA technology to automate cable testing [
8], achieving an accuracy of over 99% for the detection of 48-core cables. However, their system exhibited limitations in the number of testing points and reliability. Meanwhile, the team led by Zhang Hongjian at Dalian Jiaotong University designed a conduction and insulation testing system for CRH3 high-speed train cables [
9], which focused on the reliability of wireless data transmission but was tailored to a specific application scenario, lacking generalizability. While these studies have improved testing efficiency and accuracy in specific domains, many systems exhibit significant limitations, such as being highly specialized, lacking versatility, and offering limited scalability.
To address this challenge, this study applies machine learning techniques to the field of insulation testing. Machine learning, particularly supervised learning, has garnered attention for its potential in anomaly detection and process optimization. Among these approaches, decision tree models are favored for their interpretability and efficiency. However, despite their theoretical advantages, practical challenges remain regarding the integration of these techniques into existing testing platforms and ensuring the models’ effectiveness and accuracy.
Currently, machine learning has found numerous applications in testing engineering, such as fault detection and data classification [
10,
11]. Some methods employ traditional machine learning algorithms [
12,
13,
14], while others leverage recent deep learning architectures. However, the primary limitation of deep learning approaches lies in their lack of interpretability; they often function as “black-box” models and require extensive datasets for training [
11]. By contrast, decision tree models enhance testing efficiency by classifying data through feature extraction from collected signals and offer significant interpretability. The extensive application of machine learning in engineering provides novel insights for insulation testing.
This paper proposes an FPGA-based insulation testing system that employs machine learning techniques to develop an intelligent and interpretable system, ensuring precision and efficiency. The system relies solely on currently collected signals to detect scenarios across conductivity and insulation contexts. Beyond the technological basis, the novelty of this work lies in addressing gaps in scalability, adaptability, and generalizability by integrating domain-specific feature extraction techniques, adaptive filtering methods, and a novel focus on minimizing redundancy in test sequences to optimize both performance and reliability. The innovations of this study can be summarized as follows: (i) Utilizing only fundamental voltage and current signals from data acquisition, rather than delving into more complex signal domains; (ii) Employing inherently interpretable machine learning methods (i.e., decision trees) to provide transparent classification capabilities, an t approach that focuses on “interpretability by design” rather than seeking post-hoc explanations for black-box models [
15]; (iii) Significantly improving the testing efficiency and accuracy of existing equipment through the application of machine learning methods.
2. Preliminary Overview
2.1. Testing Anomalies
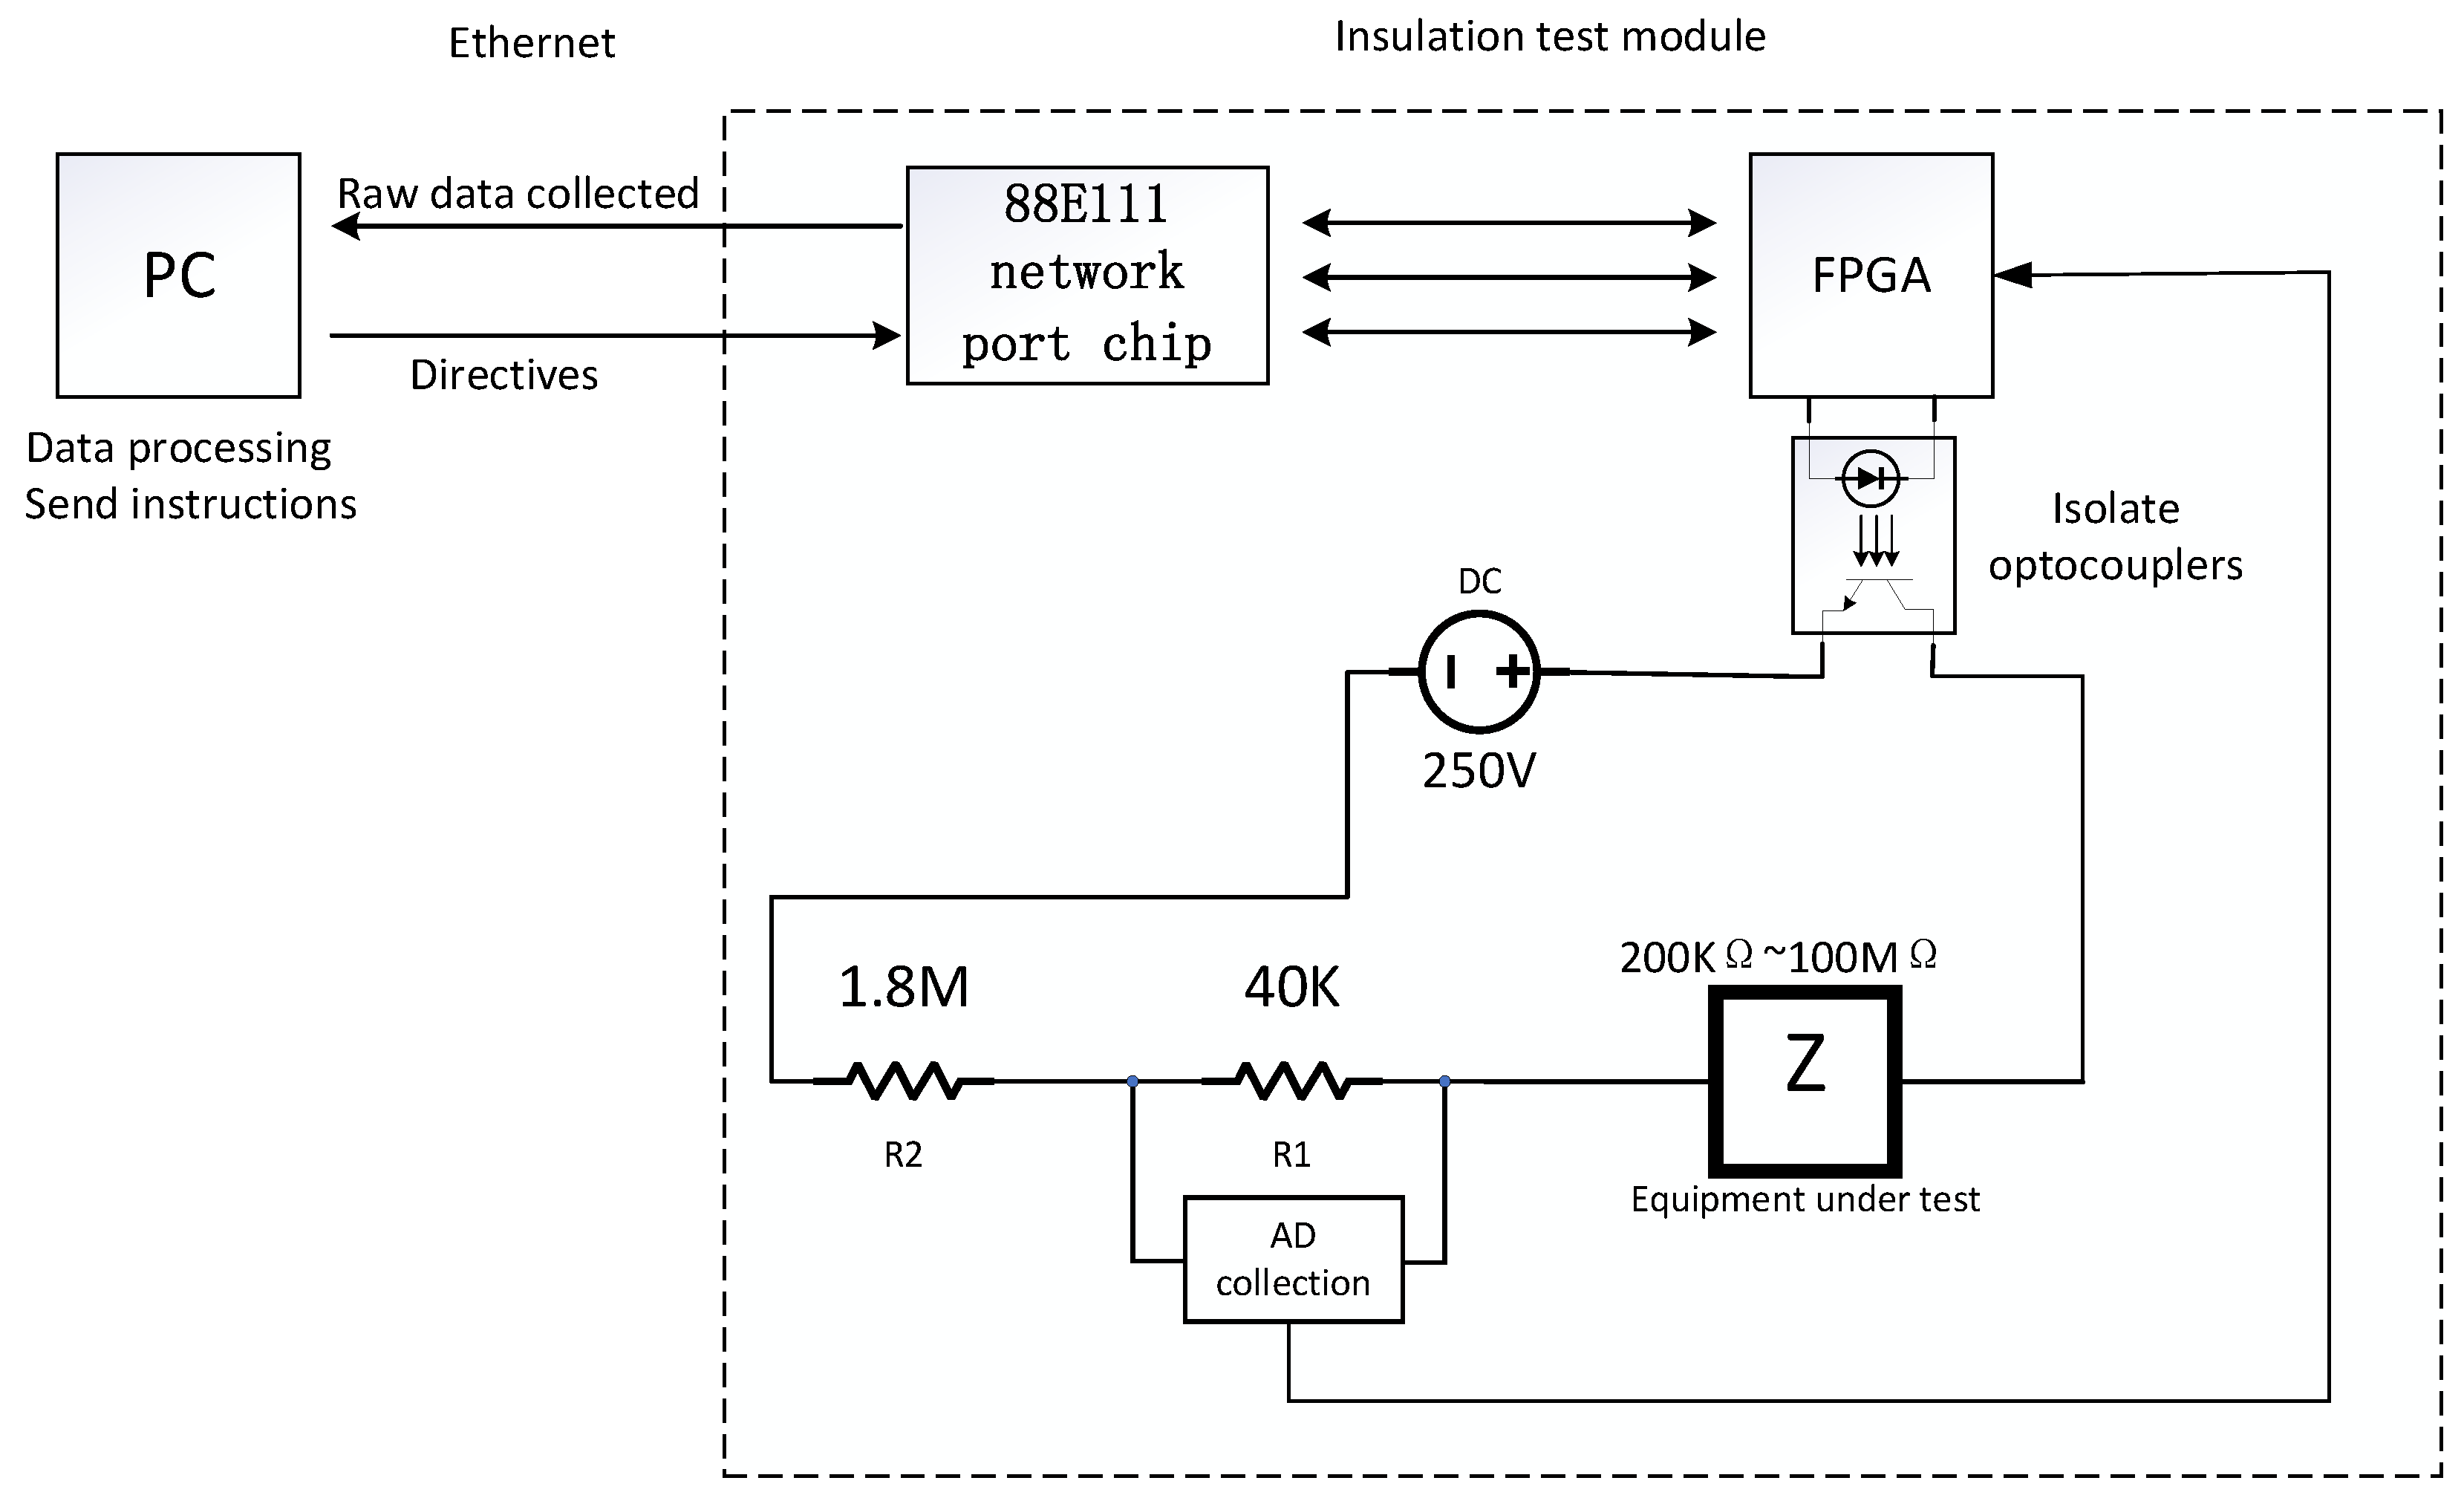
The host computer utilizes a domestically produced PC and establishes a communication link with the lower computer via Ethernet. It is responsible for issuing control commands and receiving data uploaded by the lower computer for parsing and processing. The lower computer consists of three main components: the communication module, the test excitation and data acquisition module, and the I/O control module. The communication module serves as the central communication hub, receiving commands from the host computer, distributing them to various functional boards, and aggregating the data collected by the test excitation and acquisition module for upload to the host computer to support subsequent data analysis and processing. The main communication control module communicates with other functional modules via the RS-422 bus, enabling high-speed and reliable data transmission to achieve efficient inter-module collaboration.
FPGA offers more extensive programmable logic resources, enhanced functionality, and greater ease of programming, making it widely applicable in industrial, aerospace, and communication fields. The main controller employs the HWD2V1000 FPGA model developed by CSMT, which is compatible with Xilinx’s Virtex VII series FPGA. It can serve as a Pin-to-Pin replacement while offering abundant on-chip resources and excellent software compatibility. The ADC used is the SM197MP from Guowei Electronics, a 12-bit analog-to-digital conversion chip capable of achieving a sampling rate of 100 ksps. In this study, the ADC operates at a sampling rate of 1 ksps.
2.2. The Testing Platform
The FPGA-based insulation testing platform supports three distinct testing modes: continuity testing, static testing, and insulation testing. The principle of the insulation testing circuit is illustrated in
Figure 1.
The insulation testing mode utilizes a 250 V DC excitation source. By employing a series resistor for voltage division, the divided voltage is controlled within the acquisition range of the ADC (Analog-to-Digital Converter) chip [
16]. The voltage range during insulation testing can be calculated using Equations (1) and (2). Specifically, when the resistance of the device under test is at its minimum within the measurement range, the voltage acquired by the ADC reaches its maximum. Conversely, when the resistance of the device under test is at its maximum within the measurement range, the voltage acquired by the ADC reaches its minimum.
One of the primary challenges in the insulation testing process is the accurate detection of insulation resistance. This complexity arises from the intricate current behaviors within the insulation layer under high-voltage excitation, where weak leakage currents are difficult to measure amidst significant interference. When DC high voltage is applied to an insulating device, small currents flow both on the surface and within the material. These currents include surface leakage current, absorption current, and capacitive current [
17,
18].
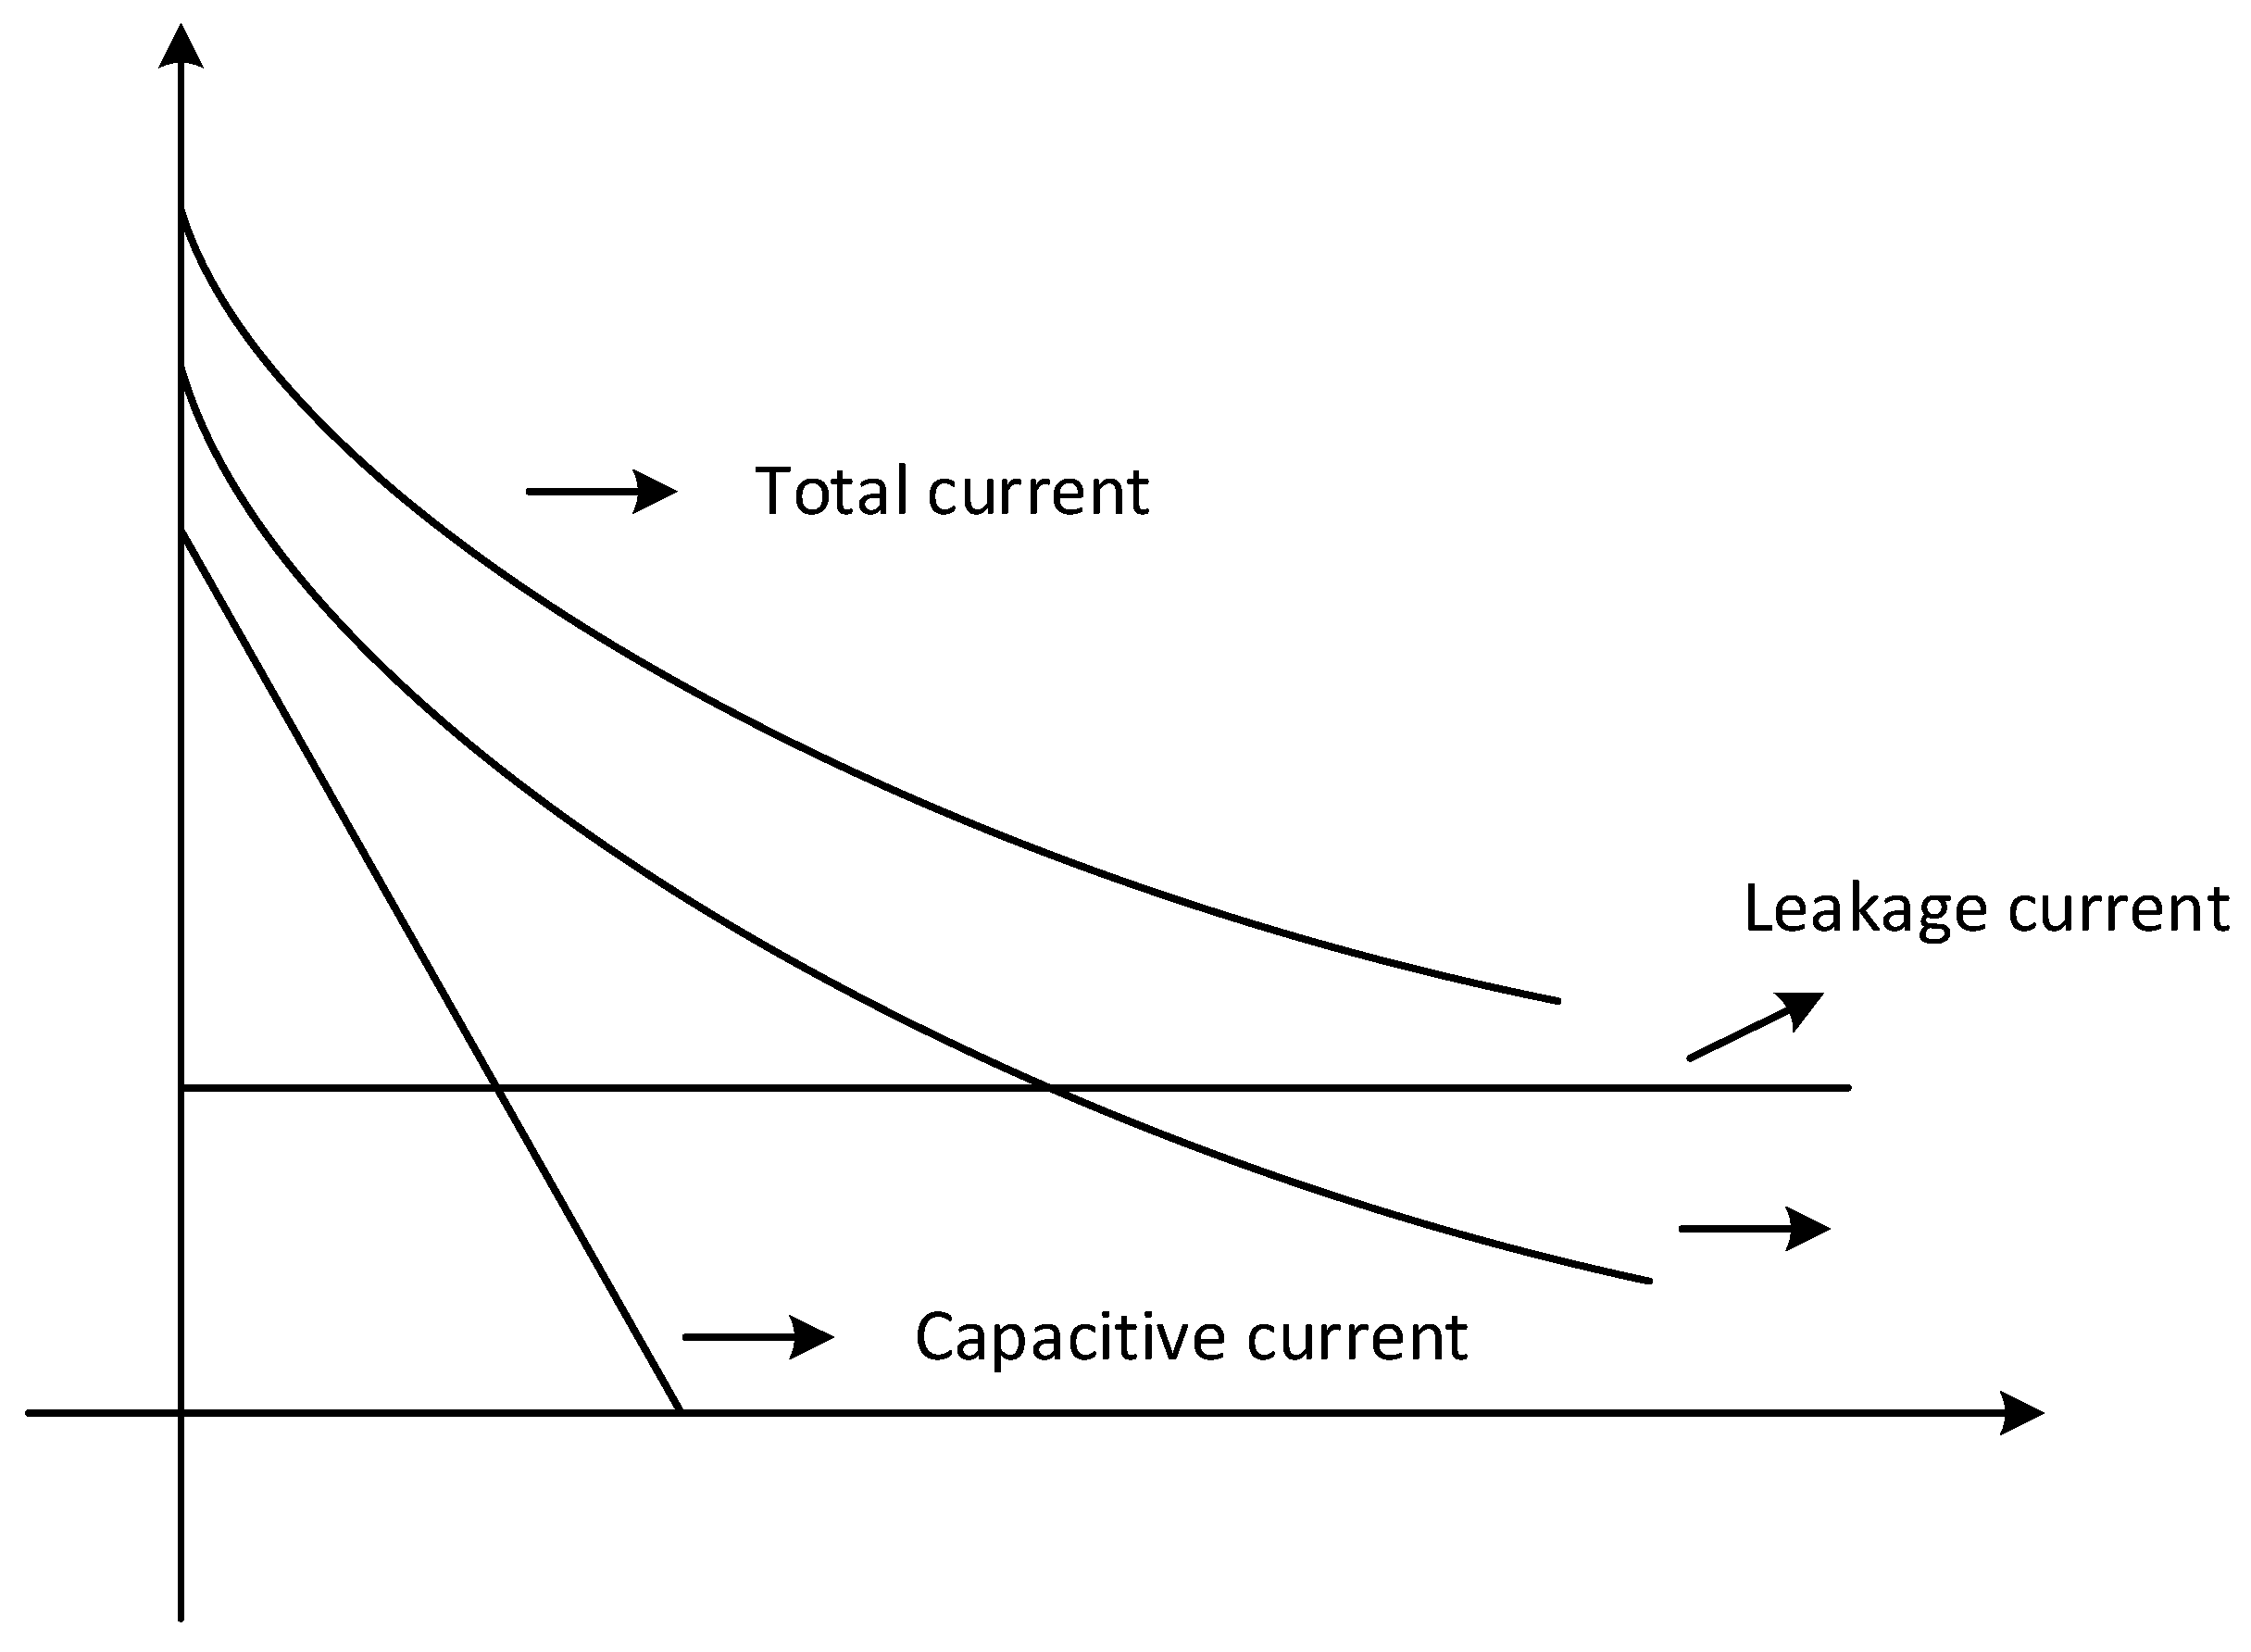
Leakage current: This is a small current flowing along the surface of the insulating medium. Under low electric field intensity, it generally follows Ohm’s law and remains constant over time. The insulation resistance is typically defined as the ratio of the applied voltage to the leakage current. Absorption current: This occurs when a DC voltage is applied to the insulating material. Due to the inhomogeneity within the dielectric medium, slow polarization and interfacial polarization occur, generating the absorption current. This current decreases exponentially over time but decays slowly, sometimes lasting for several minutes. Capacitive current: When DC voltage is applied, the dielectric material undergoes rapid polarization, leading to a capacitive current, analogous to the charging current in a capacitor. This current is transient and decays quickly. Initially, capacitive current dominates the total current, but its impact diminishes over time [
19,
20]. The relationship between these three types of currents and time is illustrated in
Figure 2.
To obtain an accurate measurement of insulation resistance, it is necessary to collect current data only after the absorption current and capacitive current have sufficiently decayed. If the insulation resistance is calculated from the current data before the absorption and capacitive currents have fully attenuated, this would be considered an anomaly in the test, as it does not align with the fundamental principles of insulation testing. However, to facilitate signal acquisition, the current signal is converted into a voltage signal through a voltage-divider resistor.
2.3. Test Optimization
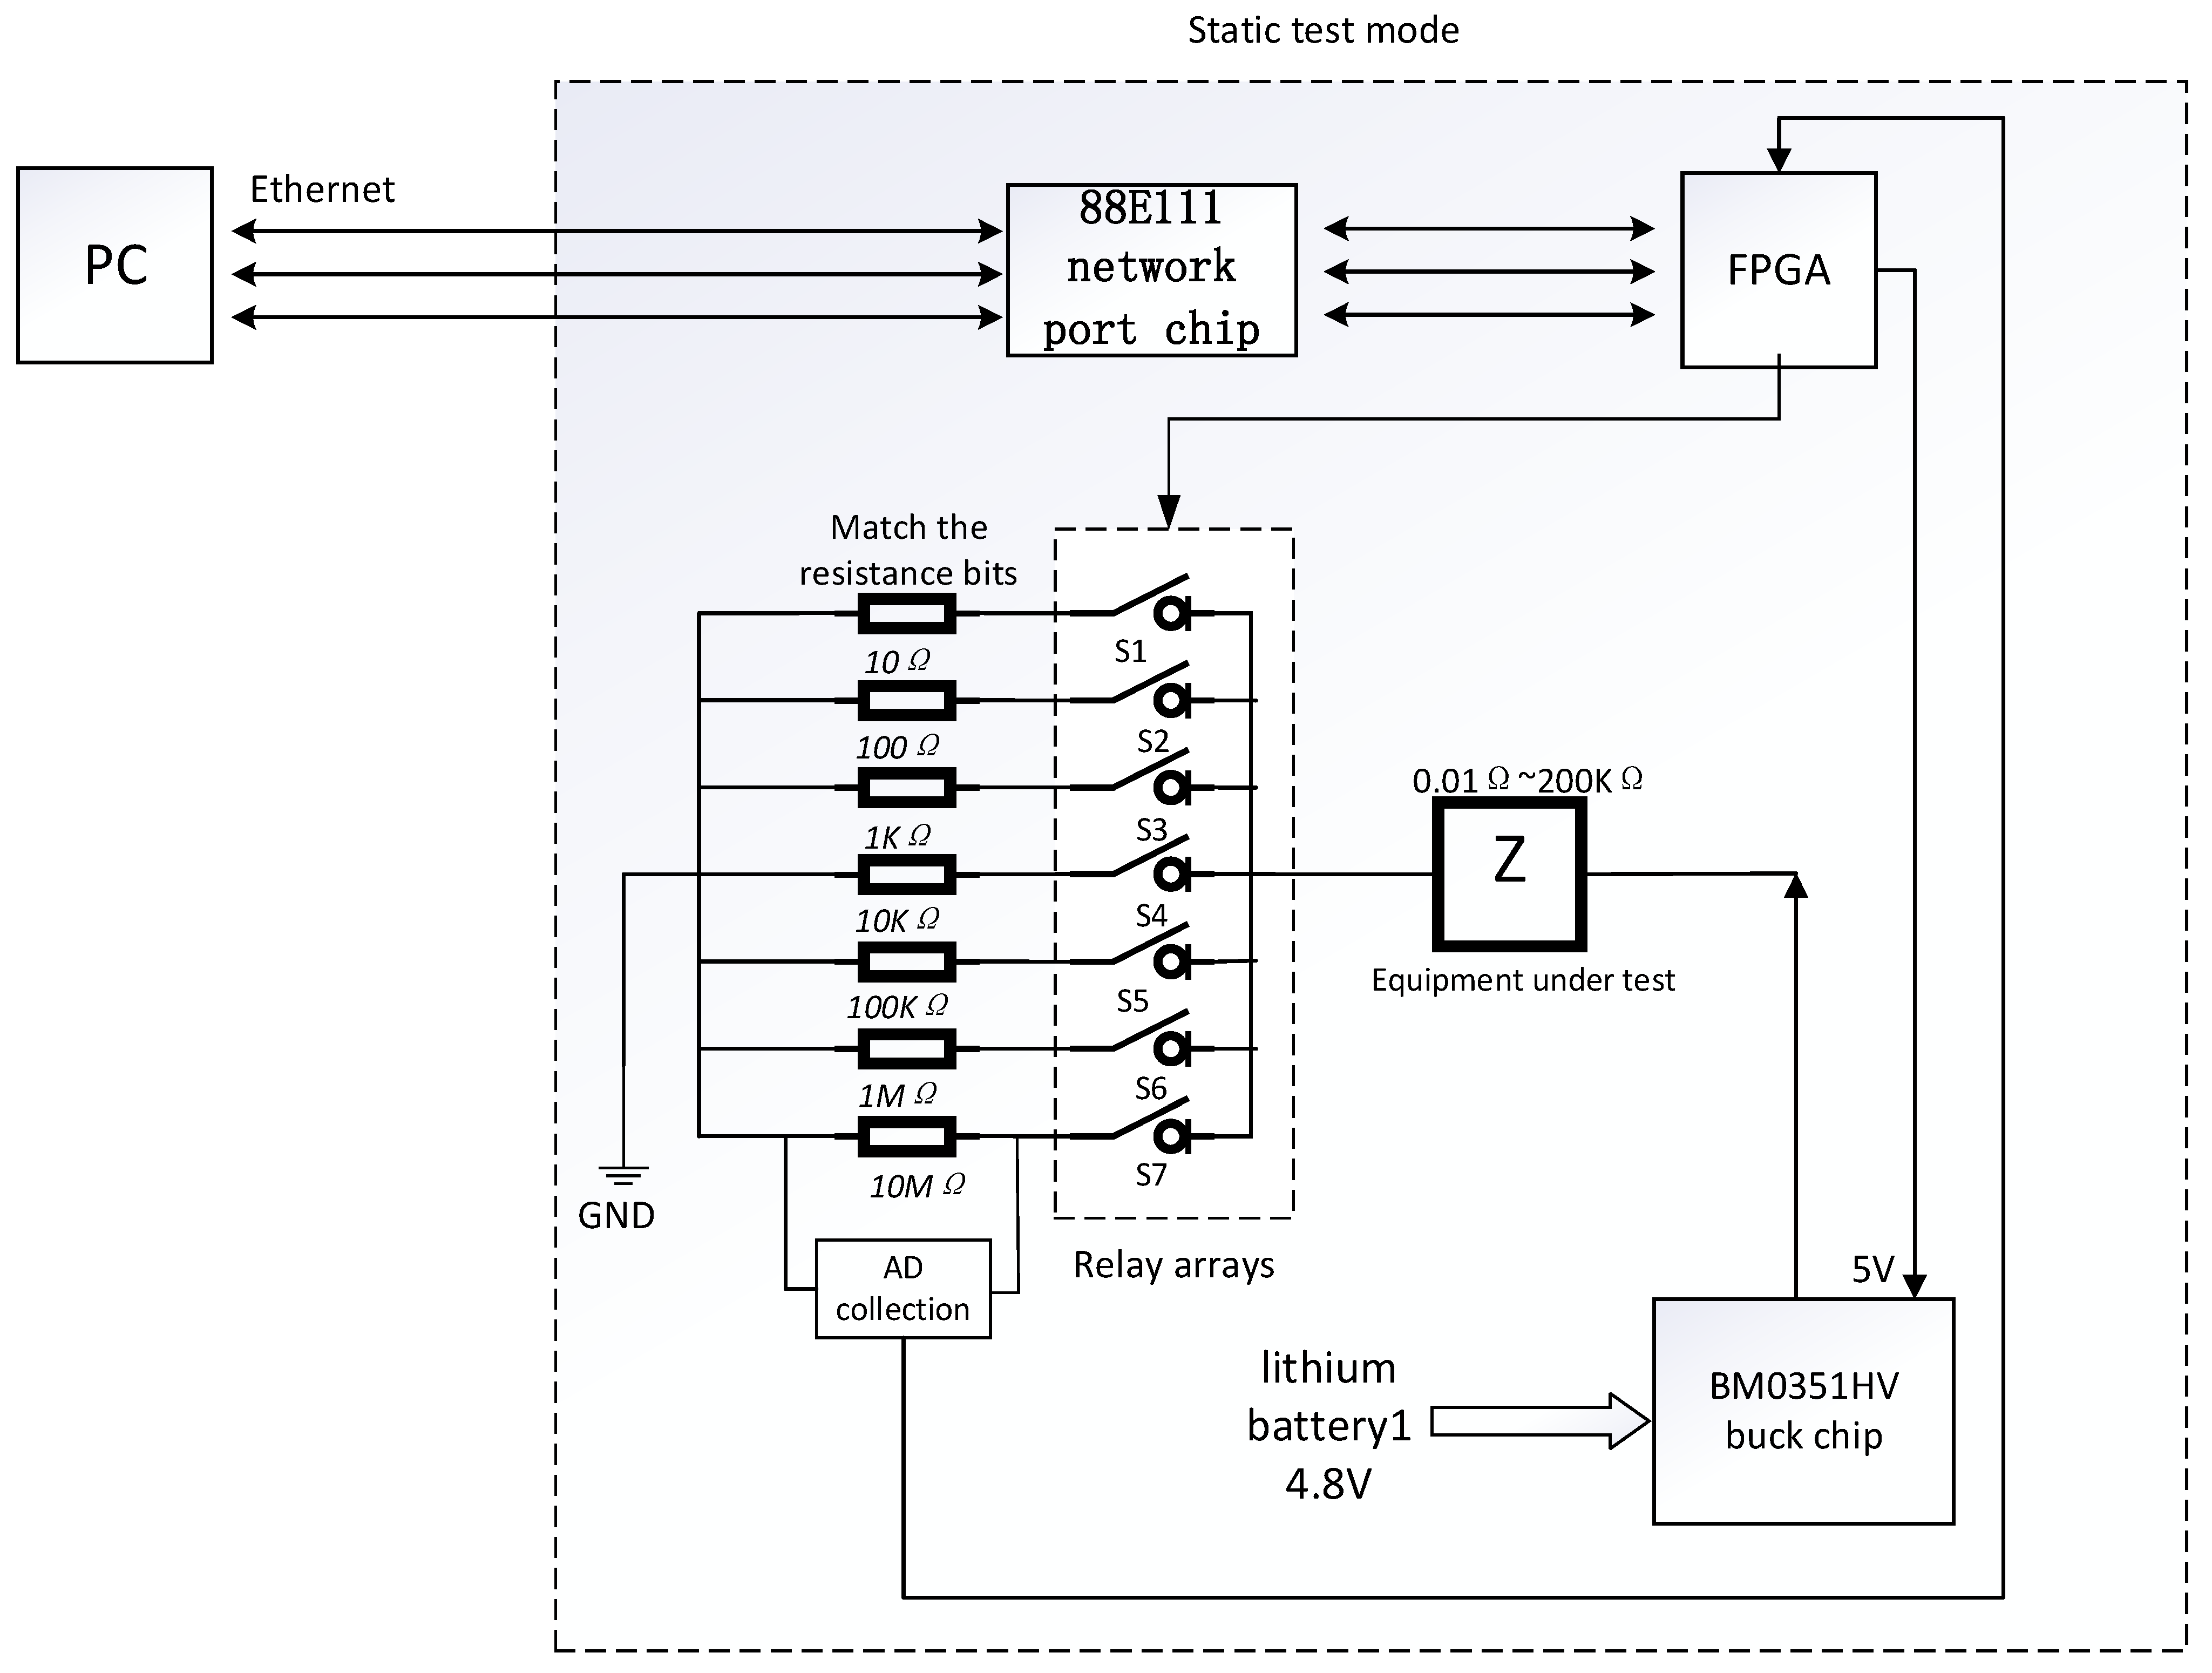
In static testing mode, the use of series voltage division provides a simple and reliable method particularly suitable for measuring high-resistance values. During the insulation testing process, the device under test may be in a state between conductivity and insulation, requiring a wide testing range. To accommodate the ADC’s range and ensure measurement accuracy, the testing circuit employs an adaptive range-switching design. Using a relay array, the matching resistor in series with the device under test is automatically adjusted according to the measurement range. This ensures that the voltage division across the matching resistor falls within the preset range before data acquisition and storage. The testing principle is shown in
Figure 3.
In static testing mode, once the test is initiated, the relay for the lowest range is first closed, and the relay for the static testing circuit is activated to apply the excitation signal. The acquired voltage data is then transmitted to the host computer for analysis. If the voltage meets the set threshold criteria, the result is calculated and stored. If it does not meet the threshold, the system switches to the next range, repeating the process until the voltage meets the required threshold.
Due to the sequential range-switching during resistance measurements, each test starts from the lowest range and gradually increases until the voltage division across the matching resistor meets the threshold. This process inevitably results in redundant switching times, regardless of the resistance value. In particular, when measuring high resistance or insulation resistance, the system typically requires six tests and range switches, significantly increasing the overall testing time. This operation not only prolongs the testing duration but also has the potential to impact both testing efficiency and accuracy.
2.4. Machine Learning
In the applications of anomaly detection and process optimization, both tasks are classified as supervised learning problems. In the supervised learning framework, the main goal is to construct a function that efficiently associates a target variable (y ∈ Y) with a given set of observable features (x ∈ X). This function is built by inductive learning on a dataset, where the dataset consists of (N) pairs of samples, each pair of samples of the form ((x
i, y
i)), where each pair of samples associates the target variable (y
i) to the corresponding set of features (x
i) [
21].
In a classification task, the target set (Y) includes all possible categories—e.g., in anomaly detection, it could be an anomaly in current collection, while in process optimization, it could be the collected voltage value. The feature set (X), on the other hand, contains all observable variables that have an impact on the prediction of the target variable (y). By learning these sample pairs, the supervised learning model is able to accurately classify or predict unknown data to effectively identify anomalies or optimize the process.
How the function f is defined and how it is learned obviously depend on the machine learning algorithm employed. According to the type of problem to be solved on the domestic insulation test platform, a decision tree (DT) model is used in the proposed method. The main idea is to construct a tree-like classification or regression process based on the data and make step-by-step feature judgments on the samples to finally complete the classification or regression.
3. Proposed Method
This section summarizes the methods used for both anomaly detection and process optimization tasks. In the anomaly detection task, the target current signal is converted into a voltage signal through a series resistor for further processing. The goal of this paper is to employ explainable machine learning techniques in hardware engineering to detect test anomalies and optimize testing processes using the acquired signals.
3.1. Data Pre-Processing
3.1.1. Buck Chopper Circuit
The actual measurement scenario for static resistance involves testing the internal static resistance of each module after the device under test has been assembled. To ensure the safety of the test, a lithium battery with an independent power supply is used for the static resistance test mode. The power source for the insulation testing platform is a 14.8 V lithium battery, which, after being processed by a Buck step-down converter circuit, provides a stable excitation signal for testing. The working waveform of the Buck circuit is shown in
Figure 4.
The Buck circuit uses a fully controlled device, VT, and its operating mode is primarily divided into continuous current mode and discontinuous current mode. As shown in the diagram, in the discontinuous current mode, the load current intermittently interrupts, which is typically undesirable in practical applications. Therefore, the continuous current mode, due to its stable current output characteristics, is the more commonly used mode in practical applications. The Buck circuit is controlled using Pulse Width Modulation (PWM).
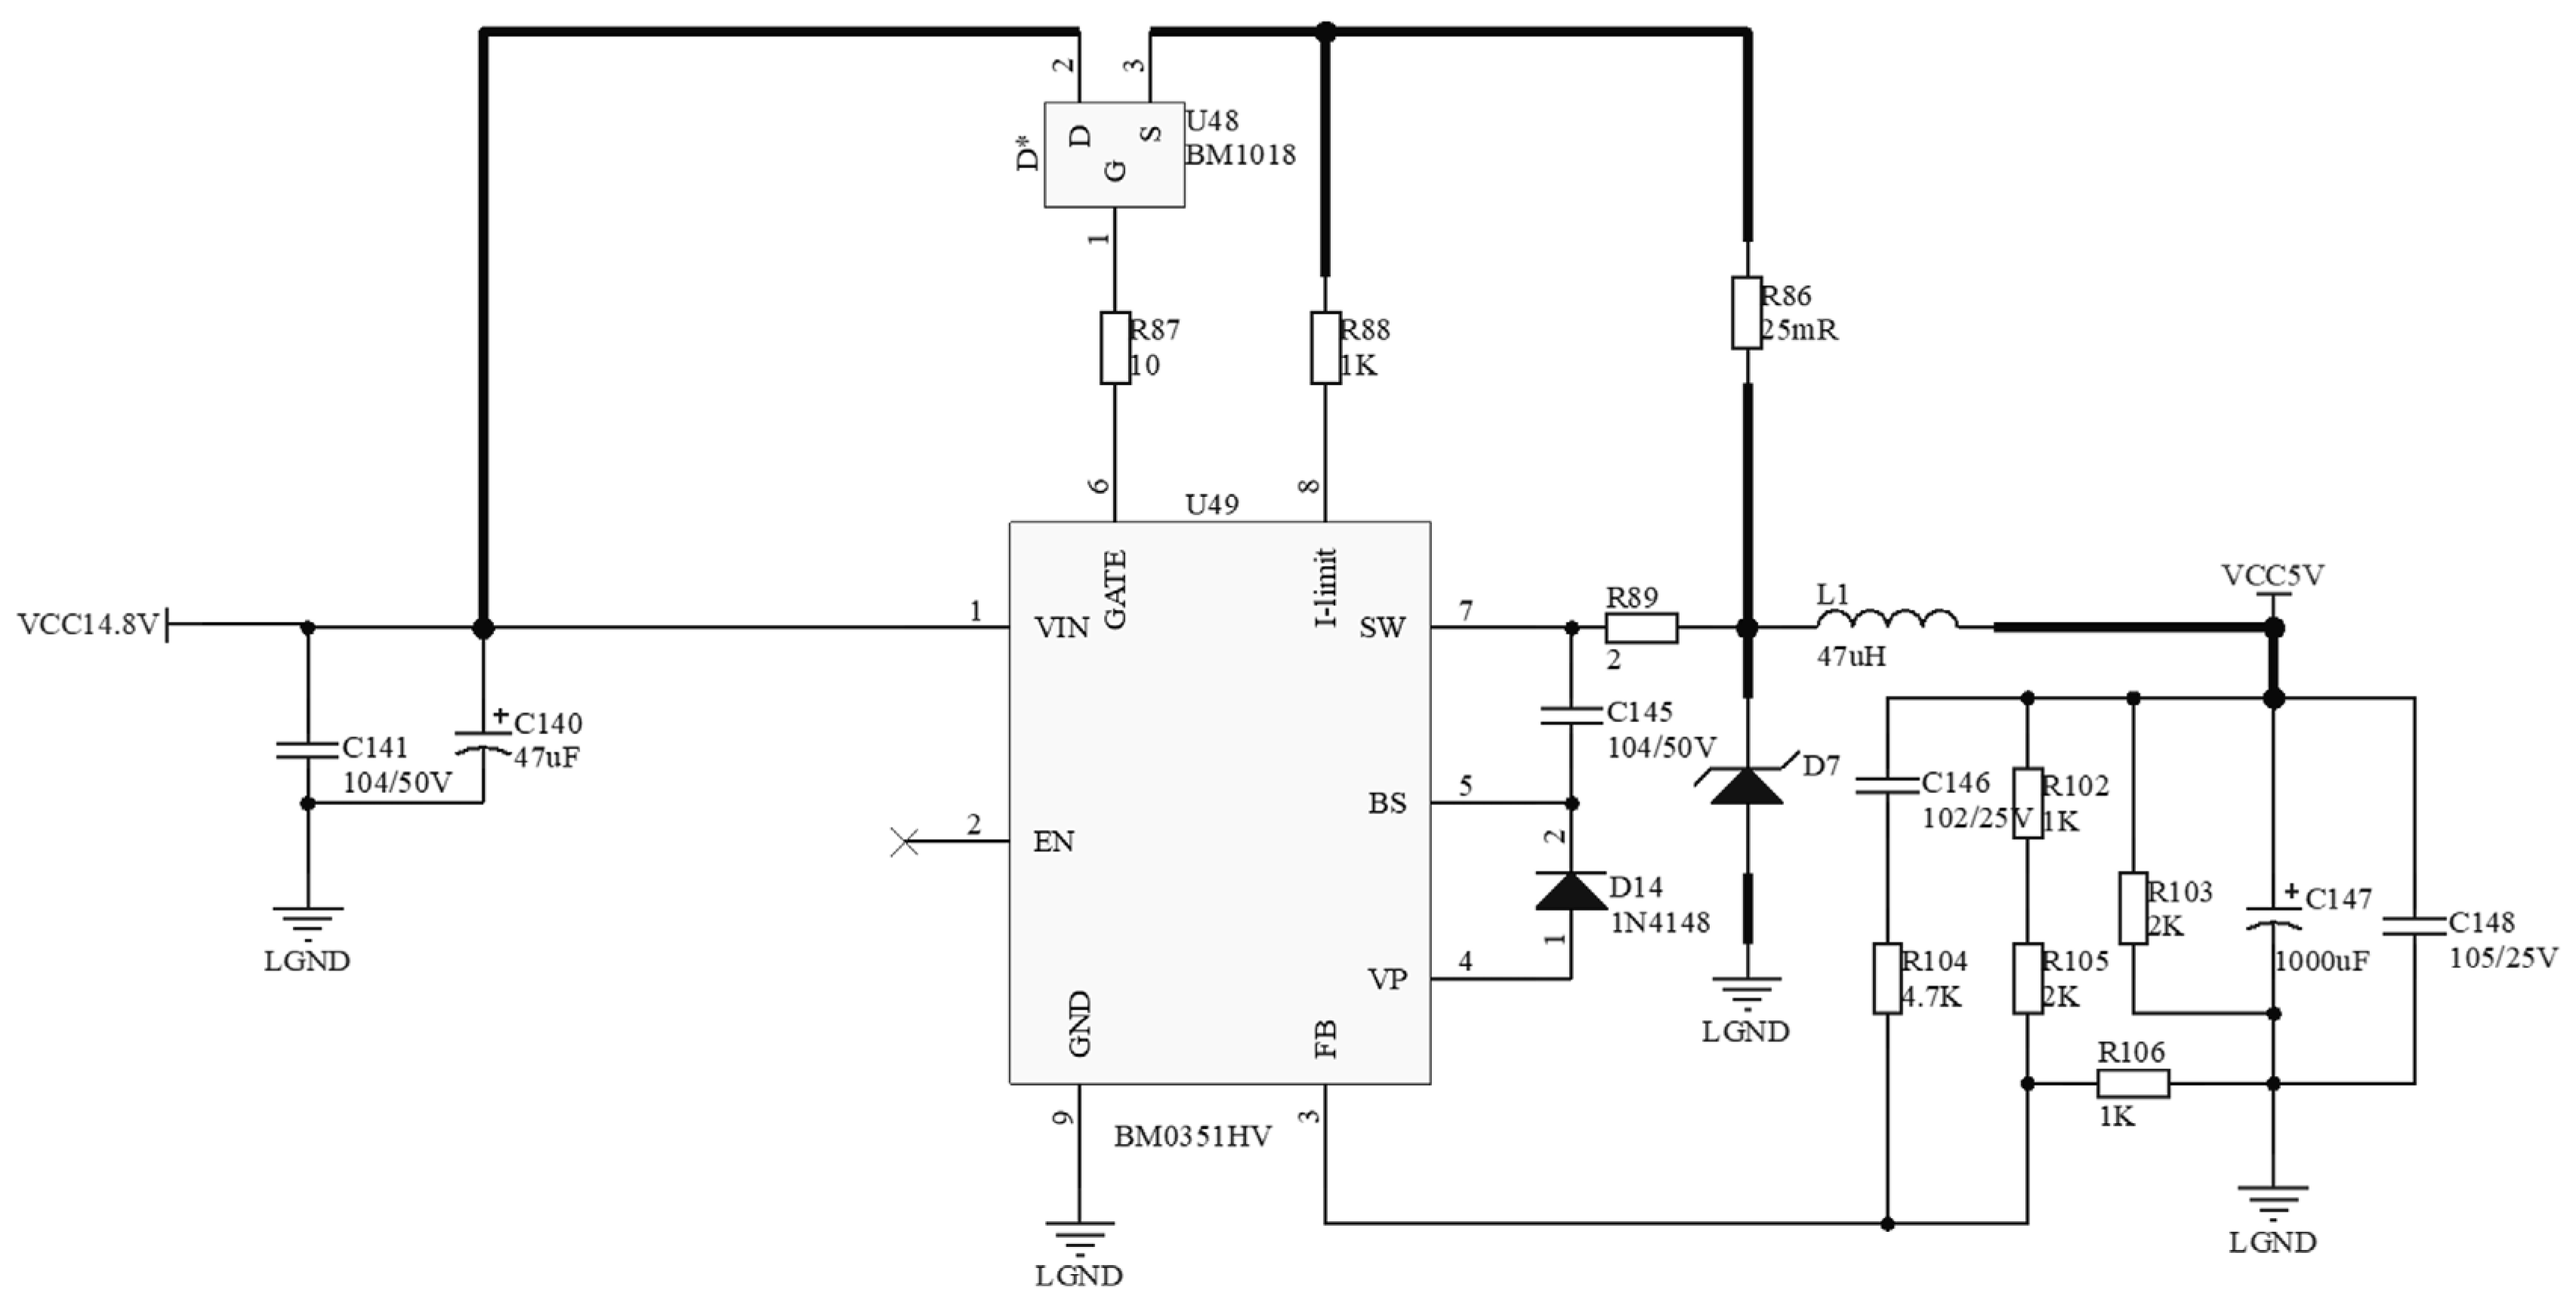
The static resistance excitation circuit uses the Buck converter to step down the voltage from 14.8 V to 5 V. Compared to integrated voltage modules, the Buck circuit has a more complex peripheral circuit, but it can handle higher output power, making it a more suitable choice as an excitation source. This step-down circuit uses the BM0351HV (BOOKLY MICRO, Shanghai, China) as the core of the Buck converter. The BM0351HV is a switch-mode buck voltage regulator that offers a wide input voltage range and employs Zero Voltage Switching (ZVS) technology to improve the circuit’s efficiency. The circuit schematic of the BM0351HV is shown in
Figure 5.
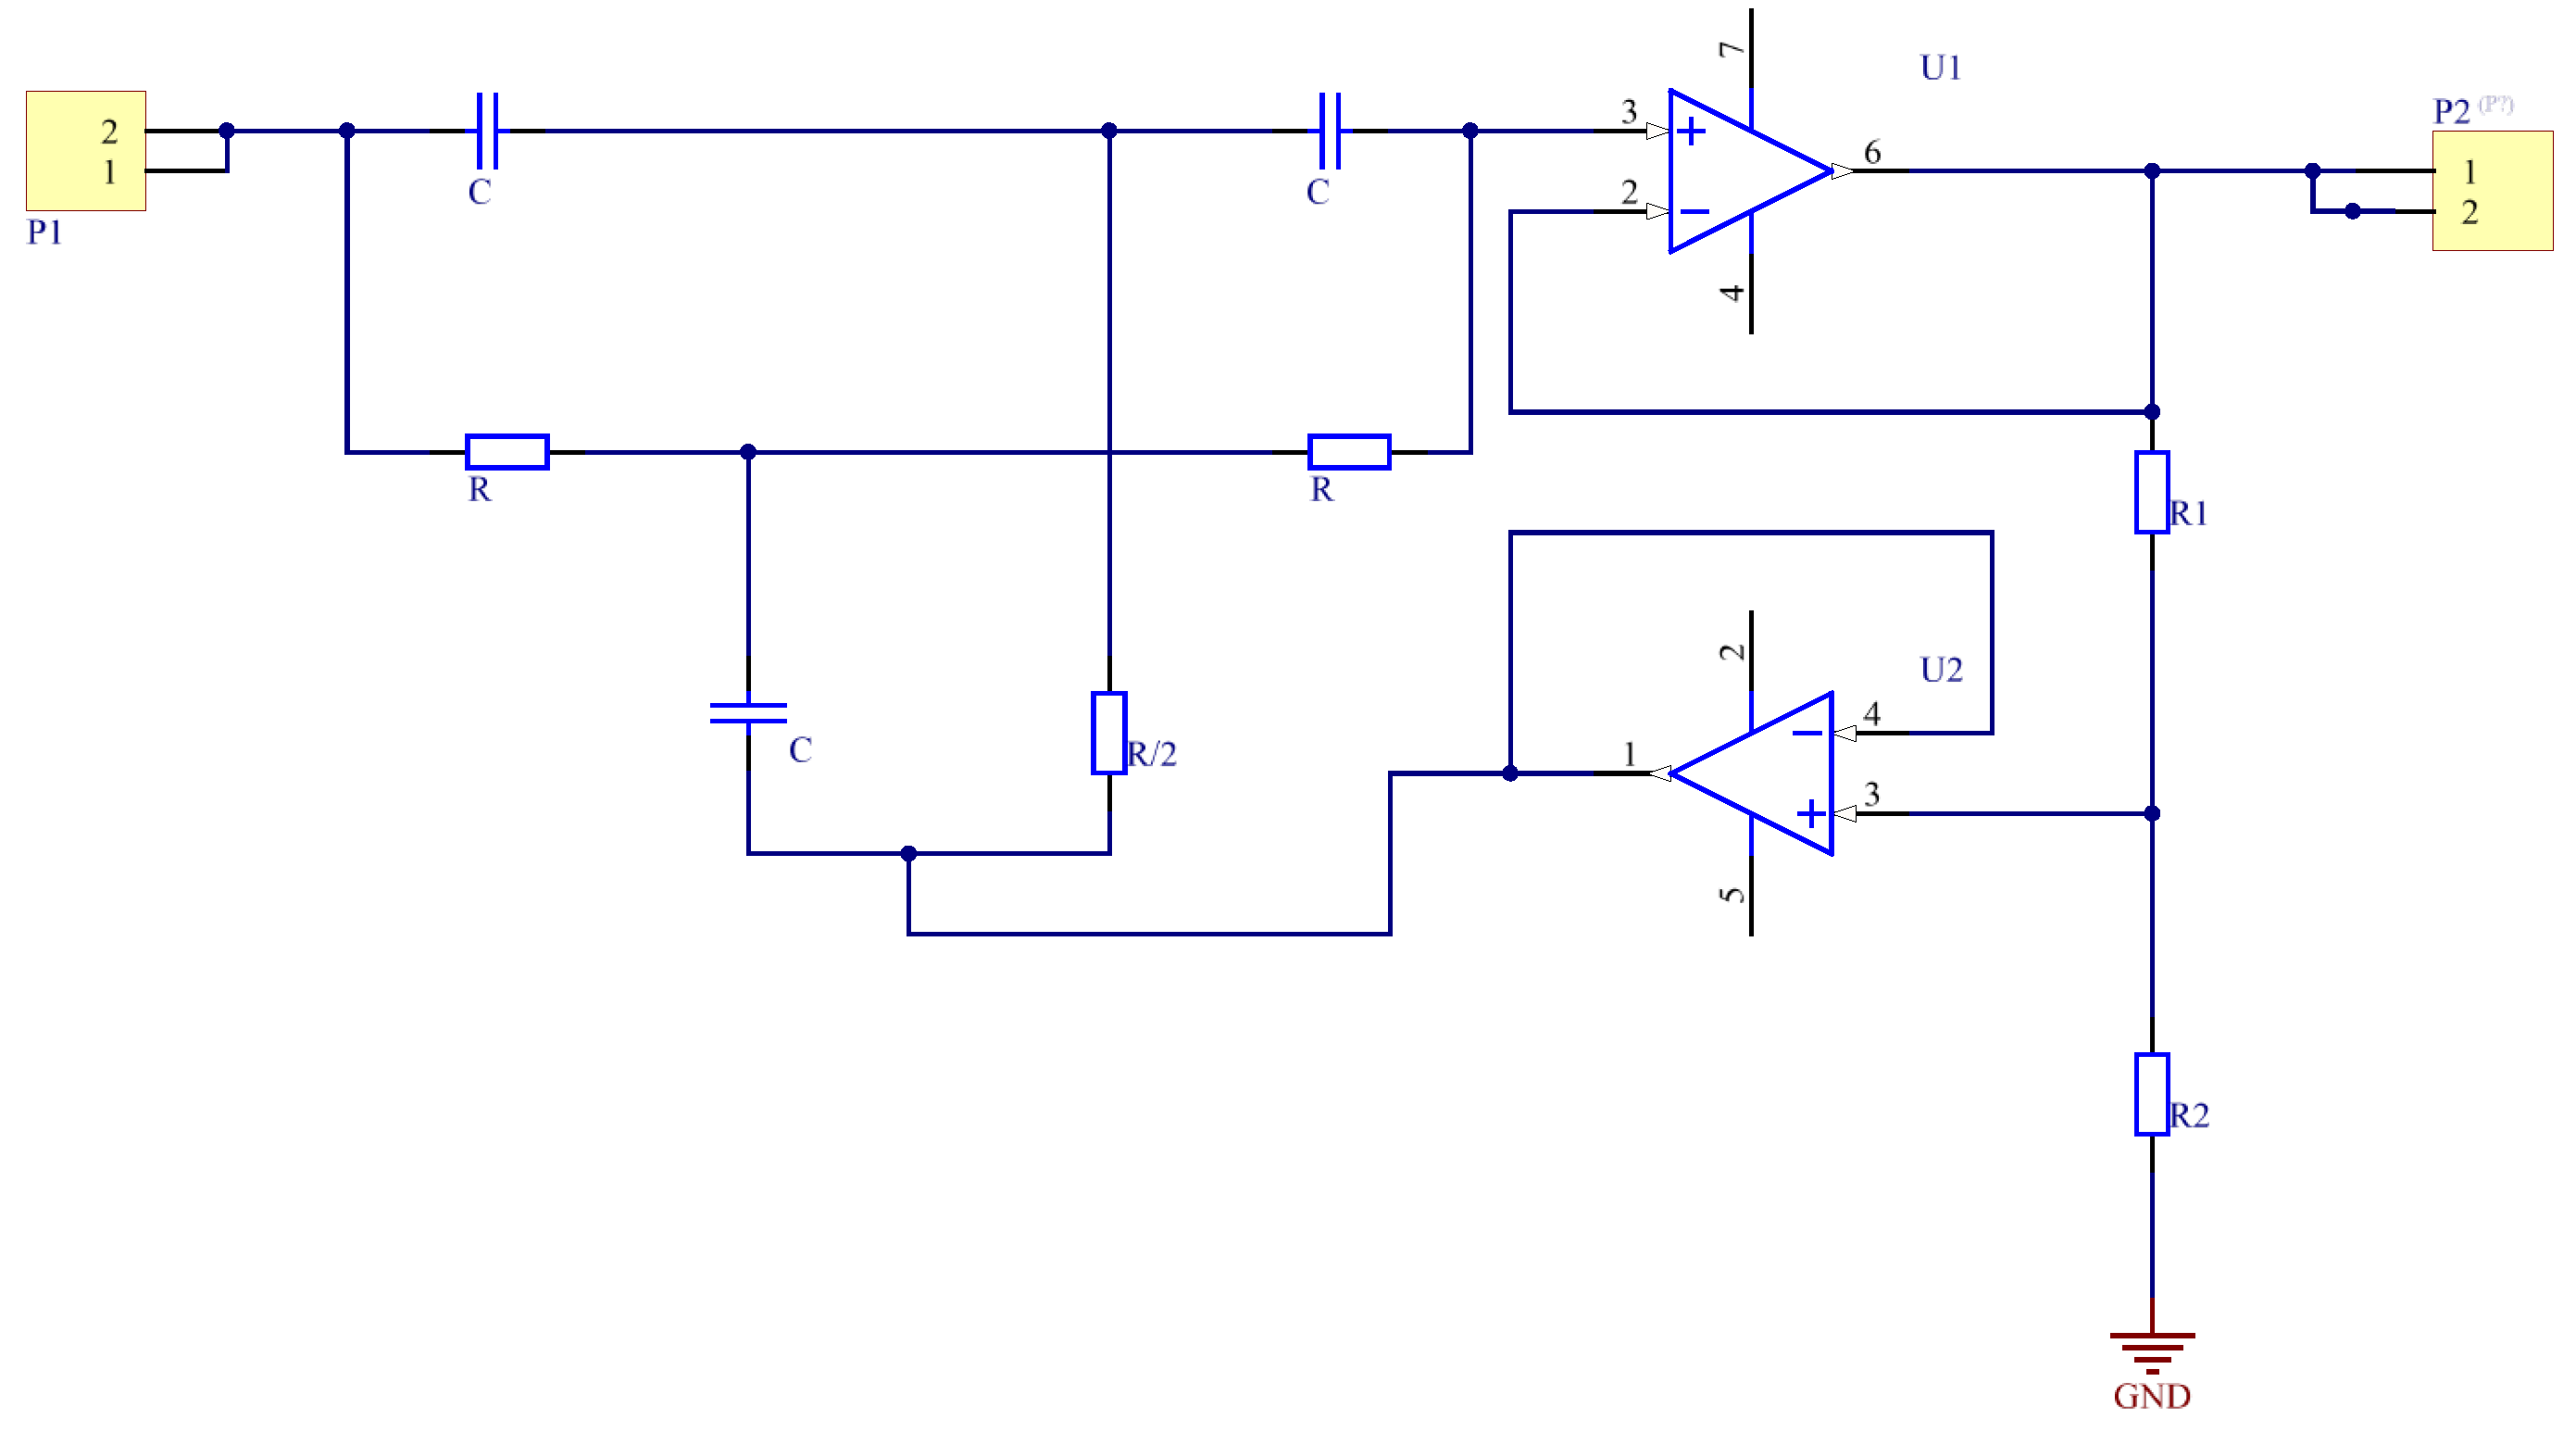
3.1.2. Notch Filter
The insulation tester has a wide measurement range, and during high-resistance testing, it is particularly susceptible to power-line frequency (50 Hz) interference, which can affect the test accuracy. To mitigate this issue, a second-order notch filter with a frequency of 50 Hz is introduced to eliminate power-line interference. This is a crucial step to ensure that the signal is thoroughly cleaned before feature extraction. The notch filter is essentially a narrow-bandstop filter with a very narrow stopband. The twin-T structure is a commonly used circuit design for a notch filter. The diagram of the notch filter is shown in
Figure 6.
The transfer function of the circuit is given as shown in Formula (3).
In the formula,
. At this time,
. This results in Formula (4):
where
, when
,
, and can have a maximum at
.
The attenuation can filter out the frequency, and, for other frequencies, , which can pass the signal well.
At this point, the notch gets a
Q value of
As can be seen from Formula (5), the closer m is to 1, the smaller the Q value is, and the narrow-band filtering effect and high Q value can be obtained, so that the performance of the notch is optimal.
3.1.3. Feature Extraction
In anomaly detection during testing, to ensure that the current used for calculating insulation resistance is based on the current after the absorption and capacitive currents have decayed (rather than the current taken after waiting for a fixed time), several features are extracted from the target current that is converted into a voltage value: maximum value, minimum value, average value, increment, differential, and entropy.
In process optimization, the main way to improve testing efficiency is to reduce the number of range switches. Switching ranges sequentially from low to high increases redundant testing time. Based on the collected voltage values during testing, the range is adjusted more precisely, and the following features are extracted from the matched range’s voltage signal: maximum value, minimum value, standard deviation, average value, and kurtosis.
3.2. Decision Tree
The purpose of using the decision tree model is not only to achieve optimization but also to obtain explainable predictions. A machine learning model with inherent interpretability, the decision tree, was chosen. The decision tree is a classic model constructed by inductively learning from training data. Each node of the tree represents an attribute (or feature), and the edges correspond to the values (or value ranges) of those attributes. Ultimately, each leaf node of the tree maps to a class. Thus, each path from the root node to a leaf node forms an interpretable classification rule that reveals the specific reasoning behind the classification decision.
In anomaly detection, within the DT, the decision is made based on whether the maximum value (increasing or decreasing) is within a given range. If the change is less than 2% of the total current, it is considered that the absorption and capacitive currents have decayed sufficiently according to the insulation testing standards.
Figure 7 shows an example of a portion of the DT in test optimization. In the first level of features, the decision is made based on whether the voltage collected from the device under test falls outside the lower or upper threshold after matching the middle range. At the second level of features, the left and right thresholds are divided into low, medium, and high regions. The sampling value’s position determines the corresponding matching resistance. Therefore, the classification process performed by the decision tree is relatively intuitive for humans, as it resembles the “rule-based” approach commonly used in fault diagnosis [
22,
23,
24,
25,
26,
27,
28].
3.3. Post-Processing Filter
The final component of the proposed method is a post-processing filter designed to optimize the prediction performance of the decision tree. While it is theoretically possible to make predictions for each sample and assess its performance, in practical applications, a sliding window-based evaluation method is more effective. Specifically, the model’s predictive capability is confirmed only when at least B out of n samples in the classifier correctly call the appropriate range. To achieve this, two different types of post-processing filters were designed and implemented.
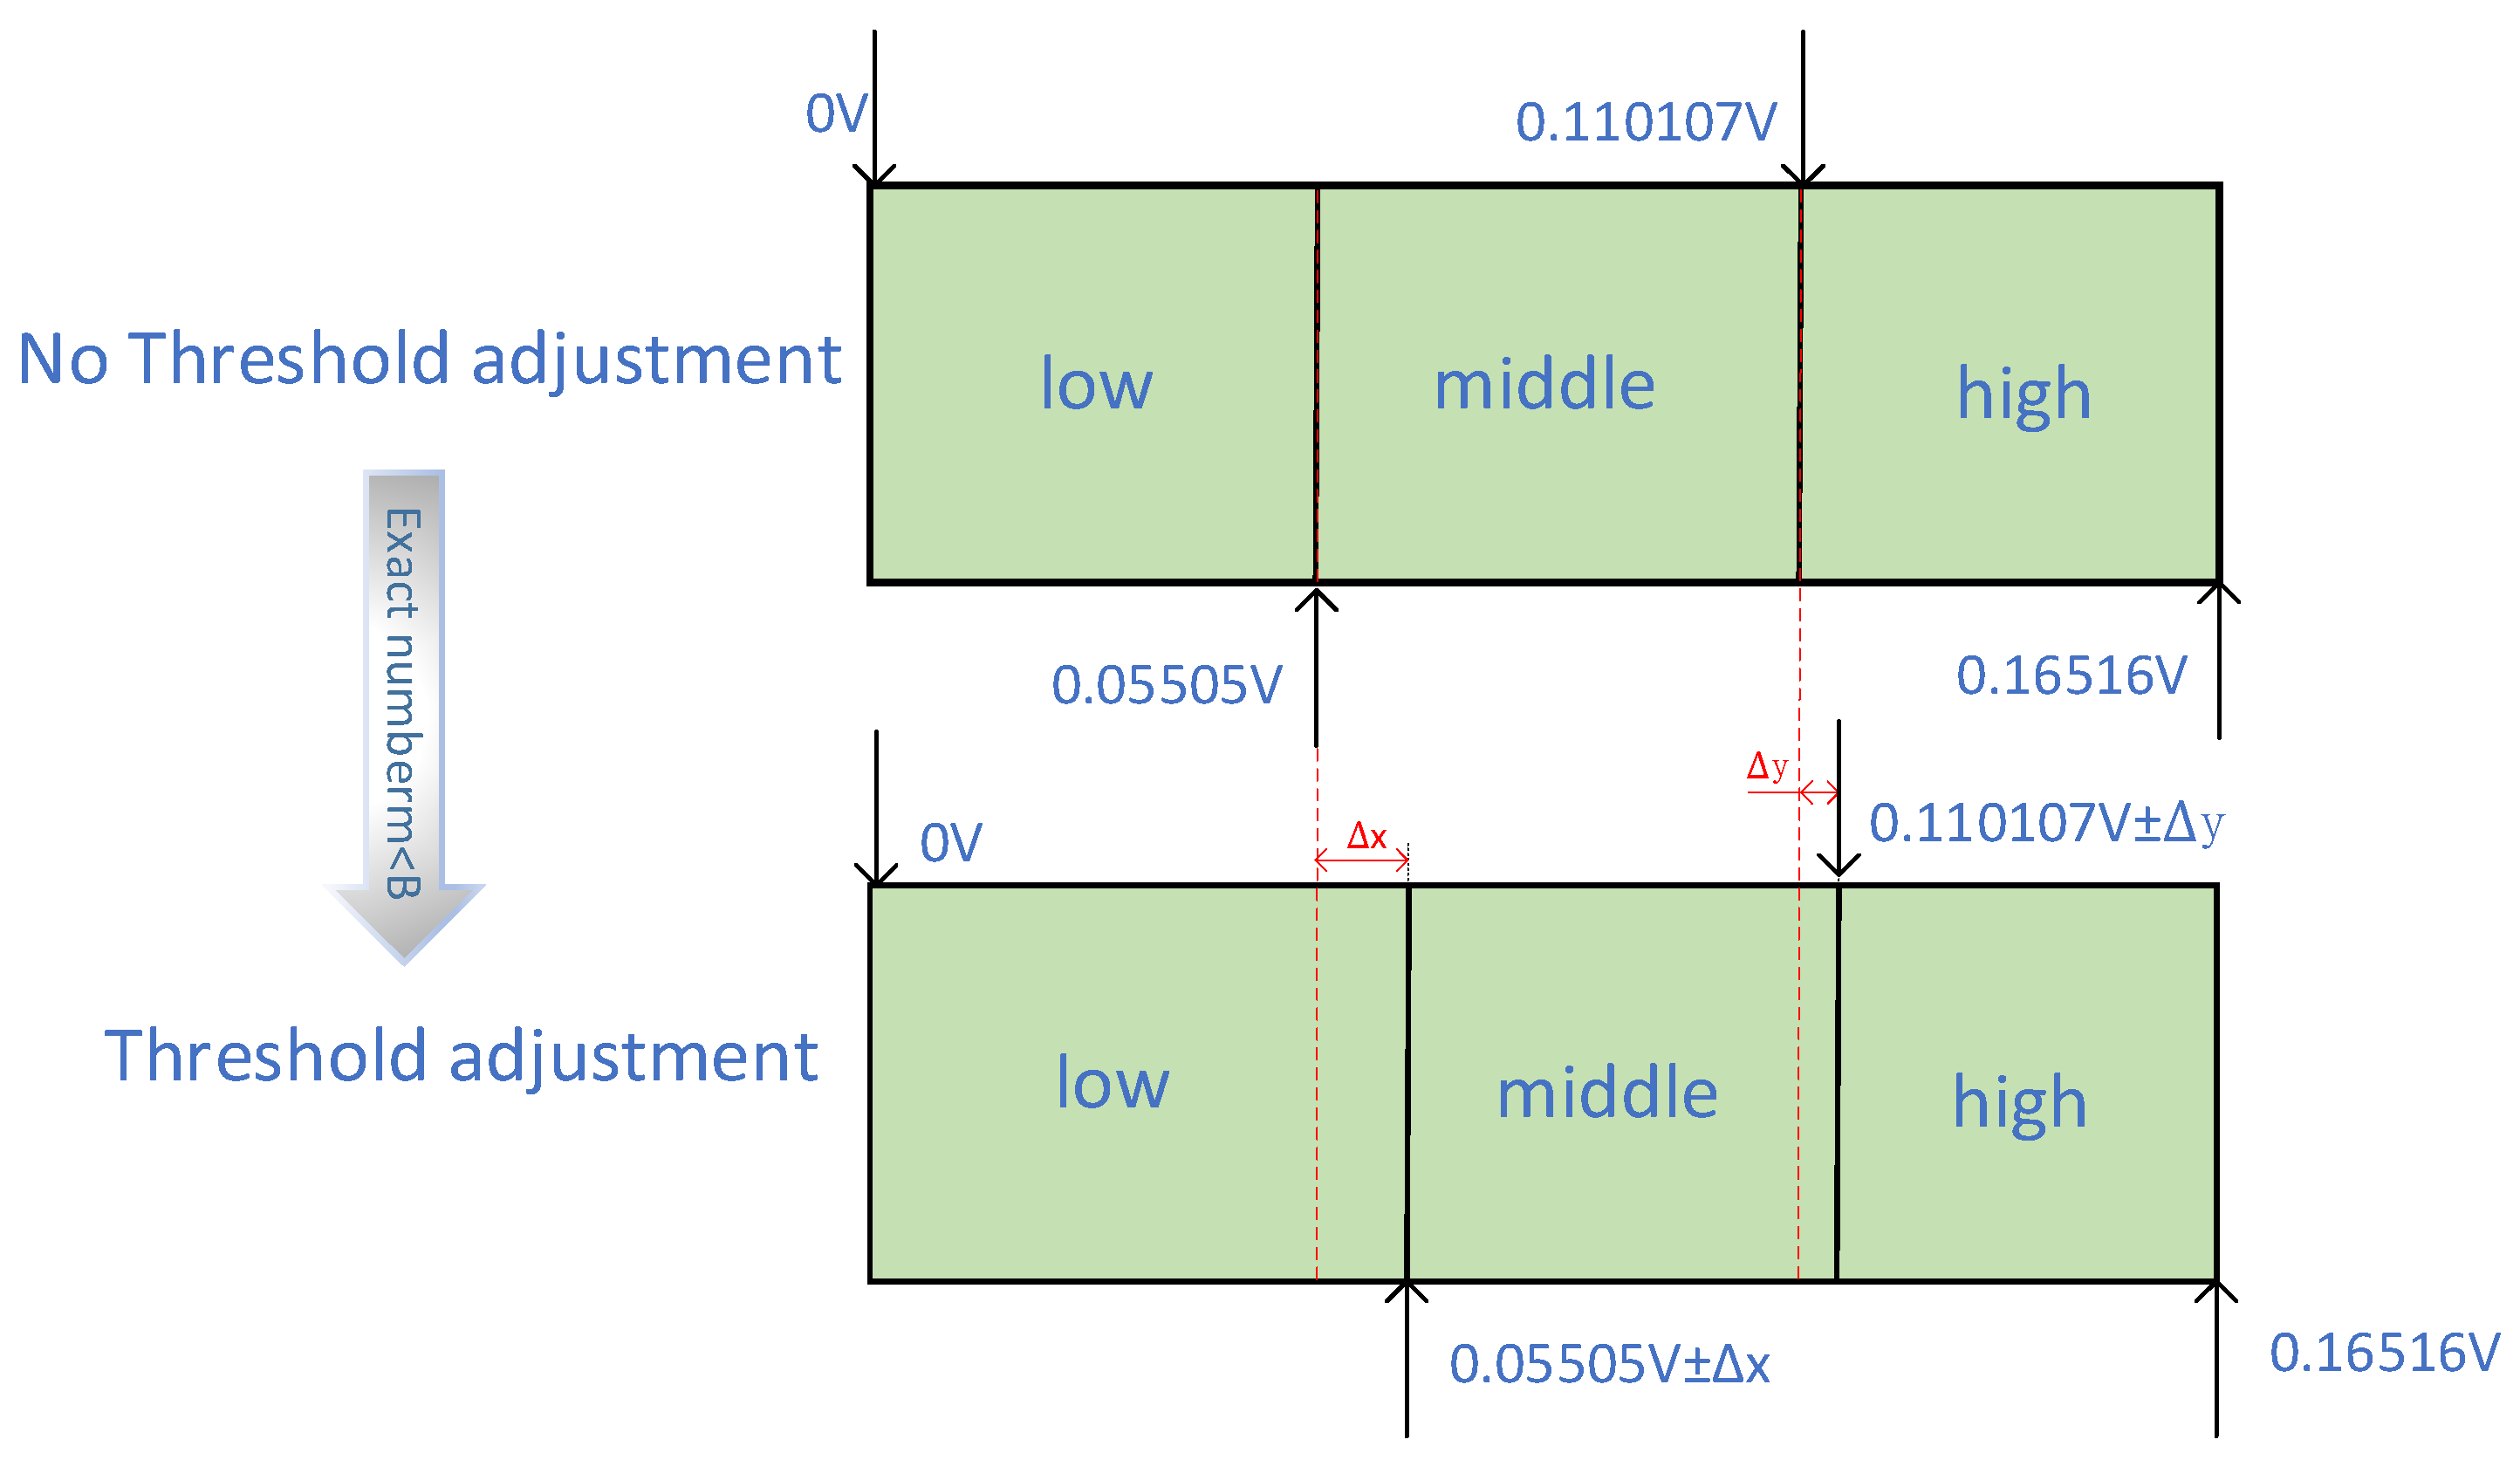
Threshold adjustment: Threshold adjustment is a method used to optimize the output of a classification model, especially in binary classification tasks. The model typically outputs a probability value representing the likelihood that a sample belongs to a particular class. The main objective of threshold adjustment is to select an optimal threshold to map the probability values to final class labels. In optimizing the testing process, when the classification in the lower region outside the threshold does not meet the testing requirements, the threshold range of the lower region is readjusted. As shown in
Figure 8, this process ensures that the matching resistance is properly called when the testing criteria are met.
Prediction smoothing: In regression tasks or probability predictions, smoothing filters (such as moving averages) are applied to prediction results to reduce the volatility of the predictions. This enhances the stability and consistency of the model’s output. For a given set of n consecutive samples, the waiting time for test anomalies is counted, and the prediction of test anomalies is made only if this count falls below a fixed threshold.
4. Experimental Validation
This section describes the collected dataset and the experimental evaluations performed on it. Simulation experiments were conducted in MATLAB using the Statistics and Machine Learning Toolbox for machine learning tasks. Feature calculations were performed using Numpy and Scipy, Natick, MA, USA.
4.1. Construction of the Dataset
The dataset used for training and validating the proposed anomaly detection and test optimization methods was obtained from the test set of a domestic insulation testing platform utilizing machine learning. The upper computer communicates with the lower computer via Ethernet, issuing commands and receiving and processing data while running the decision tree model in the upper computer software.
The raw dataset includes voltage signals obtained from 100 resistors with values ranging from 10 ohms to 10 M ohms connected in series, using a median measurement range. Additionally, for 50 insulation test samples, the voltage values of the matching resistors and corresponding time values under the insulation mode are recorded. For each set of insulation test samples, a 5 s wait is observed, with a sampling rate of 1000 Hz, and voltage versus time degradation curves are plotted from the sampled data.
4.2. Analysis of Experimental Dataset
In this study, we used the domestic insulation testing platform in static mode to test 100 randomly selected resistors. These resistors were initially connected in series at the median measurement range, with a 1 V excitation voltage applied, and the matching voltage values and optimal measurement range were recorded. This data was used to construct the decision tree dataset for optimizing the testing process. In the insulation mode, leakage current values were recorded during the insulation testing of 50 samples, which served as the model dataset for anomaly detection.
To comprehensively evaluate the performance of the decision tree model, several performance metrics were employed, including precision, recall, F1-score, mean squared error (MSE), and mean absolute percentage error (MAPE). In each round of experiments, as the model underwent multiple sampling iterations, these performance indicators showed significant improvement, indicating that the resistor recognition capability was gradually optimized. Particularly, the dynamic adjustment capability of the decision tree model demonstrated good adaptability across different voltage ranges.
4.3. Results
As shown in
Table 1, the performance of the proposed system is evaluated using standard classification metrics. In the case of binary classification, the positive class is defined as the fault class (current change greater than 2% and voltage outside the threshold), while the negative class corresponds to the correct class. For each data sample, the definitions are as follows: True Positive (TP): Correctly detected faults (i.e., correct detection of fault status); True Negative (TN): Correctly detected normal states (i.e., correct detection of feature status); False Positive (FP): Incorrect prediction of the next stage partition when the voltage threshold is correctly classified; False Negative (FN): Incorrect classification of the voltage threshold.
Accuracy is then defined as the total number of correct predictions out of the total number of test samples, as shown in Formula (6).
Conversely, recall corresponds to the classifier’s ability to find all positive samples (therefore considering false negatives), while precision is the percentage of truly correct positive predictions. These are represented by Formulas (7) and (8), respectively.
As a comprehensive measure between accuracy and recall, the F1 score is also commonly used as the harmonic mean between the two. In the scenario considered, fault detection is a multi-class classification task where only accuracy is reported, as accuracy, recall, and F1 are metrics for each class.
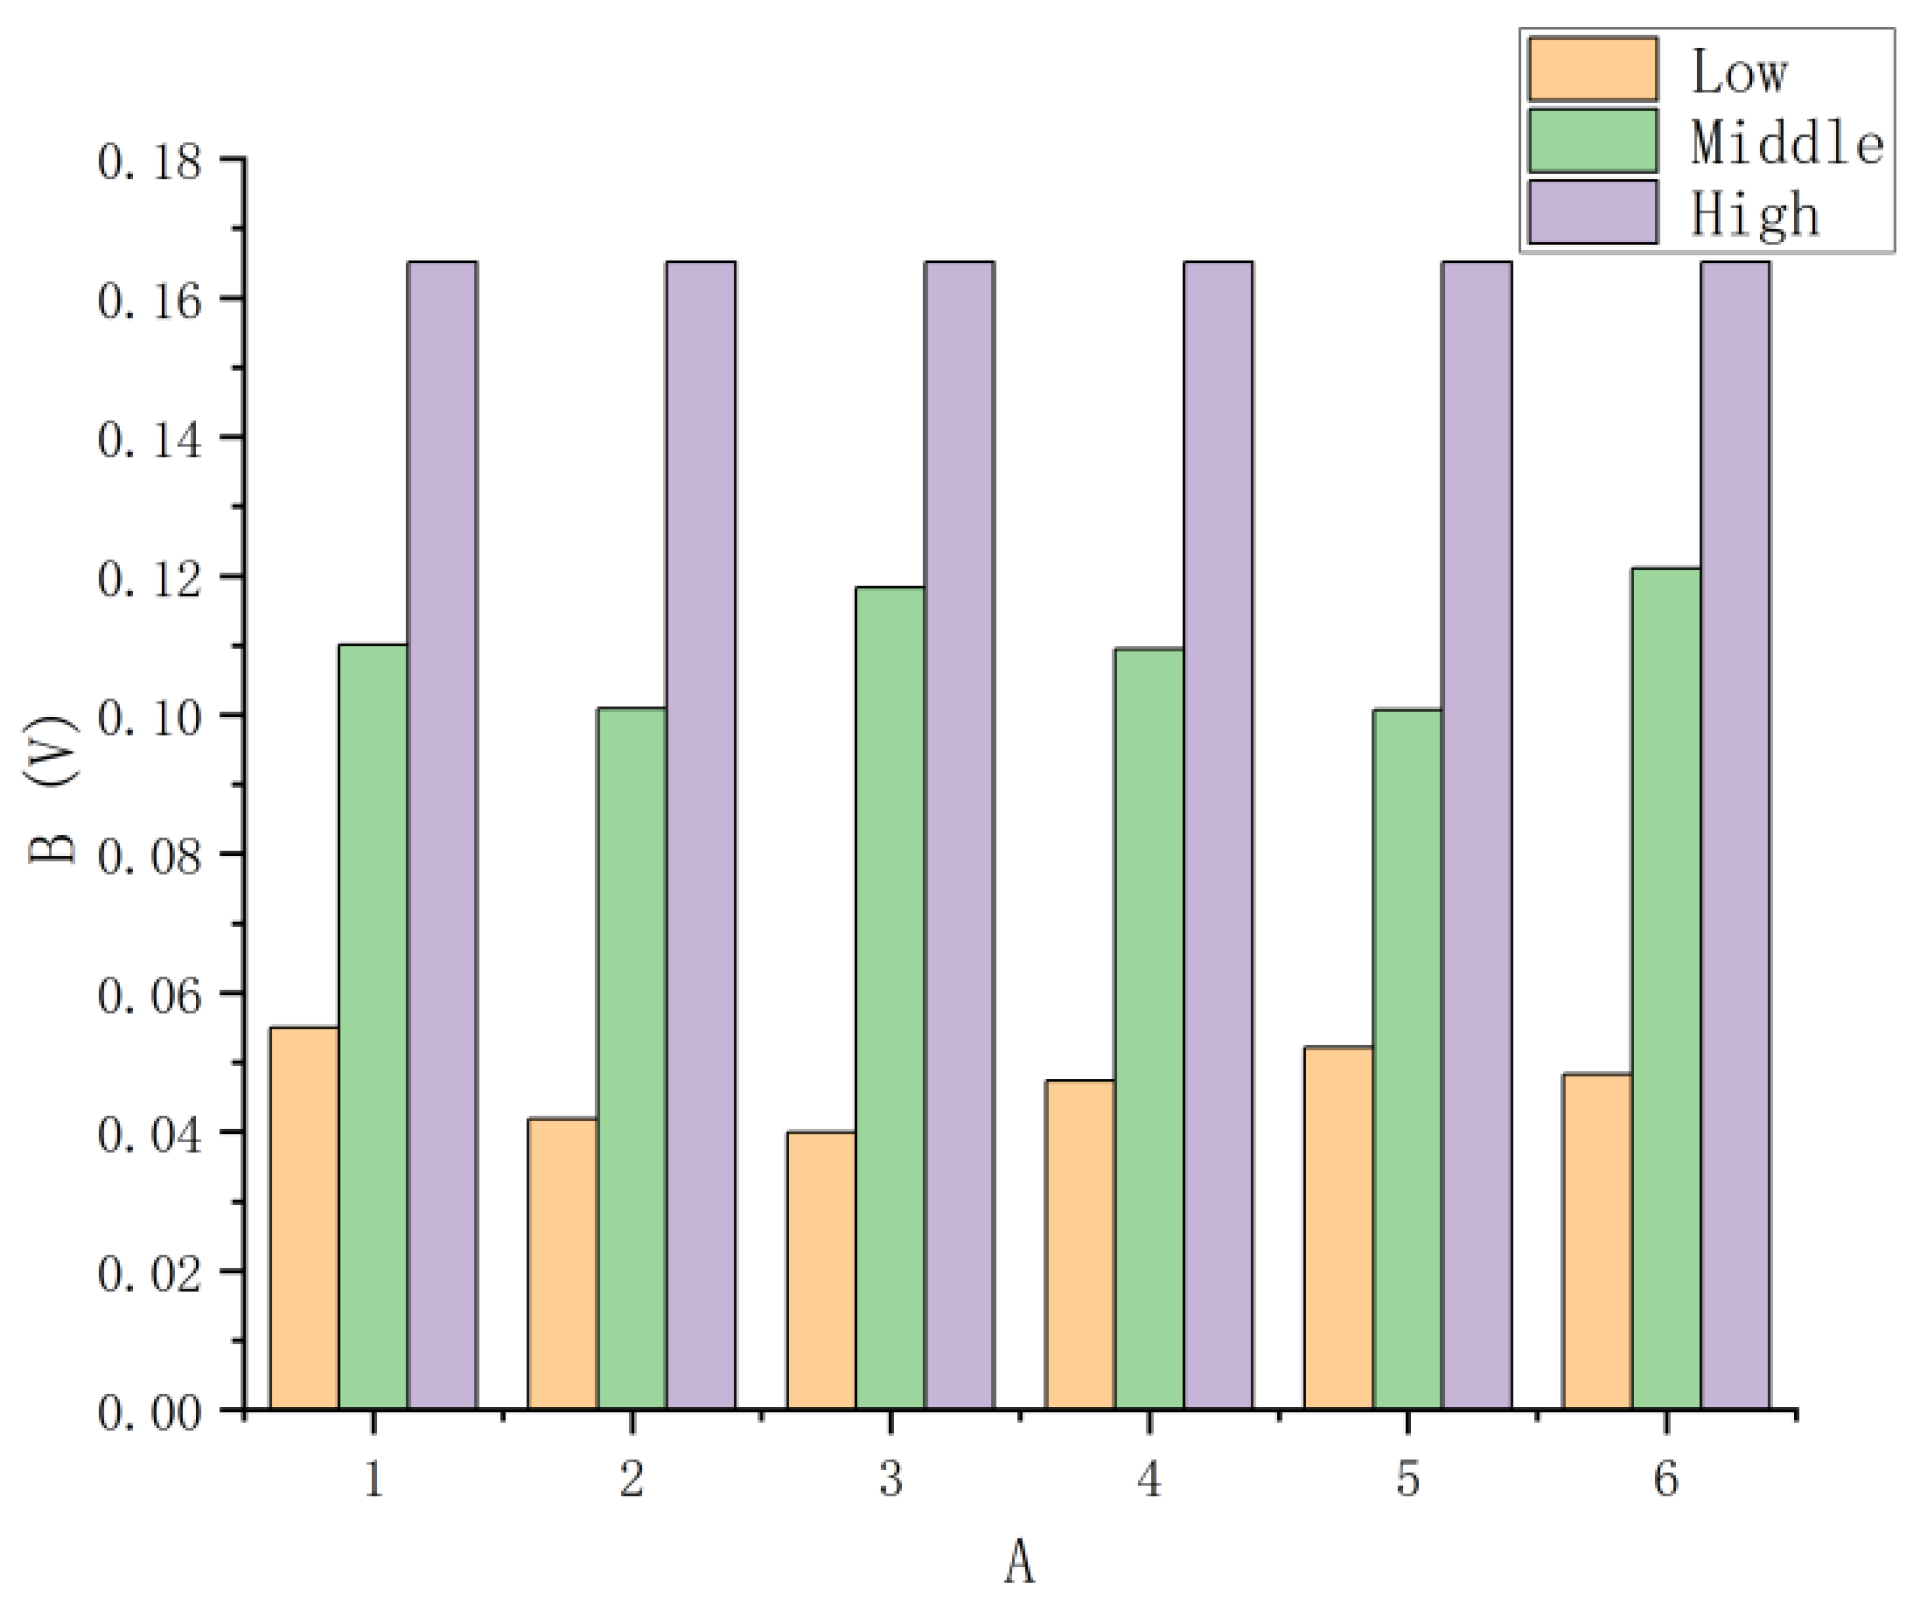
As a further evaluation, the application of the sliding window post-processing filter is considered. In this case, threshold adjustments for the three intervals (low, medium, high) on either side of the threshold voltage are applied. The test results are shown in
Figure 9, based on 20 tests in static mode using the target resistors. Observing the continuous testing process, if the number of times the matching resistor range is called reduces when testing the same resistance value, it indicates that the test process has been optimized, and the post-processing filter is effective. The results shown in
Figure 10 demonstrate the performance of this filter. During the testing process, the three initially planned thresholds will be dynamically adjusted based on the database and experimental data, allowing for more precise range selection after judgment in the middle range.
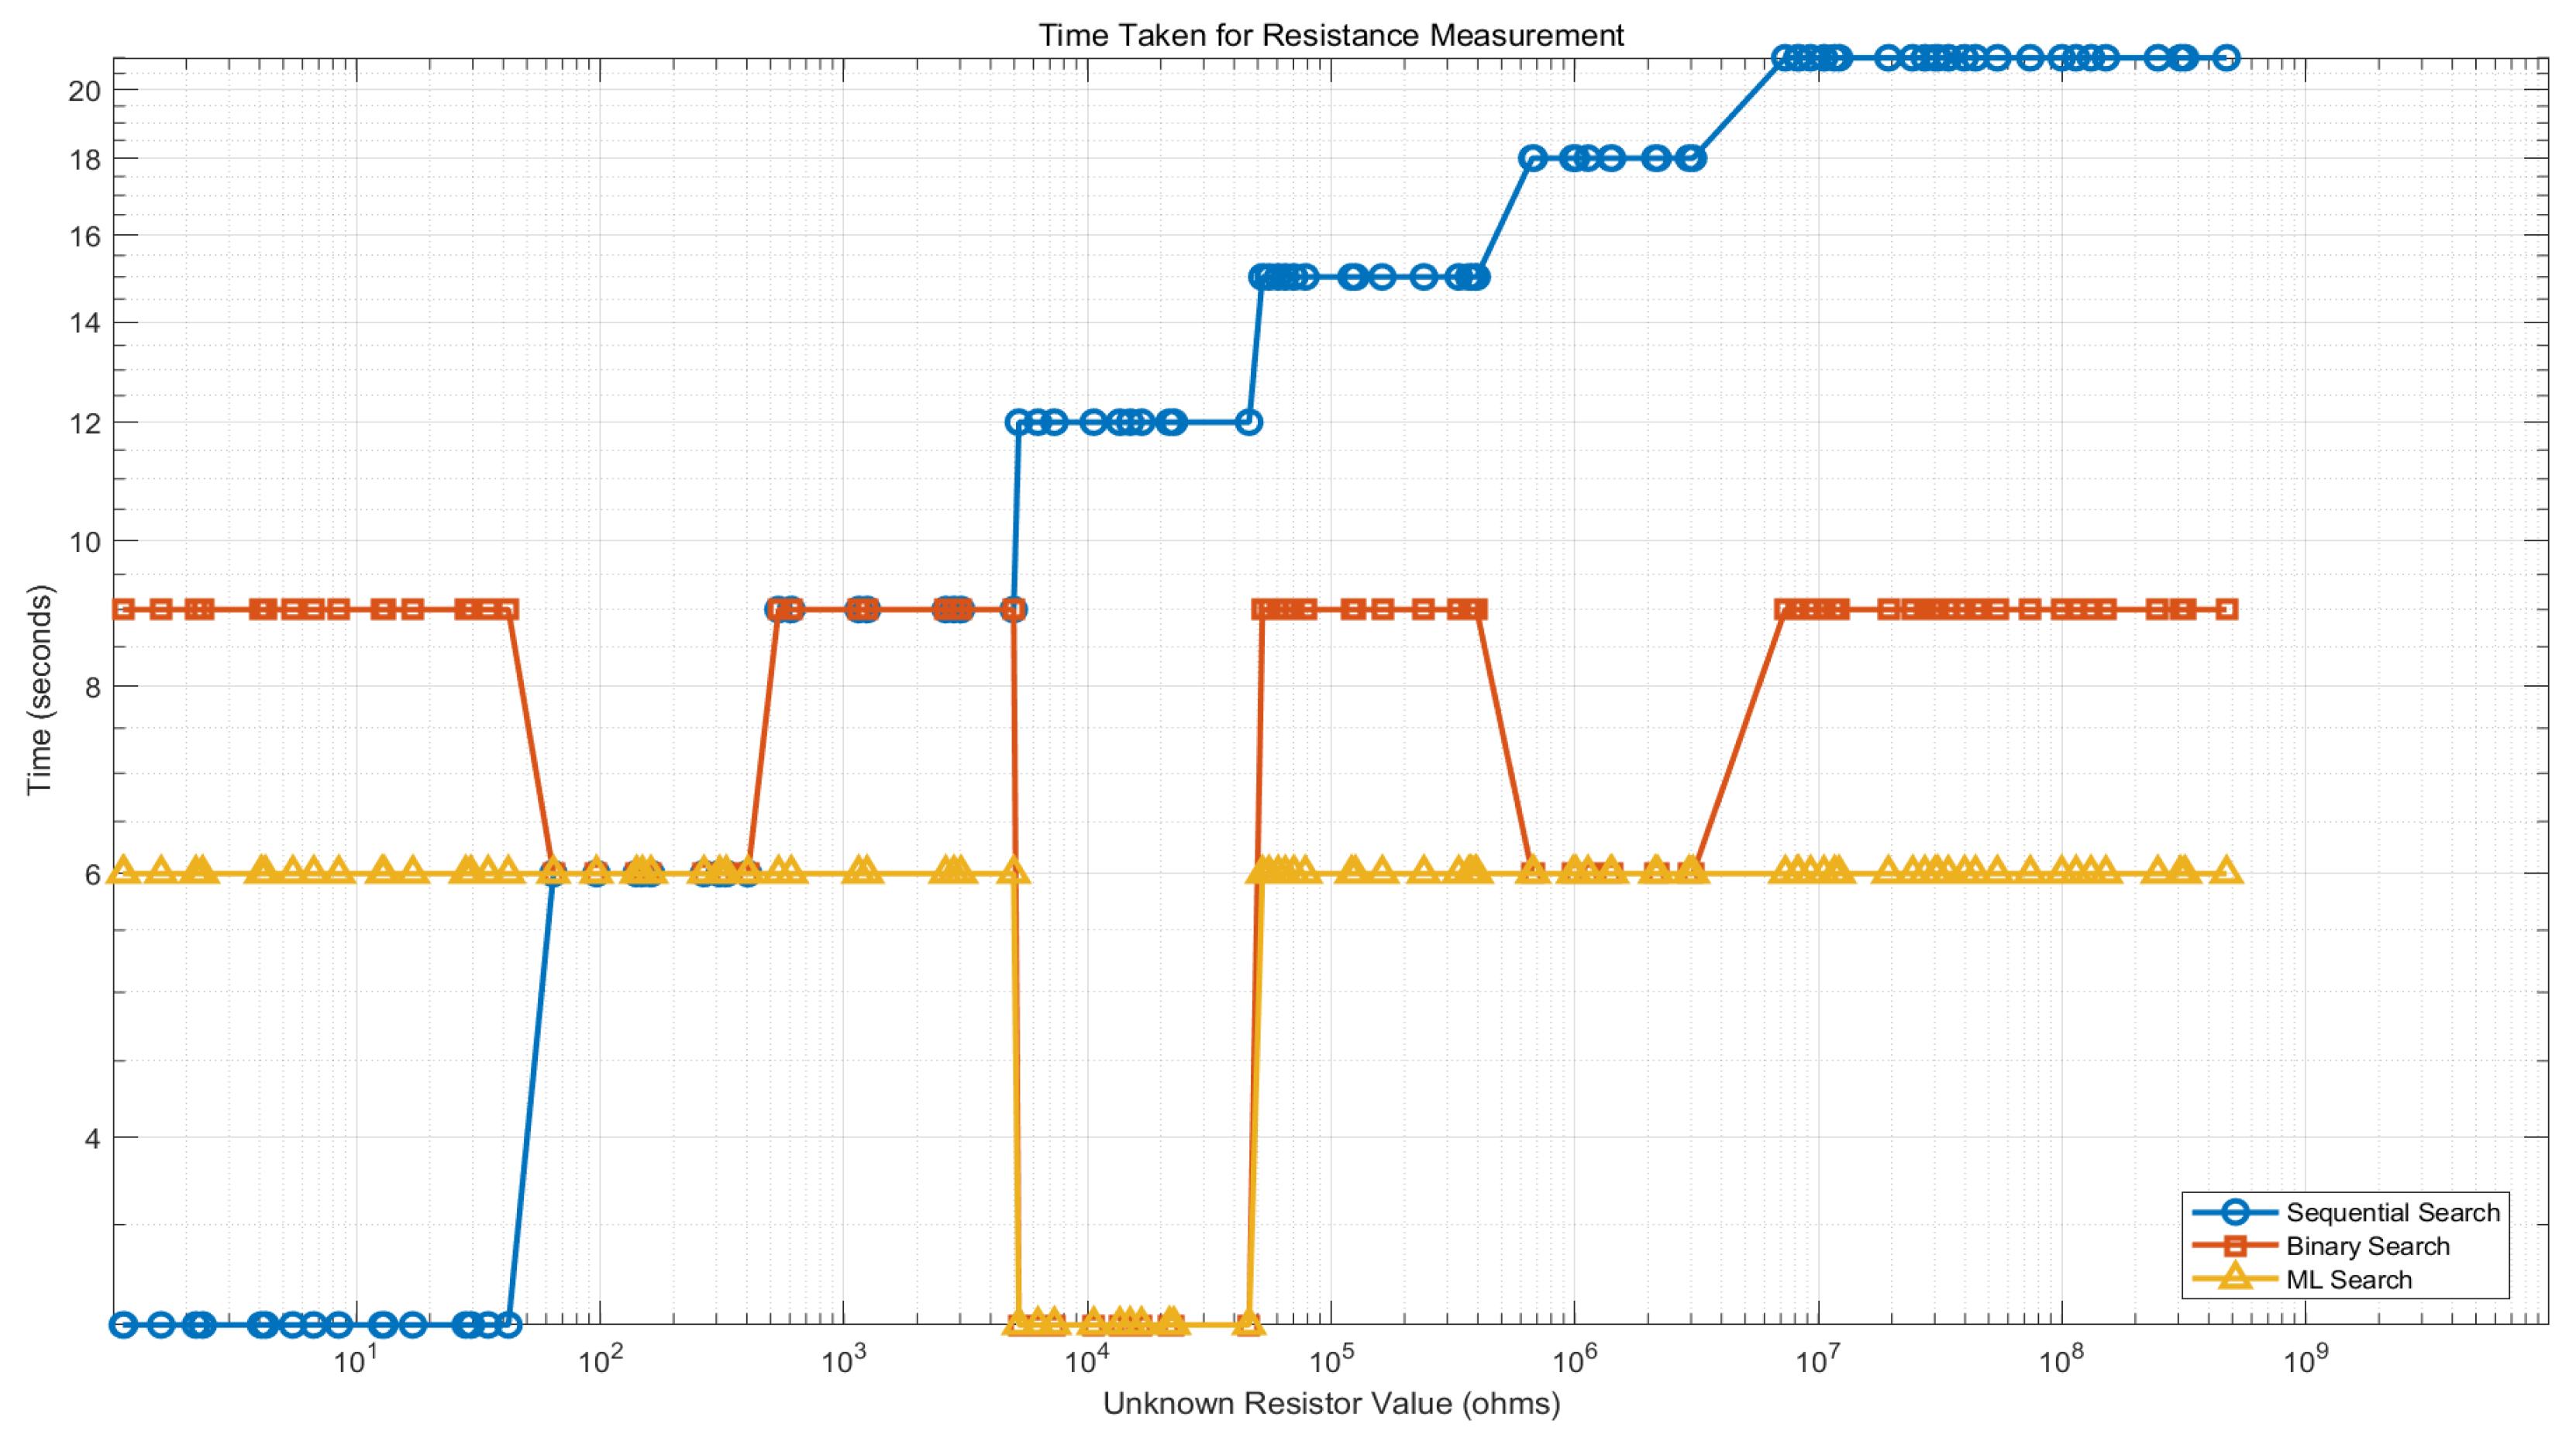
The model, trained using the experimental dataset, was tested on 100 random resistors. The test results are shown in
Figure 10, where simulations of the sequential measurement method, binary method, and DT algorithm are conducted using Matlab. The simulation logic is based on a fixed time interval for each gear switch during testing. When testing different resistance ranges, the number of gear switches varies depending on the testing method. Therefore, the time required by the three methods can be compared to verify the improvement in testing efficiency achieved by the decision tree model. Among them, the DT algorithm calls an average of 2.3 times for the range selection. The sequential measurement method and binary method call the range an average of 3.6 times and 3.1 times, respectively.
As mentioned in the text, anomaly detection and process optimization are achieved using the DT (decision tree) model to provide an interpretable solution. To identify the most common patterns representing the classification rules, the tree structure is analyzed to find the matching range for the target resistor values in different intervals. Using a decision tree constructed with three key features, the average accuracy for secondary range matching is over 76.3%. Furthermore, during multi-target detection, the efficiency of the DT algorithm improves by 54.71% compared to sequential testing. It can be observed that the application of machine learning in engineering testing can significantly improve testing efficiency. Particularly in scenarios involving large data volumes, multiple testing channels, and complex testing conditions, the reasonable use of machine learning provides substantial support to the backend of the testing process.
5. Conclusions
This paper proposes an intelligent insulation testing system, based on FPGA and machine learning, designed to meet the demands of modern cable networks for efficient and precise insulation evaluation. By applying decision tree models for feature extraction and classification, the system achieves anomaly detection and process optimization, significantly improving testing efficiency and accuracy. Additionally, the introduction of post-processing filters reduces redundant position switching, further optimizing the testing process. Experimental validation demonstrates that the system performs excellently across various resistance ranges, breaking the limitations of traditional testing methods.
The combination of FPGA and machine learning has broad application prospects in fields such as power, communication, transportation, and industrial automation. This system can improve grid maintenance efficiency, ensure signal stability, and ensure production continuity and product quality. Future development will focus on expanding datasets, enriching feature extraction methods, enhancing model robustness, and optimizing real-time performance. Additionally, integrating intelligent diagnostics, developing user-friendly interfaces, and promoting industry standardization will be key to the system’s development, further improving its accuracy, stability, and user experience, making it a crucial technology in the field of cable insulation testing.
Author Contributions
Conceptualization, S.L. and G.Z.; methodology, S.L.; software, G.Z.; validation, S.L.; formal analysis, S.L.; investigation, H.Z.; resources, H.Z.; data curation, S.L.; writing—original draft preparation, S.L.; writing—review and editing, H.Z.; visualization, H.Z.; supervision, S.L.; project administration, H.Z.; funding acquisition, S.L. All authors have read and agreed to the published version of the manuscript.
Funding
This research was funded by National Natural Science Foundation of China (62201523).
Data Availability Statement
Data underlying the results presented in this paper are not publicly available at this time but may be obtained from the authors upon reasonable request.
Conflicts of Interest
The authors declare no conflicts of interest.
References
- Emsley, F. The Standard Wiring System for Aircraft. Aircr. Eng. Aerosp. Technol. 1946, 18, 63–67. [Google Scholar] [CrossRef]
- Liu, Z. Research and Application of Automatic Detection System for Aircraft Cable Network Connectivity and Insulation. Master’s Thesis, Chengdu University of Electronic Science and Technology of China, Chengdu, China, 2019. (In Chinese). [Google Scholar]
- Du, J.R.; Zheng, W. Application and Futured evelopment of Aviation cable inspection technology. China Strateg. Emerg. Ind. 2017, 96, 41–43. (In Chinese) [Google Scholar]
- Han, Q.W.; Zhao, Z.P.; Liang, S. Design of a Missile Cable Network conduction Insulation Performance Detection System. Mech. Electr. Eng. 2016, 33, 442447. (In Chinese) [Google Scholar]
- Wei, P.; Li, Z.M.; Zheng, L.D. Design and Development of Automatic on board Cable Insulation Tester. Comput. Meas. Control. 2017, 25, 305309. (In Chinese) [Google Scholar]
- Zhang, B.Q. Research on Aircraft Full-Scale Cable Testing Architecture Based on CAN Bus. Master’s Thesis, Nanjing University of Aeronautics and Astronautics, Nanjing, China, 2011. [Google Scholar]
- Wang, C. Research and Design of an Automotive Wiring Harness Testing System. Master’s Thesis, Wuhan University of Technology, Wuhan, China, 2012. [Google Scholar]
- Han, C.J. Design of an Automated Cable Testing System Based on FPGA Technology. Master’s Thesis, University of Electronic Science and Technology of China, Chengdu. China, 2012. [Google Scholar]
- Zhang, H.J. Design of Cable Continuity and Insulation Testing System for CRH3 High-Speed Train. Master’s Thesis, Dalian Jiaotong University, Dalian, China, 2022. [Google Scholar]
- Ganesan, S.; David, P.W.; Balachandran, P.K.; Samithas, D. Intelligent starting current-based fault identification of an induction motor operating under various power quality issues. Energies 2021, 14, 304. [Google Scholar] [CrossRef]
- Zhang, S.; Zhang, S.; Wang, B.; Habetler, T.G. Deep learning algorithms for bearing fault diagnostics—A comprehensive review. IEEE Access 2020, 8, 29857–29881. [Google Scholar] [CrossRef]
- Abid, F.B.; Sallem, M.; Braham, A. Optimized SWPT and decision tree for incipient bearing fault diagnosis. In Proceedings of the 2019 19th International Conference on Sciences and Techniques of Automatic Control and Computer Engineering (STA), Sousse, Tunisia, 24–26 March 2019; pp. 231–236. [Google Scholar]
- Toma, R.N.; Kim, J.-M. Bearing fault classification of induction motors using discrete wavelet transform and ensemble machine learning algorithms. Appl. Sci. 2020, 10, 5251. [Google Scholar] [CrossRef]
- Yatsugi, K.; Pandarakone, S.E.; Mizuno, Y.; Nakamura, H. Common diagnosis approach to three-class induction motor faults using stator current feature and support vector machine. IEEE Access 2023, 11, 24945–24952. [Google Scholar] [CrossRef]
- Rudin, C. Stop explaining black box machine learning models for high stakes decisions and use interpretable models instead. Nature Mach. Intell. 2019, 1, 206–215. [Google Scholar] [CrossRef]
- Cao, H.X.; Hu, P.H.; Zhao, X.K.; Jiang, C.; Yang, B.; Zhu, K.J. Design of Integrated Electrical Parameter Detection System for Aircraft Cable Network. Equip. Manuf. Technol. 2022, 10, 112–115. [Google Scholar]
- Salam, M.A.; Nadir, Z. Study the Effects of Different Types of Contaminants on the Insulator Resistance. In Proceedings of the Second International Conference on Electrical and Computer Engineering (ICECE), Dhaka, Bangladesh, 26–28 December 2002. [Google Scholar]
- Ma, C.P.; Zhang, Y.B. Research on Digital Measurement of Insulation Resistance. China Instrum. Control. 2001, 7–10. [Google Scholar]
- Cao, D.Y. Testing the Insulation Resistance of Wires and Cables. Eng. Technol. 2007, 04, 92. [Google Scholar]
- Quinlan, J.R. Induction of decision trees. Mach. Learn. 1986, 1, 81–106. [Google Scholar] [CrossRef]
- Ross, K.; Hungler, P.; Etemad, A. Unsupervised multi-modal representation learning for affective computing with multi-corpuswearable data. J. Ambient. Intell. Humaniz. Comput. 2023, 14, 3199–3224. [Google Scholar] [CrossRef]
- Briglia, G.; Immovilli, F.; Cocconcelli, M.; Lippi, M. Bearing Fault Detection and Recognition From Supply Currents With Decision Trees. IEEE Access 2024, 12, 12760–12770. [Google Scholar] [CrossRef]
- Shawen, N.; O’brien, M.K.; Venkatesan, S.; Lonini, L.; Simuni, T.; Hamilton, J.L.; Ghaffari, R.; Rogers, J.A.; Jayaraman, A. Role of data measurement characteristics in the accurate detection of Parkinson’s disease symptoms using wearable sensors. J. Neuroeng. Rehabil. 2020, 17, 52. [Google Scholar] [CrossRef]
- Sajedi, S.N.; Maadani, M.; Moghadam, M.N. F-LEACH: A fuzzy-based data aggregation scheme for healthcare IoT systems. J. Supercomput. 2022, 78, 1030–1047. [Google Scholar] [CrossRef]
- Shi, L.F.; Qiu, C.X.; Xin, D.J.; Liu, G.X. Gait recognition via random forests based on wearable inertial measurement unit. J. Ambient. Intell. Humaniz. Comput. 2020, 11, 5329–5340. [Google Scholar] [CrossRef]
- Kerdjidj, O.; Ramzan, N.; Ghanem, K.; Amira, A.; Chouireb, F. Fall detection and human activity classification using wearable sensors and compressed sensing. J. Ambient. Intell. Humaniz. Comput. 2020, 11, 349–361. [Google Scholar] [CrossRef]
- Alqarni, M.A. Error-less data fusion for posture detection using smart healthcare systems and wearable sensors for patient monitoring. Pers. Ubiquitous Comput. 2024, 28, 3. [Google Scholar] [CrossRef]
- Alsiddiky, A.; Awwad, W.; Fouad, H.; Hassanein, A.S.; Soliman, A.M. Priority-based data transmission using selective decision modes in wearable sensor based healthcare applications. Comput. Commun. 2020, 160, 43–51. [Google Scholar] [CrossRef]
| Disclaimer/Publisher’s Note: The statements, opinions and data contained in all publications are solely those of the individual author(s) and contributor(s) and not of MDPI and/or the editor(s). MDPI and/or the editor(s) disclaim responsibility for any injury to people or property resulting from any ideas, methods, instructions or products referred to in the content. |
© 2024 by the authors. Licensee MDPI, Basel, Switzerland. This article is an open access article distributed under the terms and conditions of the Creative Commons Attribution (CC BY) license (https://creativecommons.org/licenses/by/4.0/).


