Abstract
This study introduced an innovative approach for detecting structural anomalies in road manhole covers using structured light cameras. Efforts have been dedicated to enhancing data quality by commencing with the acquisition and preprocessing of point cloud data from real-world manhole cover scenes. The RANSAC algorithm is subsequently employed to extract the road plane and determine the height of the point cloud structure. In the presence of non-planar point cloud exhibiting abnormal heights, the DBSCAN algorithm is harnessed for cluster segmentation, aiding in the identification of individual objects. The method culminates with the introduction of a sector fitting detection model, adept at effectively discerning manhole cover features within the point cloud and delivering comprehensive height and structural information. Experimental findings underscore the method’s efficacy in accurately gauging the degree of subsidence in manhole cover structures, with data errors consistently maintained within an acceptable range of 8 percent. Notably, the measurement speed surpasses that of traditional methods, presenting a notably efficient and dependable technical solution for road maintenance.
1. Introduction
With the development of autonomous driving technology, automatic detection of various anomalies on road surfaces to ensure driving safety and comfort has become an important topic. The accurate detection the structural health of manhole covers plays a key role in preventing traffic accidents [1,2]. Manual inspection of manhole covers is inefficient and does not meet rapidly growing demand. Moreover, existing image recognition-based methods have obvious flaws, which are easily affected by occlusion, lighting changes and other factors. To realize intelligent and efficient manhole cover status detection, depth camera point cloud technology shows broad application prospects. Point cloud data provides rich 3D structural information, which helps describe key information such as manhole cover geometric shape and position accurately. Therefore, this study proposes a method to obtain point clouds of manhole covers using structured light cameras, and judge the status of manhole covers through algorithms like filtering and fitting. This method can break through the limitations of existing technologies to achieve automated and intelligent manhole cover detection, greatly improving detection efficiency and quality, making road maintenance more intelligent.
In addition, the rapid development of robotics and autonomous driving technologies has led to the widespread application of intelligent mobile platforms such as mobile robots in areas such as road management and maintenance. This also means that high-precision environmental perception technologies are required to ensure work efficiency [3]. It is difficult to achieve efficient and accurate manhole cover detection, which limits the application of relevant technologies in complex road environments. Therefore, developing intelligent technical means to achieve real-time and accurate detection of road anomalies is beneficial not only for traditional road management, but also provides important support for emerging intelligent mobile systems [4,5].
This study focuses on the subsidence problem of manhole cover structures and makes the following main contributions.
(1) An accurate and efficient point cloud processing method based on structured light camera point cloud information that provides preprocessing ideas for noise issues caused by the environmental factors of structured light cameras.
(2) Construct a detection model based on sector fitting to verify manhole cover point cloud cluster features and finally analyze whether the manhole cover structure affects driving comfort and safety.
Compared to high-precision LiDARs or other expensive detection scanners commonly used in engineering, this significantly reduces the maintenance costs. Owing to the compact structure of structured light cameras, they can be more flexibly integrated into existing detection products or mobile devices, providing a reference for further improving automated and intelligent road manhole maintenance engineering.
2. Related Work
Currently, most research adopts machine learning methods for image classification or object detection, with a small amount exploring IoT monitoring, but overall still needs to improve adaptability to complex environments and refine classification capabilities, as well as feasibility for practical applications. To achieve more detection tasks, multi-source heterogeneous information fusion and cross-domain method combination will be future research directions.
2.1. 3D Point Cloud Research
This work [6] proposed analyzing the spatial distribution characteristics and intensity reflection properties of manhole covers in point cloud data. They designed a combination algorithm of cloth simulation filtering (CSF) and gradient filtering to extract ground points and generate an intensity image. Then they binarized the intensity image through adaptive thresholding. On this basis, they used a Hough transform circle detection method with constrained parameters to locate manhole covers and achieved precise extraction of road manhole covers. Finally, by calculating the mean height difference between manhole cover centers and neighboring point clouds, they realized detection of subsidence defects of manhole covers. Authors proposed a method [7] of rasterizing mobile laser scanning point cloud data of road surfaces into georeferenced intensity images and feeding them back to a classifier for manhole cover detection, but did not evaluate the structural state of the covers. In the work [8] proposed using image features to improve the performance of point cloud data detectors and employing low-level image features to replace LiDAR reflectivity data, which is very important for autonomous vehicles, since reliance on a single sensor can lead to incomplete information and operational limitations. Mobile laser scanning (MLS) with geometric and radiometric constraints was applied for manhole cover identification and extraction [9]. This effectively utilizes multi-source point cloud information, but its use has been limited primarily to tagging and localization due to accuracy restrictions.
2.2. Machine Learning Methods
There are also many machine learning approaches for manhole cover detection. Authors [10,11] adopted the detection scheme proposed by Yamaguchi and Mizutani [12] that combines Support Vector Machine (SVM) and the Hough transform. This method compensates for the poor robustness of machine learning at high resolutions by integrating geometric filtering stability. Liu et al. [13] redesigned the feature extractor using a Visual Geometry Group (VGG) network to enlarge the receptive field. This enabled smaller and denser manhole objects to produce stronger responses, and performed excellently at manhole recognition in remote sensing images. In the currently hot field of deep learning, there are also uses of improved object detection algorithms [14,15,16] to identify and locate manhole covers. In [17], the authors propose an enhanced YOLOX model for the automated detection of pavement manholes, leveraging a channel attention mechanism and a microscale detection layer. They achieved superior performance compared to state-of-the-art models. A study used the hierarchical classification of datasets [18] to achieve a relatively accurate identification of manhole subsidence levels, but relying solely on image information makes it difficult to discern subsidence with too few dimensions. In addition, machine learning techniques generally do not handle high-resolution images well and require large sample sizes, often leading to very different results in different application scenarios. Pavement manhole cover damage detection is critical yet underexplored, and a proposed pipeline introduced AMDM and BCSM models, achieving high precision and efficiency, and the results demonstrated potential for broader civil engineering structural evaluations [19].
2.3. IoT-Based Analysis & Others
In the realm of Internet of Things (IoT), various approaches have been explored for manhole cover monitoring. For instance, one method [20] employed tilt and vibration sensors equipped with unique identification tags on each manhole cover, enabling narrowband IoT communication and status monitoring. However, this approach necessitates the installation of a large number of sensors and entails complex maintenance procedures. Another proposal [21] suggested the use of LoRa-communicating accelerometers for long-range cover monitoring, albeit limited to vibration detection. Additionally, acoustic signal processing techniques have been investigated for damage assessment [22], offering a low-cost solution but susceptible to interference. Addressing urban management challenges, researchers have proposed NB-IoT-based underground well monitoring systems, encompassing measurement, assessment, and data processing functionalities for effective well management, thereby presenting a promising solution for smart city development [23].
As smart cities expand rapidly, the proliferation of underground pipelines, including gas, rainwater, and electricity, necessitates robust management systems to mitigate safety hazards associated with the increasing number of manhole covers [24]. Moreover, the imperative for effective manhole monitoring in smart cities cannot be overstated, given the critical role of water management in urban hygiene. In India, where underground drainage systems are prevalent, maintaining them is essential to ensure clean and safe environments.This paper [25] introduces an IoT-based manhole monitoring system, facilitating real-time monitoring of water level, blockages, and gas levels. Similarly, another research team [26] presents an IoT-based approach for manhole management, utilizing a variety of sensors such as tilt, ultrasonic, temperature, gas, and water flow sensors to address accidents and health hazards associated with uncovered manholes. The collected data is transmitted in real-time via Wi-Fi for continuous monitoring. Furthermore, this paper [27] presents a method for autonomous exploration of multiple compartments within a Ballast Water Tank using Micro Aerial Vehicles, incorporating strategies for manhole detection and navigation based on 3D LiDAR data.
3. Point Cloud Acquisition and Processing
3.1. Data Acquisition
The field data collection of manhole covers was performed in the vicinity of the Fujian Province Key Laboratory of Precision Drive and Transmission at a university in Fujian Province, China. Manhole covers on the road surface were randomly selected and scanned using a vehicle-mounted mobile detection device to obtain point cloud data. Due to factors such as vehicle speed and lighting conditions, the acquired point cloud data of the manhole cover surface may still contain anomalous points, offset points and other noise. Only after denoising and other preprocessing can valid data be formed.
3.2. Data Preprocessing
3.2.1. Voxel Centroid Downsampling
Voxel centroid downsampling is an important data preprocessing step in this study, aimed at effectively reducing the density of the point cloud data for more efficient subsequent analysis.
To balance data density and information loss, we chose appropriate parameters for voxel downsampling. The voxel resolution was set to 0.5 cm, a value determined by experiments to optimize based on the camera’s own imaging resolution and accuracy.
3.2.2. Median Filtering
Depth camera captured point clouds often suffer from holes, noise and depth distortions due to sensor characteristics. Here we typically use median filtering to address this issue.
The principle of median filtering is based on statistical sorting within a neighborhood. For a sample point Pa(xa, ya, za), we define a custom spherical neighborhood N with a radius of d:
The specific calculation method for median filtering is following:
Taking the median point generated in the ranking to replace the sample point Pa(xa, ya, za), and the operation is as follows:
Replacing the abnormal hole values with normal neighborhood values yields relatively clean and reasonable point cloud data for the manhole cover.
3.2.3. Statistical Filtering
The core principle of statistical filtering is detecting and removing obvious outlier points in the point cloud. For each point in a given point cloud dataset, statistical filtering typically uses an outlier detection method based on Gaussian distribution. First, the mean and standard deviation of depth values within a local neighborhood are calculated. The neighborhood usually consists of points within a window or radius as well as nearby k points. Once the mean and standard deviation are computed, statistical rules can be used to determine whether a point should be marked as an outlier. The multiplier mul is usually chosen by the user according to data characteristics.
Assuming the distances of all points in the point cloud follow a Gaussian distribution, the shape and size of the point cloud cluster are determined by the mean and standard deviation . Here we designate one point Pi(xi, yi, zi) in the point cloud, and the distance from Pi to any other point Pa(xa, ya, za) is Li:
In order to obtain the optimal parameters for the statistical filter, we tried different values of k and mul. Specifically, we tested k values of 10, 15, 20, 25, 30 to correspond to different point cloud densities, and mul values of 1, 2, 3 to correspond to different filtering strengths. We found that when k takes smaller values, it is easily affected by outliers and the error is larger. When taking larger values, there is a risk of filtering out normal points. At the same time, when mul takes smaller values, the filtering effect is not significant, and when taking larger values, useful information may be lost. Besides, the structured light camera used in this paper also has a noticeable impact on the parameter selection. This camera has a resolution of 640 × 480. Considering this, we choose a slightly larger than minimum value of k = 20 to ensure effective filtering of camera noise while preserving key information. Besides, the main source of noise for this camera is measurement errors which tend to be more random. Therefore, we select a mul value around 1 standard deviation so that noise can be significantly reduced without over filtering valid information.
In summary, taking into account both theoretical analysis, experimental optimization and the specific noise characteristics as well as resolution constraints of the structured light camera, we select k = 20 and mul = 1.817. This parameter combination can effectively eliminate outliers while retaining major point cloud information, achieving the optimal filtering effect, it can be calculated whether the distance of each point from its nearby 20 points falls within the range of mul. Otherwise, the point is identified as an outlier.
3.2.4. Radius Filtering
The purpose of radius filtering is to identify and remove anomalous points by inspecting the edge regions in the point cloud captured by the camera for noise.
Radius filtering is implemented by examining the number and distribution of points within the neighborhood of each point. If the number of points within a point’s neighborhood is below a threshold, that point is identified as edge noise. Radius filtering methods typically consider the distance between points and allow parameter tuning based on specific application requirements. As shown in Figure 1, by setting the neighborhood radius to 0.15 cm and the threshold number of points to 12, edge points can be filtered out.
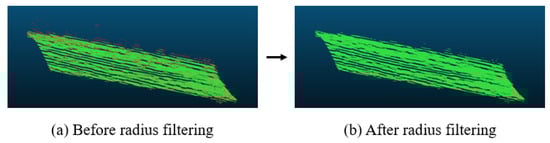
Figure 1.
Radius Filtering Schematic: Point cloud in (a) before executing radius filtering, and in (b) after performing radius filtering.
4. Point Cloud Processing Method
4.1. Theoretical Premise
4.1.1. Process Design
The point cloud processing workflow in this study follows the steps of first segmentation, then classification, and finally detection. As shown in Figure 2, first the point cloud is filtered and then the road surface point cloud is extracted using the RANSAC plane segmentation algorithm. Next, the overall height of the point cloud is calculated to determine if it is greater than 3 cm. For point clouds with heights within 3 cm, their height values are retained and normal results are directly output. Whereas for point clouds exceeding the threshold height, DBSCAN clustering algorithm is further utilized to segment and obtain point clouds of individual discrete objects. Subsequently, the fan-shaped fitting manhole cover detector designed in this paper is used to judge each clustered object, identifying point clouds with geometric structures matching manhole cover features as manhole anomalies, and others as different road obstacles.
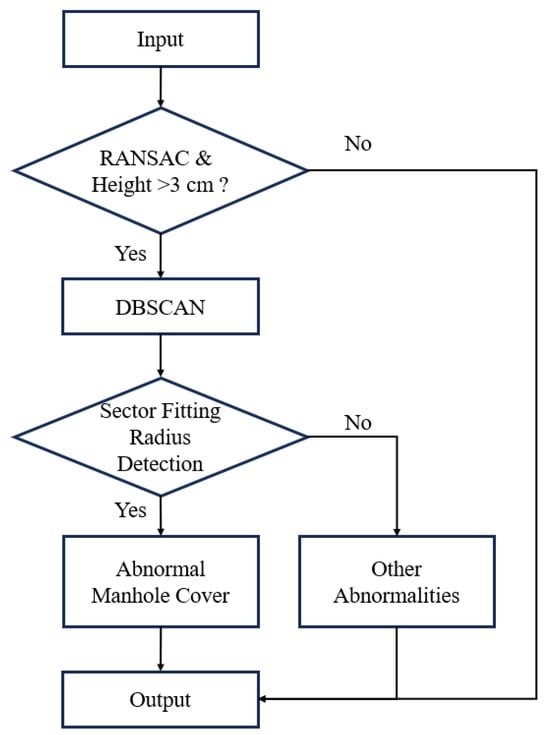
Figure 2.
Flowchart of processing pipeline to detect manhole covers from point clouds. Key steps include filtering, road surface segmentation, clustering, and manhole recognition.
Finally, regardless of whether the source point cloud has undergone clustering segmentation, the final manhole cover structural height information will be output.
4.1.2. Segmenting Road Surface Point Cloud by Using RANSAC
RANSAC proposed by Fishe [28] is a robust fitting algorithm commonly used for plane detection and fitting in point cloud data. The key of this algorithm lies in its robustness against noise and outlier points. As shown in Figure 3, the red points outside the plane are considered as outliers and get removed, while the remaining points iteratively fit to obtain an optimal plane. By sampling the point cloud data and identifying inliers, the equation of the road plane can be estimated.
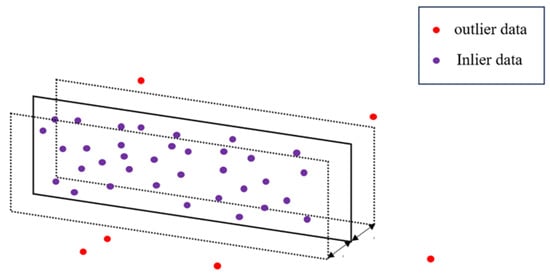
Figure 3.
RANSAC Plane Fitting Algorithm.
After obtaining the road plane equation, coordinate transformation is then used to map the fitted plane to the x-y plane, providing a reference baseline for subsequent calculation of point cloud heights, thereby determining the height distance of off-road point clouds relative to the road plane.
The schematic in Figure 4 describes the blue points represent the road plane, while the red points are separated off-road points. The maximum distance from inliers to the plane model is set as 0.75 cm for plane fitting, with 5 sample points for fitting and a maximum number of 500 k iterations. Please do note that point clusters fewer than 5 points are removed here, aiming to prevent additional noise interference.
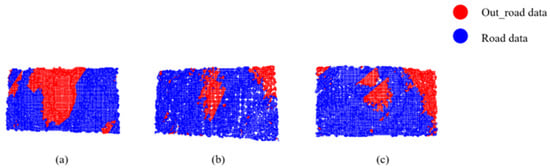
Figure 4.
RANSAC Road Plane Point Cloud Segmentation Schematic: (a–c) depict point clouds of three structurally distinct manhole covers.
At this point, the plane equation obtained through the RANSAC algorithm is represented as ax + by + cz + d = 0. Subsequently, the set of points outside the fitted plane, denoted as outlier R_outlier, is determined. To identify the highest and lowest points within this set, the following formula is applied:
Then, the highest points and lowest points in the off-plane point set R_outlier can be found by screening based on:
The distances from and to the fitted plane can then be calculated using the point-to-plane distance formula as follows:
The above formulas delineate the process of computing the coordinates of the highest and lowest points in the point cloud outside the manhole cover’s fitted plane, as well as the distances from the fitted plane to these extreme points. In the subsequent steps, this geometric information will play a pivotal role in the practical applications and further research endeavors.
4.1.3. Application of DBSCAN in Point Cloud Clustering
Density-Based Spatial Clustering of Applications with Noise (DBSCAN) is an effective clustering algorithm [29], commonly used for clustering and partitioning point cloud data. The core idea of DBSCAN is to start from a seed point in the dataset, and iteratively expand the cluster by calculating the distance between points and other points within its neighborhood. If the neighborhood of a point contains at least MinPts points, then the point is marked as a core point, and all connected points are assigned to the same cluster. Then, the next point is selected from the core point’s neighborhood, repeating this process until no new points can be added. Appropriate and MinPts parameters can cluster the off-road points in the point cloud into different clusters. This helps better distinguish road structures and manhole cover features in subsequent analysis. The clustering neighborhood distance parameter set in DBSCAN is determined based on the point cloud of manhole covers, where hierarchical characteristics are more pronounced. In order to mitigate variations in experimental results and achieve a more balanced experimental outcome, we typically set the distance to one-third of the diameter of the manhole cover.
In this study, the DBSCAN algorithm is first utilized to cluster the road plane portion of the point cloud, laying the groundwork for the feature detection in the following section to verify whether there are manhole cover features, so as to facilitate the task of detecting abnormalities in manhole cover height.
4.1.4. Manhole Cover Point Cloud Feature Detection Based on Sector Fitting Radius
In order to more precisely determine which clustered parts belong to manhole covers, the SF (Sector Fitting) iterative point cloud algorithm based on least squares is proposed, and the principle is shown in Figure 5. The SF algorithm aims to further refine the DBSCAN clustering results by separating manhole cover points from other clusters. By iteratively fitting a sector that best matches the point cloud edges, the curvature and radius characteristics of the fitted sector are obtained to infer whether the point cloud is a manhole cover.
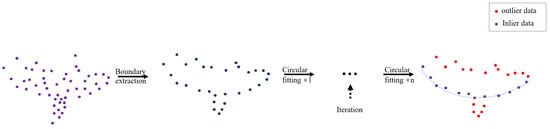
Figure 5.
Sector Fitting Process: Illustration.
First, a starting point cloud (, , ) is selected from the point cloud cluster as the starting point. An initial circle center coordinate (, , ) and initial radius are randomly selected as initial iteration values, with a change threshold set.
In geometry, the centroid of an object refers to the average position of all the mass points of that object. For a continuous mass distribution, the centroid can be calculated by multiplying each mass point’s position by its mass, and then dividing by the total mass. For a point cloud, the mass of each point can be considered equal. That is to say, the centroid of a point cloud can be computed by averaging the coordinates of all the points. The point cloud centroid provides information about the geometric structure and distribution of the point cloud. During the fitting process, the variation of centroid is closely related to the change of fitting results.
(1) For each point in the point cloud, calculate its distance to the circle center coordinate (, , ):
(2) Divide the points into two groups: the set sf_inlier with distances smaller than the radius, and the set sf_outlier with distances greater than the radius:
(3) Calculate the centroid coordinate (, , ) of the point set sf_inlier:
(4) Replace (, , ) as the new circle center coordinate and update the radius
(5) Repeat the above steps until the change of is smaller than the set threshold or the iteration limit is reached.
When the value of falls within the typical radius range of manhole covers, the point cloud cluster is identified as part of the manhole cover point cloud. In this scenario, we encounter two situations:
- The manhole cover point cloud cluster is distributed on one side of the road plane.
- The manhole cover point cloud cluster is distributed on both sides of the road plane.
Due to the coordinate transformation performed earlier in our discussion, it is only necessary to calculate the sum of the absolute values of the positive and negative extremes of the z-coordinates of the manhole cover point cloud cluster.
As illustrated in Figure 6, the initial segmentation of point cloud data is carried out using the DBSCAN clustering algorithm, resulting in the extraction of multiple point cloud clusters that are subsequently classified. Different categories of point clouds are distinguished by distinct colors. Among the three samples subjected to the fan-shaped fitting detection model filter, point cloud data in Figure 6a,c exhibit evident arc features, allowing for a direct identification as manhole cover point clouds. This corresponds to situations where the manhole cover exhibits a noticeable inclination relative to the road surface.
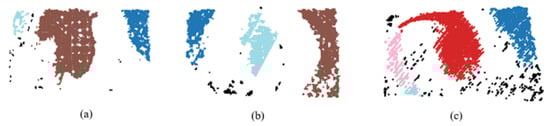
Figure 6.
DBSCAN + SF Selection Results: (a,c) depict the point cloud segmentation and selection outcomes when the manhole cover is inclined, while (b) illustrates the point cloud segmentation in the case of a relatively flat manhole cover.
In contrast, the point cloud in Figure 6b lacks conspicuous arc features. However, indirect identification as a manhole cover is possible by analyzing the fan-shaped information formed by the surrounding road protrusions. This is attributed to the fact that during the RANSAC plane fitting process, fitting is done with the manhole cover’s plane as a reference, while local variations in the actual road surface may exist. Consequently, the fan-shaped detector can still infer the presence of a manhole cover through the surrounding road’s fan-shaped characteristics, highlighting the rationality and robustness of the algorithm.
4.2. Results
4.2.1. Application and Experimental Setup of CloudCompare
In order to validate the accuracy and effectiveness of our proposed method for manhole cover structure assessment, experiments were conducted using data computed with CloudCompare v2.9.0 as a comparative reference. CloudCompare is a free and open-source point cloud processing software known for its extensive functionalities, including point cloud importation, visualization, registration, segmentation, and reconstruction. With its intuitive user interface and powerful tools, CloudCompare has become a robust tool in the field of point cloud research. In this section, structural height calculations are involved, and as such, filtered point cloud data is directly utilized for measurements. The highest and lowest points in the manhole cover region are identified, and corresponding distances are recorded.
To obtain tangible point cloud height data, the experimental software settings are outlined below:
- Coordinate Transformation: Initially, a tool is employed to identify the fitting plane of the manhole cover, enabling the transformation of the manhole cover point cloud information from the world coordinate system’s x-y plane to the fitting plane.
- Visualization: We utilize the visualization feature of CloudCompare to observe the shape and distribution of the point cloud data, as well as to check for any potential issues or outliers.
As depicted in Figure 7, the elevation maps based on the Z-direction provide a clear representation of the manhole cover outlines for the four inspection chambers. The red areas indicate lower terrain, and the specific distribution of point cloud heights is illustrated in Figure 8.
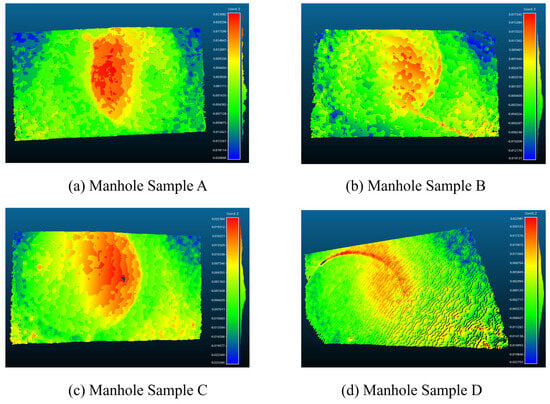
Figure 7.
Point Cloud Visualization Elevation Maps: (a–d) represent point clouds of manhole covers with varying degrees of subsidence.
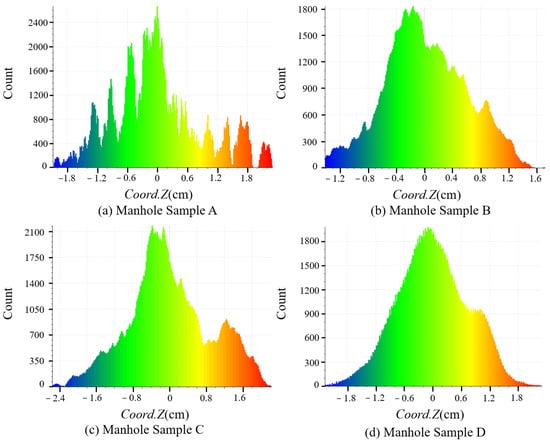
Figure 8.
Elevation Histogram of Manhole Cover Point Clouds: (a–d) correspond to the manhole covers and labels in Figure 7.
The four bar chart labels in Figure 8 correspond to the elevation maps of the four inspection chambers in Figure 7. In these bar charts, the x-axis represents the output height in the Z-direction, while the y-axis denotes the number of points in the point cloud. It’s important to note that, since the point cloud data is in the form of a phase image, the actual height is the inverse of the output height. Therefore, higher points on the bar chart correspond to lower points in reality.
Because of the substantial volume of raw point cloud data, we have employed 256 distance intervals for classification. For instance, in Figure 8a, the highest point is approximately at 2.5 cm, with a count of around 50 points. The lowest point is at −2.1 cm, with fewer than 50 points. The red points represent the furthest distance from the fitted Z-plane, and by referring to Figure 7a, it is evident that the red area corresponds to the manhole cover region. Hence, the estimated subsidence of the manhole cover is approximately 2.5 cm.
4.2.2. Experiment
Urban road engineering guidelines [30] specify that a height difference over 3 cm between the manhole cover and road surface can cause noticeable vibrations for passing vehicles. Thus, covers exceeding 3 cm in structural height are categorized as abnormal subsidence. Moreover, point cloud data quality standards for flat terrain [31] state an 8% maximum elevation error. This aids authorities to more effectively monitor structural quality of covers for timely identification and handling of those not meeting road travel comfort standards, thus ensuring quality and safety.
Table 1 compiles data for 12 manhole covers exhibiting significant structural variations (excluding road anomalies). The algorithmic experiments underwent ten iterations, with consistent judgment results for each case. Subsequently, calculated values obtained from these experiments were compared against manhole cover height data processed by CloudCompare, serving as validation values. Simultaneously, the identification results for abnormal structures were output, allowing for the assessment of the method’s performance with real-world data.

Table 1.
Results of Calculated and Verified Data for 12 Sets of Manhole Covers and Output Structures.
Analysis of Table 1 indicates that the proposed algorithm effectively measured 12 manhole covers with pronounced inclinations. The percentage error values demonstrate that the measurement discrepancies between the algorithm’s outputs and the validation results consistently remained within 7%, meeting the requirement of a maximum allowable error of 8%. For manhole covers with actual heights within 3 cm, RANSAC segmentation demonstrates exceptional height calculation performance. In cases where the manhole cover height ranges from 3 cm to 5 cm, the fan-shaped fitting detection exhibits outstanding performance. However, for manhole covers with heights exceeding 5 cm, height calculation errors tend to amplify, and the occasional misalignment of the fan-shaped fitting detection model may lead to the misidentification of manhole covers as other features. This phenomenon may be attributed to the steep slope of actual manhole covers, causing the RANSAC algorithm to exclude a significant portion of the point cloud in the manhole cover area during road plane segmentation. Nevertheless, given the infrequent occurrence of manhole covers with structural heights exceeding 5 cm in road structures, classifying them as road anomalies is deemed reasonable.
The Figure 9 illustrates the average time consumption for manual measurement, semi-automated measurement using CloudCompare, and the algorithmic measurement proposed in this study for the 12 manhole covers. It is evident that the algorithmic approach significantly reduces the time required compared to manual and semi-automated measurement methods, thereby substantially improving the efficiency of road surface detection.
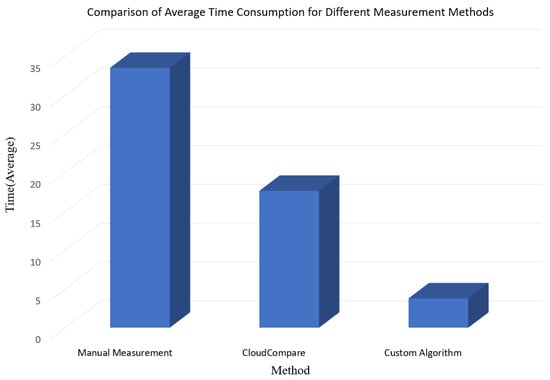
Figure 9.
The chart illustrates the average time consumption comparison for manual measurement, CloudCompare measurement, and custom algorithm measurement.
Figure 10 illustrates a comparison of 20 manhole covers with structure heights less than 5 cm, presenting measurement results, validation results, and classification outcomes. The algorithm excels particularly around 3 cm, with noticeable performance fluctuations around 1 cm and in the 4–5 cm height range. Moreover, for the 20 manhole covers with heights less than 5 cm, the classification accuracy reaches 85%, but significantly declines near 5 cm.
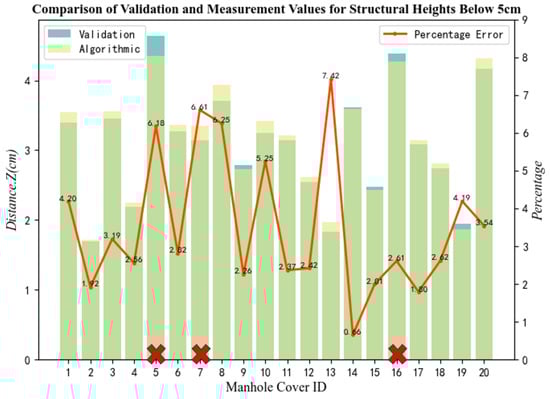
Figure 10.
The chart compares measurements to validations for structures beyond 5 cm. Bars represent measurements and validations, lines depict errors, and axis symbols indicate misclassifications. The red X indicates a misclassification of the type.
Figure 11 depicts 10 manhole covers with structure heights exceeding 5 cm. It’s important to note that there are very few abnormal manhole covers with heights exceeding 5 cm in road scenarios. The algorithm’s classification performance is notably compromised for heights greater than 5 cm, although the height calculation error remains within 8%. Consequently, there is room for improvement in the algorithm’s ability to discern road and manhole cover abnormalities for heights exceeding 5 cm.
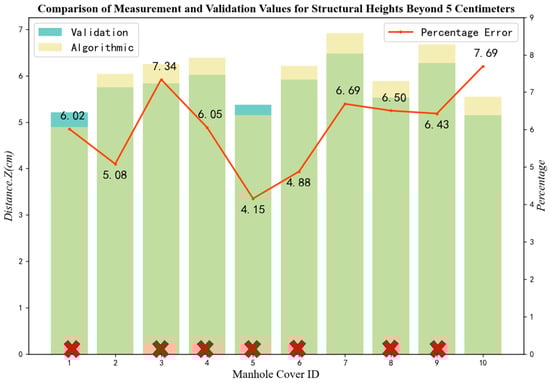
Figure 11.
The chart compares measurements to validations for structures below 5 cm. The red X indicates a misclassification of the type.
To better demonstrate the superiority of the fan-shaped fitting method proposed in this study for manhole point cloud detection in the engineering context, we compared it with the state-of-the-art PointNet++ object shape segmentation algorithm in point cloud deep learning. The evaluation criteria for the experiments included accuracy and time efficiency. The experiments were conducted on a dataset comprising 297 pre-prepared manhole point clouds.
Based on the Table 2, although the PointNet++ algorithm exhibits slightly faster detection speed compared to the method proposed in this study, its actual detection accuracy is inferior. This discrepancy may largely stem from the point cloud being collected at low resolution near the ground, resulting in low discrimination between road surfaces and manhole covers, thereby posing obstacles during segmentation and training. Consequently, it is evident that, compared to the PointNet++ algorithm, the DBSCAN+SF method proposed in this study achieves an accuracy rate of 83% in this scenario, essentially meeting practical operational requirements.
Table 2.
Results of Calculated and Verified Data for 12 Sets of Manhole Covers and Output Structures.
In summary, the algorithm effectively handles common manhole cover abnormalities and demonstrates precise height error control. However, in rare cases involving large-span manhole cover abnormalities, additional assistance such as manual intervention or alternative tools may be required, presenting new perspectives for refining detection tasks and enhancing inspection processes in this field.
5. Conclusions
In response to the issue of manhole sinking in road engineering, a manhole detection method based on structured light 3D scanning is proposed. This method utilizes a structured light camera to acquire point cloud data of the manhole and its surrounding road, employing a fan-shaped fitting model to detect key points on the manhole. Experimental results demonstrate the effectiveness of the algorithm in calculating the structural height of manholes and its capability to inspect common abnormal manholes, achieving automatic identification. This paper discusses the functionality and usage of the commonly used point cloud processing software, CloudCompare, in the field of measurement. The results obtained from this method are compared with manual measurements and the average time spent using our algorithm. The findings show a significant reduction in time compared to traditional methods.
However, it is important to note the limitations of the proposed method. Firstly, the method is limited to capturing images parallel to the road at a resolution of 640 × 480 pixels. Additionally, it is advisable to avoid operating the system in heavy rain or snow conditions. Currently, the algorithm is designed to detect and identify common circular manhole covers, while other irregular shapes, such as square covers, are not included in the detection scope.
Additionally, the paper explores the impact of the 5 cm threshold on the algorithm’s performance. Currently, the approach demonstrates excellent detection results for situations below 5 cm. However, for scenarios above 5 cm, while height error detection is reliable, the algorithm struggles with anomaly type identification. Therefore, the paper also proposes future improvement strategies for handling manhole anomalies exceeding 5 cm.
This study utilized data from manholes on certain roads in Fujian Province and Zhejiang Province, China, and the feasibility of the proposed approach can be validated using the structural characteristics of manholes from other road networks. The automated manhole inspection method demonstrated practical applications in routine road maintenance, emergency repairs, and road quality assessments, highlighting its significant utility. However, in terms of algorithm robustness, there is still room for improvement as there currently isn’t a method to precisely differentiate between manhole and road anomalies above 5cm. This study explores the application of structured light cameras and 3D reconstruction in the field of manhole detection, providing insights for technological advancements in road detection within this domain.
Author Contributions
Conceptualization, H.Z., G.L. and S.X.; Software, H.Z.; methodology, H.Z. and G.L.; resources, S.X.; writing—original draft preparation, H.Z. and G.L.; writing—review and editing, G.L., S.X., J.L., Z.L. and Y.W.; visualization, Z.L. and Y.W.; investigation Y.W. and S.X.; supervision, G.L. All authors have read and agreed to the published version of the manuscript.
Funding
This research was funded by the Natural Science Foundation of Fujian Province, China (No. 2020J01272).
Data Availability Statement
The data that support the findings of this study are available on request from the corresponding author, (S.C.), upon reasonable request.
Conflicts of Interest
The authors declare no conflict of interest.
References
- Zhou, D.; Hu, Q.; Sun, X.; Yao, W.; Gu, G.; Yang, R.; Ma, C. Probability Model of Riding Behavior Choice of Two-Wheelers under the Influence of the Subsidence Area of a Manhole Cover. Sustainability 2022, 14, 3532. [Google Scholar] [CrossRef]
- Guo, J.; Wang, K.; Sun, J.; Jia, Y. Research and Implementation of Low-Power Anomaly Recognition Method for Intelligent Manhole Covers. Electronics 2023, 12, 1926. [Google Scholar] [CrossRef]
- Zhang, D.; Yu, X.; Yang, L.; Quan, D.; Mi, H.; Yan, K. Data-Augmented Deep Learning Models for Abnormal Road Manhole Cover Detection. Sensors 2023, 23, 2676. [Google Scholar] [CrossRef] [PubMed]
- Zhou, X.; Chen, Q.; Jiang, B.; Chen, H. An Underground Pipeline Mapping Method Based on Fusion of Multisource Data. IEEE Trans. Geosci. Remote Sens. 2022, 60, 4511711. [Google Scholar] [CrossRef]
- Ahmed, M.T.; Amin, M.R.; Rahman, F.U.; Abeer, M.H.; Nabi, N.; Ahamed, M.S. A Comparative Study of Different Transfer Learning Models for Classification of Urban Manhole States. In Proceedings of the 2022 32nd International Conference on Computer Theory and Applications (ICCTA), Alexandria, Egypt, 17–19 December 2022; pp. 25–30. [Google Scholar]
- Xu, M.; Han, Y.; Wang, L.; Zhang, P.; Liu, D.; Yang, J. Research on High-precision Manhole Cover Extraction and Settlement Disease Detection Method Based on Laser Point Cloud. Chin. J. Lasers 2021, 48, 63–77. [Google Scholar]
- Yu, Y.; Guan, H.; Li, D.; Jin, C.; Wang, C.; Li, J. Road Manhole Cover Delineation Using Mobile Laser Scanning Point Cloud Data. IEEE Geosci. Remote Sens. Lett. 2020, 17, 152–156. [Google Scholar] [CrossRef]
- Csonthó, M.; Rövid, A.; Szalay, Z. Significance of Image Features in Camera-LiDAR Based Object Detection. IEEE Access 2022, 10, 61034–61045. [Google Scholar] [CrossRef]
- Yadav, M.; Lohani, B.; Goel, S. Geometric and radiometric constraints-based extraction of urban road manhole covers and their maintenance-related information using mobile laser scanning data. Geocarto Int. 2022, 37, 16716–16735. [Google Scholar] [CrossRef]
- Pasquet, J.; Désert, T.; Bartoli, O.; Chaumont, M.; Delenne, C.; Subsol, G.; Derras, M.; Chahinian, N. Detection of Manhole Covers in High-Resolution Aerial Images of Urban Areas by Combining Two Methods. IEEE J. Sel. Top. Appl. Earth Obs. Remote Sens. 2015, 9, 1802–1807. [Google Scholar] [CrossRef]
- Liu, H.; Yan, B.; Wang, W.; Li, X.; Guo, Z. Manhole Cover Detection from Natural Scene Based on Imaging Environment Perception. KSII Trans. Internet Inf. Syst. 2019, 13, 5095–5111. [Google Scholar]
- Yamaguchi, T.; Mizutani, T. Detection and localization of manhole and joint covers in radar images by support vector machine and Hough transform. Autom. Constr. 2021, 126, 103651. [Google Scholar] [CrossRef]
- Liu, W.; Cheng, D.; Yin, P.; Yang, M.; Li, E.; Xie, M.; Zhang, L. Small Manhole Cover Detection in Remote Sensing Imagery with Deep Convolutional Neural Networks. ISPRS Int. J. Geo-Inf. 2019, 8, 49. [Google Scholar] [CrossRef]
- Lin, J.; Yang, C.; Lu, Y.; Cai, Y.; Zhan, H.; Zhang, Z. An Improved Soft-YOLOX for Garbage Quantity Identification. Mathematic 2022, 10, 2650. [Google Scholar] [CrossRef]
- Zhang, H.; An, L.; Chu, V.W.; Stow, D.A.; Liu, X.; Ding, Q. Learning Adjustable Reduced Downsampling Network for Small Object Detection in Urban Environments. Remote Sens. 2021, 13, 3608. [Google Scholar] [CrossRef]
- Commandré, B.; En-Nejjary, D.; Pibre, L.; Chaumont, M.; Delenne, C.; Chahinian, N. Manhole Cover Localization in Aerial Images with a Deep Learning Approach. In Proceedings of the ISPRS Hannover Workshop HRIGI 17–CMRT 17–ISA 17–EuroCOW 17, Hannover, Germany, 6–9 June 2017; Volume 42, pp. 333–338. [Google Scholar]
- Zhang, H.; Shang, J.; Dong, Z.; He, A.; Zhang, A.A.; Liu, Y.; Lin, Z. Automated Detection of Pavement Manhole on Asphalt Pavements with an Improved YOLOX. J. Infrastruct. Syst. 2023, 29, 04023023. [Google Scholar] [CrossRef]
- Zhou, B.; Zhao, W.; Guo, W.; Li, L.; Zhang, D.; Mao, Q.; Li, Q. Smartphone-based road manhole cover detection and classification. Autom. Constr. 2022, 140, 104344. [Google Scholar] [CrossRef]
- Jia, G.; Han, G.; Rao, H.; Shu, L. Edge Computing-Based Intelligent Manhole Cover Management System for Smart Cities. IEEE Internet Things J. 2018, 5, 1648–1656. [Google Scholar] [CrossRef]
- Peng, J.; Wang, W.; Hu, W.; Ai, C.; Xu, X.; Shi, Y.; Qiu, S. Automated detection and quantification of pavement cracking around manhole. Eng. Appl. Artif. Intell. 2024, 130, 107778. [Google Scholar] [CrossRef]
- Zhang, H.-S.; Li, L.; Liu, X. Development and Test of Manhole Cover Monitoring Device Using LoRa and Accelerometer. IEEE Trans. Instrum. Meas. 2020, 69, 2570–2580. [Google Scholar] [CrossRef]
- Gong, Z.; Liang, L.; Yang, Z.; You, J.; Cai, Y.; Liu, H. A Detection Method of Stealing and Destroying Manhole Cover Based on Sound Signal Processing. Mach. Tool Hydraul. 2019, 47, 39–43. [Google Scholar]
- Lu, Y.; Fang, Q.; Li, M.; Du, X.; Chen, Q.; Dai, Y. Low Power Intelligent Underground Well Monitoring System Based on NB-IoT. SEA 2022, 11, 701–711. [Google Scholar] [CrossRef]
- Liu, H.; Yang, S.; Zhang, H.; Xie, R.; Zhou, H. Innovative Design of Manhole Covers and Intelligent Monitoring System Interface for Intelligent Cities. Design 2023, 8, 535–547. [Google Scholar] [CrossRef]
- Ganesan, P.; Supraja, N.; Praveena, R. IoT based manhole detection and monitoring system. AIP Conf. Proc. 2023, 2725, 070001. [Google Scholar]
- Miriyala, S.; Rajesh, K.; Bhaskar, P.; Sairam, M.; Prasad, M. Manhole Detection and Monitoring System through IoT. In Proceedings of the 2023 14th International Conference on Computing Communication and Networking Technologies (ICCCNT), Delhi, India, 6–8 July 2023; Volume 1, pp. 1–5. [Google Scholar]
- Dharmadhikari, M.; De Petris, P.; Nguyen, H.; Kulkarni, M.; Khedekar, N.; Alexis, K. Manhole Detection and Traversal for Exploration of Ballast Water Tanks using Micro Aerial Vehicles. ICUAS 2023, 1, 103–109. [Google Scholar] [CrossRef]
- Fischler, M.; Bolles, R. Random sample consensus: A paradigm for model fitting with applications to image analysis and automated cartography. Commun. ACM 1981, 24, 381–395. [Google Scholar] [CrossRef]
- Ester, M.; Kriegel, H.; Sander, J.; Xu, X. A Density-Based Algorithm for Discovering Clusters in Large Spatial Databases with Noise. Comput. Sci. 1996, 96, 226–231. [Google Scholar]
- GB55011-2021; Project Code for Urban Road and Transportation Engineering. National Standards of P. R. C.: Beijing, China, 2021.
- CH/T 8023-2011; Specifications for Data Processing of Airborne LIDAR, Surveying and Mapping Industry. Standards of P. R. C.: Beijing, China, 2011.
Disclaimer/Publisher’s Note: The statements, opinions and data contained in all publications are solely those of the individual author(s) and contributor(s) and not of MDPI and/or the editor(s). MDPI and/or the editor(s) disclaim responsibility for any injury to people or property resulting from any ideas, methods, instructions or products referred to in the content. |
© 2024 by the authors. Licensee MDPI, Basel, Switzerland. This article is an open access article distributed under the terms and conditions of the Creative Commons Attribution (CC BY) license (https://creativecommons.org/licenses/by/4.0/).