Article

A 12 μW 10 kHz BW 58.9 dB SNDR AC-Coupled Incremental ADC for Neural Recording

1
Research and Development Center of Healthcare Electronics, Institute of Microelectronics of the Chinese Academy of Sciences, Beijing 100029, China
2
University of Chinese Academy of Sciences, No. 19(A) Yuquan Road, Shijingshan District, Beijing 100049, China
3
Chinese Institute for Brain Research, Beijing 102206, China
*
Author to whom correspondence should be addressed.
Electronics 2024, 13(7), 1222; https://doi.org/10.3390/electronics13071222
Submission received: 4 March 2024 / Revised: 20 March 2024 / Accepted: 22 March 2024 / Published: 26 March 2024
(This article belongs to the Section Circuit and Signal Processing)

Abstract

:
This paper presents an AC-coupled, incremental analog-to-digital converter (ADC) based on two-step quantization for high-density implantable neural recording. It achieves a rail-to-rail electrode DC offset (EDO) rejection, low noise, a small area, and low power consumption. Fabricated in a 180 nm CMOS process, the prototype ADC achieves a high input impedance, 24 mVpp linear input range, and 58.9 dB signal-to-noise and distortion ratio (SNDR). Its core circuit has a power consumption of 12 μW and an area of 0.0192 mm2. The referred-to-input (RTI) noise is 6.9 μVrms within the bandwidth of 1 Hz–10 kHz.

1. Introduction

In brain–computer interface (BCI) systems, implantable neural signals like local field potential (LFP) and action potential (AP) have been widely studied due to their good signal quality and spatial resolution [1]. However, limited by the number of channels that implantable neural recording chips record, research can only be conducted on a small number of neurons. The limited amount of neural information restricts further development in neuroscience. To obtain more accurate and abundant neural signal information, there is a great demand for high-density neural recording. However, for high-density neural recording chips, the design of recording unit circuits is crucial. Record unit circuits should have lower power consumption and smaller areas while meeting the requirements for noise.
Currently, there are multiple circuit design methods for neural recording chips [1,2,3,4,5,6,7,8,9,10,11,12,13,14,15,16,17,18,19,20,21,22,23,24,25,26,27,28,29,30,31,32]. The most commonly used design methods can be divided into two main categories. As shown in Figure 1a, the first approach involves amplifying the input signal with a low-noise instrumentation amplifier (IA), passing it through a programmable gain amplifier (PGA), and then quantifying it with a medium-accuracy (10–12 bit) low-power ADC [2,3,4,5,6,7,8,9,10,11,12,13,14,15,16,17,18,19,20,21,22,23]. There are two main implementation methods for low-noise IAs. The first method utilizes a capacitance amplifier, forming a high-pass filter with capacitance and pseudo-resistance, with a 3 dB cutoff frequency below 1 Hz, which is able to eliminate EDO rail-to-rail [2,3,4,5,6,7,8,9,10,11,12,13,14,15,16,17,18]. This amplifier structure is simple and widely used. However, the low-frequency noise performance of capacitive-coupled neural amplifiers is poor. Neural signals like LFP signals often have signal energy concentrated in the low-frequency range. The second implementation method uses an amplifier with a chopper-stabilized structure [19,20,21,22,23]. This design allows for chopping input and good low-frequency noise performance, addressing the aforementioned issue. Amplifiers designed with a chopper stabilization structure are complex, often nested with multiple loops to improve performance. For example, they require a DC servo loop (DSL) to eliminate EDO, and this kind of EDO cancellation has a limited range. Successive approximation register (SAR) ADCs are commonly used in the first approach because they have low power consumption and the accuracy can meet the requirements.
However, as the number of integrated channels increases, the first approach becomes limited by the complex signal processing chain, which restricts the area of the recording unit circuit. To address this issue, researchers have proposed a second solution, as shown in Figure 1b, which directly quantifies neural signals using low-noise ADC [24,25,26,27,28,29,30,31,32]. These ADCs are mostly oversampling-type ADCs, utilizing noise shaping to improve accuracy. Refs. [25,26,27] adopted the Δ-ΔΣ architecture, which adds a differentiator before the conventional ΔΣ to eliminate EDO by subtracting adjacent input signals. Refs. [28,29,30] utilized an incremental ΔΣ ADC architecture. The area of the recording unit in [28,29] is very small: less than 0.005 mm2. Refs. [31,32] utilized a continuous time ΔΣ architecture, realizing a recording range of up to hundreds of mV. Ref. [31] used a VCO as the quantizer, which is currently a very popular design method.
There are many different architectures for neural recording ADCs. Among them, ref. [29] proposed an incremental ADC with two-step quantization, which has the advantages of a small area and low power consumption. However, due to its DC input, when EDO occurs, its performance, especially noise and linearity, will significantly decrease. The range of EDO it can cancel is limited to ±60 mV, severely restricting its application range. To address this issue, this paper proposes an AC-coupled two-step incremental ADC, which can eliminate EDO rail-to-rail without requiring additional power consumption, while retaining the performance advantages of this architecture. Through chip testing, the ADC was proven to function properly. The remaining sections of this paper are organized as follows: Section 2 provides a mathematical analysis of the working principle of ADC; Section 3 details the specific circuit implementation of ADC; Section 4 presents the measurement results, analysis, and performance comparison with other works. Finally, Section 5 concludes the paper.

2. System Architecture of the ADC

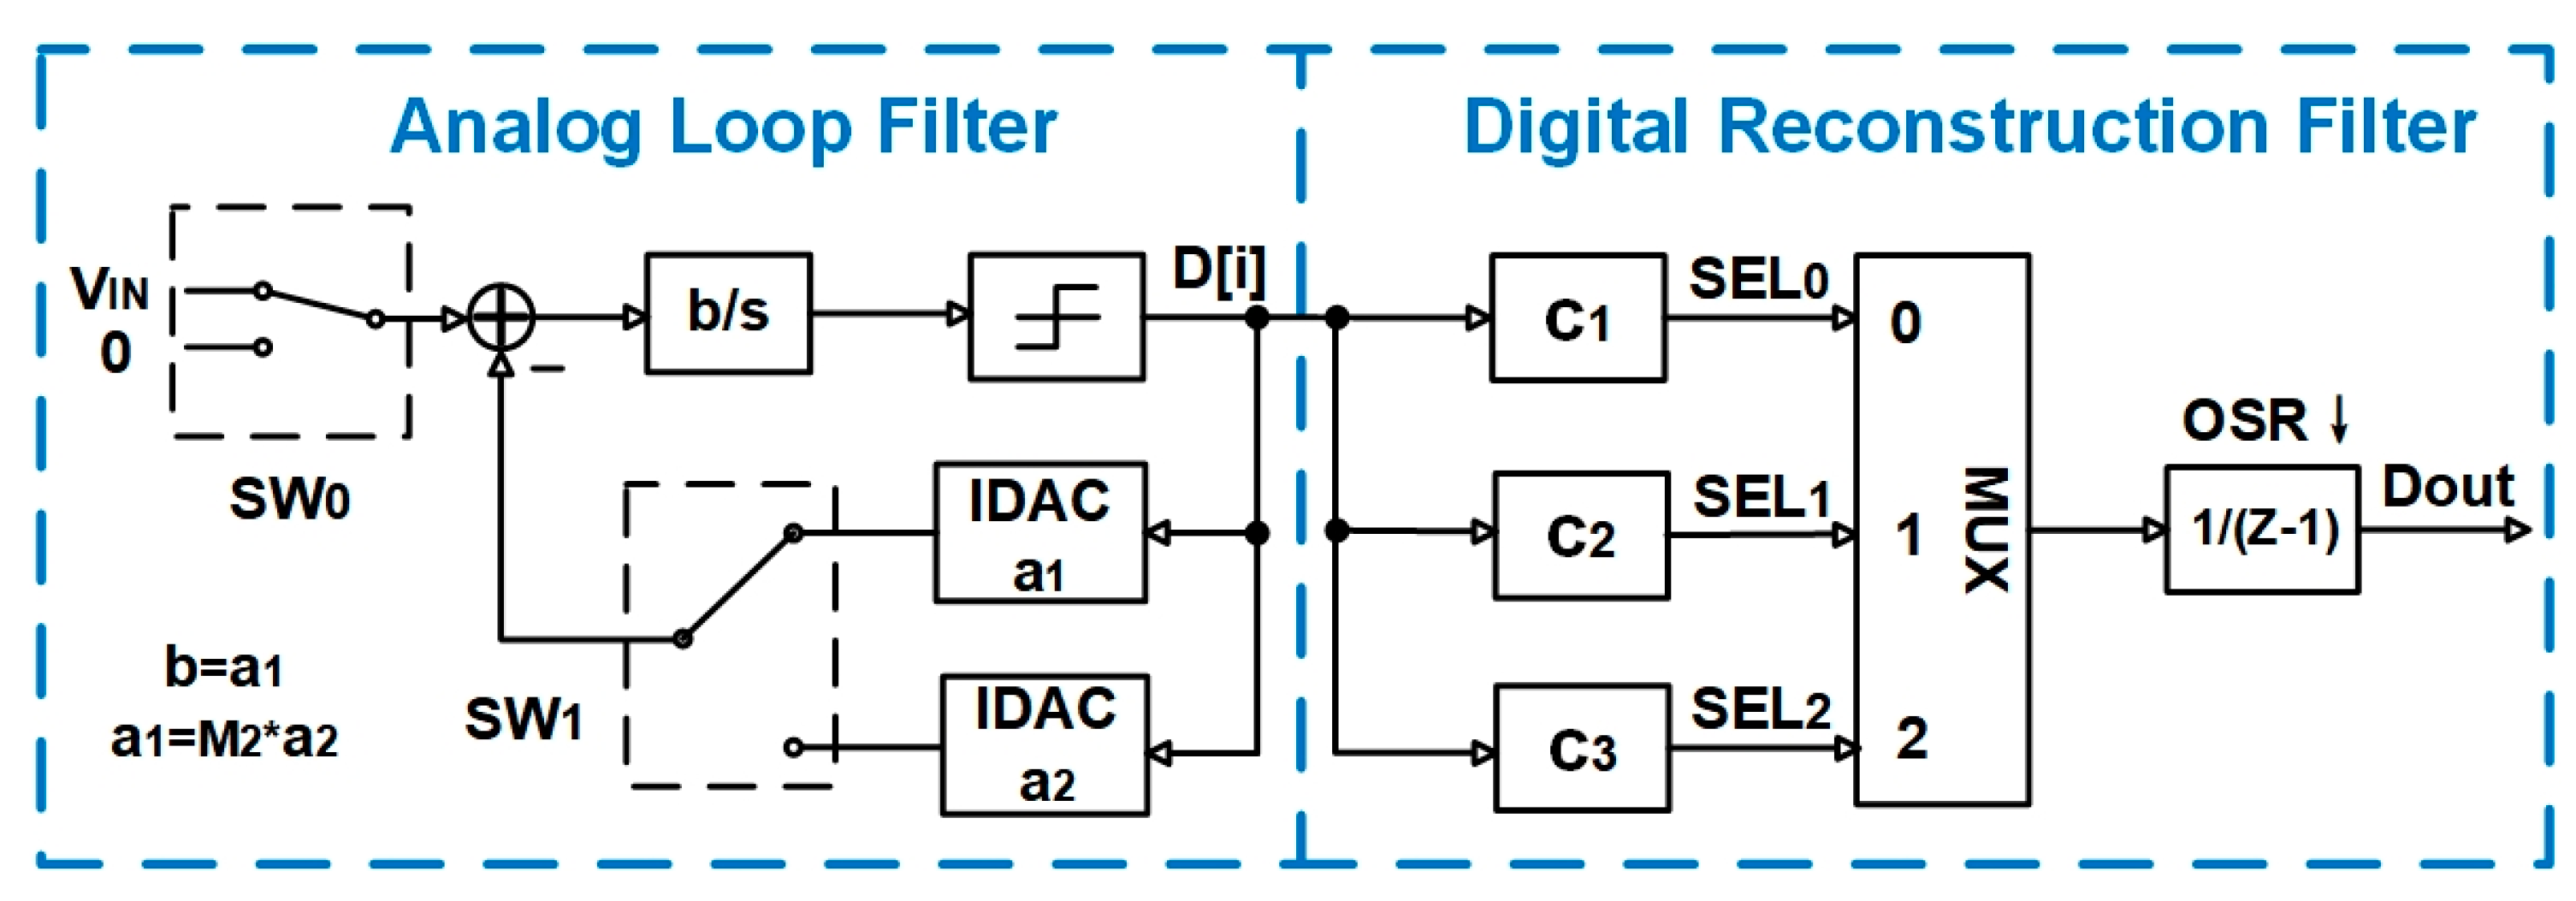
The system architecture adopted in this article is similar to the architecture proposed in reference [29]; both are two-step quantization incremental ADCs. The system diagram is shown in Figure 2. Each data conversion process is divided into three stages: resetting, coarse quantization, and fine quantization. In the 0th clock cycle, resetting is performed to clear the residual error from the previous data conversion cycle. From the 1st to the M1th clock cycle, coarse quantization is carried out. During this stage, the input signal V i n and the feedback digital-to-analog converter (DAC, with DAC coefficient a1) complete M1-1 periods of integration separately. The result of integration is stored in the integrator, and then fine quantization is carried out. During the fine quantization stage, the input signal V i n is set to 0, and only the feedback DAC (with reduced DAC coefficient a2) is used to quantize the error from the previous stage. This stage lasts from the (M1 + 1)th cycle to the (M1 + M2 − 1)th cycle. Finally, the comparison result at the rising edge of the (M1 + M2)th cycle is placed in the lowest bit of the output result, improving the precision by one bit. The control waveforms at key nodes in this process are shown in Figure 3. The waveform of the node voltage on the integrator during one data conversion process is shown in Figure 4. In this case, Vref represents the voltage value generated by the DAC current on the integrator capacitor during one clock cycle T when the input Vin is 0 and the DAC coefficient is a1.
We perform a mathematical analysis in the time domain of the data conversion process of the above-mentioned ADC. Assume the oversampling rate is high enough so that the input signal Vin can be considered constant within one conversion period. Assume that the clock period T = 1; , the result of the integrator in the analog loop after the coarse quantization stage is
V r e f ( M 1 1 ) V i n i = 2 M 1 D ( i ) V r e f V r e f
Similarly, after the fine quantization stage, the result of the integrator in the loop filter is
V r e f M 2 ( M 1 1 ) V i n i = 2 M 1 D ( i ) V r e f i = M 1 + 1 M 1 + M 2 1 D ( i ) V r e f M 2 V r e f M 2
Place the comparison result of the (M1 + M2)th rising edge of the clock at the least significant bit of the output of the digital reconfigurable filter, and then the result of the integrator can be equivalently represented as
V r e f 2 M 2 ( M 1 1 ) V i n i = 2 M 1 D ( i ) V r e f i = M 1 + 1 M 1 + M 2 1 D ( i ) V r e f M 2 D ( M 1 + M 2 ) V r e f 2 M 2 V r e f 2 M 2
After a data transformation cycle, the quantization error can be represented as
V r e f 2 M 2 ( M 1 1 ) V i n V ^ i n V r e f 2 M 2 ( M 1 1 )
where V ^ i n represents the estimate of input signal V i n , and the expression of V ^ i n is
V ^ i n = i = 2 M 1 D ( i ) V r e f M 1 1 + i = M 1 + 1 M 1 + M 2 1 D ( i ) V r e f M 2 ( M 1 1 ) + D ( M 1 + M 2 ) V r e f 2 M 2 ( M 1 1 )
where D ( i ) represents the comparison result of the comparator when the rising edge of the i-th clock arrives. As shown in Figure 2, these comparison results can be summed according to the corresponding weighting coefficients c1, c2, and c3 to obtain the data output Dout. According to Equation (5), we find that c1 = M2 × c2 = 2 M2 × c3.
From Equation (4), it can be seen that the lowest bit of ADC is V l s b = V r e f / ( 2 M 2 M 1 1 ) . Therefore, when the input signal is V i n , after one conversion, the achievable effective number of bits (ENOB) is
E N O B = log 2 2 V i n V l s b = l o g 2 ( V i n V r e f ) + l o g 2 ( M 1 1 ) + l o g 2 ( M 2 ) + 1
In fact, in the above-mentioned time domain analysis, we assume that the input signal V i n is a DC quantity that does not vary with time. In reality, the input signal V i n is a function of time, so within M1 − 1 clock periods, the integral of the input signal V i n does not simply equal (M1 − 1)T V i n , but, rather, the result of integrating V i n with respect to time, which depends on the frequency of V i n . We assume V i n is a complex exponential signal with an amplitude of A, a frequency of w, and an initial phase of φ. The result of the integration over a time duration of (M1 − 1)T is
0 ( M 1 1 ) T A e j ( w t + φ ) d t = e j ( w ( M 1 1 2 ) T + φ ) 2 A s i n ( w ( M 1 1 2 ) T ) w
We focus on its magnitude transfer function and normalize it. The normalization standard is as shown in Equation (1). Assuming that V i n is a DC signal, with a signal magnitude of A and integrated over a time length of (M1 − 1)T, the result of the integration is (M1 − 1)TA. After normalization, the magnitude transfer function is obtained as
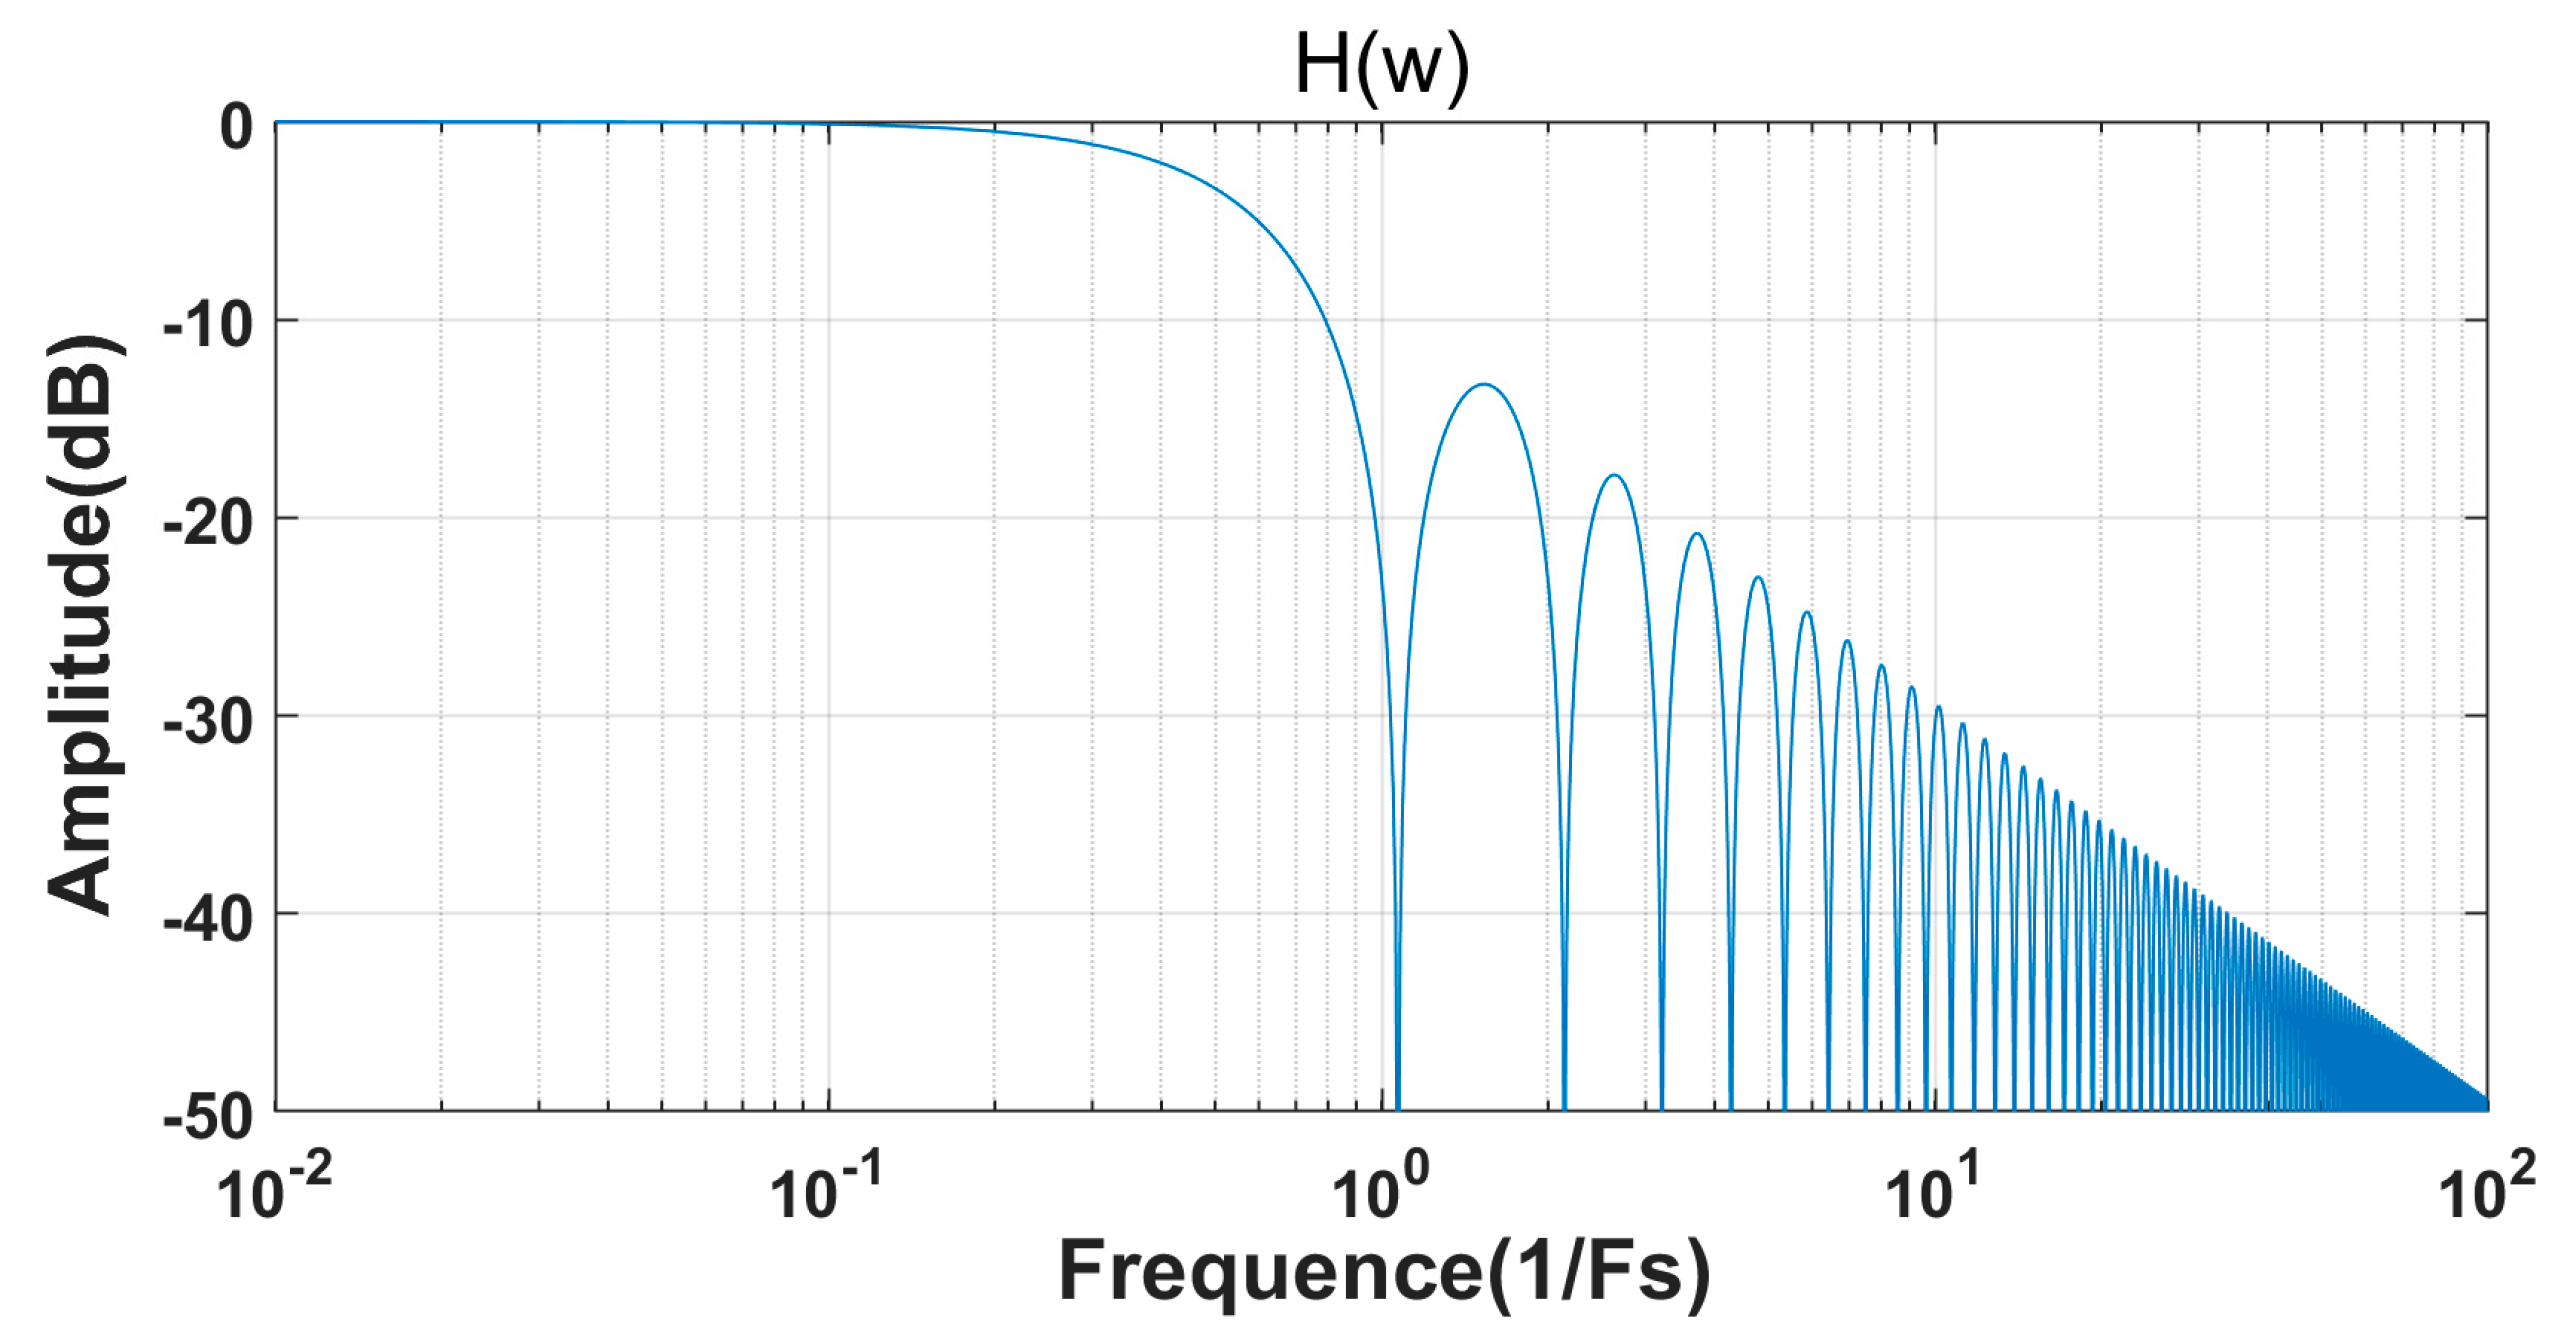
H ( w ) = 2 s i n ( w ( M 1 1 2 ) T ) w ( M 1 1 ) T
The magnitude of H ( w ) varies with frequency as shown in Figure 5, where the frequency is normalized. Here, Fs represents the data output rate of the ADC. Since it is an incremental ADC, it belongs to the Nyquist ADC, with a data output rate that is twice the Nyquist frequency. It is noted that due to the use of a two-step quantization operation, in a complete conversion of M1 + M2 clock cycles, the input signal is active for M1 − 1 clock cycles. This causes the zeros of H ( w ) due to input signal integration not to occur at integer multiples of Fs, but rather at n(M1 + M2)/(M1 − 1)Fs, where n is a positive integer.
Overall, the down-sampling process of the two-step incremental ADC can be completed by summing the results of different quantization stages’ comparators together according to the corresponding weights c1, c2, and c3. Compared with traditional ΔΣ ADC, the down-sampling filter design of this structure is simpler. Additionally, compared with the traditional first-order incremental ADC [28], this structure can reduce the oversampling ratio, which is lower by M1M2/(M1 + M2) times. In this design, M1 = 128 and M2 = 8 are chosen. For a neural signal bandwidth of 10 kHz, the oversampling ratio is M1 + M2 = 136, the clock frequency Fclk is 2.72 MHz, and the ADC’s quantization bit number is 11 bits, which is sufficient to meet the requirements for neural recording.

3. Circuit Implementation

3.1. Circuit Implementation of the ADC

The schematic of the proposed ADC is shown in Figure 6. The entire ADC consists of a front-end high-pass filter, a transconductance–capacitance (Gm-C) integrator, a single-bit current DAC, a dynamic comparator, internal logic control circuitry, and the digital reconstruction filter. These modules are described separately below.

3.2. Design of Analog Front End

As shown in Figure 6, at the input of the ADC, a high-pass filter consisting of an input capacitor and pseudo-resistor is employed. The pseudo-resistor comprises a cut-off thick-oxide PMOS transistor, which achieves a resistance of TΩ. In combination with the input capacitor of 5 pF, the 3 dB cutoff frequency of the high-pass filter is lower than 0.1 Hz, which eliminates EDO without affecting the recording of neural signals.
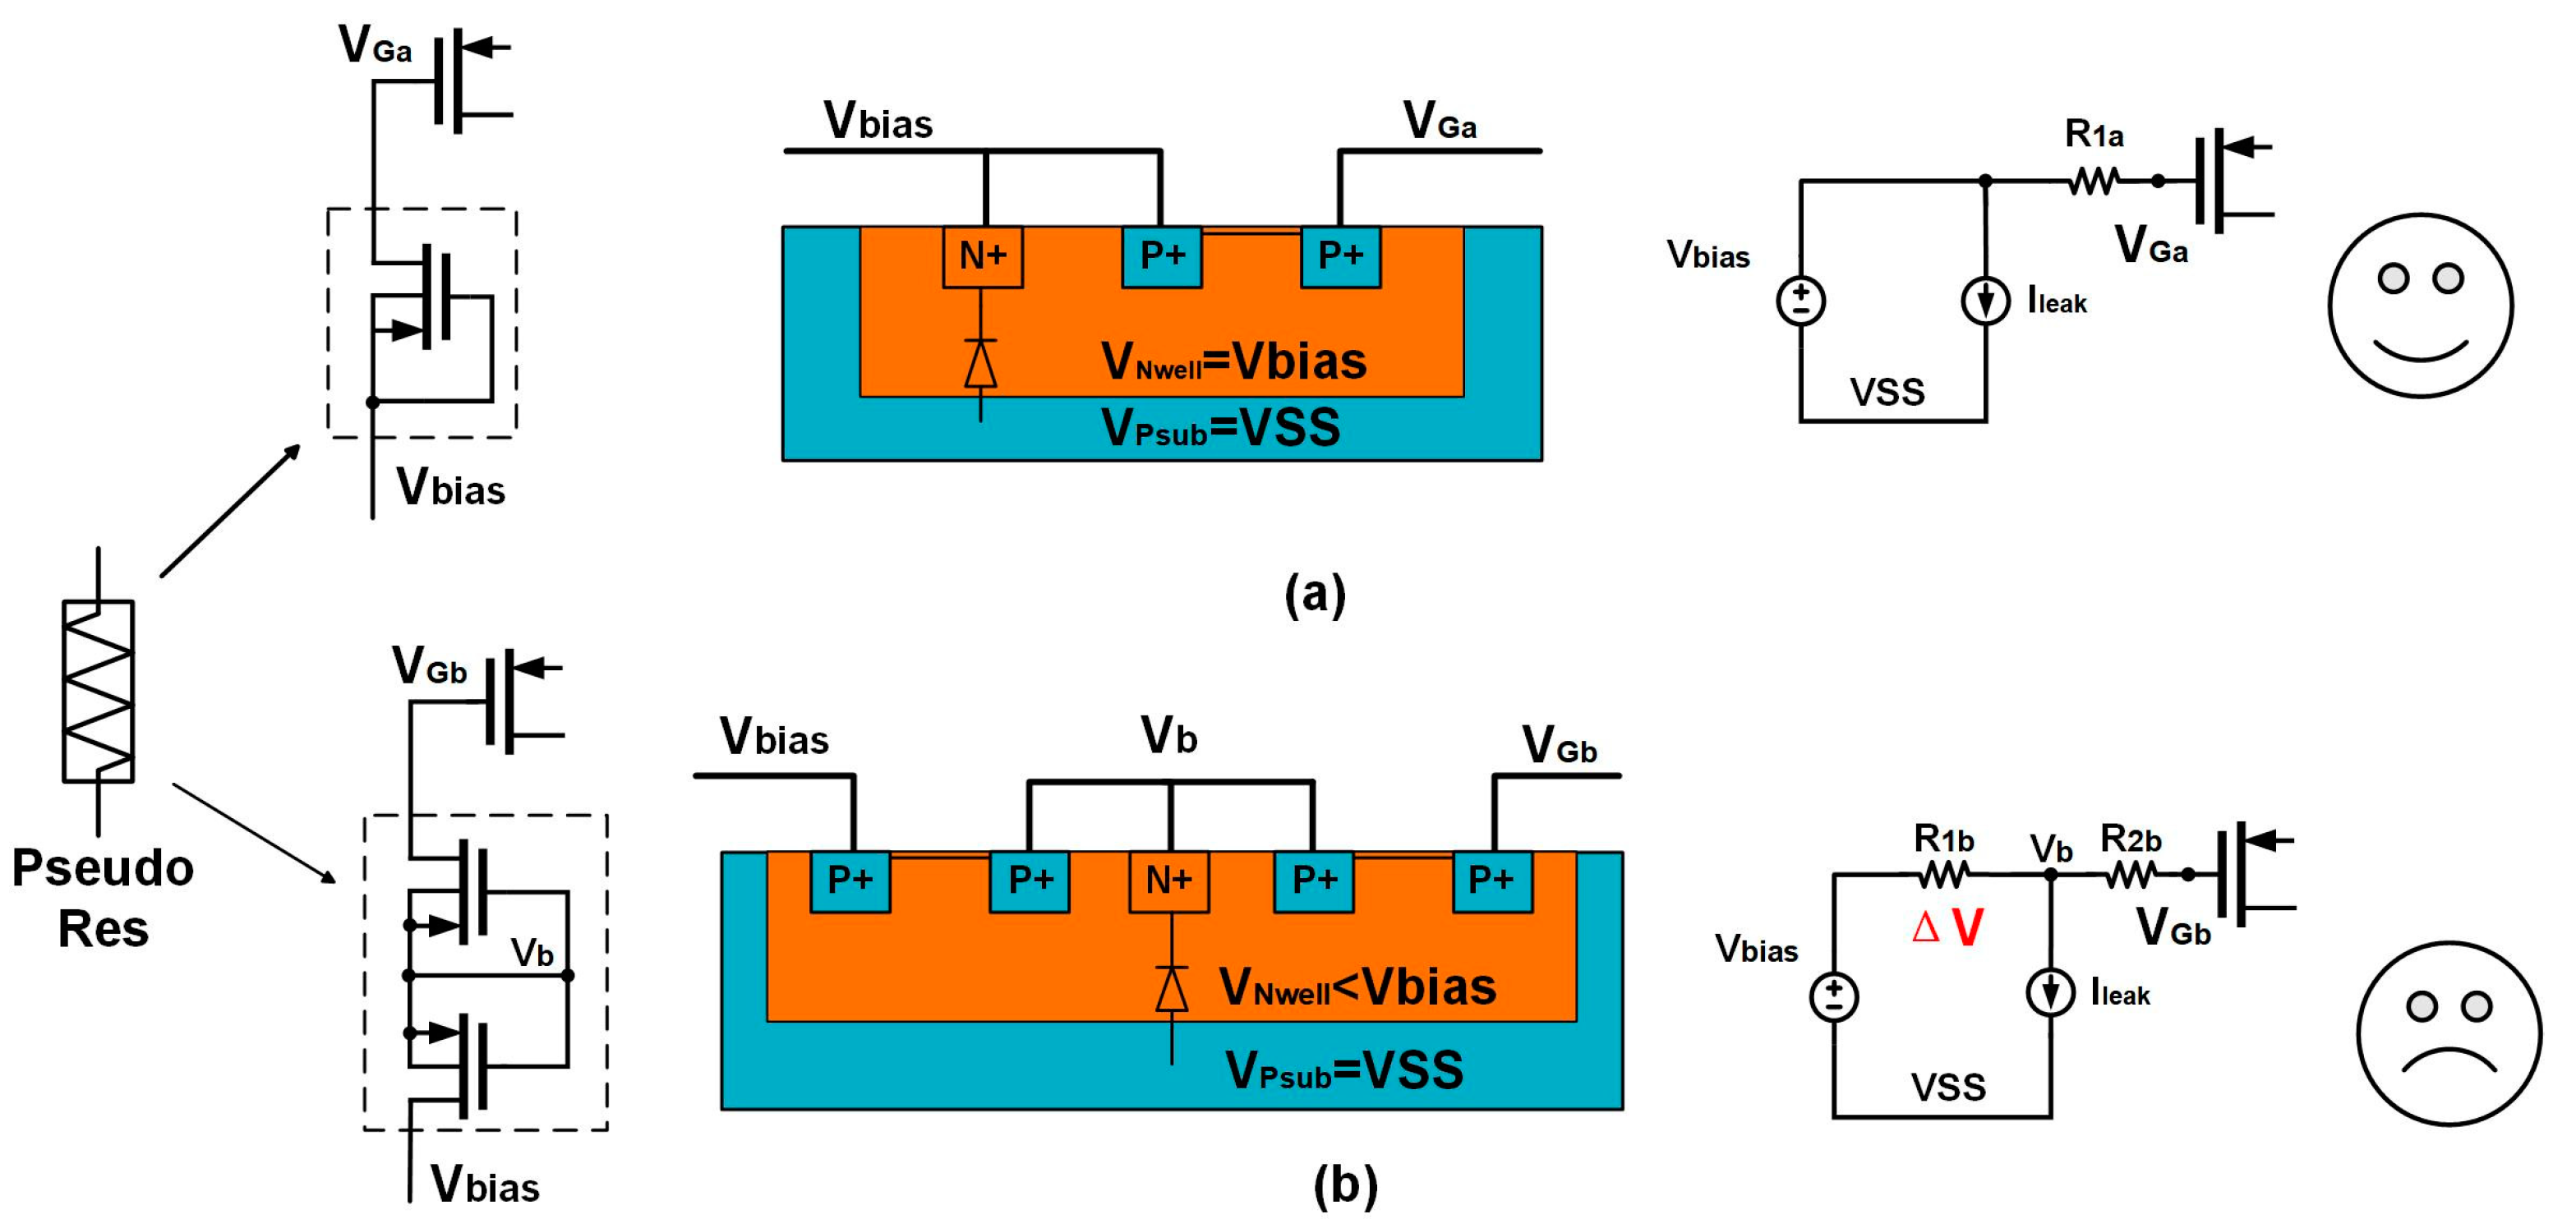
The selection of the pseudo-resistor structure is very important for the implementation of the proposed ADC. As shown in Figure 7, two different structures of a pseudo-resistor are given, and we chose the structure in Figure 7a and explain why the structure in Figure 7b is not suitable. Using thick-oxide PMOS transistors to form pseudo-resistors, considering that the value of the pseudo-resistor is in the TΩ level and the current flowing through the equivalent resistor is in the pA level, the leakage current of the parasitic diode between Nwell and Psub must be considered. When using the structure in Figure 7a, the bias voltage Vbias is used to provide the reverse leakage current Ileak. Assuming that there is no leakage current at the gate of input PMOS transistor, it can be equivalent to an open circuit, so the voltage on R1a is 0. The voltage at the gate of the input transistor VGa = Vbias. On the contrary, when the structure in Figure 7b is used, as two PMOS transistors are cascaded and their Nwell are connected, the potential of Nwell Vb is a floating potential. Due to the presence of Ileak of the parasitic diode, a voltage ΔV is generated across the equivalent resistor R1b of one of the PMOS transistors, causing the voltage of Nwell in Figure 7b to be Vb = Vbias − ΔV. Similarly, assuming the gate terminal of the input PMOS transistor can be equivalent to an open circuit, there is no current flowing through R2b, so we can obtain VGb = Vb = Vbias − ΔV. ΔV can be simply regarded as the voltage generated by the Ileak flow on R1b, and since Ileak varies with temperature and light conditions [33], ΔV also varies. Since the proposed ADC has an open-loop architecture with an input range of only around 20 mVpp, this variation in ΔV will directly affect the input range of the ADC, causing the ADC to not function properly. Similar architectures of pseudo-resistors can be analyzed using the method proposed in this paper.
Due to the elimination of EDO, the input of the integrator only processes weak neural signals, reducing the requirement for the linearity of the integrator. Therefore, a Gm-C integrator was adopted. The schematic of the operational transconductance amplifier (OTA) is shown in Figure 8a. Thick-oxide PMOS transistors are used as inputs, and four input transistors are connected through two sets of switches controlled by SW0 and SW0N to realize the normal connection or short-circuit connection of signals [29]. In the coarse quantization stage, only the Chop_N switches are turned on with an operating frequency of 340 kHz, modulating the 1/f noise of the load NMOS transistors to a high frequency. In the fine quantization stage, both the Chop_N and Chop_P switches are turned on with an operating frequency of 2.72 MHz. The purpose is to prevent errors introduced by the mismatch of the input PMOS transistors and load NMOS transistors during the fine quantization stage. Notice that chopping only reduces the 1/f noise of the load NMOS transistors. For the input PMOS transistors, we reduce the impact of 1/f noise by appropriately increasing the size. The gate terminals of the NMOS load transistors are connected in an alternating pattern to output Von and Vop as a common-mode feedback (CMFB) loop. The current DAC feedback to IFBP or IFBN. During each clock cycle, only IFBP or IFBN is connected. The integrating capacitor has a value of about 400 fF, which allows the output voltage to change within a suitable range.
The single-bit current DAC is shown in Figure 8b. The current DAC selectively connects to IFBN or IFBP based on the comparison results labeled as FBP and FBN. SW1 controls the magnitude of the DAC current connected to the integrator. When SW1 is 0, it is in the coarse quantization stage, and when SW1 is 1, it is in the fine quantization stage. The ratio of the currents of the two stages is 8:1. Increasing the size of the DAC current source transistors can reduce mismatch and lower 1/f noise.
The RTI noise of the ADC is divided into two parts: one part is the quantization noise related to the bits of ADC, and the other part is the noise related to the circuit itself, including thermal noise, 1/f noise, etc.
First, consider the influence of quantization noise. The ADC in this design has 11 bits, and the theoretical SNR is 67.94 dB. The maximum input range of this design is VFS = 24 mVpp. Therefore, the quantization noise of the ADC is
v n , q = V F S 2 8 · 10 S N R
The equivalent quantization noise is 3.4 μV rms.
By allowing the circuit noise to dominate the RTI noise, a higher energy efficiency can be achieved. The expression for circuit noise equivalent to the input end is
V n 2 ¯ = 8 k T R p ( 1 + f f H P ) 2 + 8 k T γ g m , i n ( 1 + g m , n l g m , i n + g m , D A C 2 g m , i n ) + 2 K p C o x ( W L ) i n 1 f + K n C o x ( W L ) D A C ( g m , D A C g m , i n ) 2 1 f
In this case, k represents the Boltzmann constant, T represents the absolute temperature, γ is the coefficient in the expression, generally around 2/3, Kn and Kp are constants related to the process, fHP represents the cutoff frequency of the high-pass filter, fHP = 1/(2πCin∙RP), where Cin represents the input capacitance, and RP represents the pseudo-resistor. Adjusted RP around 1.5TΩ to ensure that the noise contribution from RP is below 20%. gm,in represents the transconductance of the OTA, gm,nl represents the transconductance of the load NMOS transistors of the OTA, and gm,DAC represents the transconductance of the DAC current source transistor. The input pairs are biased in weak inversion for a higher gm/id, while the load NMOS transistors and DAC current source transistors are biased in strong inversion to reduce their noise contribution. Since the current of the DAC is small, gm,in:gm,DAC > 10; therefore, the circuit noise contribution from the DAC can be ignored.
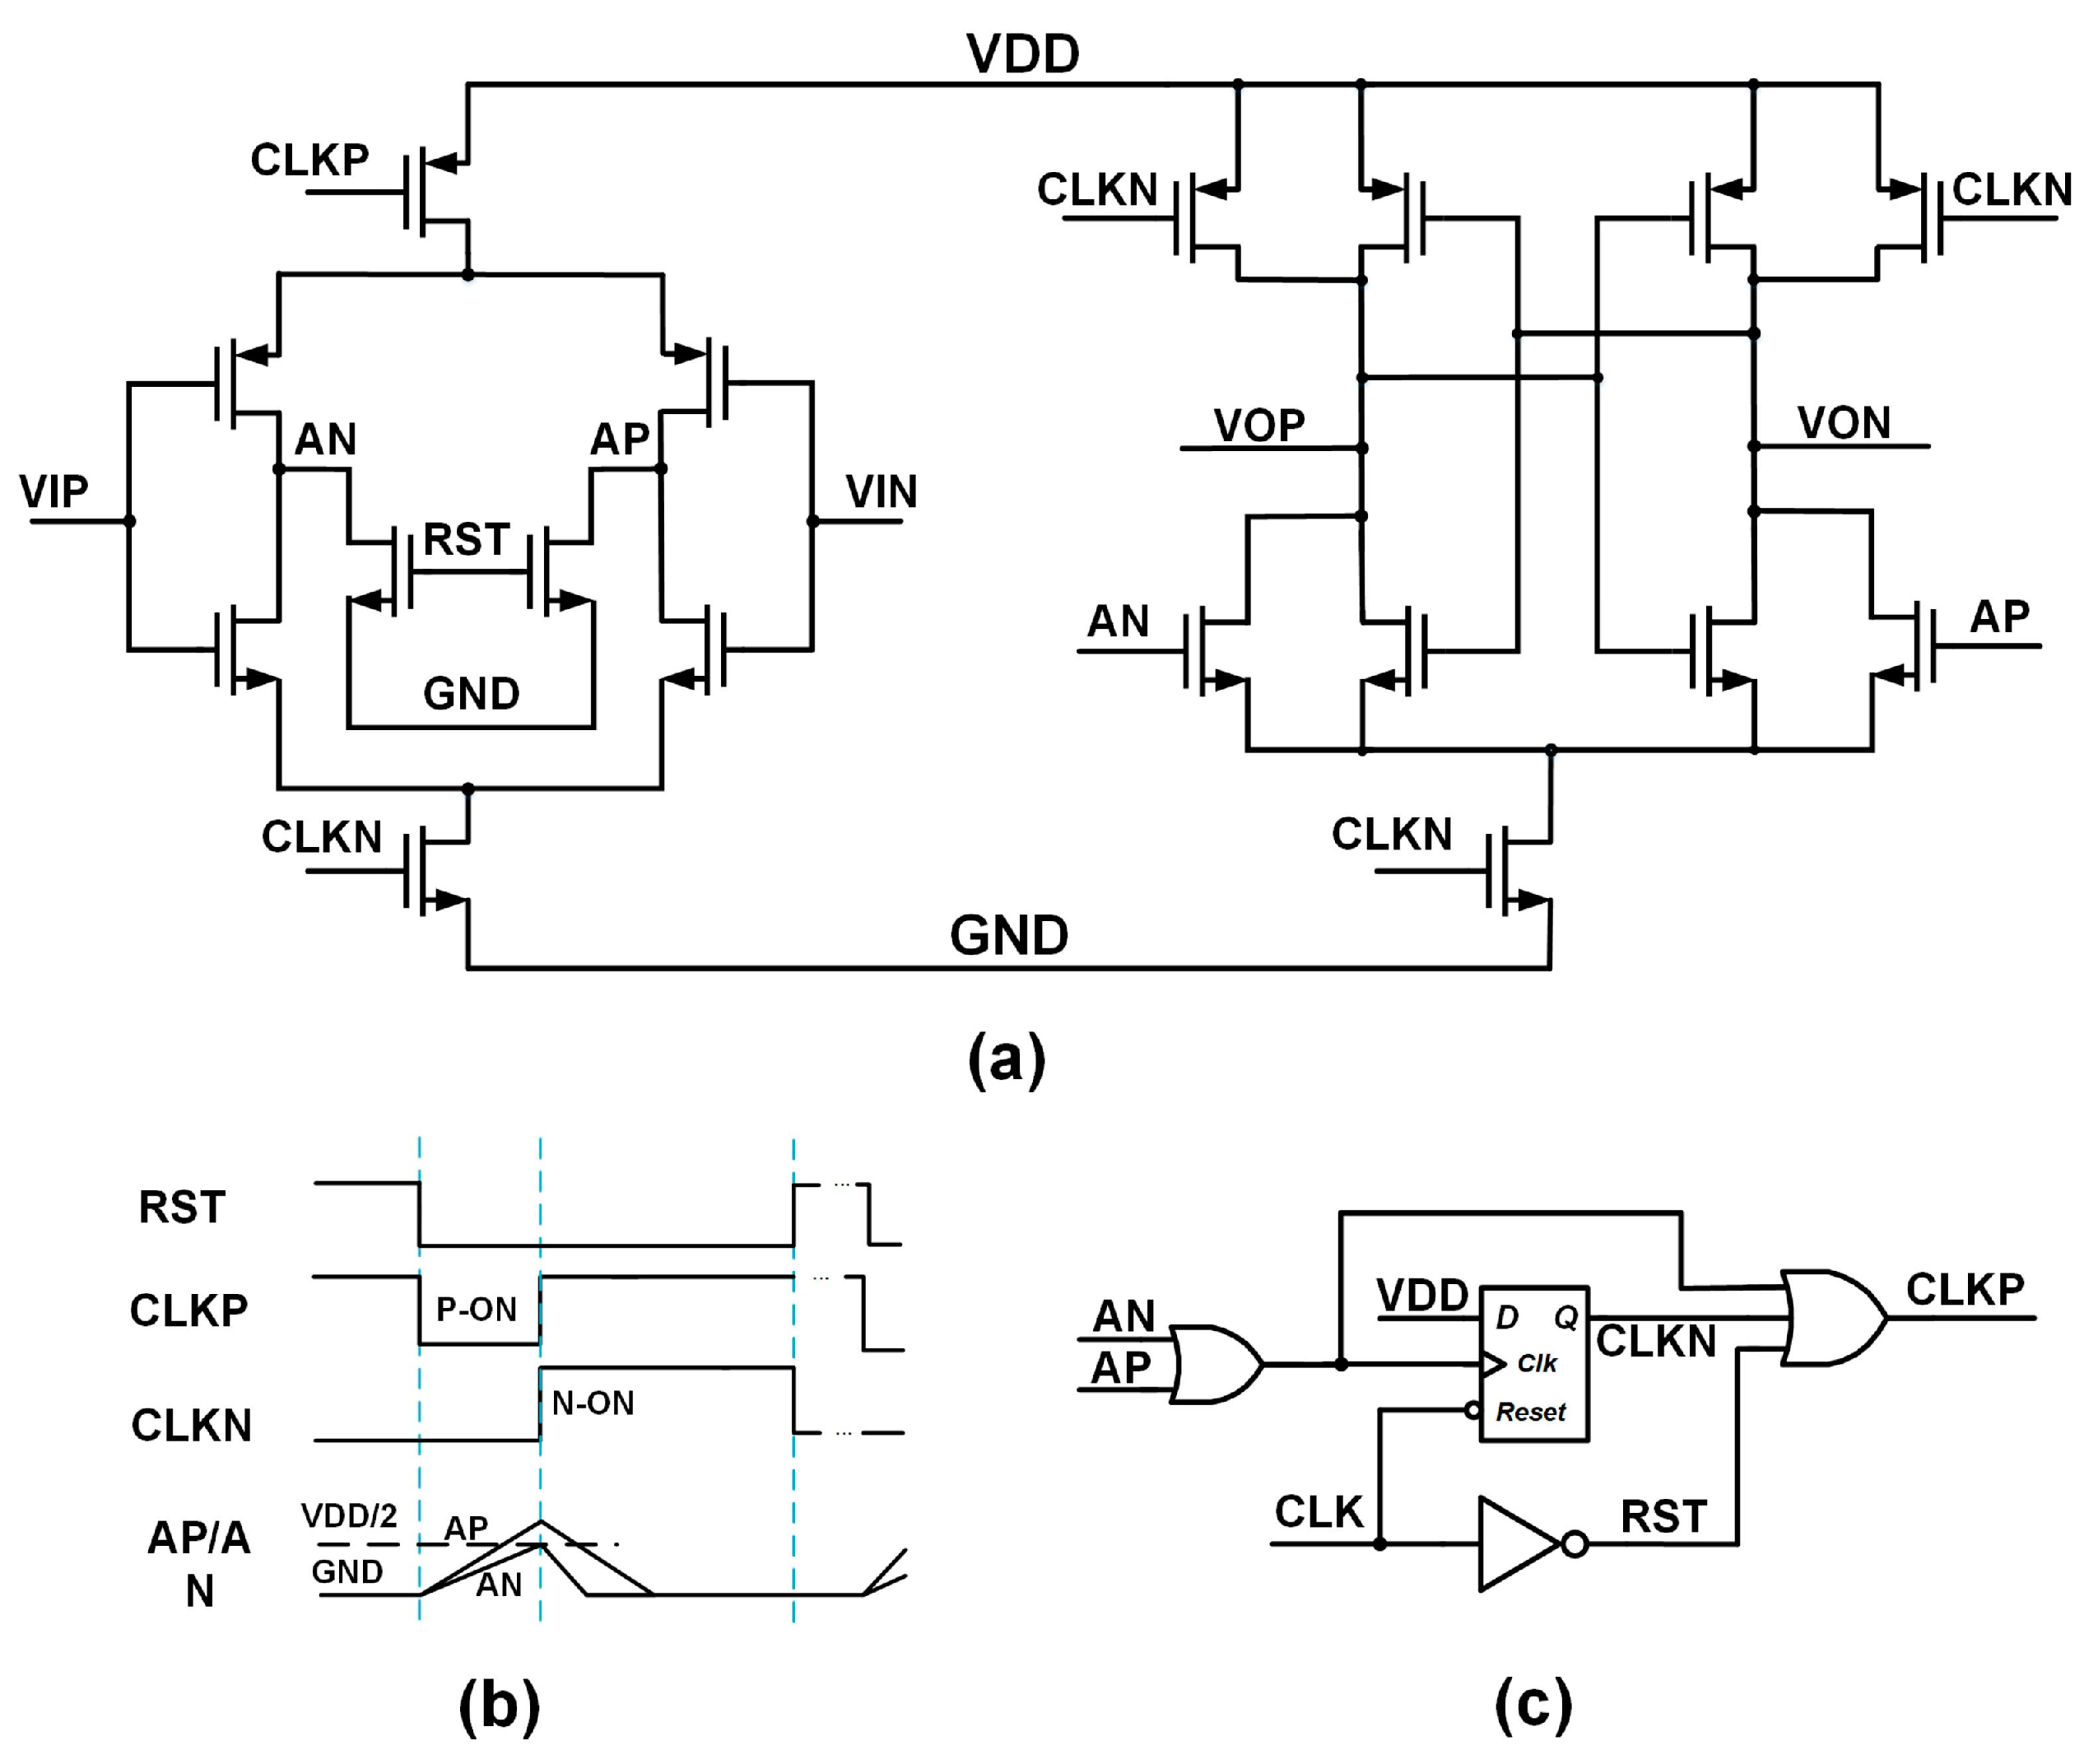
As shown in Figure 9a, the comparator used in this design adopts the structure from [34]. Figure 9b shows the control logic, and Figure 9c presents the circuitry for generating the corresponding control logic. Compared with traditional dynamic comparators, this comparator can save up to 33% of power [34].

3.3. Design of Digital Logic Control and Data Reconfiguration Circuits

The design of the digital logic control circuit is based on an 8-bit counter, using the asynchronous clear terminal of D flip-flops. Through logical operations, the timing sequence shown in Figure 3 is generated, and the specific circuit is shown in Figure 10. EN is the enable signal. The circuit starts to work when EN is high. CLK is the input clock with a frequency of 2.72 MHz.
According to Equation (5), it can be seen that when selecting M1 = 128 and M2 = 8, as shown in Figure 6, the data reconstruction circuit can be composed of a 7-bit up counter (used for summing the comparison results in the coarse quantization stage), a 3-bit up counter (used for summing the comparison results in the fine quantization stage), and an 11-bit result register. The 7-bit counter result is input to the high 7 bits of the result register, the 3-bit counter result is input to the 8th to 10th bits of the result register, and finally, the comparison result of the 136th clock rising edge of each conversion cycle is directly input to the lowest bit of the result register. The 11-bit result register is reset every 20 kHz, corresponding to twice the Nyquist frequency.

3.4. Design of Current Reference

The current reference circuit, as shown in Figure 11, is composed of transistors M1, M2, M3, and M4 and resistor R1. The startup circuit consists of transistors M5, M6, M7, and capacitor C1. The size (W/L) of M1 is 600 μm/2 μm, M2 is 60 μm/24 μm, and M3 and M4 are 8 μm/80 μm; and the value of R1 is about 75 kΩ. The reference current value is 2 μA.
As shown in Figure 11, the current DAC is generated by the reference current source. Considering that DAC is only added to one side of the circuit, the noise of the current reference will directly superimpose Gm through DAC. Assuming the transconductance of the input transistors is gm,in, the contribution of thermal noise of the current reference circuit to the input-referred noise V n , t is
V n , t = k T γ N 2 g m , i n 2 [ g m 1 ( 1 + g m 1 R 1 ) 2 + g m 1 2 R 1 γ ( 1 + g m 1 R 1 ) 2 + g m 2 + g m 3 + g m 4 ]
The contribution of the 1/f noise of the current reference circuit to the input-referred noise V n , f is
V n , f = 1 4 N 2 g m , i n 2 C o x [ K p g m 1 2 ( 1 + g m 1 R 1 ) 2 ( W L ) 1 + K p g m 2 2 ( W L ) 2 + K n g m 3 2 ( W L ) 3 + K n g m 4 2 ( W L ) 4 ]
Taking N = 10 here, the noise of the current reference is greatly attenuated, and it does not affect the input reference noise.

4. Manufacture and Measurement

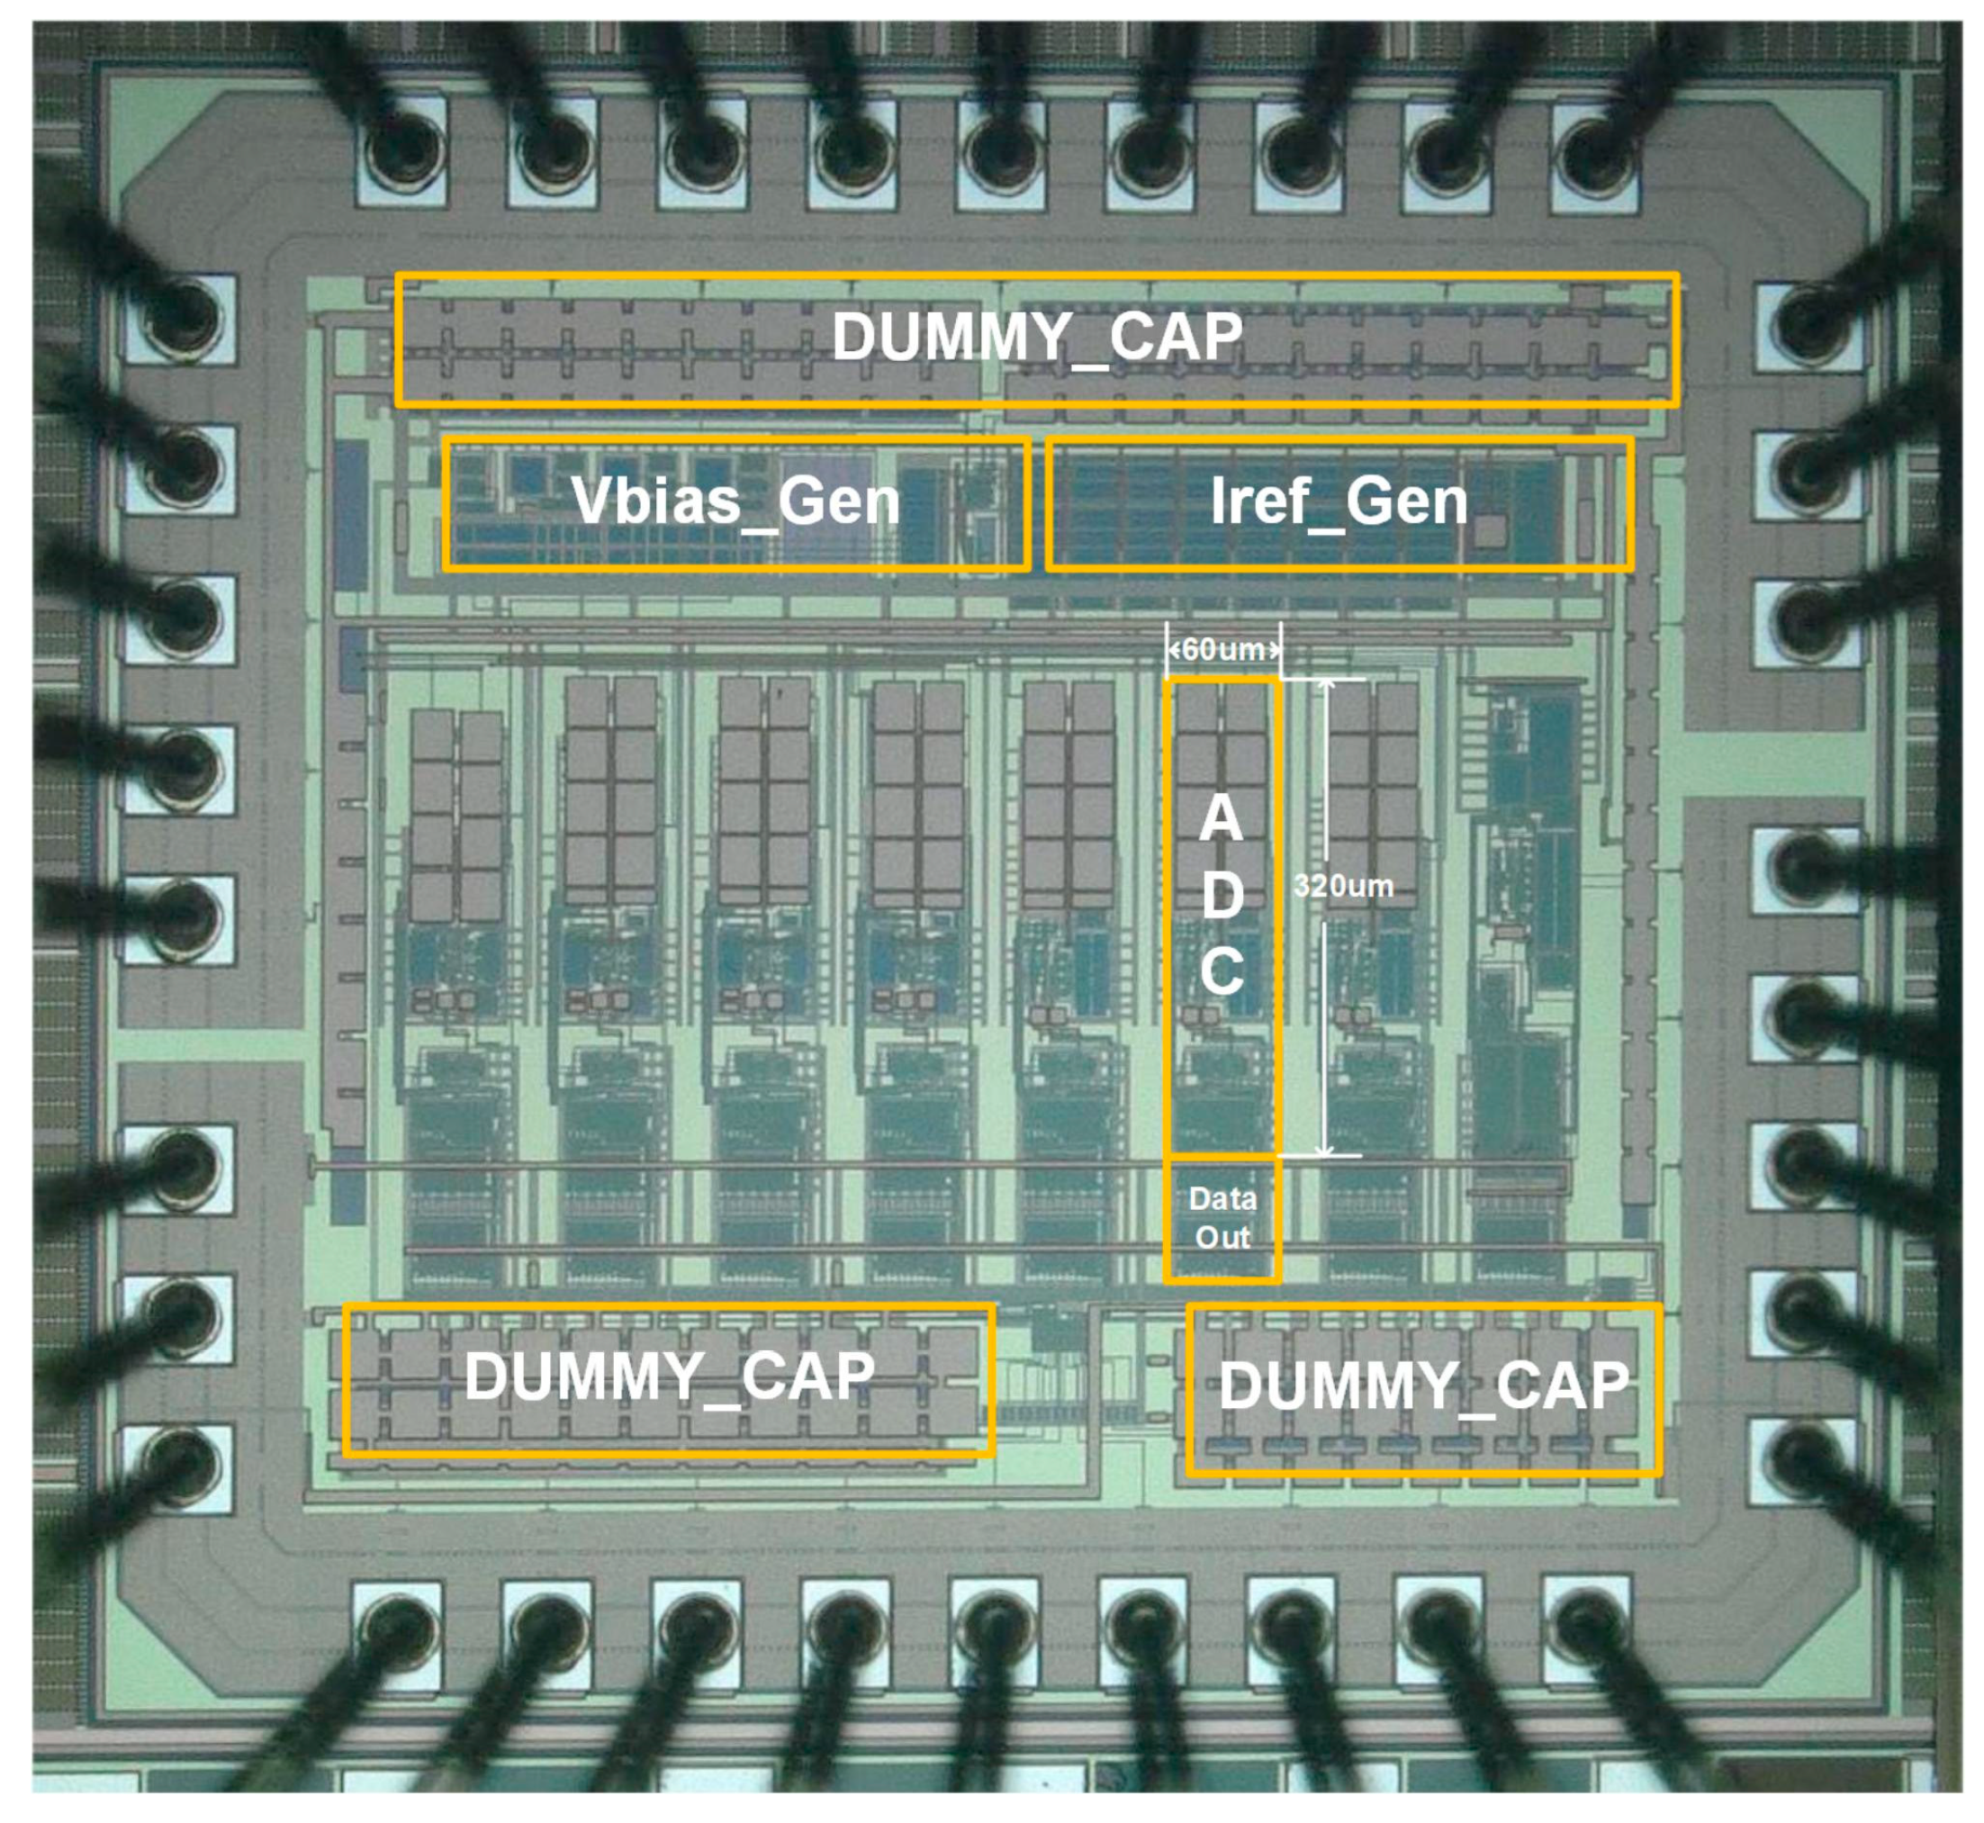
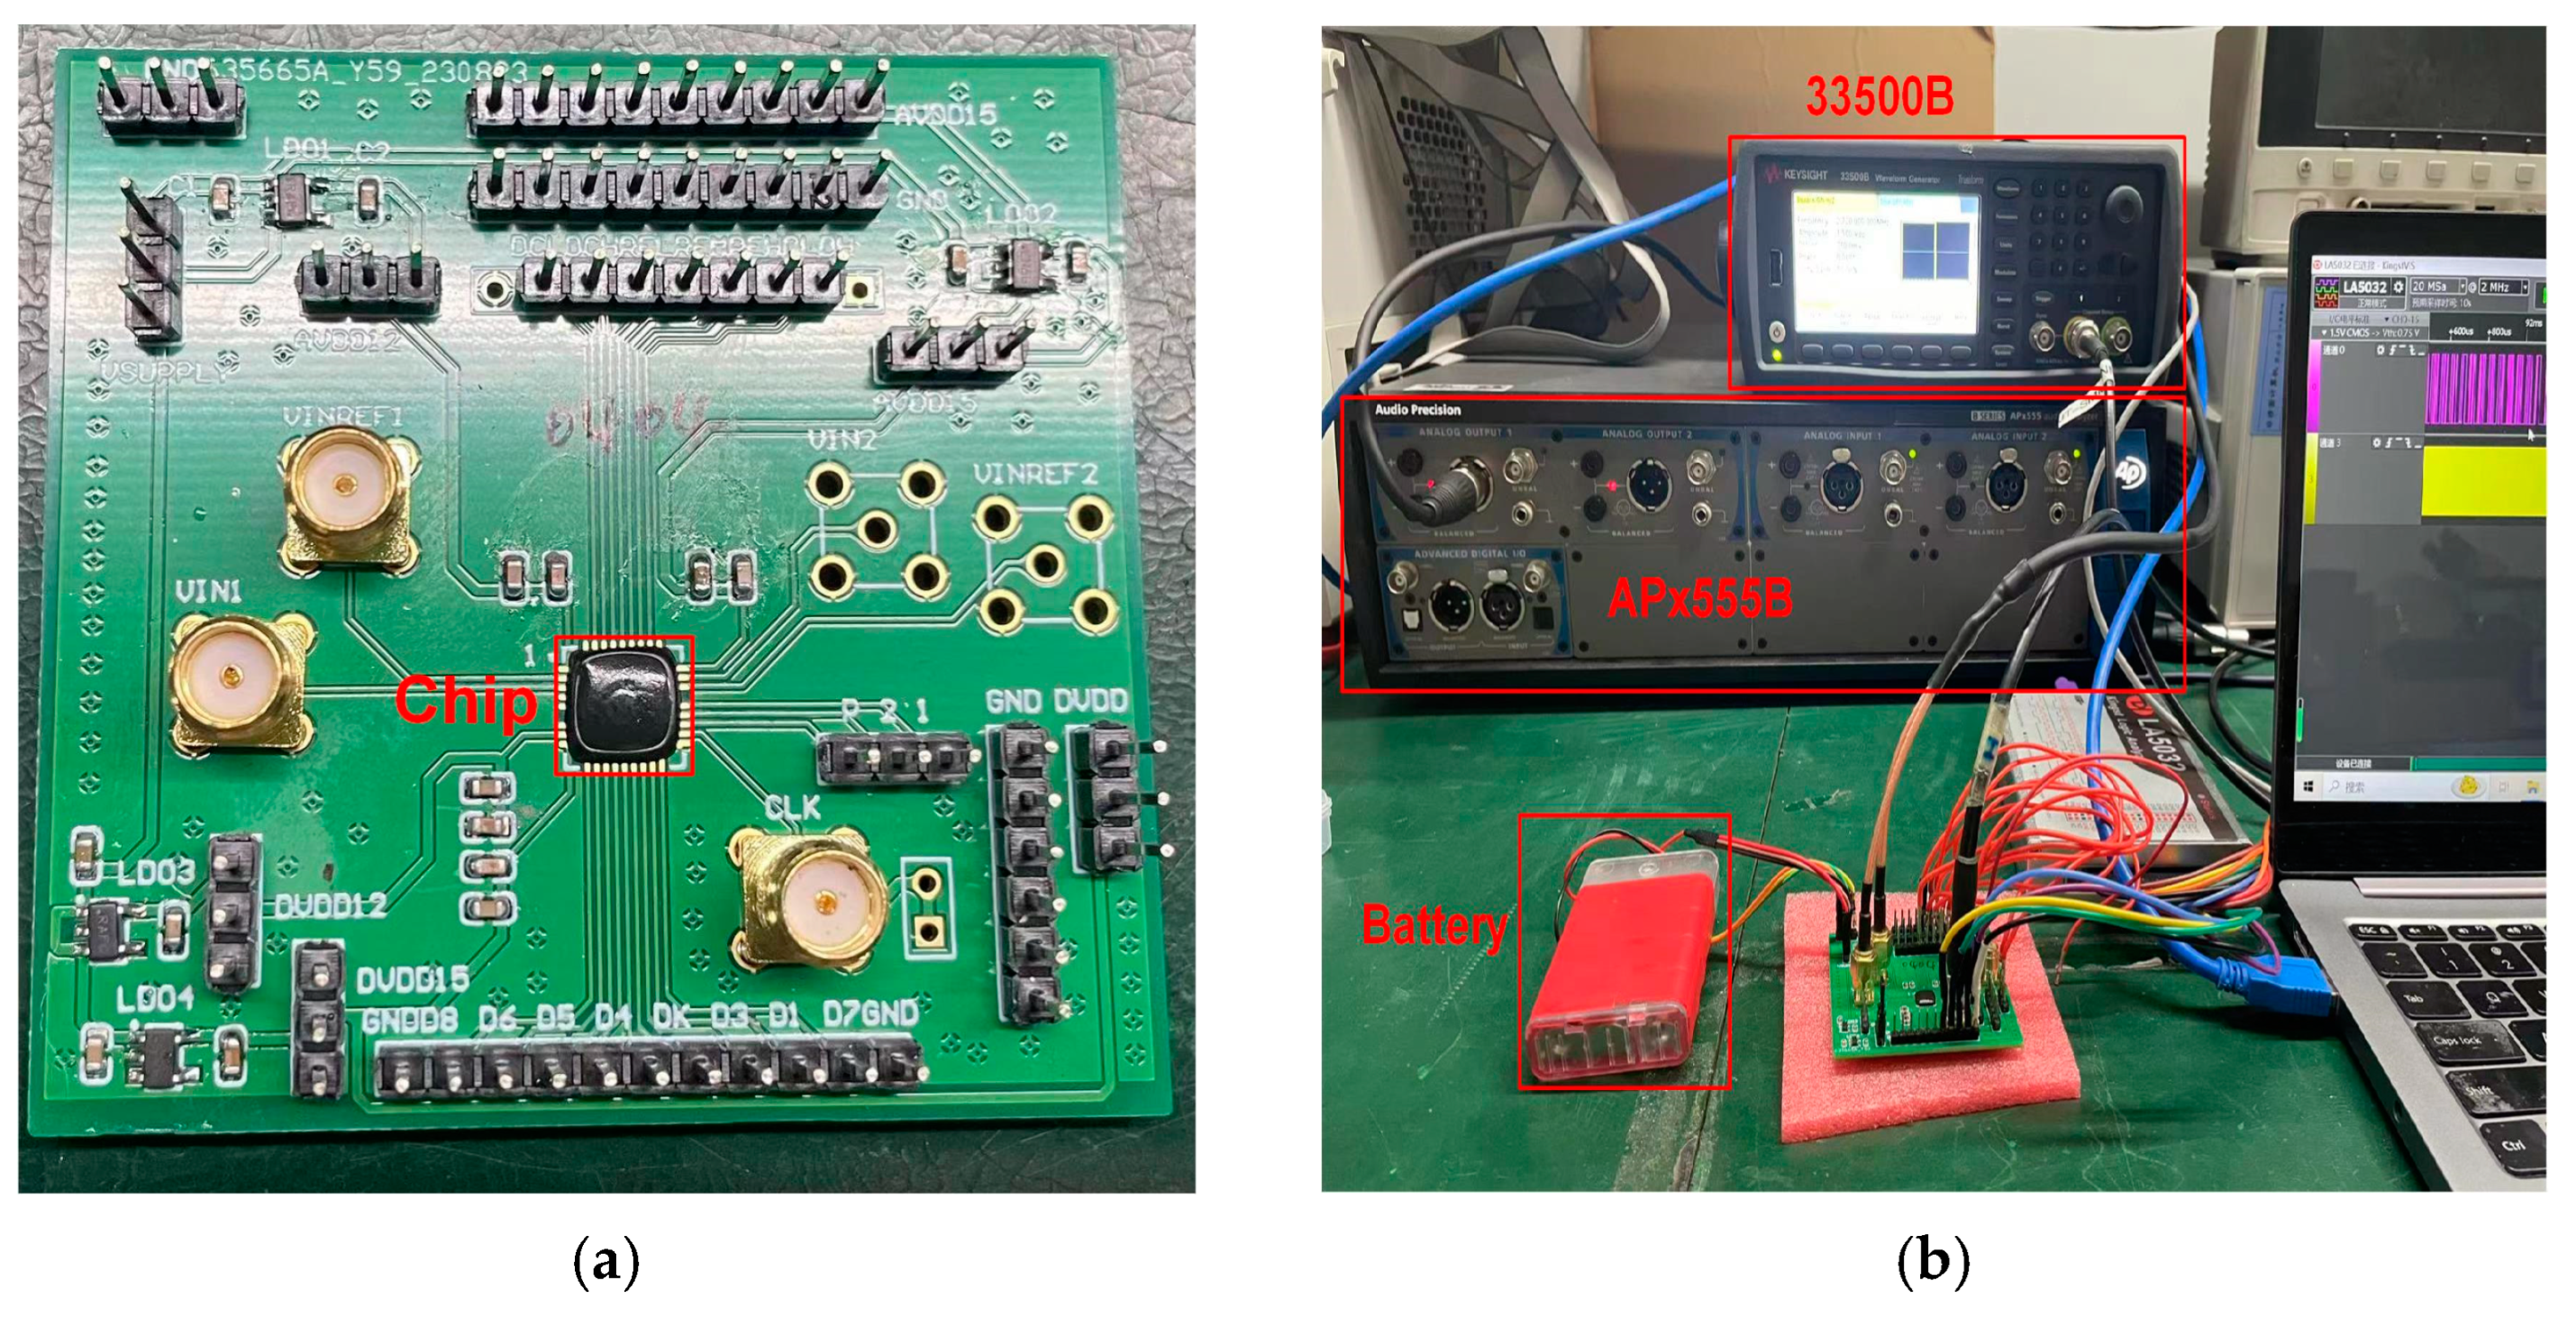
Manufactured using a 180 nm process, the die photo of the chip is shown in Figure 12. To validate different circuit architectures, we designed multiple versions. The ADC identified in Figure 12 corresponds to the one mentioned in this article. The area of the proposed ADC is 0.0192 mm2. To save the number of PADs, a parallel-to-serial conversion interface circuit was designed to enable a serial output of ADC data, as shown by “Data_Out” in Figure 12. The PCB for chip testing is shown in Figure 13a, and the testing equipment and environment are shown in Figure 13b. We used LDOs to supply the power for the chip, with the model being TI’s LP5907. The waveform generator 33500B from Keysight generates a 2.72 MHz clock square wave signal, and the APx555B Series High-Performance Audio Analyzer generates the input signal source for testing.
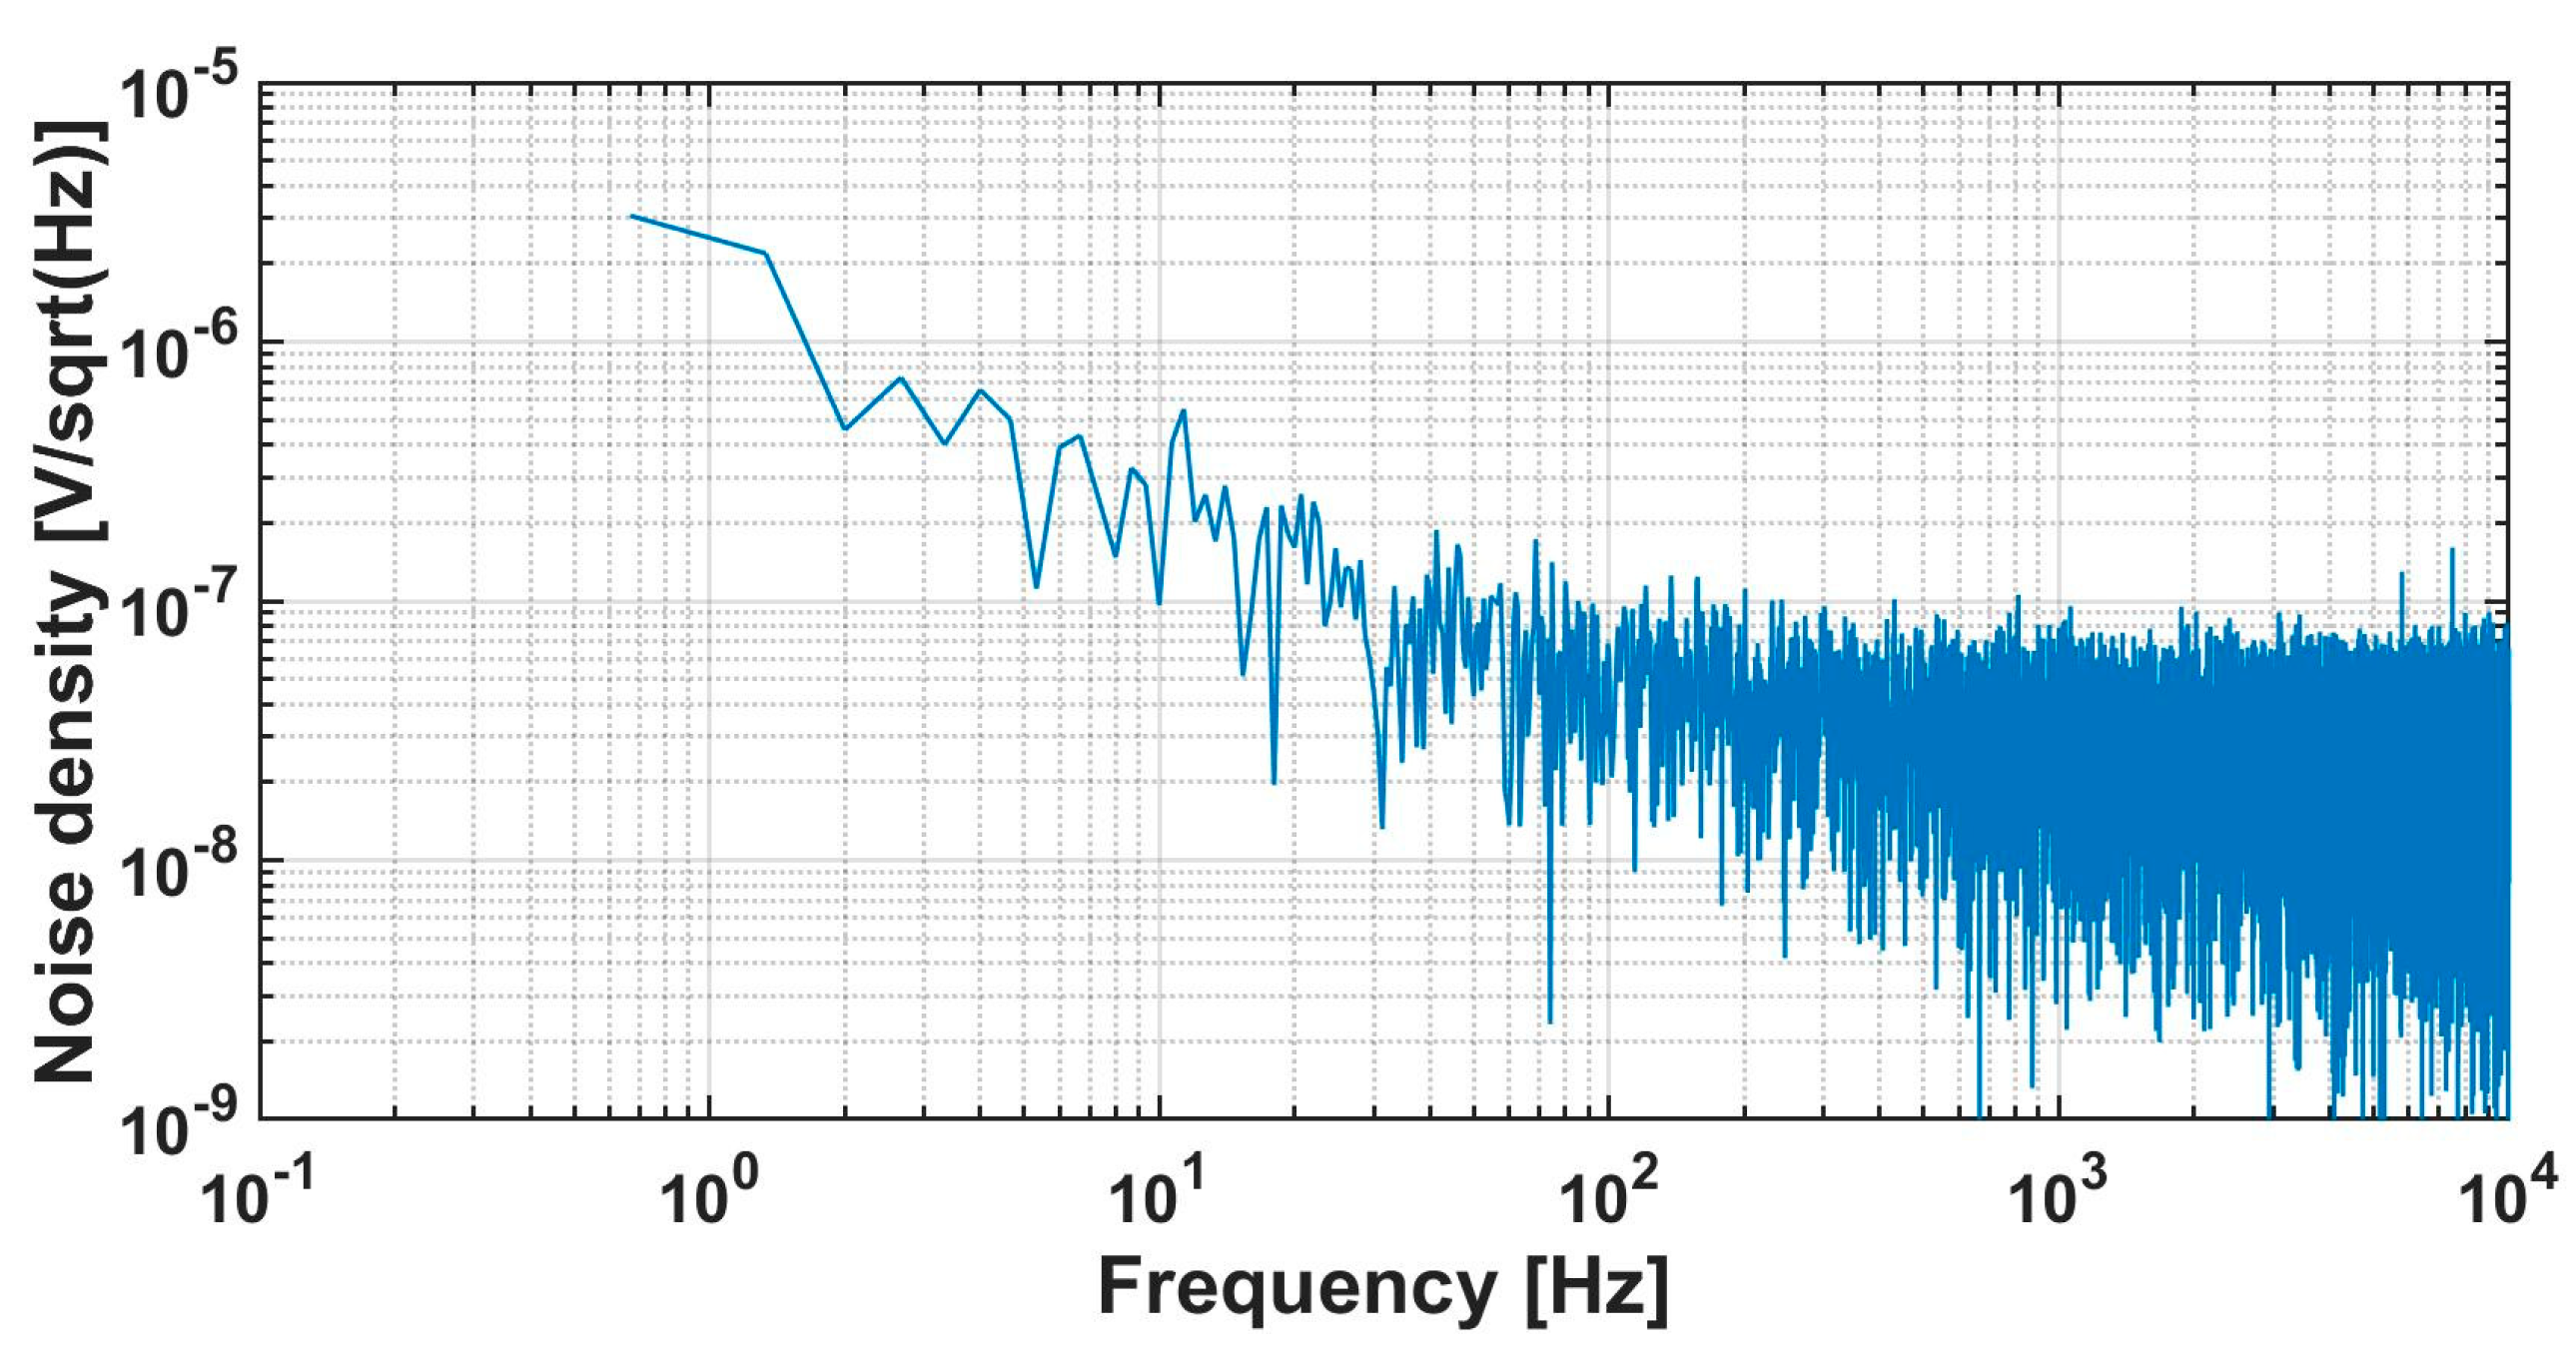
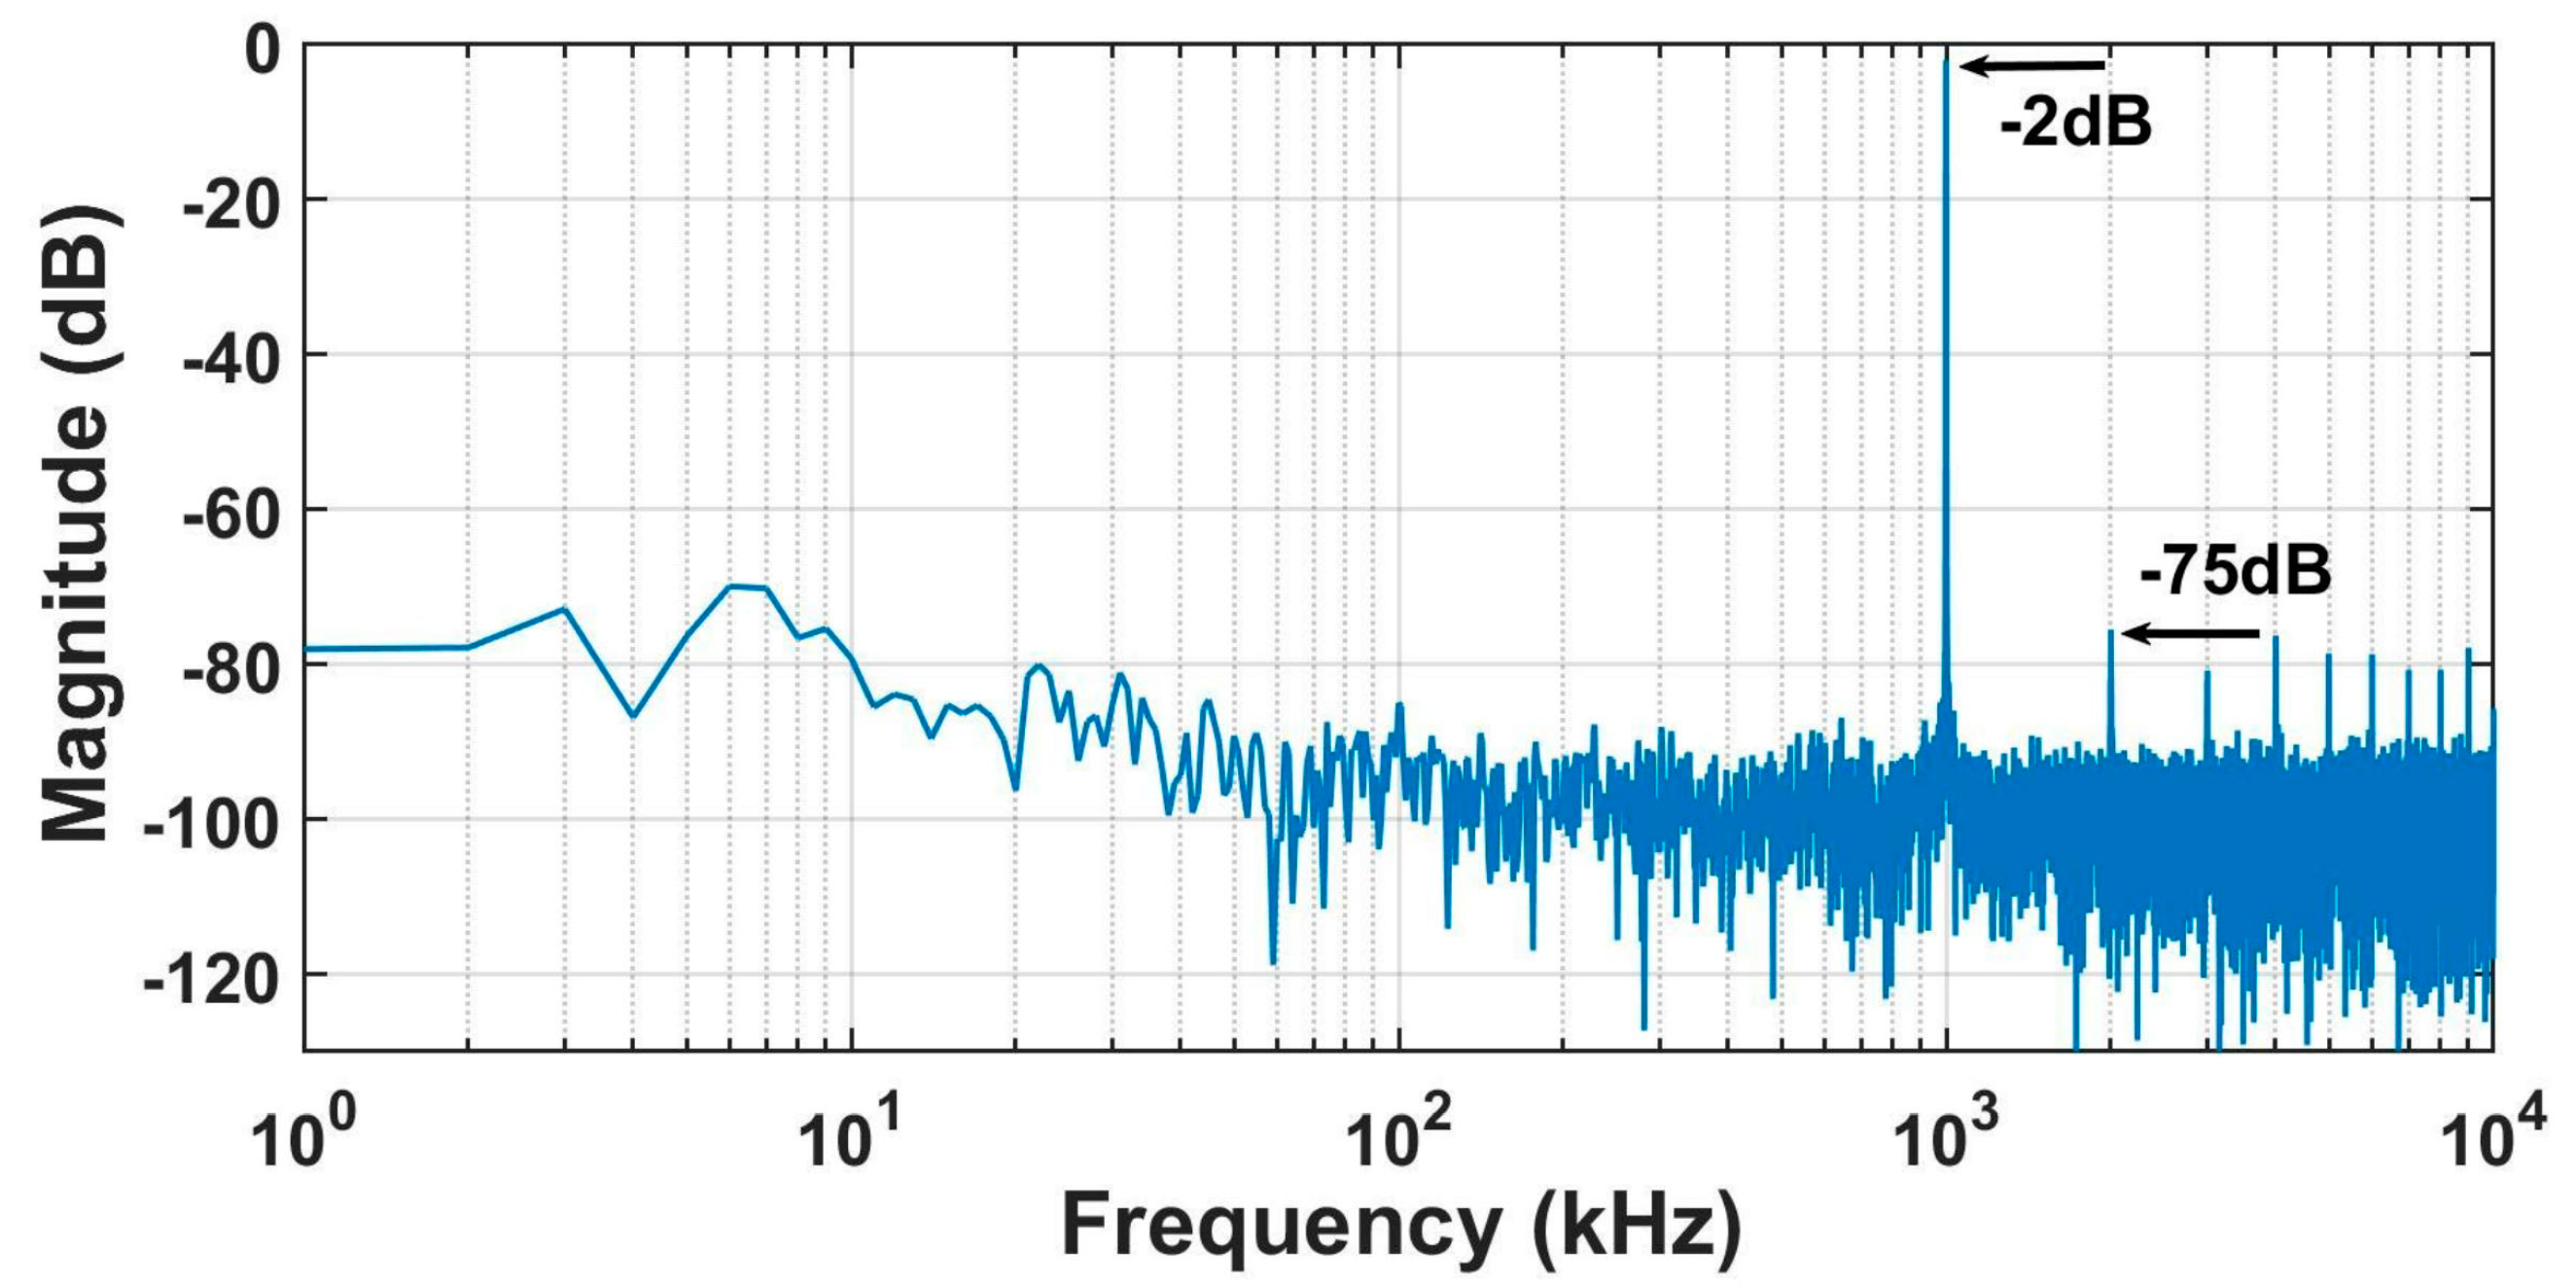
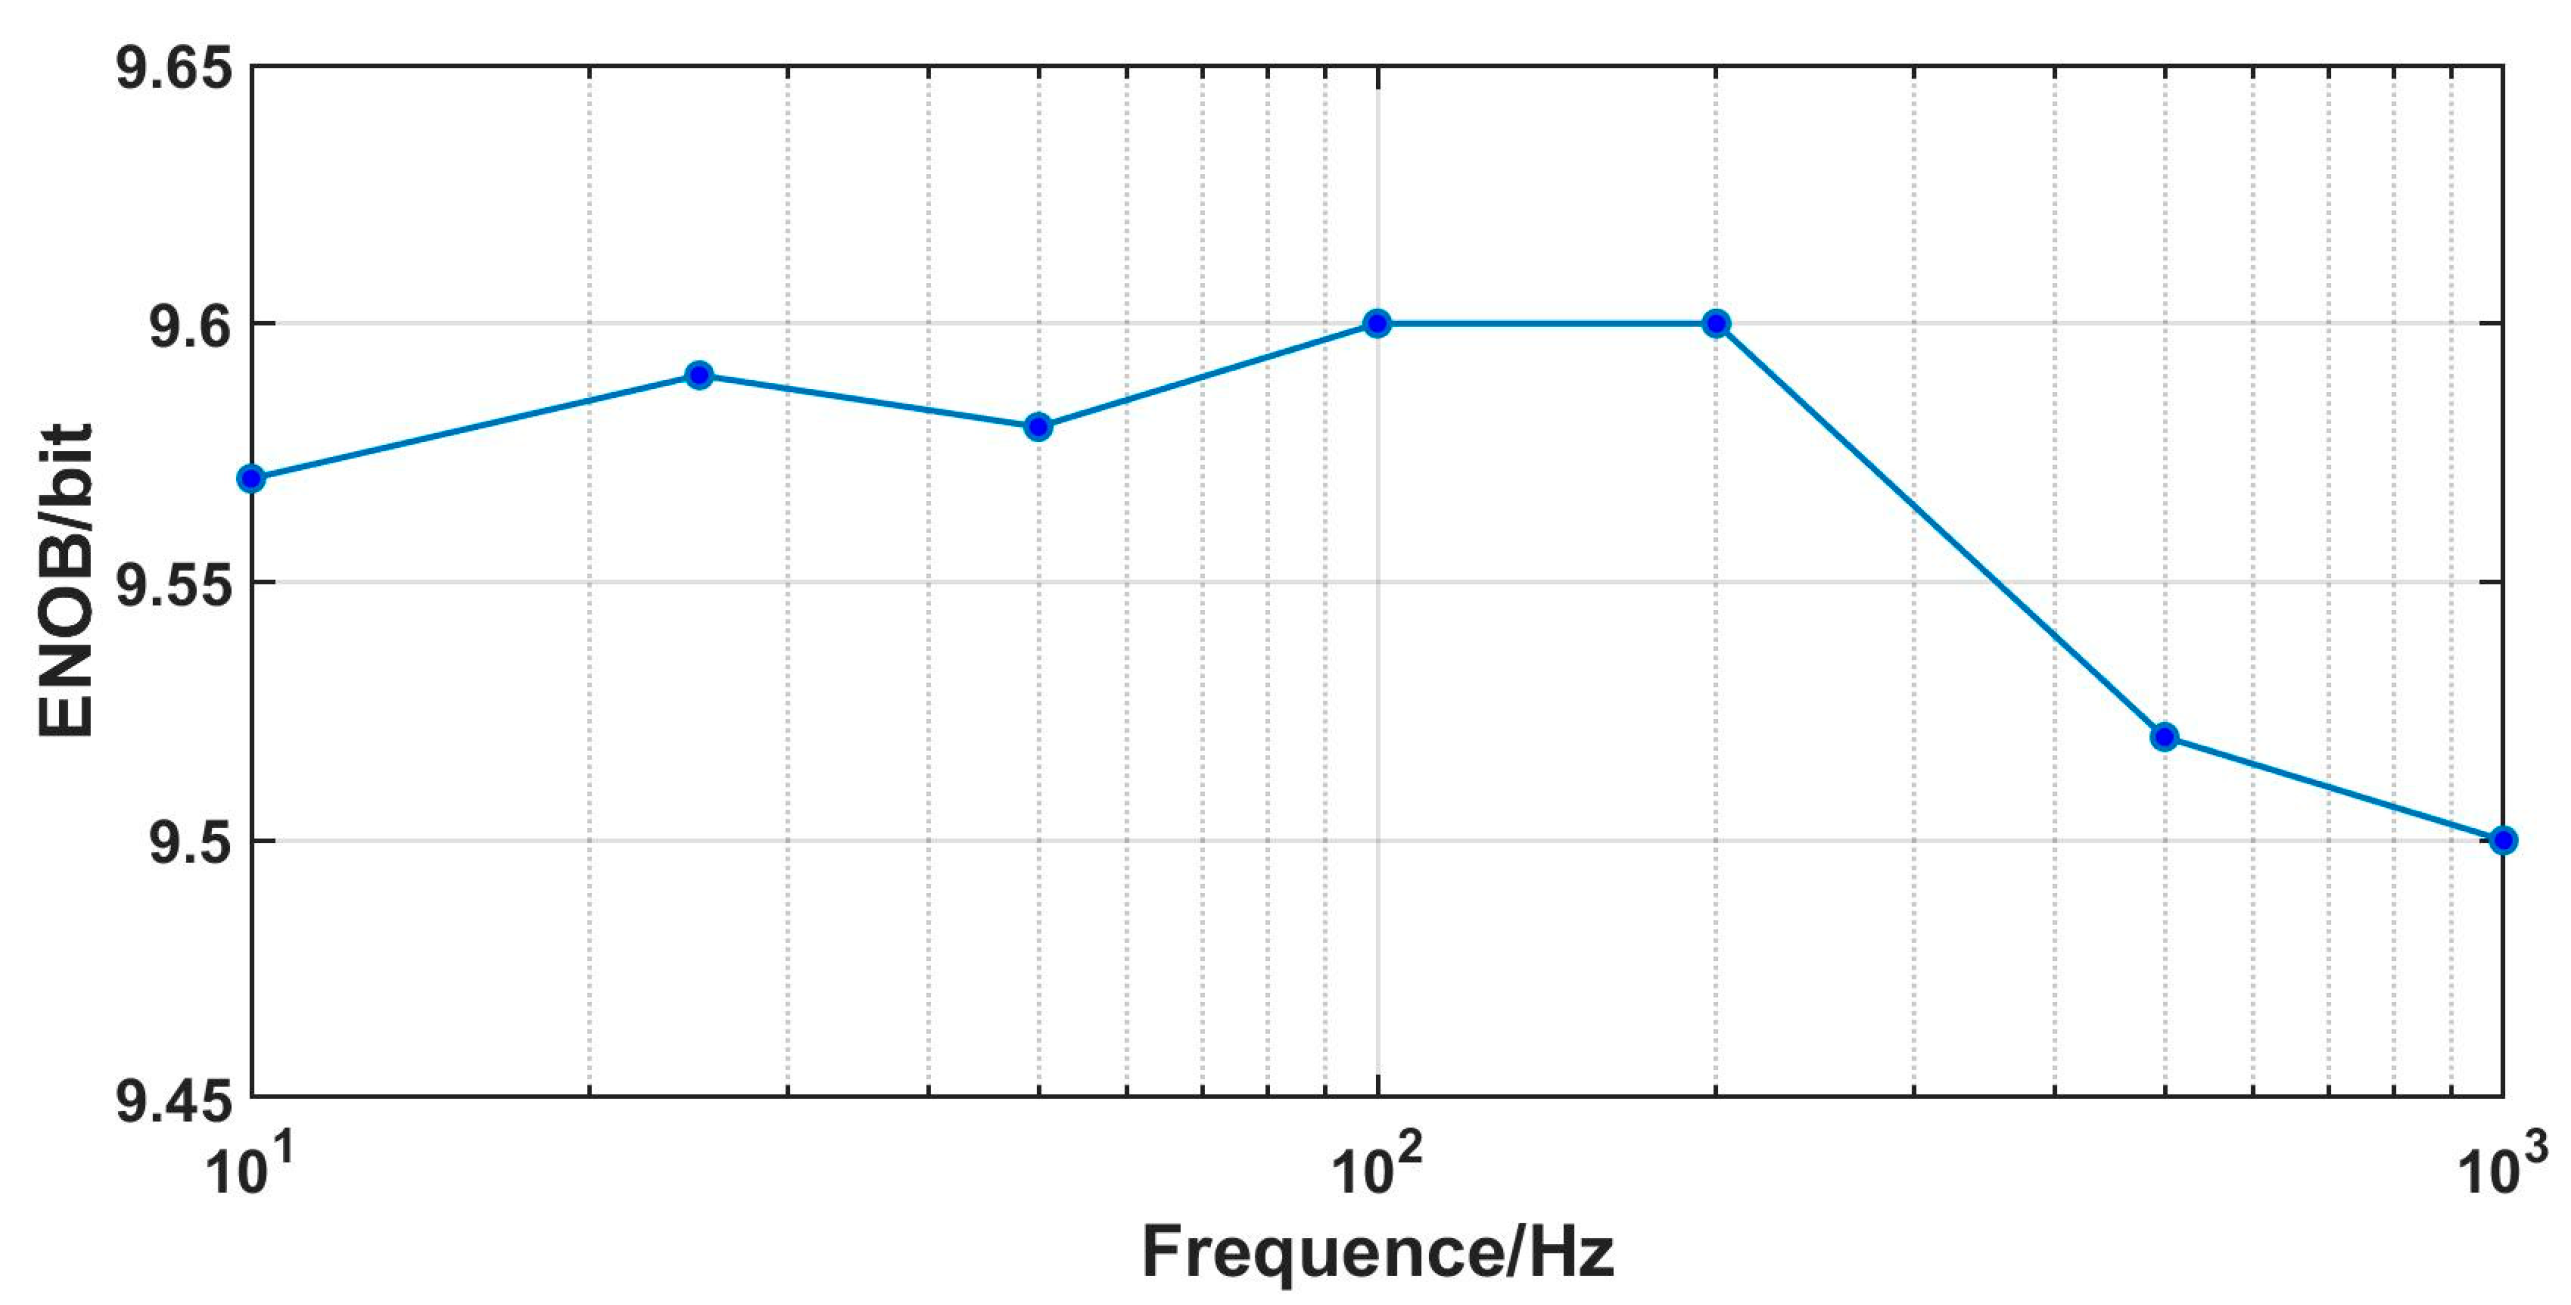
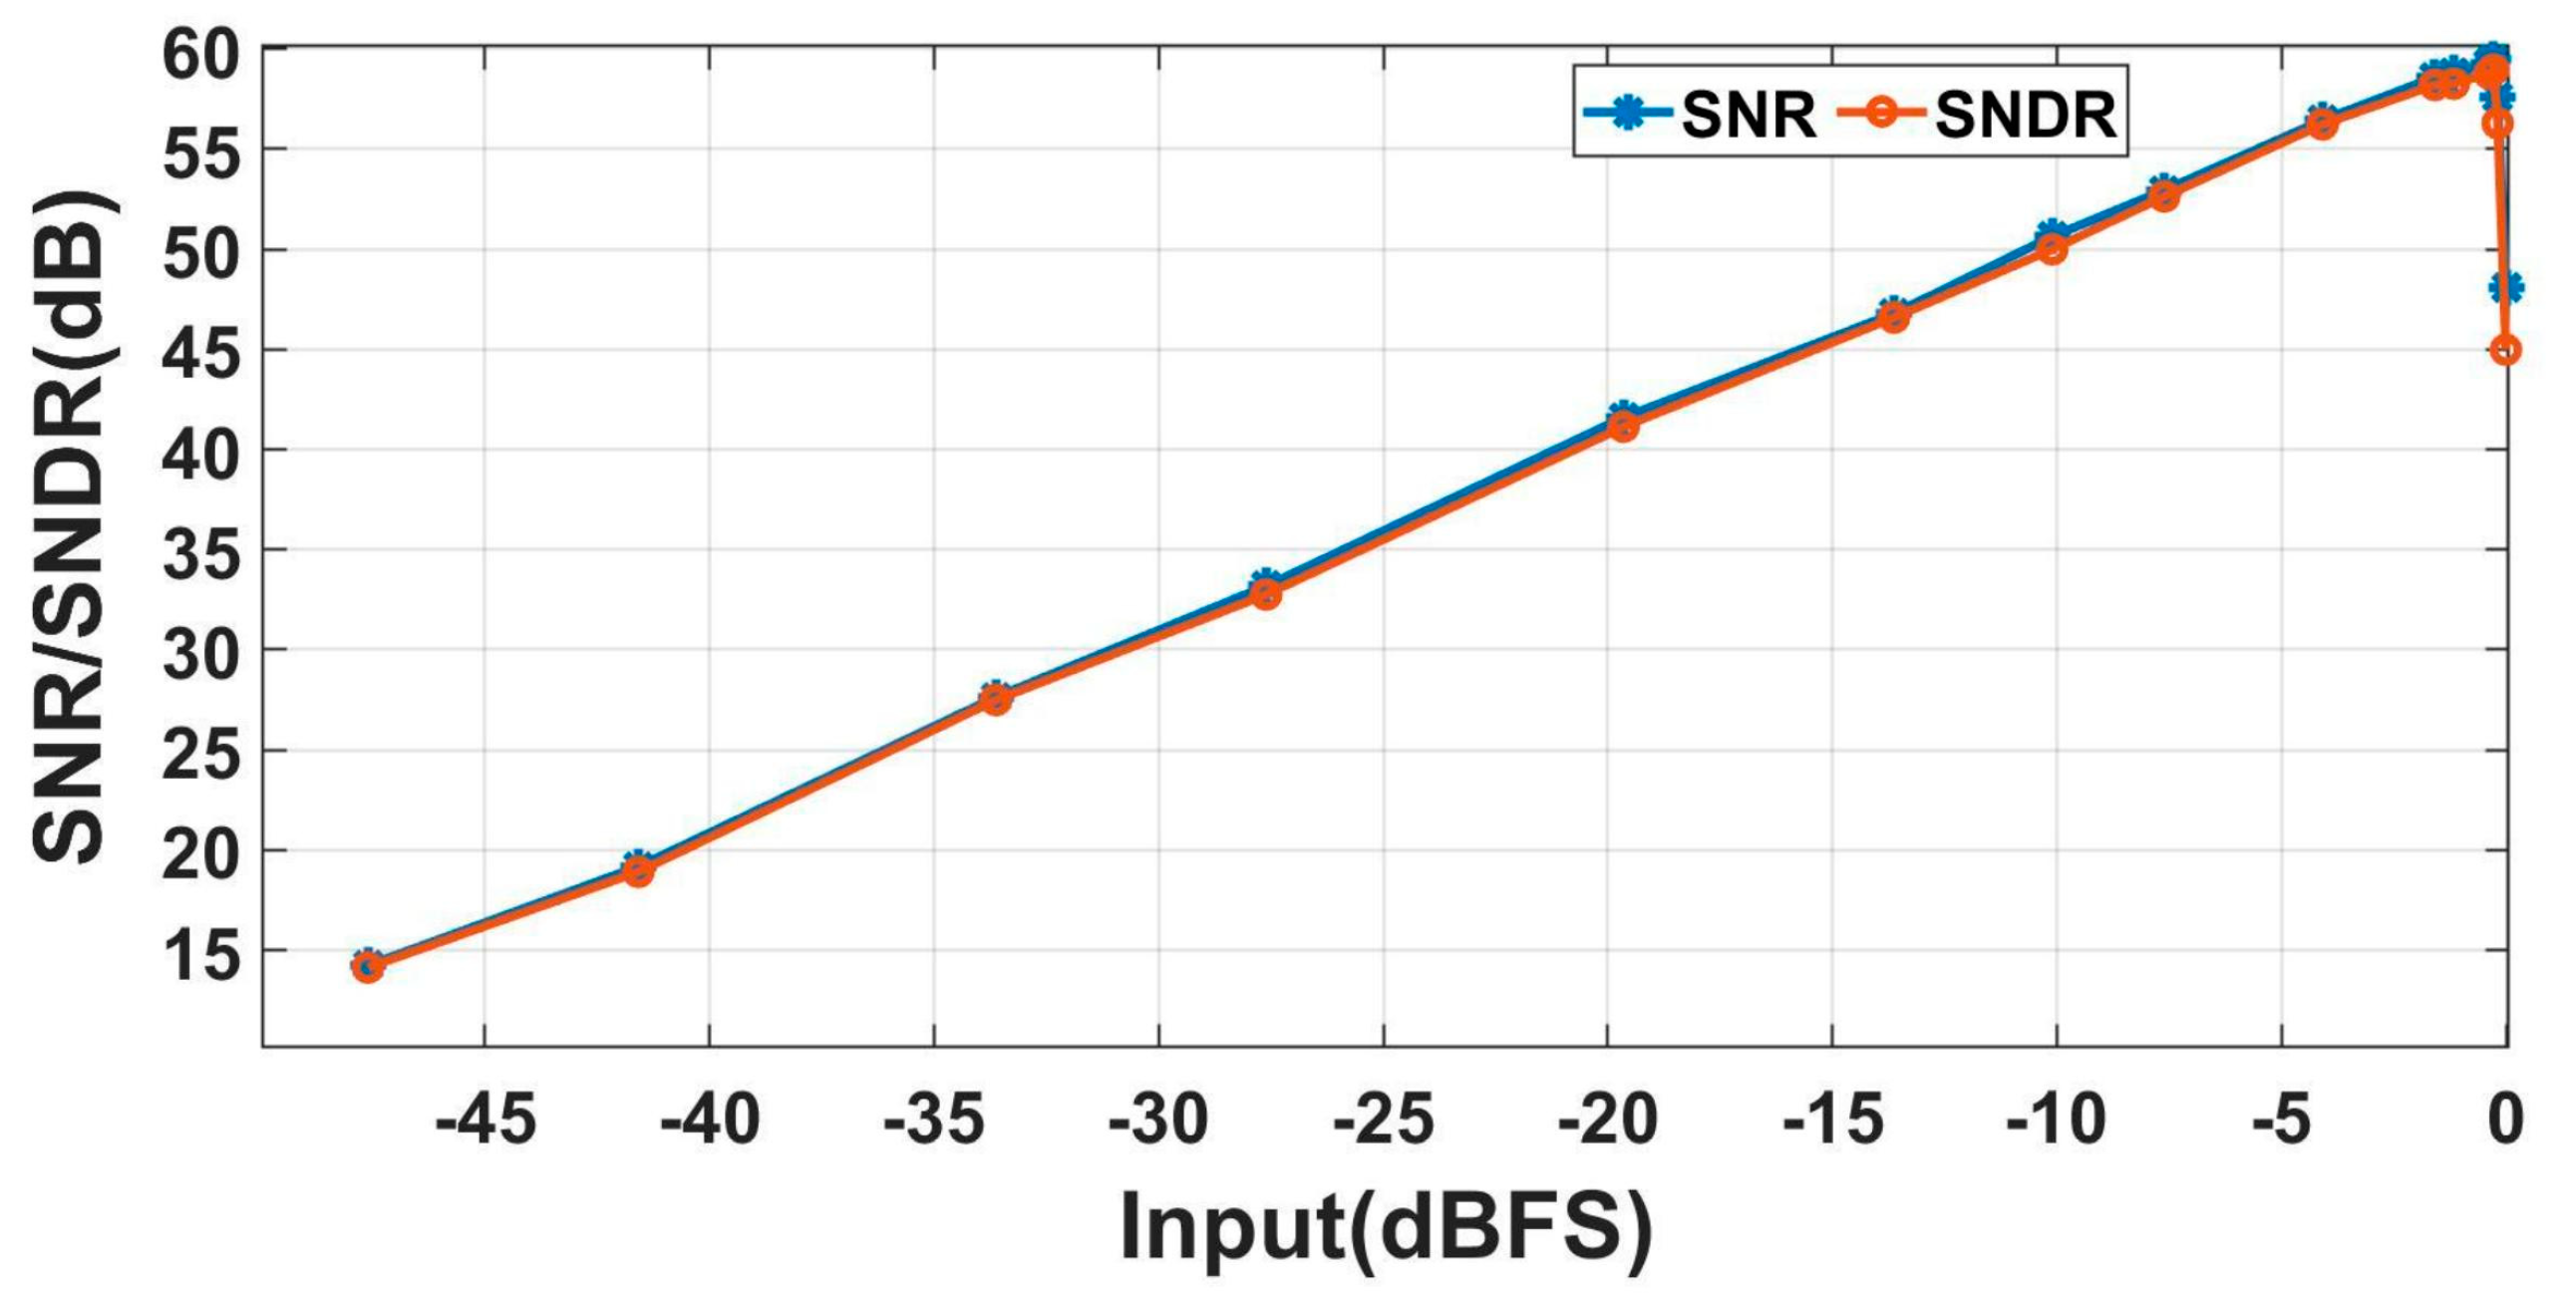
At a voltage of 1.5 V, the core power consumption of the ADC is 12 μW, with an analog part power of 7.3 μW and a digital part power of 4.7 μW. Within the bandwidth of 1 Hz–10 kHz, the RTI noise is 6.9 μVrms. The RTI noise spectral density is shown in Figure 14. We tested the linearity with input signals of 15 mVpp and input frequencies ranging from 10 Hz to 1 kHz. The test results are shown in Figure 15. The linearity performs well when calculating THD with up to 10 harmonics included. When a 1 kHz test signal is input, the linearity is 0.036%, and the spectrum density is shown in Figure 16. The maximum input range is 24 mVpp. Under different input signal frequencies, the maximum ENOB that the ADC can achieve was tested. The test results are shown in Figure 17. At input signal frequencies of 100 Hz and 200 Hz, the maximum ENOB was 9.6 bits. At an input signal frequency of 1 kHz, the maximum SNDR was 58.9 dB, and the ENOB was 9.5 bit. The SNR/SNDR versus input range change at 1 kHz is shown in Figure 18. The test results for differential nonlinearity (DNL) and integral nonlinearity (INL) of the ADC are shown in Figure 19. In the vicinity of the full scale, the values of DNL are +1.8/−1 LSB, and the values of INL are +2/−1.8 LSB. The values of DNL and INL deteriorate when approaching the full scale as the least significant bit (LSB) of the ADC is completely dominated by thermal noise. And the ADC is affected by some non-ideal factors of the circuit, such as charge injection, digital interference, etc., leading to deviations between the logic implemented by the circuit and the ideal mathematical model, which results in the deterioration of DNL/INL.
The comparison between this work and other outstanding works is shown in Table 1. Compared with the traditional architecture of cascading amplifiers and ADC [13,14,17], our work has the smallest area and the lowest power consumption.
Compared to [28,29], this work can effectively eliminate EDO rail-to-rail and has the best power performance. Compared to [29], the performance of this work did not deteriorate with the increase in EDO.

5. Conclusions

An AC-coupled, two-step quantization incremental ADC for neural recording is proposed in this paper. It has low noise, a small area, and low power consumption, and it can reject EDO rail-to-rail. Under the manufacturing conditions of a 180 nm process, the proposed ADC has a total power consumption of 12 μW and an area of 0.0192 mm2. Within the 1 Hz–10 kHz bandwidth, the input reference integrated noise of the ADC is 6.9 μVrms, meeting the requirements for recording neural signals. The full-scale input range is approximately 24 mVpp, and the highest SNDR is 58.9 dB. With advanced process nodes, the performance of the proposed ADC can be further improved. For high-density implantable neural recording chips, this is an attractive architecture choice.

Author Contributions

Conceptualization, X.Z. and Y.L.; methodology, X.Z.; software, X.Z., Y.H., X.W. and Y.L.; formal analysis, X.Z.; writing—original draft preparation, X.Z.; writing—review and editing, X.Z. and Y.L.; supervision, Y.L. All authors have read and agreed to the published version of the manuscript.

Funding

This research received no external funding.

Data Availability Statement

All data underlying the results are available as part of the article and no additional source data are required.

Conflicts of Interest

The authors declare no conflicts of interest.

References

  1. Muller, R.; Le, H.P.; Li, W. A minimally invasive 64-channel wireless μECoG implant. IEEE J. Solid-State Circuits 2014, 50, 344–359. [Google Scholar] [CrossRef]
  2. Heer, F.; Hafizovic, S.; Franks, W. CMOS microelectrode array for bidirectional interaction with neuronal networks. IEEE J. Solid-State Circuits 2006, 41, 1620–1629. [Google Scholar] [CrossRef]
  3. Harrison, R.R.; Watkins, P.T.; Kier, R.J. A low-power integrated circuit for a wireless 100-electrode neural recording system. IEEE J. Solid-State Circuits 2006, 42, 123–133. [Google Scholar] [CrossRef]
  4. Chae, M.S.; Liu, W.; Sivaprakasam, M. Design optimization for integrated neural recording systems. IEEE J. Solid-State Circuits 2008, 43, 1931–1939. [Google Scholar] [CrossRef]
  5. Aziz, J.N.; Abdelhalim, K.; Shulyzki, R. 256-channel neural recording and delta compression microsystem with 3D electrodes. IEEE J. Solid-State Circuits 2009, 44, 995–1005. [Google Scholar] [CrossRef]
  6. Shahrokhi, F.; Abdelhalim, K.; Serletis, D. The 128-channel fully differential digital integrated neural recording and stimulation interface. IEEE Trans. Biomed. Circuits Syst. 2010, 4, 149–161. [Google Scholar] [CrossRef]
  7. Wattanapanitch, W.; Sarpeshkar, R. A low-power 32-channel digitally programmable neural recording integrated circuit. IEEE Trans. Biomed. Circuits Syst. 2011, 5, 592–602. [Google Scholar] [CrossRef] [PubMed]
  8. Lopez, C.M.; Prodanov, D.; Braeken, D. A multichannel integrated circuit for electrical recording of neural activity, with independent channel programmability. IEEE Trans. Biomed. Circuits Syst. 2012, 6, 101–110. [Google Scholar] [CrossRef]
  9. Gao, H.; Walker, R.M.; Nuyujukian, P.; Hermes, E. A 96-Channel Full Data Rate Direct Neural Interface in 0.13 um CMOS. IEEE J. Solid-State Circuits 2012, 47, 1043–1055. [Google Scholar] [CrossRef]
  10. Han, D.; Zheng, Y.; Rajkumar, R. A 0.45 V 100-channel neural-recording IC with Sub μW channel consumption in 0.18um CMOS. IEEE Trans. Biomed. Circuits Syst. 2013, 7, 735–746. [Google Scholar]
  11. Lopez, C.M.; Andrei, A.; Mitra, S. An implanTable 455-active-electrode 52-channel CMOS neural probe. IEEE J. Solid-State Circuits 2013, 49, 248–261. [Google Scholar] [CrossRef]
  12. Biederman, W.; Yeager, D.J.; Narevsky, N. A 4.78 mm2 fully-integrated neuromodulation SoC combining 64 acquisition channels with digital compression and simultaneous dual stimulation. IEEE J. Solid-State Circuits 2015, 50, 1038–1047. [Google Scholar] [CrossRef]
  13. Dragas, J.; Viswam, V.; Shadmani, A. In vitro multi-functional microelectrode array featuring 59760 electrodes, 2048 electrophysiology channels, stimulation, impedance measurement, and neurotransmitter detection channels. IEEE J. Solid-State Circuits 2017, 52, 1576–1590. [Google Scholar] [CrossRef]
  14. Lopez, C.M.; Putzeys, J.; Raducanu, B.C. A neural probe with up to 966 electrodes and up to 384 configurable channels in 0.13 um SOI CMOS. IEEE Trans. Biomed. Circuits Syst. 2017, 11, 510–522. [Google Scholar] [CrossRef]
  15. Angotzi, G.N.; Malerba, M.; Boi, F. A synchronous neural recording platform for multiple high-resolution CMOS probes and passive electrode arrays. IEEE Trans. Biomed. Circuits Syst. 2018, 12, 532–542. [Google Scholar] [CrossRef]
  16. Park, S.Y.; Cho, J.; Lee, K. Dynamic power reduction in scalable neural recording interface using spatiotemporal correlation and temporal sparsity of neural signals. IEEE J. Solid-State Circuits 2018, 53, 1102–1114. [Google Scholar] [CrossRef]
  17. Shiwei, W.; Seyed Kasra, G.; Hosung, C. A compact quad-shank CMOS neural probe with 5120 addressable recording sites and 384 fully differential parallel channels. IEEE Trans. Biomed. Circuits Syst. 2019, 6, 1625–1634. [Google Scholar]
  18. Zhang, X.; Li, Q.; Chen, C.; Li, Y.; Zuo, F.; Liu, X.; Zhang, H.; Wang, X.; Liu, Y. A Fully Integrated 64-Channel Recording System for Extracellular Raw Neural Signals. Electronics 2021, 10, 2726. [Google Scholar] [CrossRef]
  19. Yoo, J.; Yan, L.; El-Damak, D.; Altaf, M.A.B.; Shoeb, A.H.; Chandrakasan, A.P. An 8-channel scalable EEG acquisition SoC with patient-specific seizure classification and recording processor. IEEE J. Solid-State Circuits 2013, 49, 214–228. [Google Scholar] [CrossRef]
  20. Altaf, M.; Yoo, J. A 1.83 μJ/classification 8-channel patient-specific epileptic seizure classification SoC using a non-linear support vector machine. IEEE Trans. Biomed. Circuits Syst. 2016, 10, 49–60. [Google Scholar] [CrossRef]
  21. Ha, U.; Lee, J.; Kim, M.; Roh, T.; Choi, S.; Yoo, H.-J. An EEG-NIRS multimodal SoC for accurate anesthesia depth monitoring. IEEE J. Solid-State Circuits 2018, 53, 1830–1843. [Google Scholar] [CrossRef]
  22. Guo, J.; Yuan, J.; Huang, J.; Law, J.K.-Y.; Yeung, C.-K.; Chan, M. 32.9 nV/rt Hz−60.6 dB THD Dual-Band Micro-Electrode Array Signal Acquisition IC. IEEE J. Solid-State Circuits 2012, 47, 1209–1220. [Google Scholar] [CrossRef]
  23. Li, Q.; Wang, X.; Liu, Y. A 60 nV/ Hz <0.01%-THD±200mV-DC-Rejection Bio-Sensing Chopper Amplifier with Noise-Nonlinearity-Cancelling Loop. IEEE Trans. Circuits Syst. II Express Briefs 2020, 67, 215–219. [Google Scholar]
  24. Greenwald, E.; So, E.; Wang, Q. A bidirectional neural interface IC with chopper stabilized BioADC array and charge balanced stimulator. IEEE Trans. Biomed. Circuits Syst. 2016, 10, 990–1002. [Google Scholar] [CrossRef] [PubMed]
  25. Kassiri, H.; Salam, M.T.; Pazhouhandeh, M.R. Rail-to-rail-input dual-radio 64-channel closed-loop neurostimulator. IEEE J. Solid-State Circuits 2017, 52, 2793–2810. [Google Scholar] [CrossRef]
  26. Kim, C.; Joshi, S.; Courellis, H.; Wang, J.; Miller, C.; Cauwenberghs, G. Sub-μVrms-Noise Sub-μW/Channel ADC-Direct Neural Recording with 200-mV/ms Transient Recovery Through Predictive Digital Autoranging. IEEE J. Solid-State Circuits 2018, 53, 3101–3110. [Google Scholar] [CrossRef]
  27. Wang, S.; Ballini, M.; Yang, X.; Sawigun, C.; Weijers, J.W.; Biswas, D.; Van Helleputte, N.; Lopez, C.M. A Compact Chopper Stabilized Δ-ΔΣ Neural Readout IC with Input Impedance Boosting. IEEE Open Journal of the Solid-State Circuits Society 2021, 1, 67–78. [Google Scholar] [CrossRef]
  28. De Dorigo, D.; Moranz, C.; Graf, H.; Marx, M.; Wendler, D.; Shui, B.; Herbawi, A.S.; Kuhl, M.; Ruther, P.; Paul, O.; et al. Fully Immersible Subcortical Neural Probes with Modular Architecture and a Delta-Sigma ADC Integrated Under Each Electrode for Parallel Readout of 144 Recording Sites. IEEE J. Solid-State Circuits 2018, 53, 3111–3125. [Google Scholar] [CrossRef]
  29. Wendler, D.; De Dorigo, D.; Amayreh, M.; Bleitner, A.; Marx, M.; Willaredt, R.; Manoli, Y. A 0.0046-mm2 Two-Step Incremental Delta–Sigma Analog-to-Digital Converter Neuronal Recording Front End with 120-mVpp Offset Compensation. IEEE J. Solid-State Circuits 2023, 58, 439–450. [Google Scholar] [CrossRef]
  30. Zhang, X.; Liu, W.; Yang, H.; Hou, Y.; Wang, X.; Liu, Y. A 16-µW 10-kHz BW incremental ΔΣ ADC with automatic EDO canceling for implantable neural recording. IEICE Electronics Express 2024, 21, 20230604. [Google Scholar] [CrossRef]
  31. Bang, J.-S.; Jeon, H.; Je, M.; Cho, G.-H. A 6.5µW 92.3DB-DR Biopotential-Recording Front-End with 360mVpp Linear Input Range. In Proceedings of the 2018 IEEE Symposium on VLSI Circuits, Honolulu, HI, USA, 18–22 June 2018; pp. 239–240. [Google Scholar]
  32. Lee, C.; Jeon, T.; Jang, M.; Park, S.; Kim, J.; Lim, J.; Ahn, J.H.; Huh, Y.; Chae, Y. A 6.5-μW 10-kHz BW 80.4-dB SNDR Gm-C-Based CT ∆∑ Modulator with a Feedback-Assisted Gm Linearization for Artifact-Tolerant Neural Recording. IEEE J. Solid-State Circuits 2020, 55, 2889–2901. [Google Scholar] [CrossRef]
  33. Wang, S.; Lopez, C.M.; Ballini, M. Leakage compensation scheme for ultra-high-resistance pseudo-resistors in neural amplifiers. Electron. Lett. 2018, 54, 270–272. [Google Scholar] [CrossRef]
  34. Liu, M.; Pelzers, K.; van Dommele, R.; van Roermund, A.; Harpe, P. A 106nW 10 b 80 kS/s SAR ADC with Duty-Cycled Reference Generation in 65 nm CMOS. IEEE J. Solid-State Circuits 2016, 51, 2435–2445. [Google Scholar] [CrossRef]
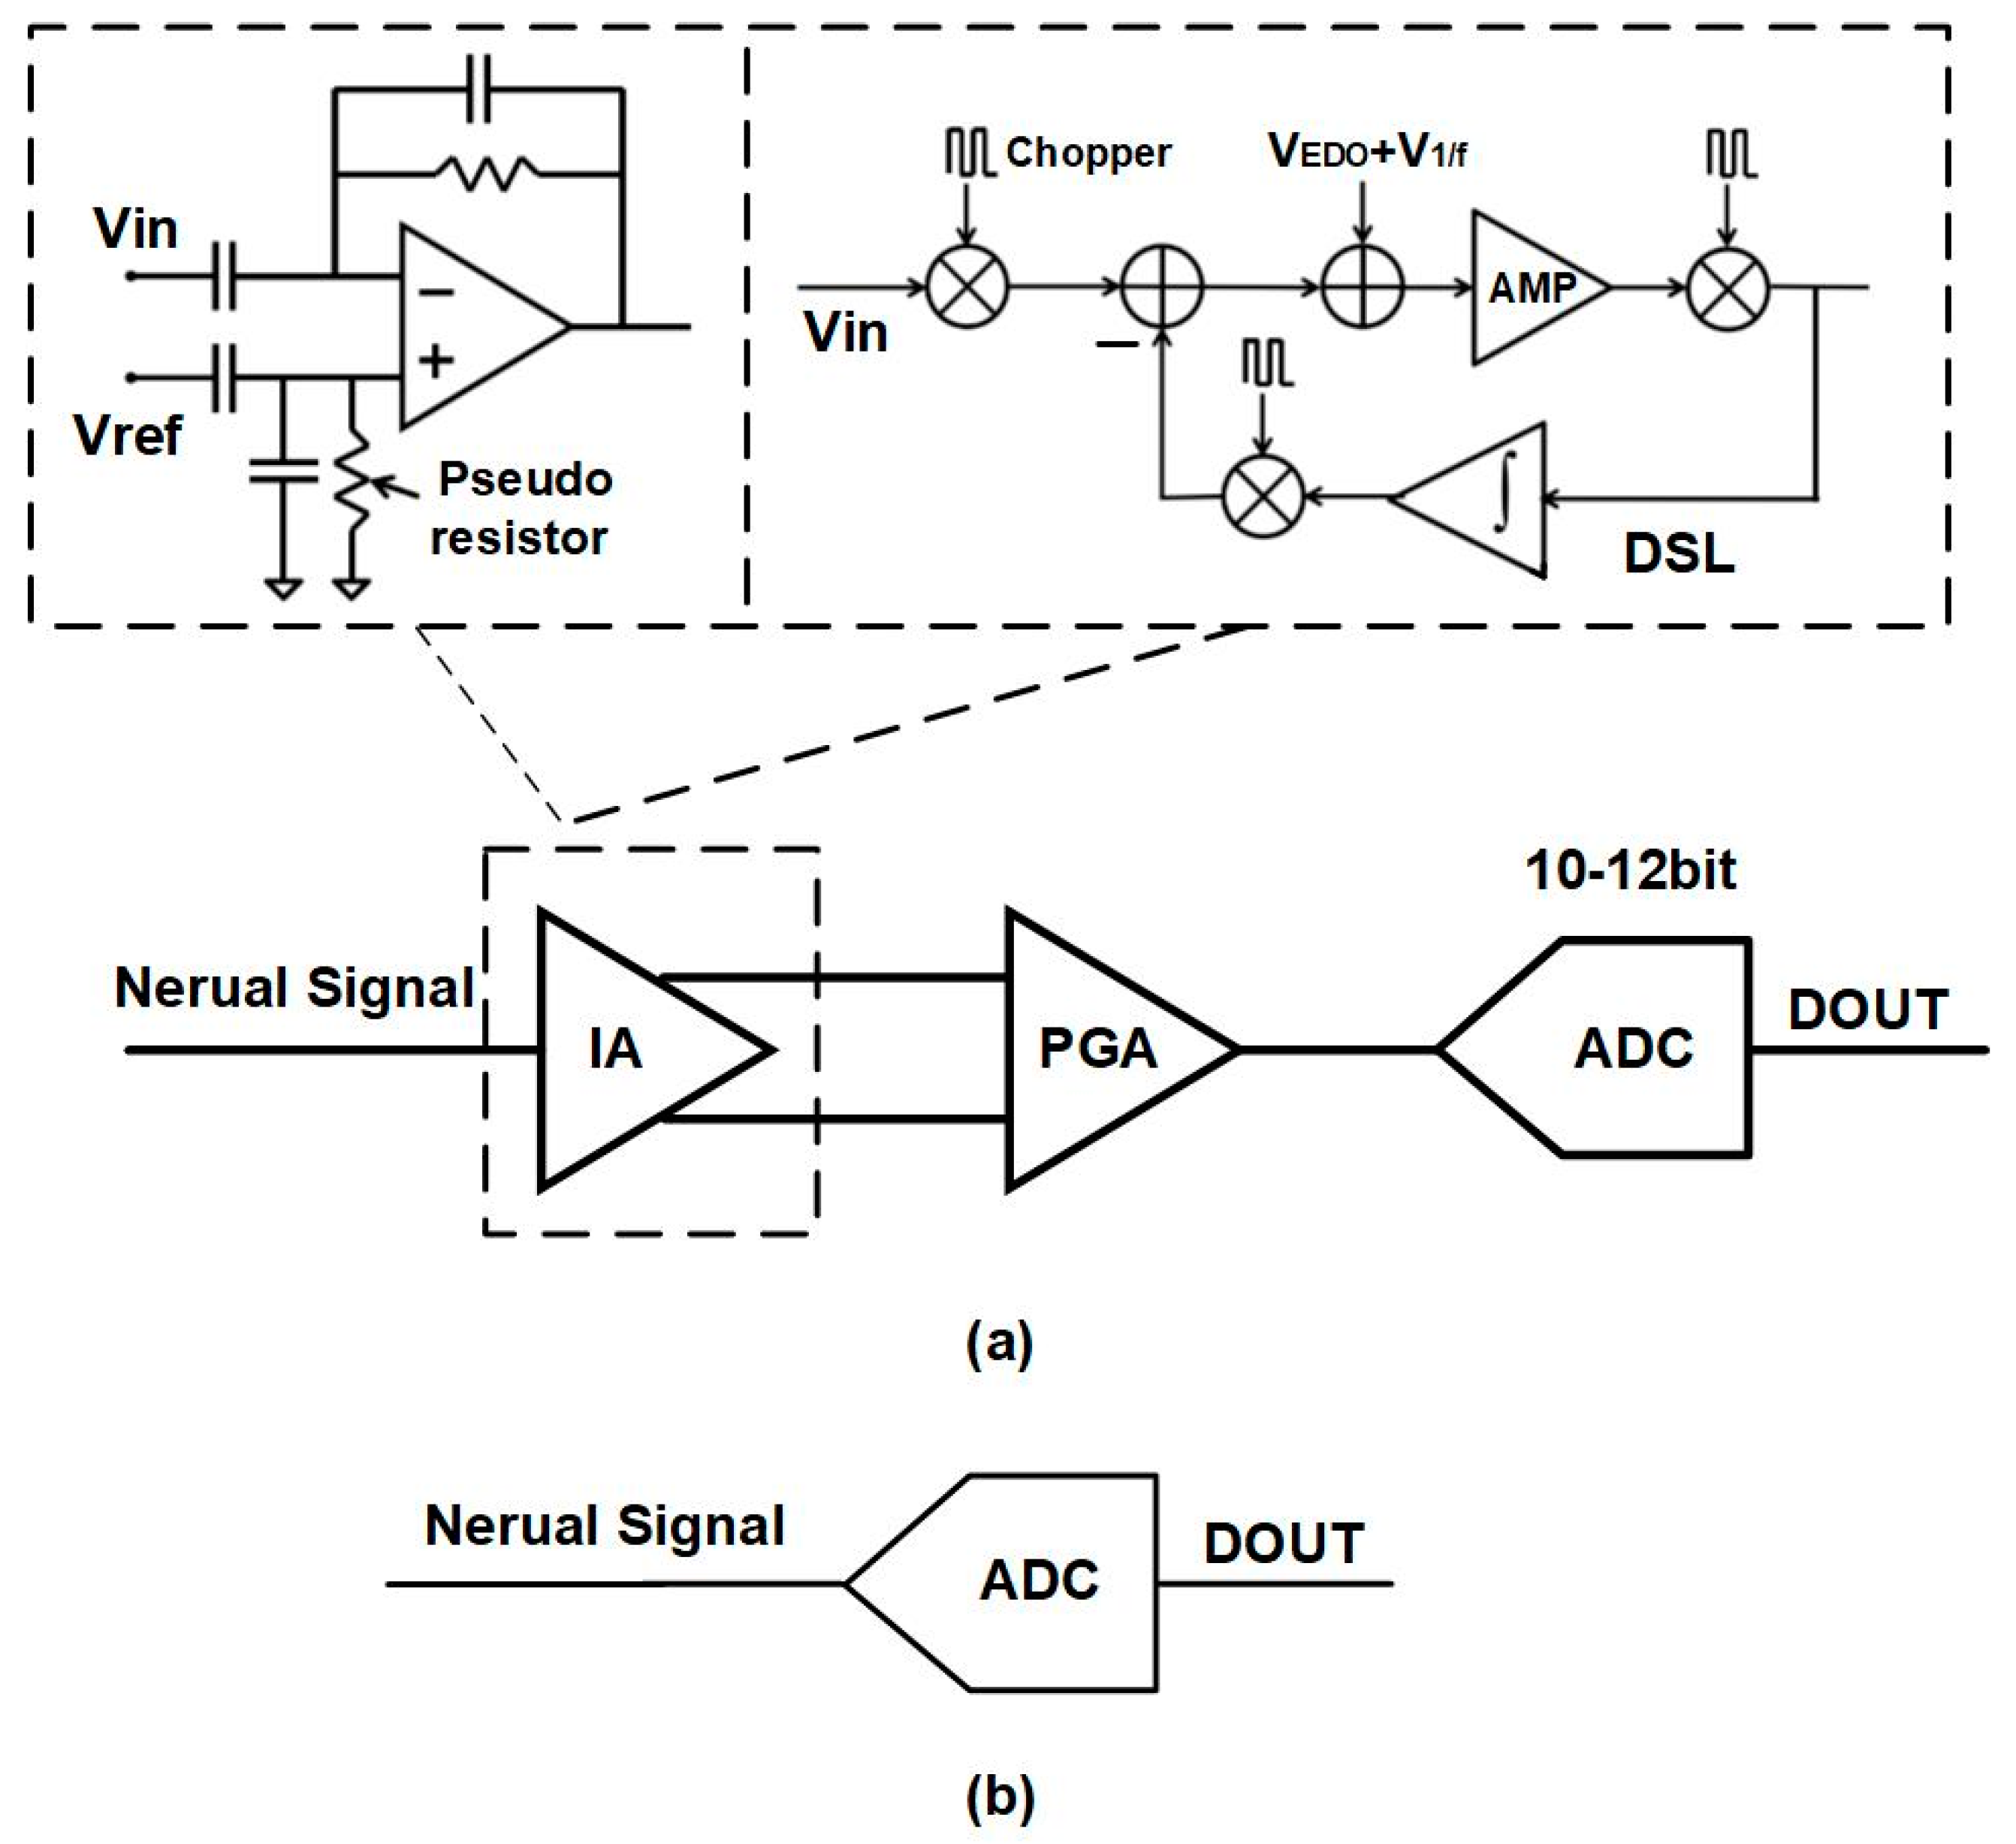
Figure 1. Common design methods for neural chips: (a) IA + PGA + ADC; (b) ADC only.
Electronics 13 01222 g001
Figure 2. System framework diagram of the ADC.
Electronics 13 01222 g002
Figure 3. Control logic waveform of the ADC.
Electronics 13 01222 g003
Figure 4. Output waveform of the integrator.
Electronics 13 01222 g004
Figure 5. Magnitude frequency response of H(w).
Electronics 13 01222 g005
Figure 6. Schematic of the proposed ADC.
Electronics 13 01222 g006
Figure 7. Selection and analysis of pseudo-resistor structures. (a) The selected one; (b) the not-selected one.
Electronics 13 01222 g007
Figure 8. Schematic of (a) OTA and (b) single-bit current DAC.
Electronics 13 01222 g008
Figure 9. Design of the comparator: (a) schematic of the comparator; (b) control logic and waveform of the comparator; (c) circuit for generating timing control.
Electronics 13 01222 g009
Figure 10. Timing control circuit of the ADC.
Electronics 13 01222 g010
Figure 11. Schematic of the current reference.
Electronics 13 01222 g011
Figure 12. Die photo of the chip.
Electronics 13 01222 g012
Figure 13. (a) PCB for chip testing; (b) testing equipment and environment.
Electronics 13 01222 g013
Figure 14. Measured RTI noise of the ADC.
Electronics 13 01222 g014
Figure 15. Measured THD of the ADC at different frequencies.
Electronics 13 01222 g015
Figure 16. Measured THD at 1 kHz of the ADC.
Electronics 13 01222 g016
Figure 17. Measured maximum ENOB of the ADC at different frequencies.
Electronics 13 01222 g017
Figure 18. SNR/SNDR versus input amplitude at 1 kHz.
Electronics 13 01222 g018
Figure 19. Measured INL/DNL results of the ADC.
Electronics 13 01222 g019
Table 1. Measured performance and comparison to prior art.
JSSC [13]TBCAS [14]TBCAS [17]JSSC [28] dJSSC [29]This Work
ArchitectureAMP + ADCAMP + ADCAMP + ADCADC onlyADC onlyADC only
Process (μm)0.180.130.130.180.180.18
Supply (V)1.81.2/1.81.21.81.81.5
Power (μW)
/Channel
1649.0695.1 c39.1414.9412
Input Range (mVpp)- a- a- a22.51424
RTI noise (μVrms)2.4 (300–3 kHz)
3.6 (1–300 Hz)
6.36 (0.3 k–3 kHz)7.44 (0.3 k–10 kHz)
7.65(0.5–1 kHz)
12
(1 Hz–10 kHz)
4.9
(1 Hz–10 kHz) e
6.9
(1 Hz–10 kHz)
THD- b0.4%
(10 mVpp)
0.17%
(10 mVpp)
0.22%
(10 mVpp)
0.078% e
(10 mVpp)
0.036%
(15 mVpp)
Area (mm2)
/Channel
>0.020.120.0350.00490.004620.0192
EDO toleranceRail-to-RailRail-to-RailRail-to-Rail22.5 mV±60 mVRail-to-Rail
a The recording chip with AMP + ADC architecture has an adjustable gain for its amplifier. When the gain is reduced, the amplitude of the input signal increases, but the noise performance deteriorates. This parameter is not mentioned in the corresponding article. b Ref. [13] is not mention THD in the paper. c Power management and digital power included. d The design proposed in ref. [28] allows for an adjustable input range, selecting the input range with the best noise performance for comparison. e These parameters are measured at EDO = 0 mV. When EDO increases, the performance parameters deteriorate.
Disclaimer/Publisher’s Note: The statements, opinions and data contained in all publications are solely those of the individual author(s) and contributor(s) and not of MDPI and/or the editor(s). MDPI and/or the editor(s) disclaim responsibility for any injury to people or property resulting from any ideas, methods, instructions or products referred to in the content.