Article

Overvoltage Suppression Strategy of LCC-HVDC Delivery System Based on Hydropower Phase Control Participation

1
Sichuan Electric Power Design & Consulting Co., Ltd., Chengdu 610016, China
2
State Grid Sichuan Electric Power Company Electric Power Research Institute, Chengdu 610041, China
3
College of Electrical Engineering, Sichuan University, Chengdu 610017, China
*
Author to whom correspondence should be addressed.
Electronics 2024, 13(7), 1223; https://doi.org/10.3390/electronics13071223
Submission received: 21 February 2024 / Revised: 19 March 2024 / Accepted: 25 March 2024 / Published: 26 March 2024
(This article belongs to the Section Industrial Electronics)

Abstract

:
In a high-voltage direct current (HVDC) transmission system, commutation failure at the receiving end may lead to transient overvoltage at the sending end converter bus of the weak alterative current (AC) system. Firstly, the principle calculation method of overvoltage generation at the sending end after commutation failure is analyzed. Combined with the output characteristics of the hydroelectric excitation system, a coordinated control strategy for hydroelectric and DC systems is proposed. Since the voltage and current values at the DC outlet of the rectifier side change first after a fault occurs at the receiving end, the relationship equation between DC voltage and AC bus voltage is derived and it is used as an input signal to construct additional excitation control for hydropower stations. The proposed strategy is verified by establishing a simulation hydrogen–wind–solar model bundled via a DC sending system in PSCAD/EMTDC. The simulation results illustrate that the transient overvoltage suppression rates are all more than 35%, and the maximum is 38.53%. The proposed strategy can reduce the overvoltage by 0.126 p.u. compared with the International Council on Large Electric Systems (CIGRE) standard control strategy.

1. Introduction

China’s hydro energy and new energy resources are mainly concentrated in the western region, while the load center is in the eastern region, showing a reverse geographical distribution [1]. High-voltage direct current (HVDC) transmission based on a line-commutated converter (LCC) has the merits of long-range large-capacity transmission and small line loss [2,3], through which the imbalance between the temporal and spatial distribution of resources and loads in China can be effectively addressed [4]. Nowadays, China has established the alterative current/direct current (AC/DC) hybrid power system with global largest and highest voltage levels [5]. At the same time, to realize “carbon peaking” and “carbon neutrality” goals, the progression of photovoltaic and wind power and their access proportion are rapidly increasing. The characteristics of modern power systems have changed significantly. However, the most typical fault of LCC-HVDC transmission systems is the commutation failure, which is primarily attributed to the inverter-side AC faults. When the commutation failure occurs, the sending end converter bus voltage will decrease and then will increase with a very fast conversion speed [6]. Due to the continuous output of reactive power from electrical equipment such as rectifiers, substantial reactive power redundancy exists at the feeder converter bus, which ultimately generates overvoltage [7]. Overvoltage seriously affects the normal operation of various power electronic devices, and even leads to large-scale off-grid new energy, which in turn triggers a series of chain failures [8]. Therefore, overvoltage suppression is essential to ensure normal power transfer.
Until now, there have been a lot of studies about commutation failure overvoltage in LCC-HVDC transmission systems by scholars worldwide. Studies [9,10] researched the maximum value of commutation failure overvoltage and proposed a more refined method of calculating the maximum value of voltage in combination with the control strategy of DC systems. In terms of overvoltage suppression triggered by commutation failure, study [11] optimized the DC current control using the current prediction value for commutation failure overvoltage suppression. Study [12] designed a commutation failure suppression module to which the control system can quickly switch when an AC fault at the inverter side leads to a commutation failure. Since it does not require a proportional/integral controller, it has a fast response time along with high accuracy. Studies [13,14,15] proposed that new energy grid-connected inverters absorb redundant reactive power based on inductive reactive current control, which in turn reduces the overvoltage at new energy grid-connected points. However, these overvoltage suppression strategies are affected by the converter capacity. Study [16] derived the relational equation between the DC current directive value and the modular multilevel converter (MMC) reactive power directive value for a hybrid cascaded DC system and proposed a cooperative overvoltage suppression strategy for commutation failure based on multiple converters. However, the application scenario of this method must contain MMC, so its application scenario is limited and cannot be applied to conventional high-voltage DC transmission systems. Studies [17,18] proposed to equip HVDC transmission systems with reactive power compensation devices such as synchronous regulators to absorb redundant reactive power during overvoltage periods for the purpose of overvoltage suppression. However, the investment cost of synchronous regulators is too high to be economical. Study [19] raised a constant reactive power control strategy to suppress overvoltage The proposed strategy controls both the DC voltage and the current to increase the reactive power consumption of the rectifier, and thus suppresses the overvoltage caused by commutation failure. However, this method ignores the fact that voltage-dependent current order limiter (VDCOL) control can influence AC overvoltage control. Study [20] proposed overvoltage suppression by removing part of the AC filters to reduce the redundant reactive power at the source. However, the AC filter removal time is generally greater than 0.1 s, which is larger than the tripping time delay of the relay, and thus it is difficult to suppress the transient overvoltage [21].
Based on the above analysis, there are problems of applicability, rapidity, and economy in the existing overvoltage suppression strategies for commutation failure. To address the shortcomings of existing studies, this paper proposes a coordinated control strategy to suppress overvoltage caused by commutation failure for the LCC-HVDC transmission system of a hydrogen–wind–solar bundled-via-DC sending system. Firstly, the principle of commutation failure leading to overvoltage is analyzed. Then, the calculation method of transient overvoltage is obtained based on the vector relationship. Finally, a coordinated control strategy based on hydropower phase control participation is proposed. Meanwhile, the overvoltage suppression effect is proposed to be measured by the transient overvoltage suppression rate (TOSR). The contribution of this paper can be summarized as follows:
  • The proposed strategy introduces the measured trigger angle in the rectifier side control system into the hydroelectric excitation control system, which can respond quickly to the overvoltage at the sending end after the commutation failure and absorb the surplus reactive power.
  • The proposed strategy fully exploits the reactive power absorption capacity and emergency voltage regulation capacity of the hydropower unit. Overvoltage suppression can be achieved without the need for additional equipment, avoiding additional investment.
This paper is structured as follows: Section 2 describes the mechanism of overvoltage at the sending end triggered by commutation failure and gives the calculation of sending end transient overvoltage under DC blocking after commutation failure. Section 3 proposes the coordinated control strategy for suppressing overvoltage of the hydrogen–wind–solar bundled-via-DC sending system. Simulation results are given in Section 4 to verify the effectiveness of the proposed strategy. Section 5 is the conclusion of this paper.

2. Principle of Overvoltage at the Sending End

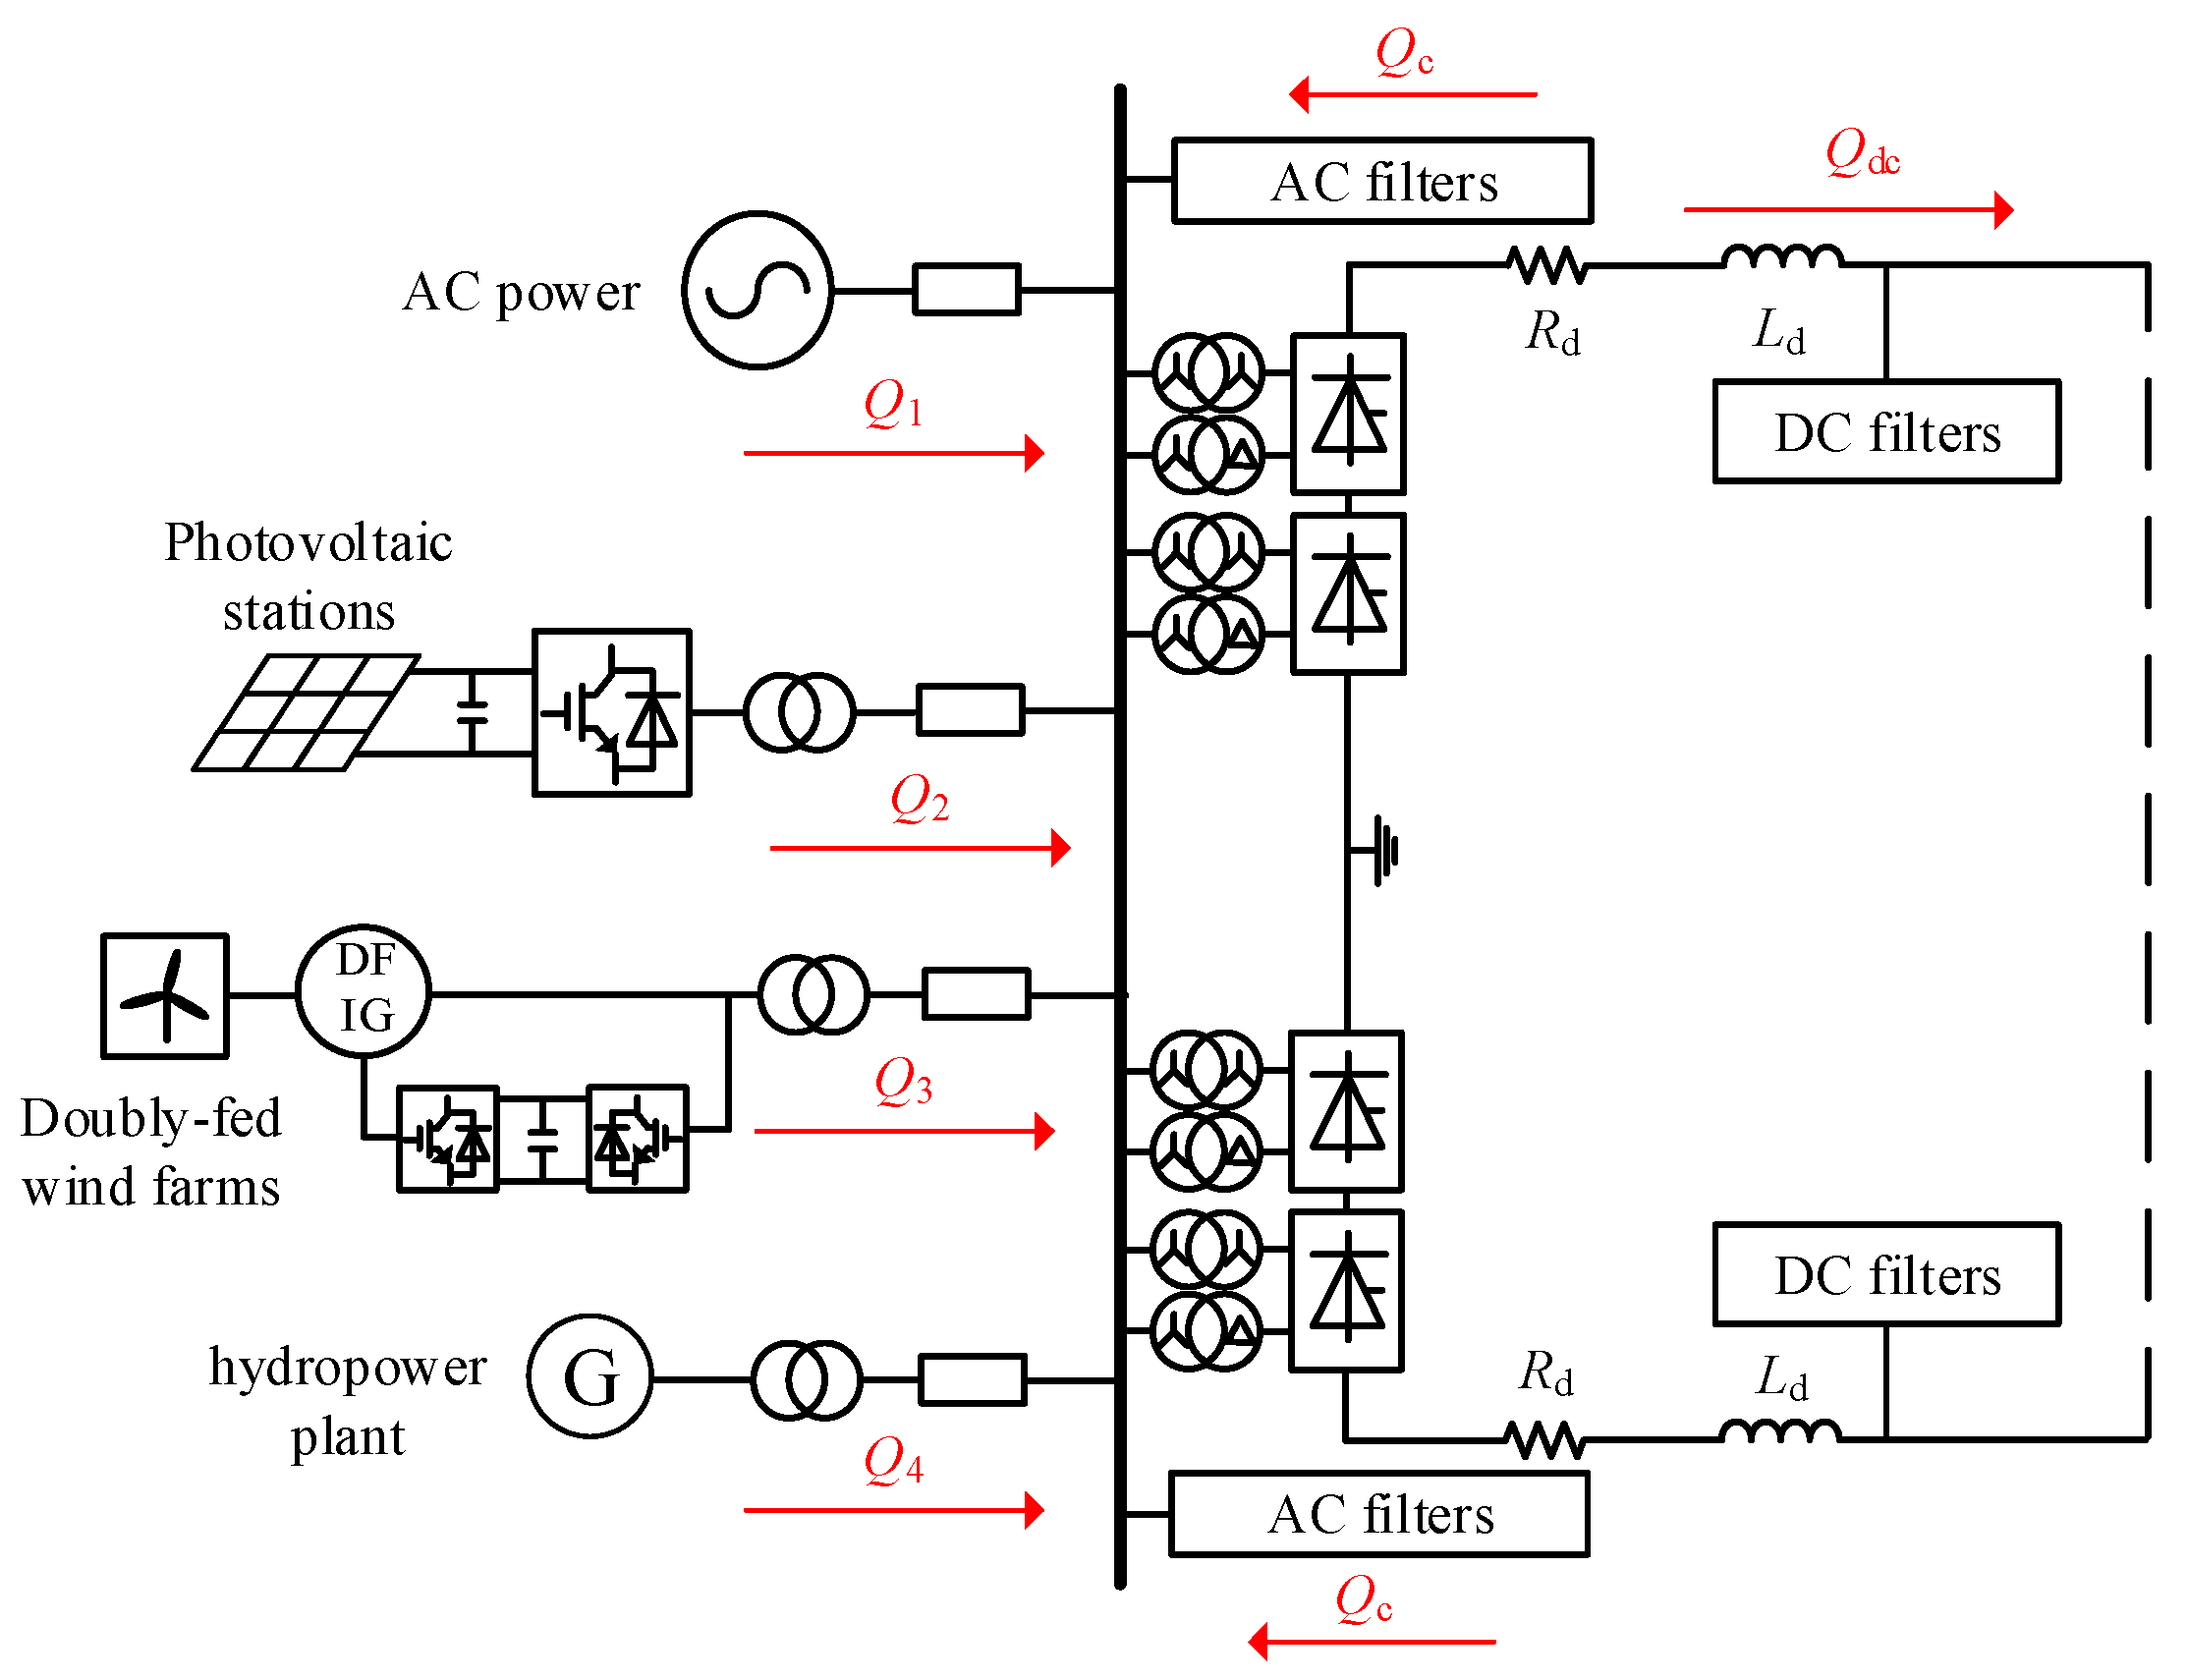
2.1. Feeder Systems for Clean Energy Sent via Direct Current

The new energy bundled-via-DC delivery model discussed in this paper is shown in Figure 1. The power structure at the sending end includes conventional AC power sources, photovoltaic farms, double-fed wind farms, and hydroelectric power plants, which are sent via a 12-pulse converter after being brought together at the AC bus. The sending end system has two AC filter banks to provide reactive power support. The transmission line is a bipolar DC line with earth return. The receiving end system is equivalent to a voltage source with impedance. In Figure 1, Q1, Q2, Q3, and Q4 are the reactive power, where Q1 is from AC power sources, Q2 is from PV farms, Q3 is from double-fed wind farms, and Q4 is from hydropower plants, respectively. Qc is the reactive power supplied by the AC filters. Qdc is the reactive power consumed by the DC system.
With the wide-scale grid integration of clean energy represented by photovoltaic and wind power, the voltage support capability of the sending end AC system continues to be weakened. On the one hand, new energy units have more internal power electronic devices and less mechanical rotating equipment, resulting in weaker system damping and inertia. Another aspect, subject to the constraints of new energy units’ internal power electronic devices and control systems, wind power and photovoltaic have smaller short-circuit currents. Therefore, the short-circuit capacity they can provide is lower, which reduces the power system’s short-circuit ratio. Therefore, in the context of the expanding scale of clean energy grid connection, the hydrogen–wind–photovoltaic bundled-via-DC delivery system is structurally weak, with lower short-circuit capacity and poorer reactive power support capability. When commutation failure occurs resulting in DC blocking, a substantial amount of reactive power is in surplus at the sending end system, bringing about overvoltage impacts in a timescale of seconds.

2.2. Principle of Overvoltage Triggered by Commutation Failure at the Sending End of the System

During normal system operation, the reactive power between the AC and DC at the sending end is balanced to satisfy the following equation:
Q 1 + Q 2 + Q 3 + Q 4 + Q c = Q dc
The specific expression for the reactive power Qdc [22] is:
Q dc = U d I d tan φ
tan φ = ( π / 180 ) μ cos ( 2 α + μ ) sin μ sin ( 2 α + μ ) sin μ
where Ud is the DC voltage; Id is the DC current; φ is the power factor angle of the converter station on the rectifier side; μ is the overlap angle; and α is the firing angle.
When an AC fault occurs at the receiving end causing commutation failure and thus leading to DC blocking, the AC system firing angle α increases rapidly, Pd falls rapidly, and Qdc decreases instantaneously. The removal of the AC filters at the sending end takes some time, leading to a break in the reactive power balance between the AC and DC systems, so a lot of reactive power surplus ultimately leads to the appearance of overvoltage.
The size of converter bus overvoltage is strongly connected to the degree of reactive power surplus and the size of the short-circuit capacity; the specific expression is as follows:
U r = Q s S c
where ΔUr is the amount of voltage change of the converter bus; Qs is the reactive power surplus of the converter bus; Sc is the short-circuit capacity at the sending end.
From Equation (4), because of the low short-circuit capacity of the hydrogen–wind–photovoltaic bundled-via-DC delivery system, when there is a massive reactive power excess at the sending end, the overvoltage at the converter bus will be much larger than that of the conventional thermal power system.

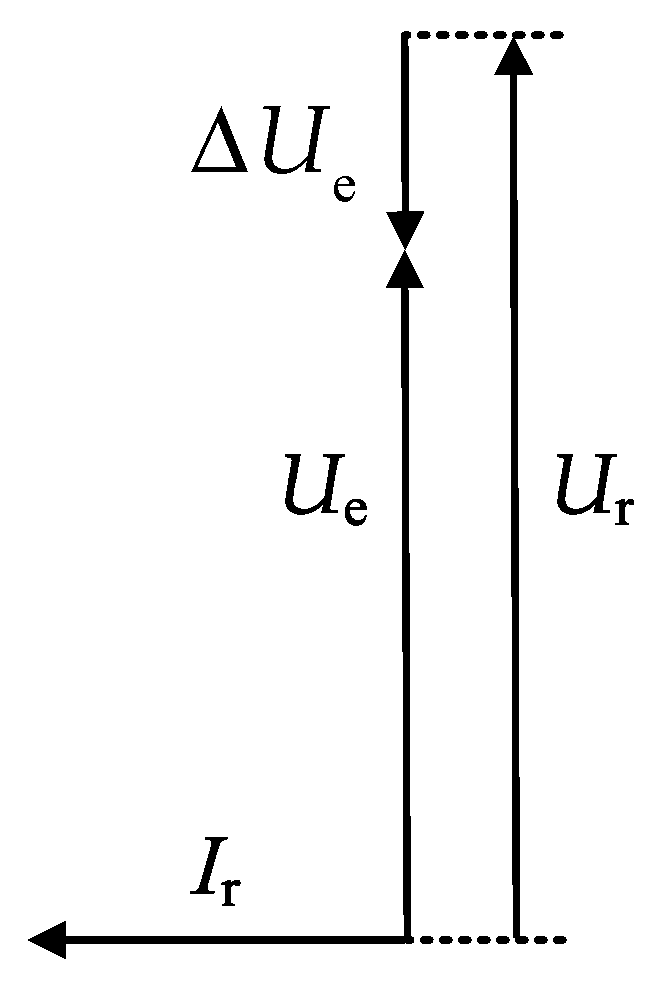
2.3. Calculation of Transient Overvoltage at the Sending End under DC Blocking after Commutation Failure

After overvoltage results from DC blocking due to commutation failure, focus is on the period when the DC has been blocked, the filter is still in operation, and the sending end power supply is still sending out reactive power. Currently, a lot of redundant reactive power gathers at the converter bus on the rectifier side, and it starts to deliver reactive power back to the AC system. Figure 2 shows the sending end voltage vector relationship during the DC power drop.
In Figure 2, Ur is the RMS value of the voltage of the converter bus; Ir is the RMS value of the current passing the equivalent reactance; Ue is the equivalent AC system’s potential; δUr is the cross component of the voltage drop; ΔUr is the longitudinal component of the voltage drop; θ is the difference of the first and last terminals of the voltage vectors.
Assuming that the equivalent AC system’s reactance is Xe and that the single-phase transmitted active and reactive power of the AC system are Qace and Pace, respectively, then the cross and longitudinal components of the voltage drop are:
δ U r = P ace X e U e U r = Q ace X e U e
Assuming that UrN is the rated voltage of the converter bus, the equivalent AC system’s potential can be calculated as:
U e = ( U rN + δ U r ) 2 + U e 2 = U rN + P ace X e U e 2 + Q ace X e U e 2
When a fault occurs leading to a decrease in DC active power, a large reactive power surplus occurs at the converter station, causing a rise in the longitudinal component of the voltage drop and a rise in the transient voltage at the converter bus. Assuming that the remaining reactive capacity is Qcb, the amount of reactive power compensation is related to the value of the transient voltage because reactive power compensation devices generally use static capacitors or filters. At the transient voltage rise, the reactive power compensation amount changes from the original Qcb to:
Q cb = U r U rN 2 Q cb
where Q cb is the amount of reactive power compensation when the transient voltage rises; U r is the transient voltage value.
At this point, the cross component of the voltage drop becomes:
U r = Q cb X e U e = U r 2 Q cb X e U rN 2 U e
Based on Figure 2, the transient overvoltage of the converter bus can be obtained as:
U r = U e Δ U r 2 + δ U r 2
The specific analytical expression for transient overvoltage during a DC power drop can be obtained by associating Equations (5)–(9) as:
U r = U rN Q ace 2 Q cb 2 X e 4 + 4 U e 3 Q cb 2 X e 2 + U e 4 U rN 4 U e 2 1 / 2 2 Q cb X e
Considering the extreme case of DC bipolar blocking, the DC active power Pdc drops to 0 and the transverse component δUr of the voltage drop is 0. Thus, the vector relationship of the system voltage at the sending end is shown in Figure 3.
At the sending end, the reactive power surplus after DC bipolar blocking Q cc is completely provided by the sending end reactive power compensation devices. It can be calculated by the following equation:
Q cc = U r 2 X e = U r U rN 2 Q cb
The specific analytical expression for transient overvoltage under DC bipolar blocking can be obtained as:
U r = U rN 2 U e U rN U e U rN 2 4 Q cb X e 2 Q cb X e
From Equation (12), the transient overvoltage is related to the reactive power compensation capacity, AC system equivalent reactance, and AC system equivalent potential.

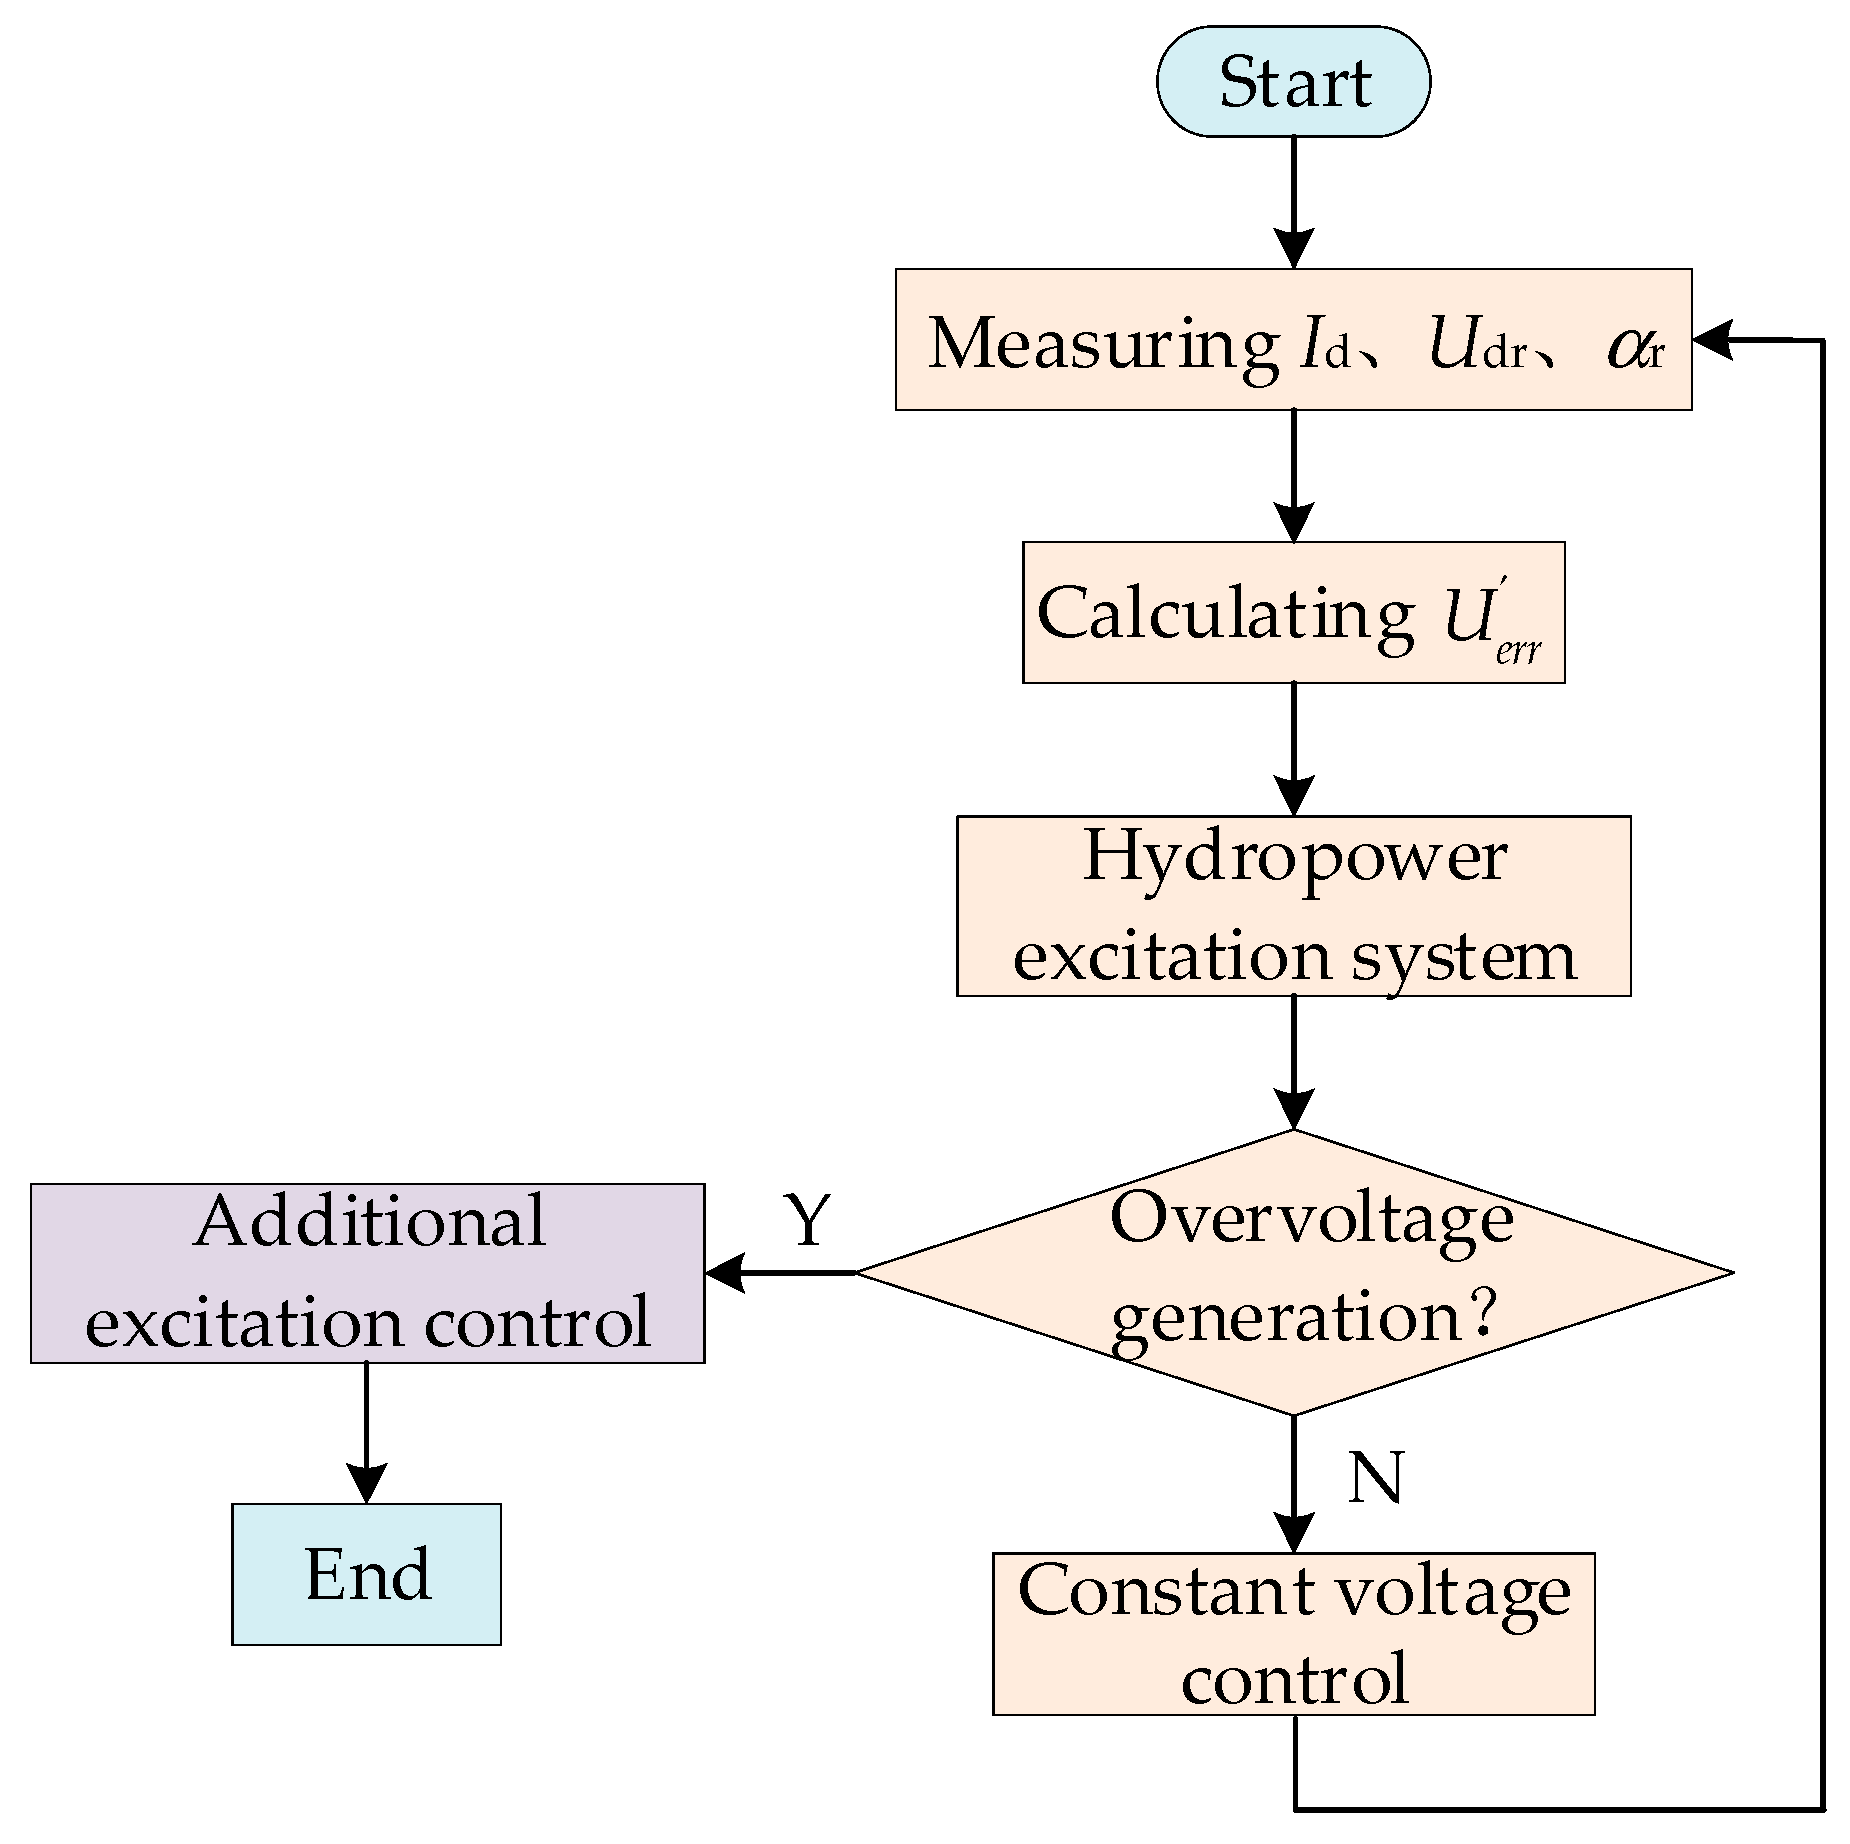
3. Coordinated Control Strategy for Overvoltage Suppression at the Sending End of Hydropower and DC System

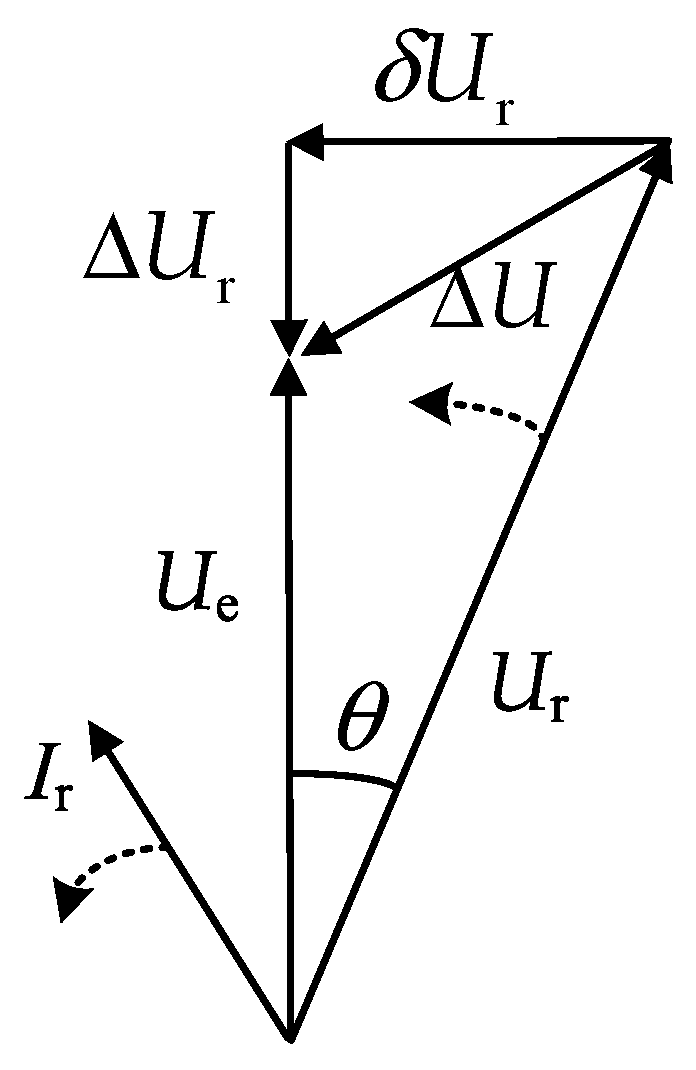
3.1. Transient Output Characteristics of Hydroelectric Units

The d-axis and q-axis components of the stator current of the hydropower unit can be described by the following equation:
i d = ( E q U q ) X d i q = ( U d E d ) X q
where E Q and E d are the synchronous machine transient potential; X Q and X d are the transient reactance; uq and ud are the hydropower unit voltage.
The reactive power Q G output from the hydropower unit satisfies the following equation:
Q G = U q i d U d i q
Combining Equations (6) and (7) yields the following equation for the relationship between QG and the transient potential of the synchronous machine, transient reactance, and voltage of the hydropower unit:
Q G = U q ( E q U q ) X d U d ( U d E d ) X q = U q E q X d + U d E d X q U q 2 X d U d 2 X q
From Equation (15), when DC blocking triggers overvoltage, the reactive power output can be reduced by the characteristics of the hydroelectric unit itself. Even when the synchronous machine transient potential will be negative, the hydro unit can absorb reactive power.
As an example, the potential source-controlled rectifier system has a very small intrinsic time constant, while the maximum excitation output voltage value depends on the AC voltage. Because of their economy and ease of maintenance, such systems are suitable for generators connected to large power systems.
The specific transfer function expression is:
E f U err = K A 1 + s T C 1 + s T F 1 + s T A 1 + s T B 1 + s T F + s K A K F 1 + s T C
where KA is the voltage regulator gain, TA, TB, and TC are time constants; KF is the stabilizing loop gain, and TF is its time constant; Ef is the excitation output voltage RMS value; Uerr is the voltage error signal RMS value.
The voltage error signal RMS value Uerr is determined by the voltage reference value Uref together with the hydropower unit voltage RMS value UTN:
U err = U ref U TN
When DC blocking causes a sudden increase in the voltage of the hydropower unit, the RMS value of the hydropower excitation output voltage, Ef, decreases rapidly. The transient potential is reduced after a time delay, thus reducing the reactive power output from the hydropower system, or even turning to absorb excess reactive power to regulate the system voltage. However, this excitation system is affected by the constant voltage control strategy, which limits to some extent the capacity of the hydropower unit to absorb reactive power. Therefore, there is still a long period of overvoltage at the sending end bus after DC blocking.

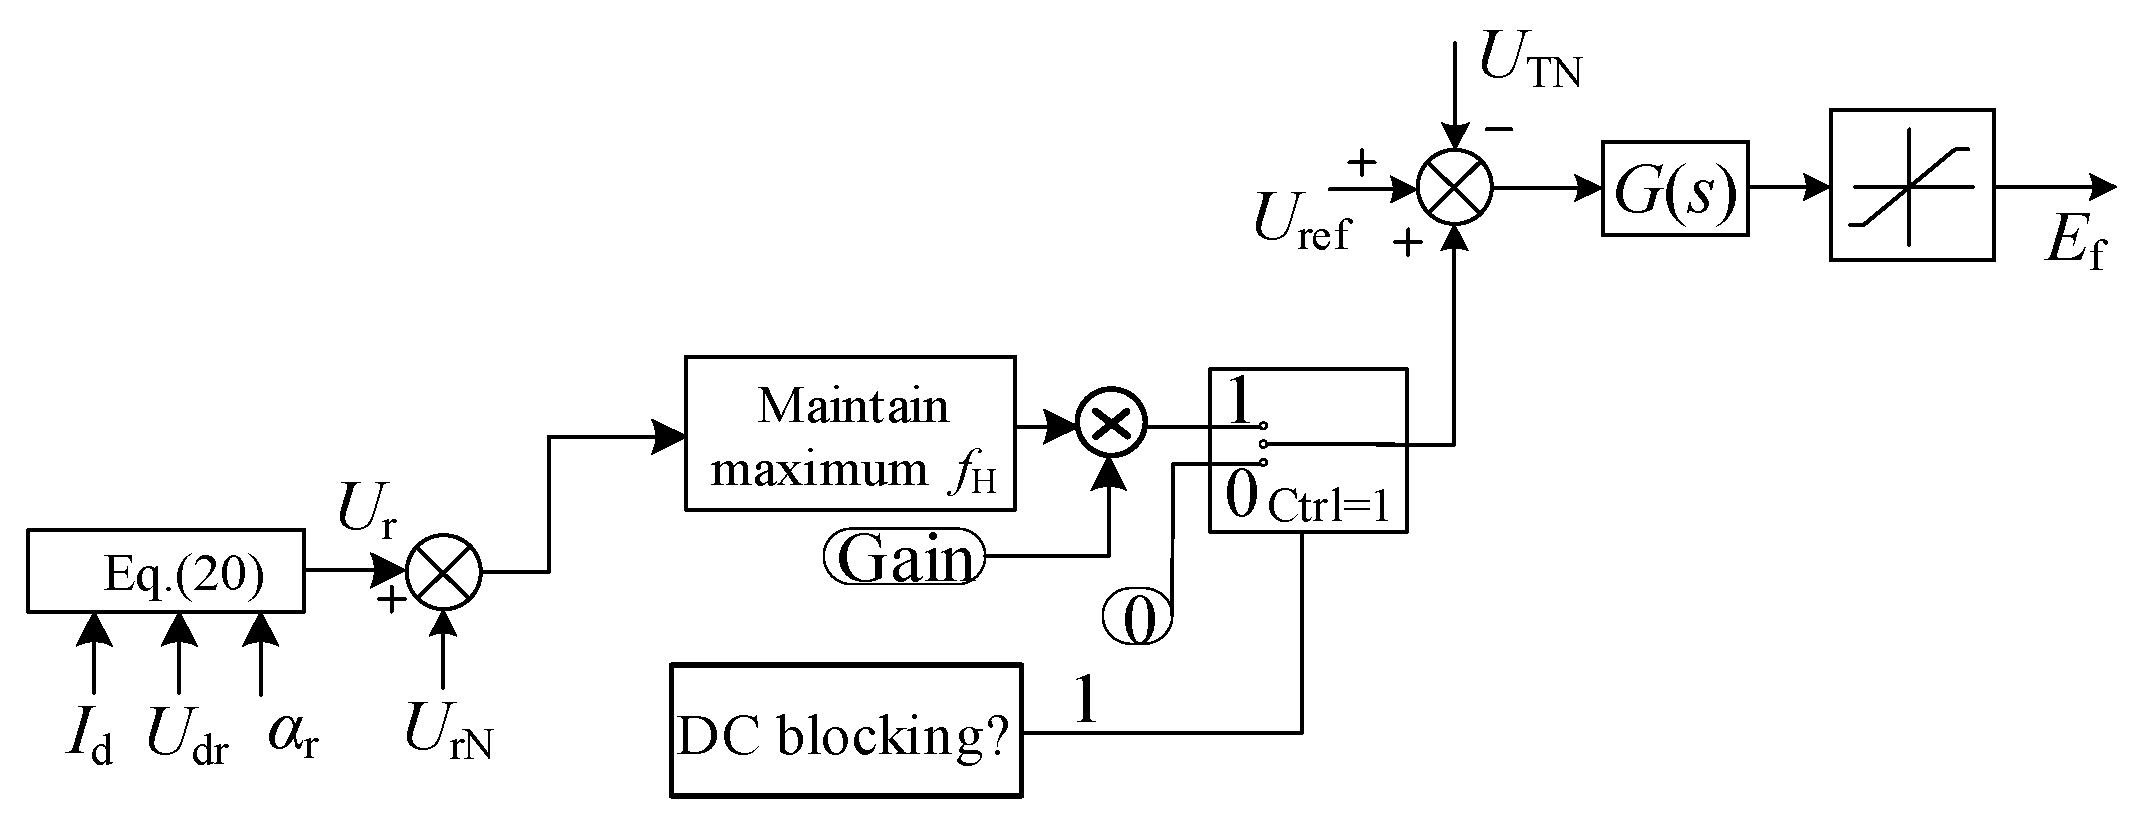
3.2. Principle of Coordinated Control Strategy

The rectifier side system consists of N groups of six pulsating converters in series per pole. During normal operation, the ideal no-load DC voltage Udor of the rectifier is:
U dor = 3 2 N U r k r π
where Ur is the RMS value of the converter bus voltage on the rectifier side; kr is the transformer ratio on the rectifier side.
Considering that the voltage and current values at the DC outlet end of the rectifier side are the first to change after a fault occurs at the receiving end, the voltage value Udr to ground at the DC outlet end is:
U dr = 2 N ( U dor cos α r I d R r )
where αr is the firing angle of the rectifier side; Rr is the equivalent commutation resistance of the converter.
Combining Equations (18) and (19) yields the following relationship between Udr and Ur:
U r = π ( U dr + 2 N I d R r ) 6 2 N 2 k r cos α r
To minimize the effect of the control delay and trigger the additional excitation control of the hydropower unit in the shortest possible time to absorb the excess reactive power, the error voltage Uerr input to the hydroelectric excitation system is converted into:
U err = U r U rN + U ref U TN = π ( U dr + 2 N I d R r ) 6 2 N 2 k r cos α r U rN + U ref U TN
After adopting the error voltage shown in Equation (21), the error voltage input to the hydroelectric excitation system can measure the rise of overvoltage after a fault occurs in the system. There is a transformation of the original single hydroelectric fixed-voltage control into a synergistic control with the converter, so that the hydropower unit can take up more reactive power to achieve the purpose of suppressing the overvoltage. The block diagram of the structure of the proposed control strategy is as follows (Figure 4):
The flowchart of the proposed strategy in this paper is shown in Figure 5. From Figure 5, U err is calculated in real time according to Equation (21). When no fault occurs, the DC delivery system maintains constant voltage control and the system maintains normal power transfer. Once a commutation failure resulting in DC blocking is detected, the system can detect overvoltage generation. After that, it is switched from constant voltage control to the additional excitation control proposed in this paper; the hydropower unit starts absorbing reactive power, and thus the overvoltage is suppressed.

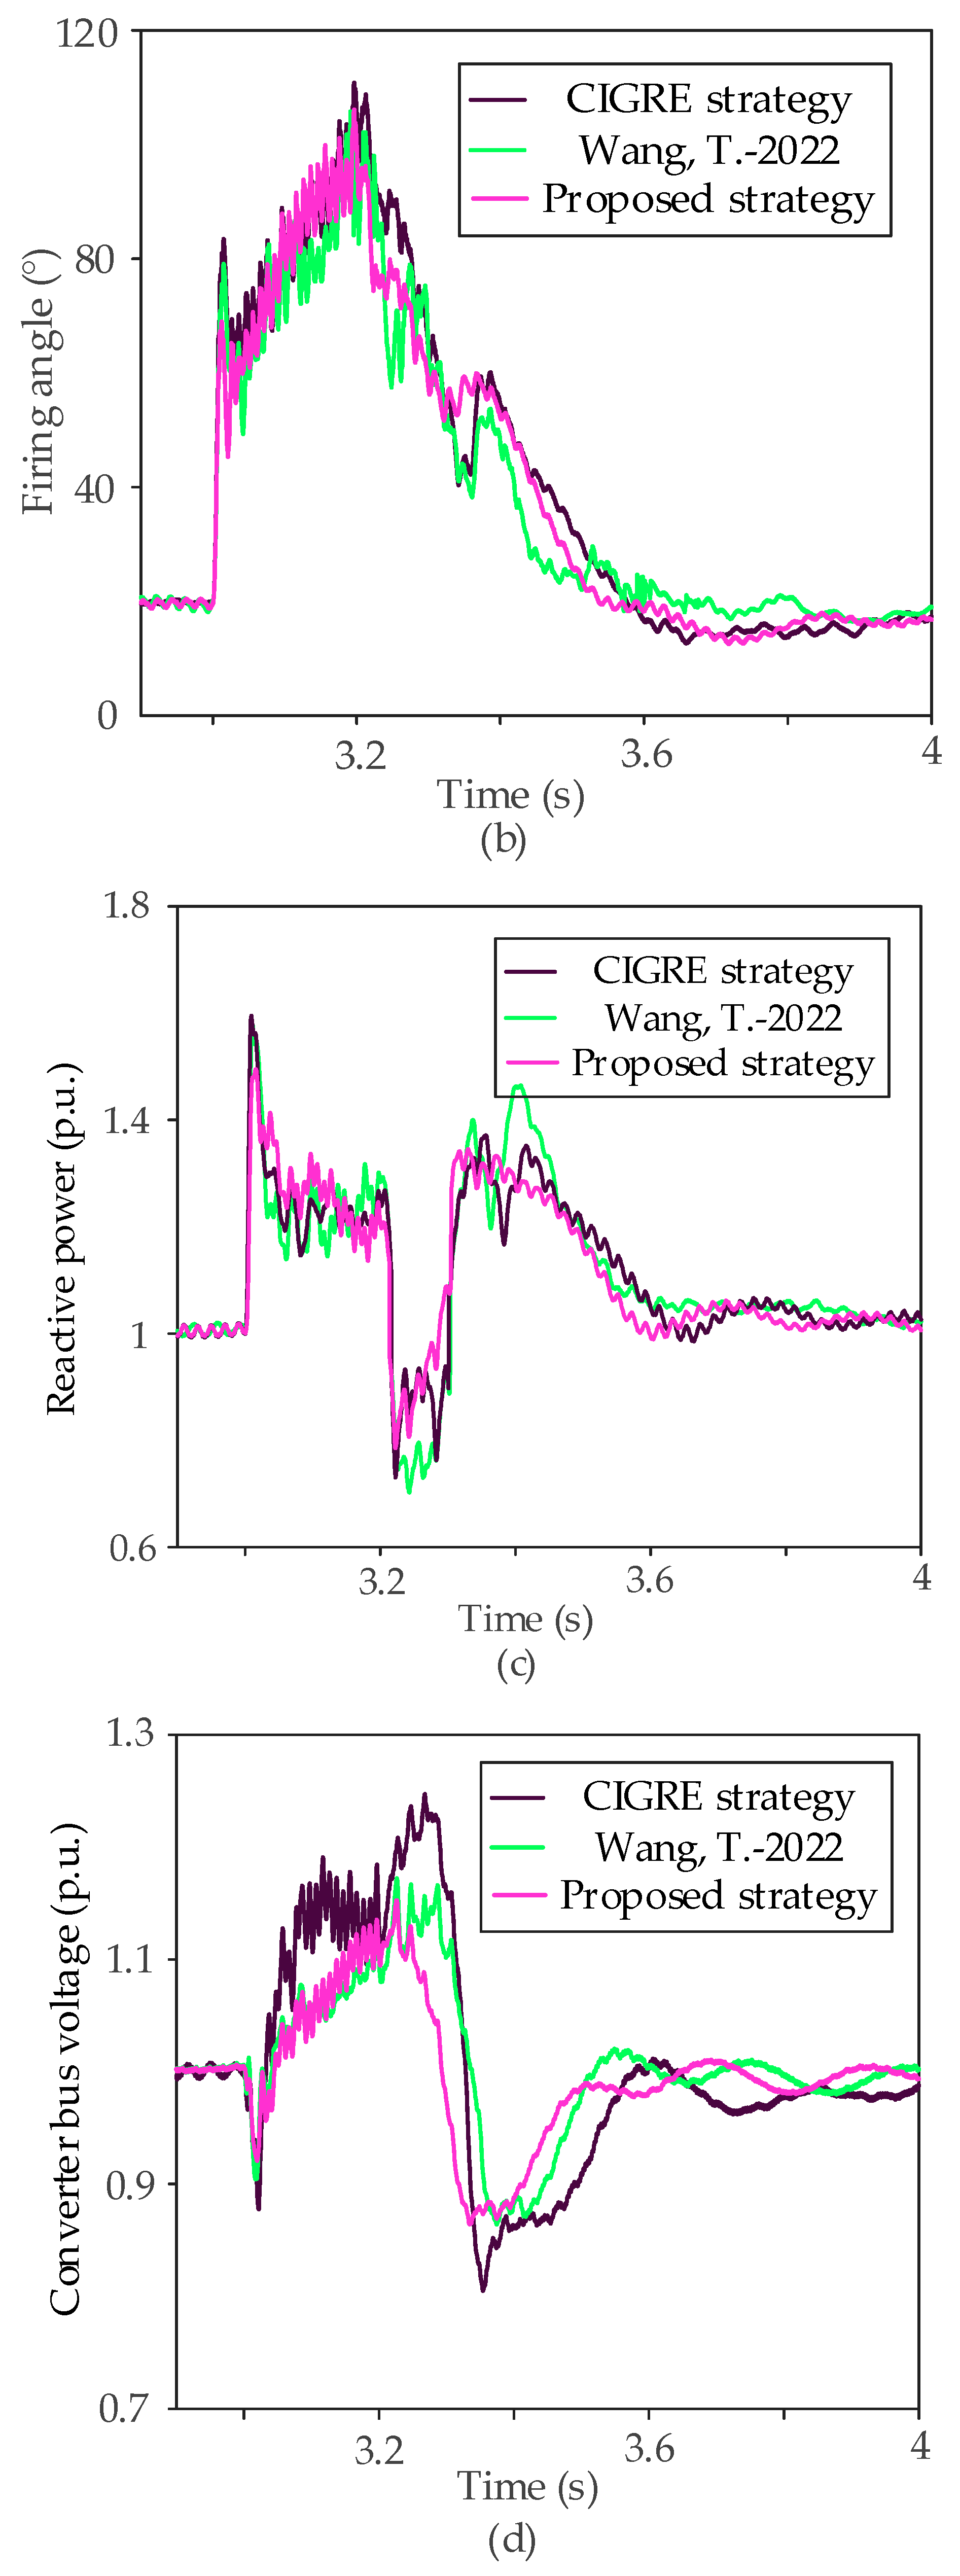
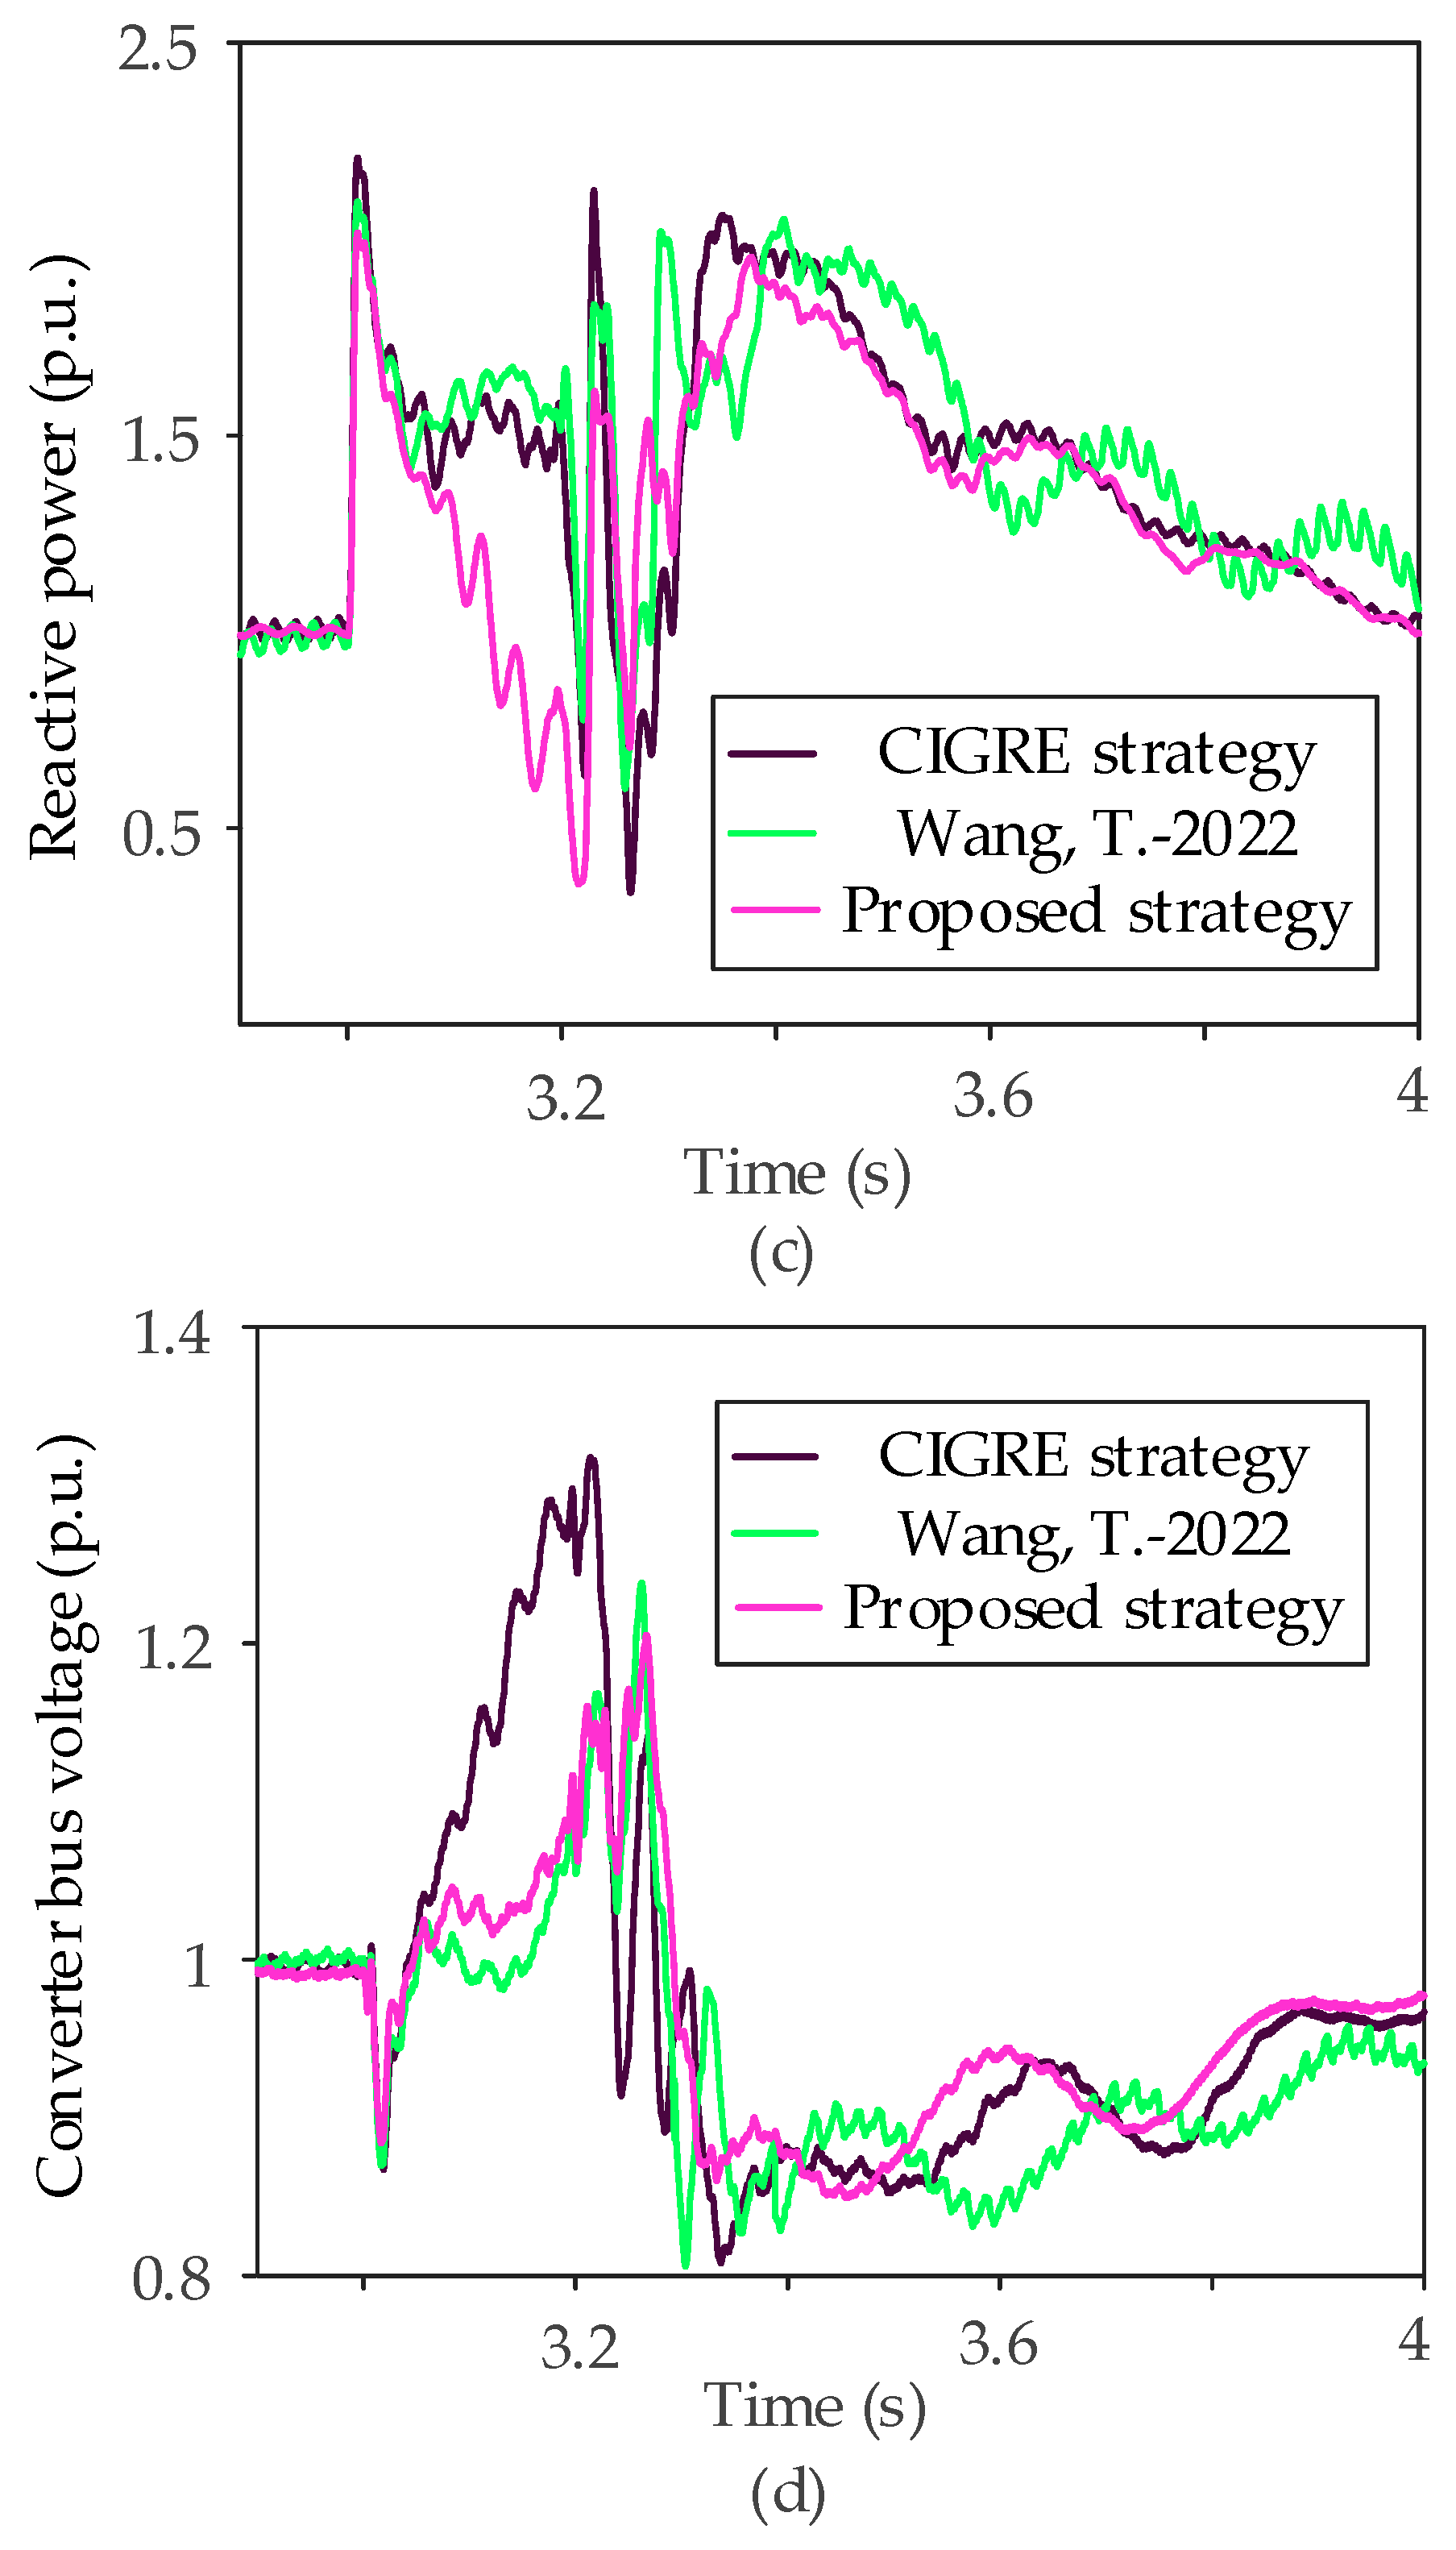
4. Simulation and Verification

To verify the effectiveness of the overvoltage suppression strategy proposed in this paper, the control model shown in Figure 4 is applied to the delivery system shown in Figure 1 for simulation analysis. The rated DC voltage is ±500 kV, and the base capacity is 1000 MW; the rated DC power is also 1000 MW. The specific parameters of the system are shown in Table 1.

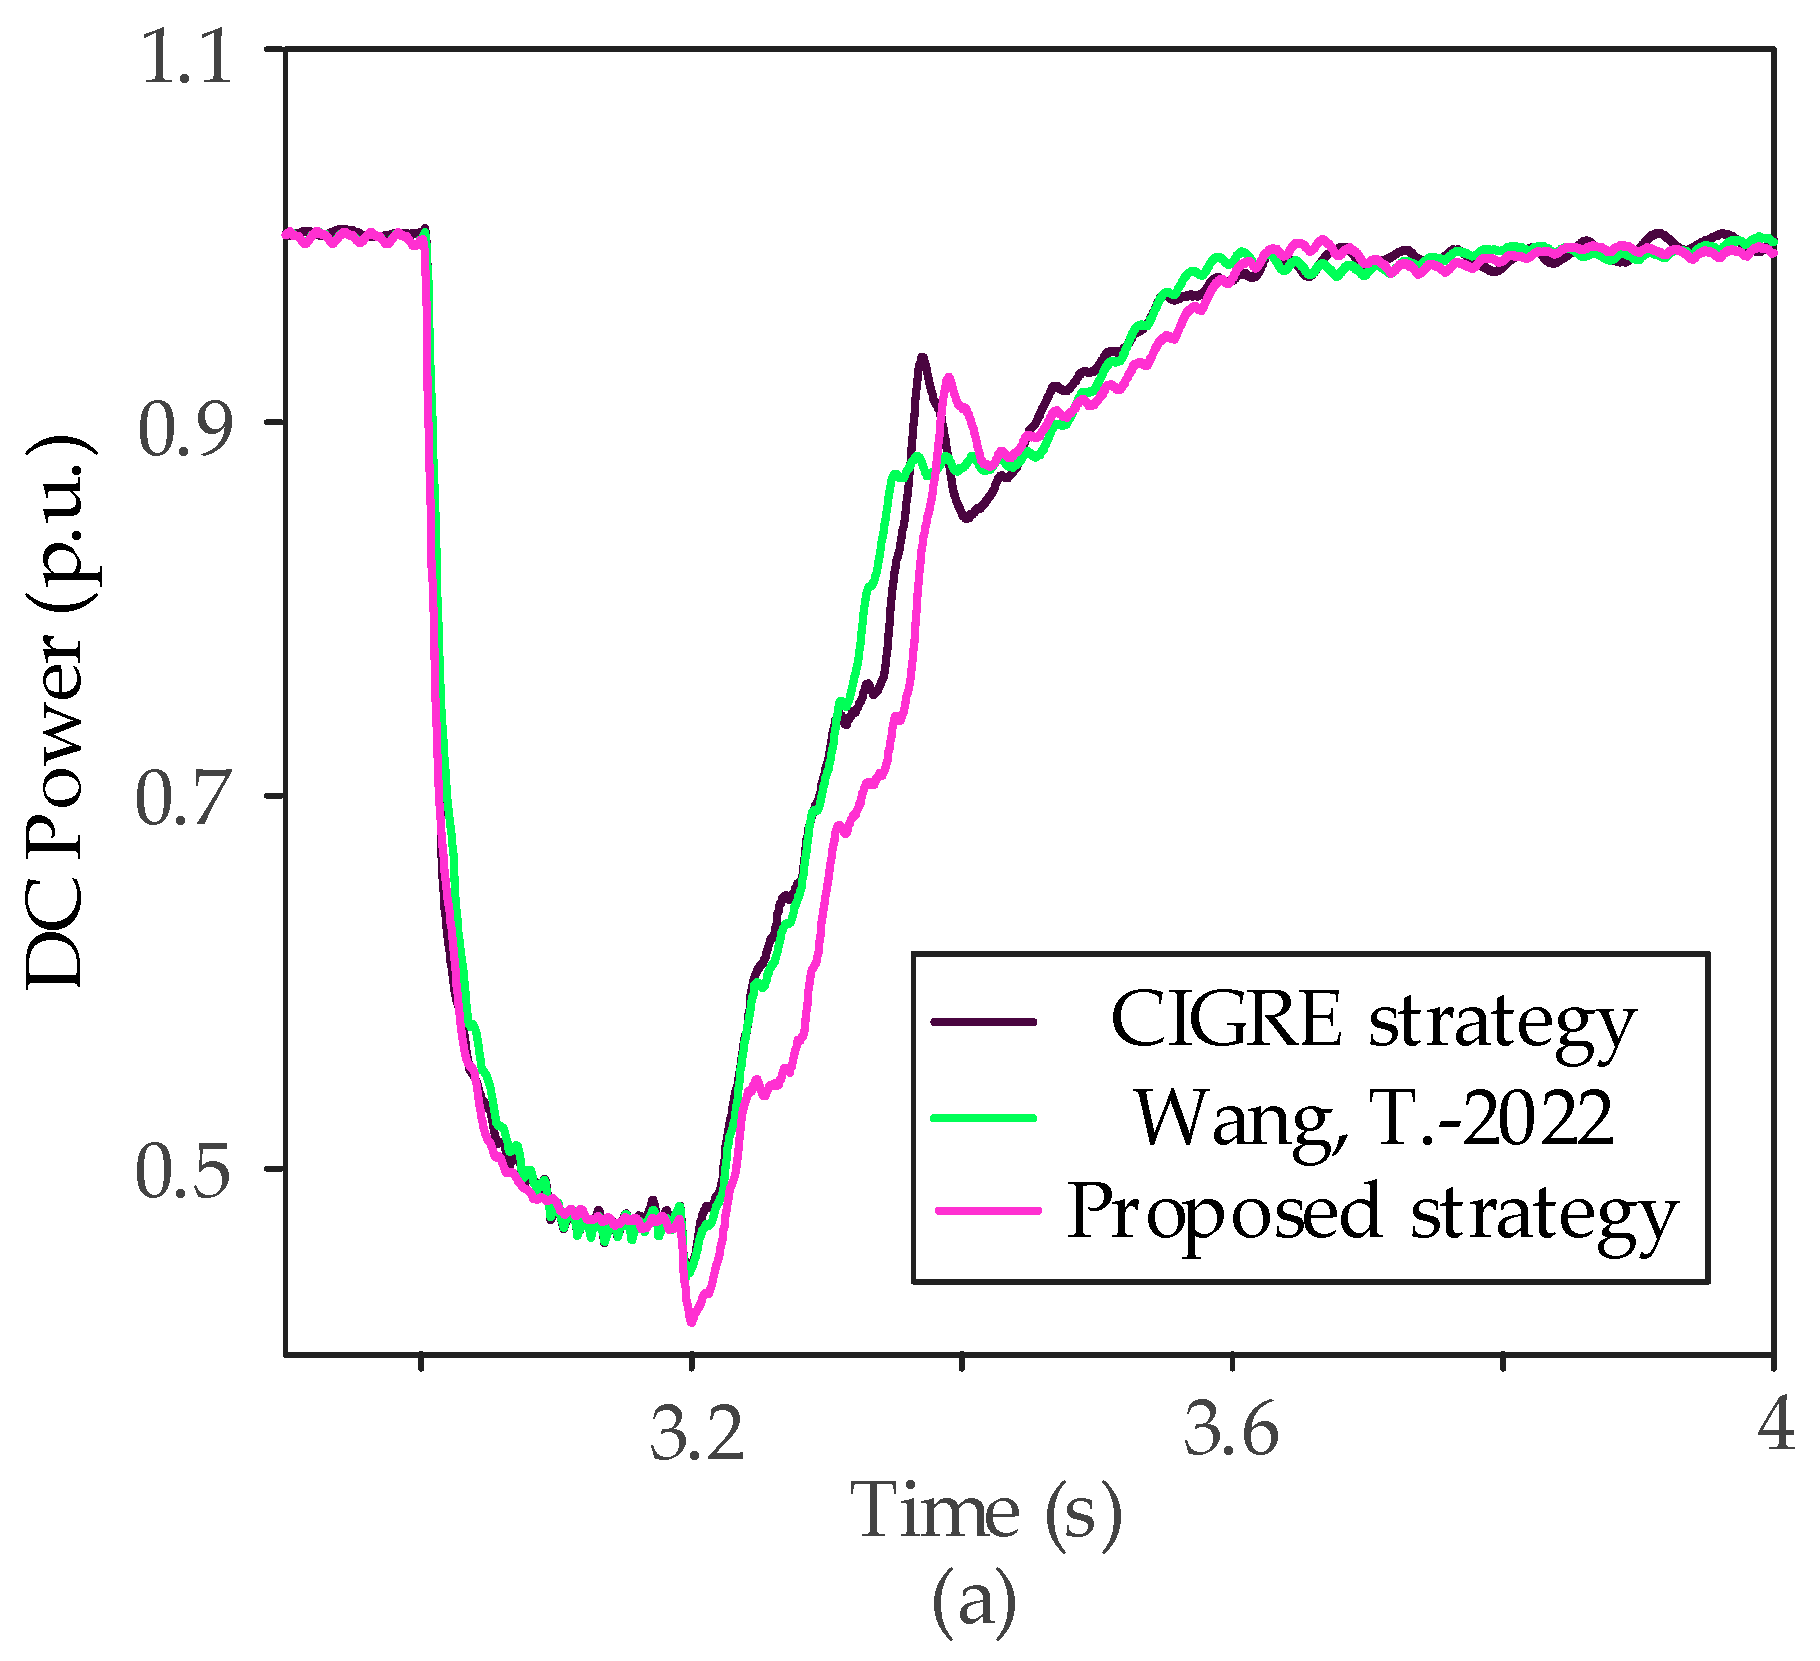
4.1. Comparison of System Operating Characteristics

To demonstrate more clearly the performance of the overvoltage suppression strategy proposed in this paper, the following three control strategies are set up for comparative analysis:
(1)
CIGRE strategy: the CIGRE standard control strategy.
(2)
Strategy [10]: the control strategy proposed in [10] (It is represented in Figure 6 and Figure 7 by Wang, T.-2022).
(3)
Proposed strategy: the coordinated control strategy proposed in this paper.
Case 1: A unipolar blocking fault occurs at setting 3 s, and the fault duration is 0.19 s. The following two control strategies are simulated and analyzed, and the changes of the main electrical parameters are shown in Figure 6.
From Figure 6, when a unipolar blocking fault occurs in the system, the DC power instantaneously falls by half and gradually recovers after a short fluctuation after fault removal. During the fault period, the system firing angle, converter bus reactive power, and bus voltage all increase.
When the CIGRE strategy is adopted, the firing angle increases instantaneously, then rises slowly, and gradually returns to normal after fault removal, with a maximum value of about 110.8°. A large amount of reactive power surplus appears in the bus at the sending end after the fault occurs, resulting in overvoltage at the converter bus, with an amplitude of about 1.243 p.u., which returns to normal after a period of fluctuation.
When Strategy [10] is adopted, the change trend of each electrical quantity is the same as above, but the degree of fluctuation is relatively small, and the maximum value of converter bus voltage is about 1.173 p.u. The reactive power surplus at the converter bus is also slightly reduced compared with the CIGRE strategy. Therefore, the adoption of Strategy [10] can reduce the overvoltage of the system to a certain extent and improve the stability of the system.
The degree of fluctuation of each electrical quantity is the smallest when the Proposed strategy is adopted. The maximum value of converter bus voltage is about 1.151 p.u., which is reduced by 0.102 p.u. compared with the control CIGRE strategy and 0.022 p.u. lower than that of Strategy [10]. Therefore, the Proposed strategy can effectively reduce the amplitude of overvoltage of the system at the sending end and improve the voltage stability of the system.
Case 2: A bipolar blocking fault occurs at 3 s, and the fault duration is 0.19 s. The following two control strategies are simulated and analyzed, and the changes of the main electrical parameters are shown in Figure 7.
From Figure 7, when the commutation failure resulting in a DC bipolar blocking fault occurs, the DC power drops to 0 instantaneously and gradually recovers after a short fluctuation after the fault disappears. During the fault period, the system firing angle, reactive power, and voltage of the sending end converter bus increase. It is worth noting that the converter bus voltage first decreases and then increases. This is owing to the lagging response of the reactive power control strategy of the grid-connected inverter, the new energy source (wind power and photovoltaics), and the AC filters that continue to emit reactive power after exiting the low voltage ride-through control, which ultimately leads to the generation of overvoltage.
When the CIGRE strategy is adopted, the firing angle increases momentarily and then rises slowly. After the fault disappears, it first falls and then increases rapidly, with a maximum value of about 131.7°, and then returns to normal after a short time of fluctuation. Meanwhile, a large amount of reactive power surplus occurs in the sending end converter bus, resulting in overvoltage at the converter bus, with an amplitude of about 1.327 p.u. The overvoltage returns to normal after a period of fluctuation and the voltage peak-to-valley difference is about 0.512 p.u. Therefore, the CIGRE strategy will undoubtedly lead to overvoltage when the commutation failure resulting in a DC bipolar blocking fault occurs.
When Strategy [10] is adopted, the change trend of firing angle is the same as above, but the maximum value is about 125.1°. The reactive power surplus at the sending end converter bus is reduced compared with the CIGRE strategy. The overvoltage magnitude at the converter bus is about 1.231 p.u., with a lower degree of fluctuation than the CIGRE strategy. The overvoltage magnitude is reduced by 0.096 p.u. compared with the CIGRE strategy. Therefore, Strategy [10] can reduce the overvoltage magnitude of the feeder system to some extent and improve the system’s voltage stability.
When the Proposed strategy is adopted, the change trend of firing angle is the same as the last two strategies. However, the maximum value of firing angle is further reduced to 118.1°, with a minimum degree of fluctuation. The reactive power surplus at the sending end converter bus is significantly reduced compared with the CIGRE strategy and Strategy [10]. The converter bus overvoltage magnitude is about 1.201 p.u. The degree of overvoltage fluctuation is the smallest of the three strategies. The overvoltage magnitude is reduced by 0.126 p.u. compared with the CIGRE strategy and 0.03 p.u. compared with Strategy [10]. Therefore, the Proposed strategy can effectively reduce the overvoltage magnitude and further reduce the degree of system voltage fluctuation.
From the above analysis, the overvoltage suppression strategy proposed in this paper can minimize the rise of the firing angle after the occurrence of the commutation failure resulting in a DC unipolar and bipolar blocking fault. Most importantly, the proposed strategy can reduce the redundant reactive power very significantly by tapping the reactive power absorption capability of the hydropower unit, which is of great significance in reducing the overvoltage. From the results of overvoltage suppression, the Proposed strategy can significantly reduce the system overvoltage by as much as 0.102 p.u. and 0.126 p.u. compared with the CIGRE strategy. This provides a new idea for practical engineering applications.

4.2. Comparison of Transient Overvoltage Suppression Rate Indexes

To more intuitively analyze the effectiveness of the coordinated control strategy proposed, the TOSR is defined to quantify the degree of overvoltage suppression of the Proposed strategy under different operating conditions, and its expression is as follows:
T O S R = U r 1 m a x U rj m a x U r 1 m a x U rN
where Ur1max is the maximum value of overvoltage of the sending end converter bus when the CIGRE strategy is adopted, and Urjmax is the maximum value of overvoltage of converter bus when Strategy [10] (j = 2) and the Proposed strategy (j = 3) are adopted.
From Equation (22), the larger the TOSR, the more significant the overvoltage suppression effect. Setting the fault of DC blocking due to commutation failure, DC unipolar blocking fault and DC bipolar blocking fault, respectively, the calculated TOSR values are shown in Table 2.
As can be seen from Table 2, regardless of the severity of system faults, the use of Strategy [10] and the Proposed strategy can effectively reduce the level of overvoltage, which is well lower than 1.3 p.u. The more serious the fault, the better the suppression effect. Meanwhile, the Proposed strategy provides better overvoltage suppression than Strategy [10]. Even in the event of the most severe fault, the Proposed strategy reduces the overvoltage to about 1.2 p.u. Therefore, the coordinated control strategy of hydropower and DC system proposed in this paper can effectively suppress the sending end overvoltage and improve the system voltage stability.

5. Conclusions

In this paper, based on analyzing the principle of overvoltage at the sending end caused by commutation failure and the calculation method of overvoltage, a coordinated control strategy for suppressing overvoltage at the sending end of hydropower and DC system is proposed. The following conclusions are obtained after theoretical analysis and simulation verification:
(1)
Hydropower units can reduce reactive power output by lowering the excitation voltage, or even turn to absorb reactive power, thus reducing the system overvoltage. However, this ability is limited by its own constant voltage control strategy, which reduces the ability to suppress overvoltage to a certain extent.
(2)
Adopting the coordinated control strategy of hydropower and DC system proposed in this paper can strengthen the ability of the hydropower unit to absorb excess reactive power and effectively reduce the overvoltage amplitude of the sending end converter bus.
When the coordinated control strategy is proposed in this paper, the hydropower unit adjacent to the converter station is selected, and its ability of absorbing reactive power and emergency voltage regulation is tapped, which can quickly and effectively suppress the system overvoltage. In practical engineering, there are clean energy and thermal power units bundled by DC transmission. Therefore, the coordinated control strategy of thermal power units can be further studied for suppressing the transient overvoltage at the delivery end of the system.

Author Contributions

Conceptualization, X.W. and B.C.; methodology, H.S.; software, P.S.; validation, W.Z., Y.L. and J.L.; formal analysis, W.Z.; investigation, X.W.; resources, B.C.; data curation, W.Z.; writing—original draft preparation, W.Z., J.L. and Y.L.; writing—review and editing, W.Z. and Y.L.; visualization, Y.W. and J.L.; supervision, Y.W.; project administration, Y.W.; funding acquisition, J.L. All authors have read and agreed to the published version of the manuscript.

Funding

This research received no external funding.

Data Availability Statement

All data are contained within the article.

Conflicts of Interest

Authors Xiaorong Wu and Bin Cao were employed by the company Sichuan Electric Power Design & Consulting Co., Ltd. Authors Huabo Shi and Peng Shi were employed by the company State Grid Sichuan Electric Power Company Electric Power Research Institute. The remaining authors declare that the research was conducted in the absence of any commercial or financial relationships that could be construed as a potential conflict of interest.

References

  1. Li, Y. Technology and Practice of the Operation Control of Large Power Grid Connected with Weak AC Area. Power Syst. Technol. 2016, 40, 3756–3760. [Google Scholar]
  2. Mirsaeidi, S.; Dong, X.; Tzelepis, D.; Mat Said, D.; Dysko, A.; Booth, C. A Predictive Control Strategy for Mitigation of Commutation Failure in LCC-based HVDC Systems. IEEE Trans. Power Electron. 2019, 34, 160–172. [Google Scholar] [CrossRef]
  3. Yao, L.Z.; Wu, J.; Wang, Z.B. Pattern Analysis of Future HVDC Grid Development. Proc. CSEE 2014, 34, 6007–6020. [Google Scholar]
  4. Dong, X.; Guan, E.; Jing, L.; Wang, H.; Mirsaeidi, S. Simulation and Analysis of Cascading Faults in Hybrid AC/DC Power Grids. Int. J. Elect. Power Energy Syst. 2020, 115, 105492. [Google Scholar] [CrossRef]
  5. Gao, B.F.; Yang, J.; Song, S.L. Coordinated Control Strategy of Hydropower Units for Restraining Overvoltage of Renewable Energy Generation System Integrated With HVDC. Proc. CSEE 2021, 41, 6212–6224. [Google Scholar]
  6. Chen, G.P.; Li, M.J.; Xu, T. Practice and Challenge of Renewable Energy Development Based on Interconnected Power Grids. Power Syst. Technol. 2017, 41, 3095–3103. [Google Scholar]
  7. Wang, S.Y.; Xu, S.Y.; Sun, H.D. Overvoltage of the Power System Integrated with High Proportion of Power Electronics Equipment (III)—Mechanistic Analysis of Temporary Power Frequency Overvoltage Caused by DC Fault. Available online: https://doi.org/10.13334/j.0258-8013.pcsee.222403 (accessed on 16 February 2024).
  8. Niu, T.; Guo, Q.L.; Sun, H.B. Autonomous Voltage Security Regions to Prevent Cascading Trip Faults in Wind Turbine Generators. IEEE Trans. Sustain. Energy 2016, 7, 1306–1316. [Google Scholar] [CrossRef]
  9. Yin, C.Y.; Li, F.T. Analytical Expression on Transient Overvoltage Peak Value of Converter Bus Caused by DC Faults. IEEE Trans. Power Syst. 2021, 36, 2741–2744. [Google Scholar] [CrossRef]
  10. Wang, T.; Pei, L.; Wang, J.M. Overvoltage Suppression under Commutation Failure Based on Improved Voltage-Dependent Current Order Limiter Control Strategy. IEEE Trans. Ind. Appl. 2022, 58, 4914–4922. [Google Scholar] [CrossRef]
  11. Yuan, Y.; Wei, Z.; Wang, H.; Lei, X.; Sun, G. A DC Current Predictive Control Based Method to Decrease Probability of Commutation Failure. Power Syst. Technol. 2014, 38, 565–570. [Google Scholar]
  12. Mirsaeidi, S.; Dong, X. An Enhanced Strategy to Inhibit Commutation Failure in Line-Commutated Converters. IEEE Trans. Ind. Electron. 2020, 67, 340–349. [Google Scholar] [CrossRef]
  13. Liu, X.Y.; Li, X.W.; Jiao, D.H. Theoretical Study on Control Strategy of Grid-Connected High Voltage Ride through in Doubly-Fed Wind Farm. IEEE Access 2019, 7, 107453–107464. [Google Scholar] [CrossRef]
  14. Zhou, C.P.; Wang, Z.; Ju, P. High-Voltage Ride Through Strategy for DFIG Considering Converter Blocking of HVDC System. J. Mod. Power Syst. Clean Energy 2020, 8, 491–498. [Google Scholar] [CrossRef]
  15. Zhang, K.; Geng, G.C.; Jiang, Q.Y. Online Tracking of Reactive Power Reserve for Wind Farms. IEEE Trans. Sustain. Energy 2020, 11, 1100–1102. [Google Scholar] [CrossRef]
  16. Liu, J.S.; Li, F.T.; Yin, C.Y. Mechanism of and Suppression Strategy for Transient Voltage Fluctuation in the Commutator Bus of a Hybrid Cascaded DC System Caused by Commutation Failure. Power Syst. Prot. Control 2023, 51, 36–46. [Google Scholar]
  17. Tu, J.; Zhang, S.; Ma, S.; Liu, M.; Yi, J.; Luo, X.; He, Q. Mechanism Analysis and Control Measures of Wind Turbine Generators Tripping Caused by HVDC Contingencies. In Proceedings of the 12th IET International Conference on AC and DC Power Transmission (ACDC 2016), Beijing, China, 28–29 May 2016. [Google Scholar]
  18. Aamir, A.; Qiao, L.; Guo, C.; Rehman, A.U.; Yang, Z. Impact of Synchronous Condenser on the Dynamic Behavior of LCC-Based UHVDC System Hierarchically Connected to AC System. CSEE J. Power Energy Syst. 2019, 5, 190–198. [Google Scholar] [CrossRef]
  19. Yin, C.; Li, F. Reactive Power Control Strategy for Inhibiting Transient Overvoltage Caused by Commutation Failure. IEEE Trans. Power Syst. 2021, 36, 4764–4777. [Google Scholar] [CrossRef]
  20. Yin, C.; Li, F.; Wang, D.; Liu, Y.; Fu, L. Research on Stability Control Scheme for AC/DC Hybrid Transmission System with Wind Power High Permeability under DC Blocking. Power Syst. Prot. Control 2019, 47, 95–102. [Google Scholar]
  21. He, J.; Zhuang, W.; Xu, T.; Huo, C.; Jiang, W. Study on Cascading Tripping Risk of Wind Turbines Caused by Transient Overvoltage and Its Countermeasures. Power Syst. Technol. 2016, 40, 1839–1844. [Google Scholar]
  22. Ding, M.; Zhang, Y.; Han, P.P. Research of Urgent Control Strategy under HVDC Block for Wind-Thermal-Bundled Sending End System. Acta Energiae Solaris Sin. 2019, 40, 1928–1937. [Google Scholar]
Figure 1. The new energy bundled-via-DC delivery model.
Electronics 13 01223 g001
Figure 2. Voltage vector diagram of the sending system during the DC power drop.
Electronics 13 01223 g002
Figure 3. Voltage vector diagram of the sending end after DC bipolar blocking.
Electronics 13 01223 g003
Figure 4. Block diagram of the proposed control strategy.
Electronics 13 01223 g004
Figure 5. Flowchart of the proposed strategy.
Electronics 13 01223 g005
Figure 6. Characterization of system operation under unipolar blocking fault: (a) DC power; (b) firing angle; (c) reactive power of the converter bus at the sending end; (d) converter bus voltage at the sending end.
Electronics 13 01223 g006aElectronics 13 01223 g006b
Figure 7. Characterization of system operation under bipolar blocking fault: (a) DC power; (b) firing angle; (c) reactive power of the converter bus at the sending end; (d) converter bus voltage at the sending end.
Electronics 13 01223 g007aElectronics 13 01223 g007b
Table 1. Parameters of the system.
ParameterNumerical Value/p.u.ParameterNumerical Value/p.u.
UrN1 X d 0.3121
kr1.26 X q 0.6452
Rr1kA40
N2KF0.01
Table 2. System’s TOSR under different faults.
Fault TypeUr1max/p.u.Ur2max/p.u.TOSRUr3max/p.u.TOSR
Commutation failure1.1761.13423.86%1.11335.80%
DC unipolar blocking fault1.2431.17328.81%1.15137.86%
DC bipolar blocking fault1.3271.23129.36%1.20138.53%
Disclaimer/Publisher’s Note: The statements, opinions and data contained in all publications are solely those of the individual author(s) and contributor(s) and not of MDPI and/or the editor(s). MDPI and/or the editor(s) disclaim responsibility for any injury to people or property resulting from any ideas, methods, instructions or products referred to in the content.

