Abstract
The cost-effectiveness, compact size, and inherent flexibility of UAV technology have garnered significant attention. Utilizing sensors, UAVs capture ground-based targets, offering a novel perspective for aerial target detection and data collection. However, traditional UAV aerial image recognition techniques suffer from various drawbacks, including limited payload capacity, resulting in insufficient computing power, low recognition accuracy due to small target sizes in images, and missed detections caused by dense target arrangements. To address these challenges, this study proposes a lightweight UAV image target detection method based on YOLOv8, named Aero-YOLO. The specific approach involves replacing the original Conv module with GSConv and substituting the C2f module with C3 to reduce model parameters, extend the receptive field, and enhance computational efficiency. Furthermore, the introduction of the CoordAtt and shuffle attention mechanisms enhances feature extraction, which is particularly beneficial for detecting small vehicles from a UAV perspective. Lastly, three new parameter specifications for YOLOv8 are proposed to meet the requirements of different application scenarios. Experimental evaluations were conducted on the UAV-ROD and VisDrone2019 datasets. The results demonstrate that the algorithm proposed in this study improves the accuracy and speed of vehicle and pedestrian detection, exhibiting robust performance across various angles, heights, and imaging conditions.
1. Introduction
In recent years, unmanned aerial vehicles (UAVs) have emerged as a burgeoning technology owing to their advantages of low cost, compact size, and operational flexibility (the abbreviations corresponding to all phrases can be found in Appendix A) [1,2]. Serving as ideal tools for low-altitude aerial photography, these UAVs utilize sensors to effortlessly capture ground targets, thereby acquiring images with enhanced maneuverability. This technological advancement has provided novel solutions across various domains, significantly improving the efficiency of aerial target detection and the precision of data collection.
The rapid advancement of UAV technology is spurred by the concerted efforts of remote sensing departments and agricultural sectors across several nations. UAVs play a pivotal role in multiple domains, including security monitoring [3], aerial photography [4], high-speed deliveries [5], wildlife conservation [6], agriculture [7], and transportation systems [8]. Nevertheless, owing to the flexibility of UAVs, capturing vehicle exteriors and dimensions presents substantial variations (e.g., as depicted in Figure 1), allowing image capture from diverse perspectives and heights, leading to intricate and diverse backgrounds.
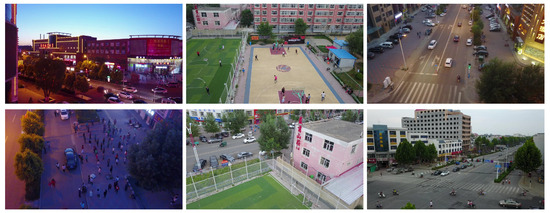
Figure 1.
Examples of unmanned aerial vehicle images in the VisDrone dataset, including images with varied and complex backgrounds, weather conditions, and lighting, as well as varying vehicle appearances and sizes.
Traditional algorithms encounter challenges in target detection due to insufficiently prominent target features, resulting in slow detection speeds, low accuracy, and susceptibility to false positives and negatives. In contrast, the You Only Look Once (YOLO) model has garnered significant attention for its outstanding accuracy and real-time performance, markedly enhancing both detection precision and speed, thus playing a pivotal role in target detection. However, the size and weight limitations of UAVs restrict the performance of onboard computing devices, necessitating the reduction of computational and storage expenses while maintaining superior detection performance.
Previous UAV visual recognition has often relied on larger models to improve recognition rates due to imaging issues with UAV images [9,10,11]. Simultaneously, the lack of information points in images often requires lowering predictive confidence to enhance model generalization. However, reducing confidence levels may lead to issues like erroneous fitting of picture data. To address this challenge, this paper introduces a lightweight UAV vehicle recognition algorithm based on the YOLOv8 model, termed Aero-YOLO. The key contributions of this research can be summarized as follows:
- The replacement of the original Conv module [12] with Grouped Separable Convolution (GSConv) led to a reduction in model parameters, an expanded receptive field, and improved computational efficiency.
- The incorporation of the CoordAtt and shuffle attention [13] mechanisms bolstered feature extraction, particularly benefiting the detection of small or obstructed vehicles from the perspective of unmanned aerial vehicles.
- After comparative analysis with Adaptive Moment Estimation (Adam) [14], the selection of Stochastic Gradient Descent (SGD) as the optimizer resulted in superior performance in model convergence and overall efficiency.
- Substituting the original CSPDarknet53 to Two-Stage FPN (C2f) module with C3 resulted in a lightweight structure for the model.
- Building upon the existing parameters of YOLOv8, three new parameter specifications were introduced, namely Aero-YOLO (extreme), Aero-YOLO (ultra), and Aero-YOLO (omega).
We conducted comparative experiments using the UAV-ROD [15] and VisDrone2019 datasets [16]. Our comparative analysis demonstrated that our proposed method significantly outperforms existing detection models and current mainstream parameter models. Furthermore, we conducted specific ablation experiments on the VisDrone2019 dataset to validate the feasibility and effectiveness of our proposed network optimization methods. The results indicated that Aero-YOLO significantly enhances the performance of unmanned aerial vehicle visual recognition models, even when utilizing the same or fewer network model parameters.
2. Related Works
Target detection has long been a focal point in the field of computer vision [17], aiming to accurately identify and locate objects, discern their categorical attributes, and precisely determine their positions within images. With the advent of deep learning and the widespread deployment of surveillance cameras [18], object detection has garnered heightened importance. Broadly, object detection algorithms are typically categorized into two-stage and one-stage approaches, differing fundamentally in their processing stages. Two-stage algorithms involve the use of separate networks for region proposal and classification/regression tasks. A classic example of a two-stage approach is the Faster R-CNN [19], which relies on region-based convolutional neural networks. In contrast, single-stage methods like YOLO [20], SSD [21], and RetinaNet [22] utilize a single network to directly classify bounding boxes and perform adjustments using anchor points.
One of the most representative algorithms among one-stage detectors is the YOLO series. YOLO employs convolutional neural networks to extract image features and directly predicts bounding boxes and categories by generating anchored boxes, thereby enabling real-time object detection. YOLOv2 [23] replaced the original YOLO’s Google Inception Net (GoogleNet) with Darknet-19, while YOLOv3 [24] upgraded Darknet-19 to Darknet-53 and adopted a multi-scale framework with residual connections from ResNet [25]. YOLOv4 [26] combined CSPNet [27], the Darknet-53 framework, CIoU loss [28], and the Mish activation function [29] to enhance performance. YOLOv5 integrated various architectures mentioned earlier and offered multiple choices in terms of inference speed, accuracy, and computational cost. YOLOv8 [30], released in January 2023, incorporated updates from YOLOv5 [31], which are discussed in this paper.
The rapid development of deep learning-based object detection models has led some scholars to apply their enhanced versions to object detection in drone imagery. Traditional UAV aerial image recognition techniques suffer from limitations in computing power due to the restricted payload of UAVs, resulting in low recognition accuracy for small target sizes and missed detections in densely populated areas. Maintaining a balance between detection accuracy and inference efficiency remains crucial. Ruiqian Zhang et al. [32] proposed a multiscale adversarial network to address the diversity challenges in UAV imagery, integrating deep convolutional feature extractors, multiscale discriminators, and a vehicle detection network, significantly enhancing vehicle detection performance. Seongkyun Han et al. [33] designed DRFBNet300, incorporating deeper receptive field block (DRFB) modules to improve feature map expressiveness for detecting small objects in UAV images. Mohamed Lamine Mekhalfi et al. [34] introduced CapsNets to tackle complex object detection issues in UAV images, accurately extracting hierarchical positional information compared to traditional convolutional neural networks, thereby improving object detection accuracy and computational efficiency. Z. Fang et al. [35] proposed a dual-source detection model, DViTDet, based on Vision Transformer Detector (ViTDet), leveraging Transformer networks to extract features from various sources and employing feature fusion to utilize cross-source information. They demonstrated that combining CNNs and Transformer networks can extract richer features.
These previous models still suffer from issues such as low detection accuracy, inefficient computational performance, and inadequate detection capabilities for small objects to some extent. Our research aims to address these challenges by proposing Aero-YOLO, a lightweight UAV vehicle detection model based on YOLOv8. By incorporating advanced modules like the CoordAtt attention mechanism, shuffle attention mechanism, and GSConv, we enhance YOLOv8. It is anticipated that this optimized object detection framework will exhibit significant advantages in UAV vehicle and pedestrian recognition.
3. Materials and Methods
3.1. Aero-YOLO Model Architecture
Aero-YOLO represents an enhanced version of the YOLOv8 model tailored for UAV target detection tasks. Its architectural design is illustrated in Figure 2. Aero-YOLO integrates GSConv and C3 in its backbone to reduce network computational overhead. Moreover, it capitalizes on two attention mechanisms, CoordAtt and shuffle attention, significantly reinforcing the feature extraction capability, which is particularly advantageous for detecting small or obstructed vehicles from a UAV perspective.
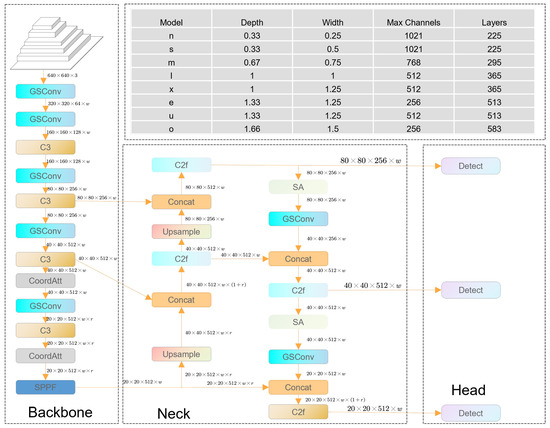
Figure 2.
The architecture of Aero-YOLO.
The overall framework of Aero-YOLO comprises four parts: input, backbone, neck, and head. The input section of the Aero-YOLO network primarily manages image scaling, data augmentation, adaptive anchor computation, and adaptive image scaling. The default input image size is set at 640 × 640 × 3. Its backbone consists of GSConv modules, C3 modules, CoordAtt attention mechanisms, and Spatial Pyramid Pooling Fusion (SPPF) modules. In the network’s head, the original Conv module is replaced with GSConv, and shuffle attention mechanisms are added before two GSConv modules. In comparison with related products like YOLOv8, Aero-YOLO achieves an optimal balance between detection accuracy and computational cost.
3.1.1. Object Detection Framework
The YOLO model architecture stands as one of the prominent object detection algorithms currently in use. YOLOv8 has exhibited commendable results in terms of speed and accuracy. Considering the vehicle recognition performance and resource constraints in UAVs [36], we opted for YOLOv8 as our foundational model for research. As the latest state-of-the-art (SOTA) model, it offers both object detection and instance segmentation capabilities, presenting various scale models to adapt to diverse scene requirements. Compared to its predecessors, YOLOv8 introduces structural changes, including adjustments in certain bottleneck structures, adopting an anchor-free approach with decoupled heads, and modifications in top-layer activation functions. It leverages multiple loss functions such as binary cross-entropy for classification loss and CloU and distribution focal loss for localization loss [37], while optimizing data augmentation strategies to enhance accuracy. For output bounding boxes, it employs post-processing techniques like non-maximum suppression (NMS) to filter out detections in regions lacking significance, reducing redundant and overlapping boxes for more precise results.
Despite YOLOv8 demonstrating commendable performance, deploying it on lightweight agile UAVs presents challenges due to computational requirements, larger model sizes, and significant variations in captured vehicle appearances and sizes. To enhance detection performance concerning scale variations and computational costs, Aero-YOLO modifies the network structure in two aspects.
3.1.2. Lightweight Network Optimization
In the original YOLOv8 backbone, the intermediate feature maps from conventional convolutions exhibited significant redundancy, contributing to increased computational costs. The challenge lay in reducing algorithmic overhead while preserving algorithm performance. This section proposes modifications to two modules to minimize algorithmic costs.
GSConv emerges as the preferred choice for optimizing lightweight networks by reducing model parameters, broadening receptive fields, and enhancing computational efficiency. Replacing standard convolutional layers, GSConv bolsters the network’s feature extraction capabilities. Research indicates that integrating GSConv throughout the network notably augments depth while reducing inference speeds. This module’s structure encompasses Conv, DWConv, Concat, and shuffle operations [38]. The structure of the GSConv module is shown in Figure 3. The input feature map, derived from standard convolutions, yields half the channel count as output channels. Retaining the channel count through depth-wise separable convolutions, the channels are then merged to restore the original count, finally outputting the results via the shuffle module. Combining group convolutions with depth-wise separable convolutions, GSConv intensifies feature extraction and fusion abilities, facilitating better capture of crucial vehicle features in images. Simultaneously, it slashes computational and parameter counts by approximately 30% to 50%, sidestepping redundant information and complex calculations. The computational complexity of GSConv, compared to standard convolutions, is expressed as
where W and H denote the output feature map’s width and height, and refer to the convolution kernel’s size, signifies the kernel’s channel count, and stands for the output feature map’s channel count. When is substantial, GSConv’s computational complexity approaches 50% of SC. In the original backbone network of YOLOv8, the intermediate feature maps from conventional convolution computations exhibit significant redundancy, resulting in increased computational costs. Addressing the challenge of reducing algorithmic expenditure while preserving algorithm performance is the focus of this section, achieved through modifications in two modules.
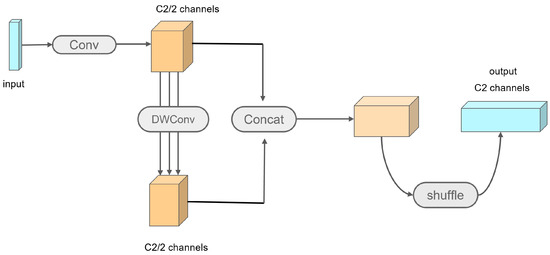
Figure 3.
Structure of the GSConv module.
Simultaneously, the basic structure of the C3 and C2f modules follows a Cross-Stage Partial Network (CSP) architecture, differing primarily in the selection of correction units. While C3 provides feature expressiveness requisite for vehicle detection tasks, it maintains a lighter structure more suitable for drone deployment. Consequently, the C2f module has been supplanted by the C3 module, effectively reducing computational burdens while sustaining high performance. The module’s structure, as depicted in Figure 4, routes the feature map into two paths after entering C3: the left path traverses a Conv and a bottleneck, while the right path undergoes a single Conv operation. Eventually, the outputs from both paths are concatenated and processed through another Conv layer. Within C3, the three Conv modules, each being a 1 × 1 convolution, handle dimensionality reduction or expansion. The bottleneck in the backbone employs residual connections comprising two Convs: the first is a 1 × 1 convolution, halving the channel count, followed by a 3 × 3 convolution, doubling the channel count. This initial reduction aids the convolutional kernel in better grasping feature information, while the subsequent expansion enables the extraction of more detailed features. Finally, the residual structure, combining the input and output, prevents gradient vanishing issues.

Figure 4.
Structure of the C3 module.
3.1.3. Feature Extraction Optimization
To enhance vehicle detection accuracy in drone-captured scenes, we introduce two pivotal attention mechanisms: CoordAtt and shuffle attention. These mechanisms aim to bolster the model’s ability to identify smaller or occluded vehicles, thereby enhancing detection performance from the drone’s perspective. Below, we detail our attention mechanisms and explore their roles and advantages within the optimized lightweight network.
Primarily, a CoordAtt module is incorporated after each C3 module with the aim of directing the model’s attention to features at different locations, which is particularly significant for addressing small vehicles or local regions that may appear in the UAV perspective. The network structure of the CoordAtt module is illustrated in Figure 5.

Figure 5.
The schematic diagram of the CoordAtt module.
CoordAtt integrates positional data within channel attention, skillfully avoiding two-dimensional global pooling by decomposing channel attention into two one-dimensional feature encodings [39]. This approach astutely aggregates the input features into two independently directional-aware feature maps, vertically and horizontally. These maps not only embed directional information but also capture long-range spatial dependencies along the spatial axis through two attention maps generated by encoding. Eventually, multiplying these two attention maps with the input feature map highlights the expressions of the regions of interest.
While embedding coordinate information, the challenge of retaining positional data arises in global pooling. Hence, capturing through horizontal and vertical decomposed pooling is executed. Specifically, for each feature output, representation occurs as follows:
where H and W represent the height and width of the pooling kernel. These transformations aggregate features from two spatial directions, forming a pair of directional-aware feature maps while capturing dependencies and preserving positional information.
The generation of coordinated attention undergoes concatenation, followed by subsequent 1 × 1 convolutions. Spatial data in both vertical and horizontal spaces are encoded through BatchNorm and nonlinear activations. These encoded data are segmented and then adjusted in channel size using another 1 × 1 convolution to align with the input. The entire process concludes by normalizing and weighted fusion through the sigmoid function:
where represents the input feature map, whereas and denote attention weights in two spatial directions.
Subsequently, the introduction of the channel attention mechanism, namely shuffle attention, is implemented. This mechanism aids in enhancing the network’s efficiency in utilizing features from different channels. By rearranging and integrating feature channels, shuffle attention directs the network’s focus toward crucial channel information, contributing to improved feature distinctiveness, especially in scenarios involving occluded vehicles. The network structure of the shuffle attention module is illustrated in Figure 6.
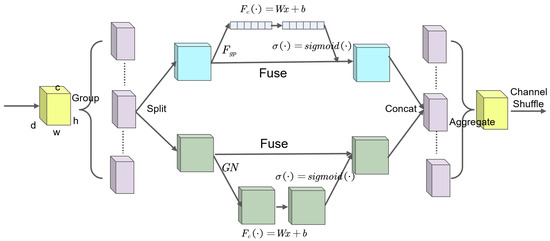
Figure 6.
Structure of the shuffle attention module.
For the task of drone-based vehicle recognition, the SA module implements an innovative and efficient attention mechanism by embedding positional information into channel attention [40]. To retain this information, the module abstains from utilizing 2D global pooling, instead proposing the decomposition of channel attention into two parallel 1D feature encodings. This approach aggregates the input features into two directional-aware feature maps along both the vertical and horizontal axes. These feature maps encompass embedded direction-specific information, encoding it into two attention maps, each capturing long-range spatial dependencies of the input feature map. Thus, positional information is stored within the generated attention maps. Finally, the product of these two attention maps is applied to the input feature map, emphasizing the expressions of the regions of interest.
For a given input feature map , C, H, and W represent the number of channels, height, and width, respectively. Initially, the feature map X is segmented into G groups along the channel dimension, denoted as , with . Subsequently, each group is further divided into two branches along the channel direction, . One branch leverages inter-channel relationships to generate a channel attention map, while the other branch employs spatial attention maps between features.
Regarding channel attention, shuffle attention employs a lightweight strategy [41], combining global average pooling, scaling, and an activation function to achieve a balance between speed and precision in the drone environment. The specific mathematical formulations are as follows:
where represents the network’s trainable parameters and denotes the sigmoid activation function.
Concerning spatial attention, to complement channel attention, group normalization operations are introduced. The specific mathematical expression is outlined below:
where represents the network’s trainable parameters and indicates the sigmoid activation function.
Following attention learning and feature recalibration, aggregation of the two branches is required to obtain . Then, aggregation of all sub-features and channel mash operations are performed.
Through the introduction of these two attention mechanisms, the model aims to better capture crucial features in drone-captured scenes, enhancing the accuracy in detecting small or obscured vehicles.
3.2. The Model Parameters of Aero-YOLO
For Aero-YOLO, we introduce three new sets of model parameters: Aero-YOLO (extreme), Aero-YOLO (ultra), and Aero-YOLO (omega). The parameter models of Aero-YOLO are presented in Table 1. They strike a balance between model performance and computational complexity, offering adaptability and versatility across various application scenarios.

Table 1.
Summary of Aero-YOLO models by depth, width, max. channels, and layers.
- Aero-YOLO (extreme): Prioritizes performance enhancement while focusing on improving computational efficiency. It involves a moderate reduction in model size, suitable for resource-constrained scenarios with extensive datasets.
- Aero-YOLO (ultra): Aims to achieve a comprehensive balance by adjusting the proportions of depth, width, and channel numbers. This adjustment seeks the optimal equilibrium among performance, computational complexity, and resource utilization, suitable for general-purpose application scenarios.
- Aero-YOLO (omega): Emphasizes maintaining high performance while reducing computational complexity. It concentrates on optimizing extreme scenarios and complex environments within object detection to achieve more precise detection and localization.
The introduction of these three parameter models enriches the selection range of Aero-YOLO, better meeting diverse requirements across different tasks and environments. The subsequent versions of Aero-YOLO, namely Aero-YOLO (omega), Aero-YOLO (ultra), and Aero-YOLO (extreme), are abbreviated as Aero-YOLOo, Aero-YOLOu, and Aero-YOLOe, respectively. To provide a clearer demonstration of the model’s architecture, the parameters of the backbone and head layers of the Aero-YOLO model are displayed in Table 2 and Table 3.

Table 2.
Aero-YOLO’s backbone layer parameters.

Table 3.
Aero-YOLO’s head layer parameters.
4. Experiments and Results
4.1. Datasets and Experimental Details
4.1.1. VisDrone2019 Dataset
The VisDrone2019 dataset, collected by the AISkyEye team at Tianjin University, stands as a significant dataset for object detection. It comprises images captured from drone perspectives, along with corresponding annotation files, serving the purpose of training and evaluating computer vision algorithms. With over 10,000 images, it includes 6471 training, 548 validation, 1610 test, and 1580 competition images. The images exhibit diverse sizes ranging from 2000 × 1500 to 480 × 360, encompassing scenes spanning streets, squares, parks, schools, and residential areas, with shooting conditions varying from ample daytime lighting to inadequate nighttime lighting, cloudy, strong light, and glare. The detailed annotation files meticulously catalog ten different object categories depicted in the images, such as pedestrians, bicycles, cars, trucks, tricycles, canopy tricycles, buses, and motorcycles.
4.1.2. UAV-ROD Dataset
The UAV-ROD dataset comprises 1577 images, encompassing 30,090 annotated vehicle instances delineated by oriented bounding boxes. Image resolutions are set at 1920 × 1080 and 2720 × 1530 pixels, with drone flight altitudes ranging from 30 to 80 m. Encompassing diverse scenes such as urban roads, parking lots, and residential areas, the dataset provides a rich array of visual contexts. It is segmented into training and testing subsets, comprising 1150 and 427 images, respectively.
4.1.3. Experimental Environment
In this study, experiments were conducted using PyTorch 2.0.0 based on GPU for the experimental setup. PyTorch utilizes CUDA 11.8 to support the parallel computation of the YOLOv8 deep learning model. Leveraging GPU and CUDA, we accelerated the computational processes and employed the PyTorch framework for model construction and training. For the detailed configuration specifics of the experimental setup, refer to Table 4.

Table 4.
Experimental setting.
4.1.4. Evaluation Metrics
This study conducted a comprehensive assessment of the proposed method, examining its performance in terms of detection accuracy and model parameter size. Multiple metrics were utilized to evaluate the model performance, including precision (P), recall (R), average precision (AP), F1-score, and mean average precision (mAP). P gauges the accuracy of the model in predicting positive classes, whereas R measures the model’s capability to identify true-positive classes. The F1-score is a comprehensive metric that balances precision and recall, representing their harmonic mean. AP signifies the area enclosed by the precision–recall curve, offering an assessment of overall model performance. Additionally, mAP measures the average precision across all object categories, providing a holistic view to evaluate the model’s performance in recognizing multiple classes. The equations for these metrics are illustrated in Formulas (1)–(5):
Furthermore, the number of model parameters (Params) represents the count of parameters (i.e., weights) the model uses to learn patterns from training data; more parameters indicate increased model complexity. The Giga Floating-Point Operations (GFLOPs) is a unit used to measure the total number of floating-point operations performed in a computer, where 1 GFLOP is equivalent to Floating-Point Operations (FLOPs). GFLOPs is commonly used to assess the computational requirements of deep learning models, especially in tasks that demand substantial computing resources. The Frames per Second (FPS) metric signifies the speed at which the model analyzes images during target detection, serving as an indicator of its detection efficiency. Evaluating the real-time performance of the model in detection tasks allows for the examination of the dynamic relationship between accuracy and FPS. Consequently, both FPS and accuracy play pivotal roles in determining the model’s applicability in practical scenarios.
4.2. Results on the VisDrone2019 Dataset
A series of experiments was conducted on the VisDrone2019 dataset to showcase the advantages of the proposed architecture. Comparative experiments involved widely used methods like YOLOv5, YOLOv8 improved with MobileNetv3, MobileNetv2-SSD [42], the method proposed by Li et al. [43], and the original YOLOv8. Apart from the standard YOLOv8 model, we presented three novel parameter configurations—Aero-YOLOe, Aero-YOLOu, and Aero-YOLOo—with all training and testing processes employing identical default runtime settings and image processing rules.
Figure 7 illustrates the performance of various experimental models concerning their AP values. On the VisDrone dataset, the Aero-YOLO network consistently leads in almost all precision metrics. The assessment distinctly indicates that the Aero-YOLO series outperforms both the YOLOv5 and fundamental YOLOv8 models. Notably, Aero-YOLOe, Aero-YOLOu, and Aero-YOLOo exhibit significant improvements, emphasizing their prowess in object detection. For instance, Aero-YOLOe achieves an mAP@0.5 of 0.434, marking a 9.0% increase over the baseline YOLOv5l and a 4.6% rise over the YOLOv8l-based model.
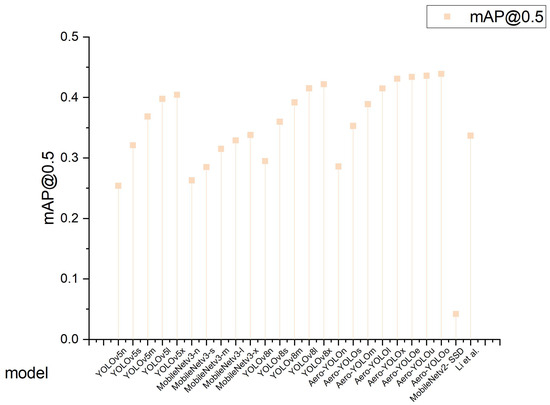
Figure 7.
Vertical drop lines of mAP@50 for various models (MobileNetv2-SSD [42]; Li et al. [43]).
Figure 8 showcases the performance of all experimental models in terms of F1 and P values. The Aero-YOLO series demonstrates a pronounced advantage in F1 values. For example, Aero-YOLOo, Aero-YOLOu, and Aero-YOLOe all achieve an F1-score of 0.47, surpassing the performance of YOLOv5, the MobileNetv3 series, and the basic YOLOv8 model. Compared to the baseline YOLOv5l, the F1-score shows an improvement of 6.8% and a 2.1% increase relative to the YOLOv8l-based model. This signifies the superior performance of the Aero-YOLO model in balancing precision and recall. In terms of R values, the Aero-YOLO series exhibits competitiveness, surpassing other models. Aero-YOLOe achieves an R value of 0.63, marking a 6.8% improvement over the baseline YOLOv5l and a 3.2% increase over the YOLOv8l-based model. The overall trend indicates a proportional increase in R values with the increment of the model scale.
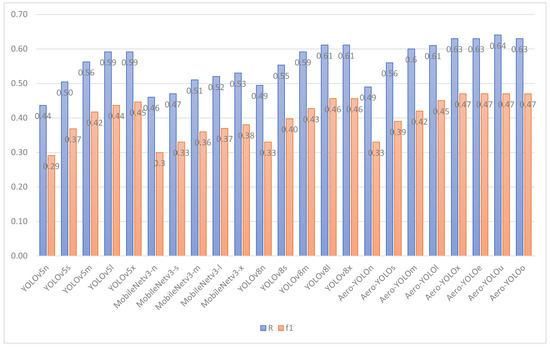
Figure 8.
F1-score and precision bar charts.
To further explore the complexity and computational efficiency of our proposed method, Figure 9 illustrates the Params, GFLOPs, and FPS. Compared to the baseline YOLOv8 model, Aero-YOLO exhibits reductions of approximately 23% in the Params and 22% in the GFLOPs, and it also demonstrates a significant advantage in FPS. These improvements stem from Aero-YOLO’s substitution of the original YOLOv8 Conv and C2f modules with GSConv and C3f modules, resulting in a more streamlined model structure. The adoption of Aero-YOLO significantly alleviates the computational burden on-board drones and achieves a well-balanced lightweight model, ideal for resource-constrained environments such as unmanned aerial vehicles.
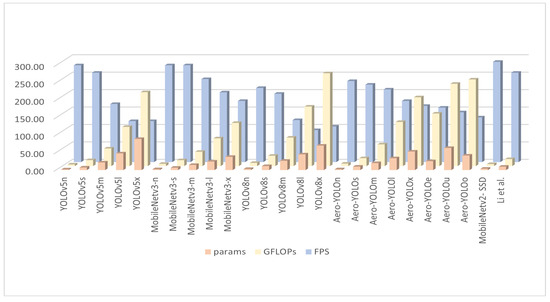
Figure 9.
Params, GFLOPs, and FPS bar charts (MobileNetv2-SSD [42]; Li et al. [43]).
Overall, Aero-YOLO performed exceptionally well in drone vehicle detection tasks, reducing the Params and GFLOPs while improving model accuracy, showcasing the effectiveness of our model in experimental settings.
The experimental outcomes of our Aero-YOLO model are visually depicted in Figure 10 and Figure 11, with detected objects delineated by rectangles and annotated with their predicted categories. Figure 10 showcases selected instances of vehicles under various conditions, encompassing both daytime and nighttime scenarios, as well as diverse angles and altitudes. The majority of vehicles in these images were accurately detected. Particularly notable is our algorithm’s capability to identify vehicles partially obscured at image edges or occluded, underscoring its robust ability to detect vehicle objects from UAV images.
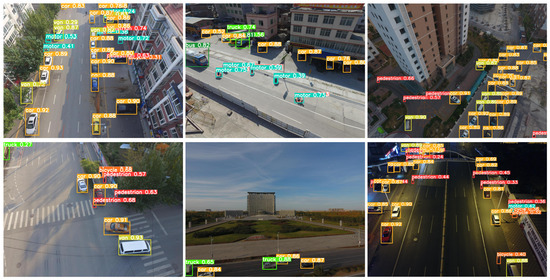
Figure 10.
Samples of vehicle recognition under varying lighting and weather conditions and crowded backgrounds were collected.
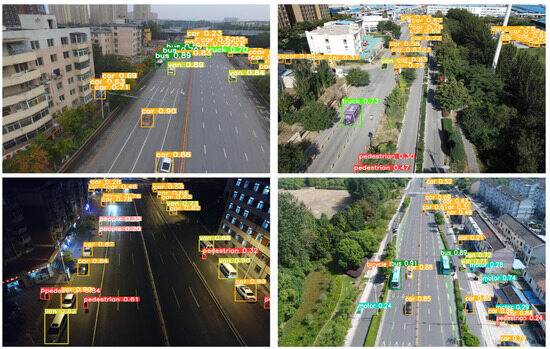
Figure 11.
Samples of vehicle recognition under varying lighting and weather conditions and crowded backgrounds were collected.
In Figure 11, images exhibiting erroneous detections or undetected elements are presented. It can be observed that most false detections occurred in images captured from high altitudes and those containing vehicles with significant size disparities, indicating the potential for improvement in the proposed detector. Further inspection reveals instances of missed detections in many distant, densely packed vehicles and small targets, emphasizing the ongoing challenge of detecting occluded objects. Moreover, certain real objects were inaccurately labeled; for instance, in the first image of the last row in Figure 11, a trash bin was misidentified as a pedestrian. We acknowledge that mislabeled real objects might impact the model’s training and experimental evaluations. However, rectifying all labels within this training dataset poses a challenging task.
4.3. Results on the UAV-ROD Dataset
Based on the results presented in Table 5, comparative experiments were conducted on the UAV-ROD dataset using the Aero-YOLO model. As the model size increased from Aero-YOLOn to Aero-YOLOo, there was an improvement in accuracy, albeit accompanied by a proportional increase in model parameters and computational complexity. Concurrently, the Aero-YOLO model demonstrated superiority across most metrics, particularly excelling in mAP50-95 compared to other models. Compared to the YOLOv8 series and other popular object detection models, Aero-YOLO exhibits better performance, further validating its significant advantage in the field of unmanned aerial vehicle object detection, especially concerning small object handling and high-precision detection.

Table 5.
Comparison experiment of Aero-YOLO on the UAV-ROD dataset.
Figure 12 presents selected visualizations from the UAV-ROD dataset, showcasing our method’s precise vehicle detection across various backgrounds, encompassing urban roads, residential areas, and roadsides. Even among densely packed vehicles, our approach adeptly discriminated each vehicle.
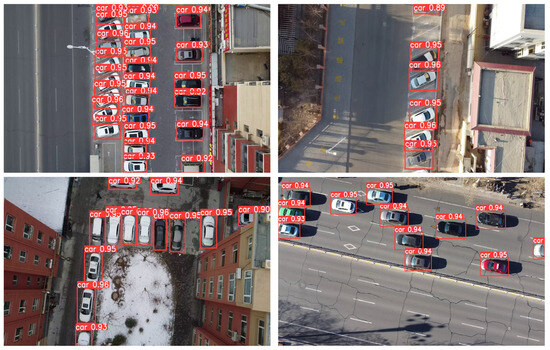
Figure 12.
Visual demonstrations of precise vehicle detection across diverse backgrounds in the UAV-ROD dataset.
4.4. Ablation Experiments
A series of ablation experiments was conducted on the VisDrone dataset to investigate the impact of different network structures on the final detection outcomes. The results are summarized in Table 6. We sequentially modified the networks with the GSConv, C3, double shuffle attention, and CoordAtt modules while changing the optimizer to SGD, leading to the development of Aero-YOLO. Each model underwent metric evaluation on the VisDrone2019-Val dataset under consistent hyperparameters: input image size of 640 × 640, batch size set to 8 for all models, and training epochs fixed at 100.

Table 6.
Ablation experiment of Aero-YOLO on the VisDrone2019 dataset.
Replacing YOLOv8’s Conv module with GSConv and C2f with C3 notably decreased both the GFLOPs and Params, resulting in a marginal decline in the mAP@0.5, F1, and R metrics. Striking a balance between model size and performance in aerial imagery, where sacrificing a slight performance margin facilitated substantial reductions in the GFLOPs and Params, emerged as a more significant consideration. Integrating a dual-layer shuffle attention mechanism into YOLOv8’s head segment saw a maximum 6.9% improvement in mAP@50, enhancing recognition of intricate details in specialized vehicles and thereby augmenting detection capabilities. The comparison between the Adam [44] and SGD optimizers indicated superior model performance with SGD.
To seamlessly incorporate the CoordAtt module into the backbone network, parameter adjustments were executed without inflating the GFLOPs or Params. However, improvements in the R, mAP@0.5, and F1 metrics demonstrated the efficacy of the CoordAtt module modifications in enhancing detection accuracy.
Overall, the Aero-YOLO series maintains relatively high detection performance while reducing model parameters, showcasing its potential and advantages in lightweight object detection.
5. Conclusions and Future Outlook
The realm of aviation imagery poses numerous challenges, encompassing small target sizes, low resolution, occlusions, variations in pose, and scale, all significantly impacting the performance of many object detectors. Throughout the detection process, there remains a perpetual need to strike a balance between accuracy and inference efficiency. In response to this challenge, we introduce Aero-YOLO, an unmanned aerial vehicle (UAV) object detection algorithm. We propose three novel parameter configurations aimed at bolstering feature extraction capabilities while concurrently reducing computational requirements. Specifically, we replace the C2f module in the backbone network with C3, substitute the Conv module with GSConv, and introduce the CoordAtt and shuffle attention mechanisms in both the backbone and head.
When evaluated on the VisDrone2019 dataset using the parameter specifications (n, s, m, l, x) of YOLOv8, Aero-YOLO exhibits a 23% reduction in parameters while maintaining close proximity to its F1, R, and mAP@50 metrics. Under the new parameter settings, Aero-YOLOe aligns its parameter count with YOLOv8m, yet demonstrates significant improvements in the F1, mAP, and R indicators. Additionally, experiments conducted on the UAV-ROD dataset demonstrate Aero-YOLO’s consistent excellence, affirming its superior performance in UAV-based vehicle recognition. Although Aero-YOLO has improved the accuracy of target detection, it has not effectively addressed the issue of identifying vehicles that are occluded or blurred. In our forthcoming research, we plan to delve deeper into the Aero-YOLO algorithm to better address issues related to occlusion and target blurring. Additionally, the future stages of the project will involve field-testing the proposed algorithm to validate its performance in real-world scenarios.
Author Contributions
Conceptualization, Y.S., Z.Y. and J.L.; Data Curation, Y.S.; Formal Analysis, Y.S. and Z.Y.; Funding Acquisition, Z.L.; Investigation, Z.Y.; Methodology, Y.S.; Project Management, Y.S.; Resources, Y.S.; Software, Y.S.; Supervision, Z.L. and J.L.; Validation, Z.Y.; Visualization, Z.Y.; Writing—Original Draft, Z.Y.; Writing—Review and Editing, Z.Y. and Y.S. All authors have read and agreed to the published version of the manuscript.
Funding
This research was funded by the National Natural Science Foundation of China, Grant No. 12361029, and the National Undergraduate Innovation and Entrepreneurship Training Program, Project No. DC20231669.
Data Availability Statement
Data are contained within the article.
Conflicts of Interest
The authors declare no conflicts of interest.
Appendix A
In the text, we employ abbreviated forms for certain phrases, such as abbreviating “You Only Look Once” to “YOLO”. For reader convenience, these abbreviations are compiled in Table A1.

Table A1.
Table of Terminology Abbreviations.
Table A1.
Table of Terminology Abbreviations.
| Full Name | Abbreviation |
|---|---|
| unmanned aerial vehicles | UAVs |
| You Only Look Once | YOLO |
| Adaptive Moment Estimation | Adam |
| Stochastic Gradient Descent | SGD |
| CSPDarknet53 to Two-Stage FPN | C2f |
| Aero-YOLO (extreme) | Aero-YOLOe |
| Aero-YOLO (ultra) | Aero-YOLOu |
| Aero-YOLO (omega) | Aero-YOLOo |
| Google Inception Net | GoogleNet |
| Deeper Receptive Field Block | DRFB |
| Vision Transformer Detector | ViTDet |
| Spatial Pyramid Pooling Fusion | SPFF |
| state of the art | SOTA |
| non-maximum suppression | NMS |
| Cross-Stage Partial Network | CSP |
| precision | P |
| recall | R |
| average precision | AP |
| mean average precision | mAP |
| number of model parameters | Params |
| Giga Floating-Point Operations | GFLOPs |
| Floating-Point Operations | FLOPs |
| Frames per Second | FPS |
References
- Zhou, G.; Ambrosia, V.; Gasiewski, A.J.; Bland, G. Foreword to the special issue on unmanned airborne vehicle (UAV) sensing systems for earth observations. IEEE Trans. Geosci. Remote Sens. 2009, 47, 687–689. [Google Scholar] [CrossRef]
- Kellenberger, B.; Marcos, D.; Tuia, D. Detecting mammals in UAV images: Best practices to address a substantially imbalanced dataset with deep learning. Remote Sens. Environ. 2018, 216, 139–153. [Google Scholar] [CrossRef]
- Ma’Sum, M.A.; Arrofi, M.K.; Jati, G.; Arifin, F.; Kurniawan, M.N.; Mursanto, P.; Jatmiko, W. Simulation of intelligent unmanned aerial vehicle (uav) for military surveillance. In Proceedings of the 2013 international conference on advanced computer science and information systems (ICACSIS), Sanur Bali, Indonesia, 28–29 September 2013; pp. 161–166. [Google Scholar]
- Li, X.; Yang, L. Design and implementation of UAV intelligent aerial photography system. In Proceedings of the 2012 4th International Conference on Intelligent Human-Machine Systems and Cybernetics, Nanchang, China, 26–27 August 2012; Volume 2, pp. 200–203. [Google Scholar]
- Tanaka, S.; Senoo, T.; Ishikawa, M. High-speed uav delivery system with non-stop parcel handover using high-speed visual control. In Proceedings of the 2019 IEEE Intelligent Transportation Systems Conference (ITSC), Auckland, New Zealand, 27–30 October 2019; pp. 4449–4455. [Google Scholar]
- Cong, Y.; Fan, B.; Liu, J.; Luo, J.; Yu, H. Speeded up low-rank online metric learning for object tracking. IEEE Trans. Circuits Syst. Video Technol. 2014, 25, 922–934. [Google Scholar] [CrossRef]
- Mogili, U.R.; Deepak, B. Review on application of drone systems in precision agriculture. Procedia Comput. Sci. 2018, 133, 502–509. [Google Scholar] [CrossRef]
- Yang, Z.; Pun-Cheng, L.S. Vehicle detection in intelligent transportation systems and its applications under varying environments: A review. Image Vis. Comput. 2018, 69, 143–154. [Google Scholar] [CrossRef]
- Eisenbeiss, H. A mini unmanned aerial vehicle (UAV): System overview and image acquisition. Int. Arch. Photogramm. Remote Sens. Spat. Inf. Sci. 2004, 36, 1–7. [Google Scholar]
- Konoplich, G.V.; Putin, E.O.; Filchenkov, A.A. Application of deep learning to the problem of vehicle detection in UAV images. In Proceedings of the 2016 XIX IEEE International Conference on Soft Computing and Measurements (SCM), St. Petersburg, Russia, 25–27 May 2016; pp. 4–6. [Google Scholar]
- Vasterling, M.; Meyer, U. Challenges and opportunities for UAV-borne thermal imaging. Therm. Infrared Remote Sens. Sens. Methods Appl. 2013, 17, 69–92. [Google Scholar]
- Li, H.; Li, J.; Wei, H.; Liu, Z.; Zhan, Z.; Ren, Q. Slim-neck by GSConv: A better design paradigm of detector architectures for autonomous vehicles. arXiv 2022, arXiv:2206.02424. [Google Scholar]
- Zhang, Q.L.; Yang, Y.B. Sa-net: Shuffle attention for deep convolutional neural networks. In Proceedings of the ICASSP 2021-2021 IEEE International Conference on Acoustics, Speech and Signal Processing (ICASSP), Toronto, ON, Canada, 6–11 June 2021; pp. 2235–2239. [Google Scholar]
- Zhang, Z. Improved adam optimizer for deep neural networks. In Proceedings of the 2018 IEEE/ACM 26th International Symposium on Quality of Service (IWQoS), Banff, AB, Canada, 4–6 June 2018; pp. 1–2. [Google Scholar]
- Feng, K.; Li, W.; Han, J.; Pan, F.; Zheng, D. TS4Net: Two-Stage Sample Selective Strategy for Rotating Object Detection. arXiv 2021, arXiv:2108.03116. [Google Scholar]
- Du, D.; Zhu, P.; Wen, L.; Bian, X.; Lin, H.; Hu, Q.; Peng, T.; Zheng, J.; Wang, X.; Zhang, Y.; et al. VisDrone-DET2019: The vision meets drone object detection in image challenge results. In Proceedings of the IEEE/CVF International Conference on Computer Vision Workshops, Seoul, Republic of Korea, 27–28 October 2019. [Google Scholar]
- Koopman, B.O. The theory of search. II. Target detection. Oper. Res. 1956, 4, 503–531. [Google Scholar] [CrossRef]
- Wang, X. Intelligent multi-camera video surveillance: A review. Pattern Recognit. Lett. 2013, 34, 3–19. [Google Scholar] [CrossRef]
- Ren, S.; He, K.; Girshick, R.; Sun, J. Faster r-cnn: Towards real-time object detection with region proposal networks. Adv. Neural Inf. Process. Syst. 2015, 28. [Google Scholar] [CrossRef]
- Redmon, J.; Divvala, S.; Girshick, R.; Farhadi, A. You only look once: Unified, real-time object detection. In Proceedings of the IEEE Conference on Computer Vision and Pattern Recognition, Las Vegas, NV, USA, 26 June–1 July 2016; pp. 779–788. [Google Scholar]
- Liu, W.; Anguelov, D.; Erhan, D.; Szegedy, C.; Reed, S.; Fu, C.Y.; Berg, A.C. Ssd: Single shot multibox detector. In Proceedings of the Computer Vision–ECCV 2016: 14th European Conference, Amsterdam, The Netherlands, 11–14 October 2016; Proceedings, Part I 14. Springer: Berlin/Heidelberg, Germany, 2016; pp. 21–37. [Google Scholar]
- Wang, Y.; Wang, C.; Zhang, H.; Dong, Y.; Wei, S. Automatic ship detection based on RetinaNet using multi-resolution Gaofen-3 imagery. Remote Sens. 2019, 11, 531. [Google Scholar] [CrossRef]
- Redmon, J.; Farhadi, A. YOLO9000: Better, faster, stronger. In Proceedings of the IEEE Conference on Computer Vision and Pattern Recognition, Honolulu, HI, USA, 21–26 July 2017; pp. 7263–7271. [Google Scholar]
- Redmon, J.; Farhadi, A. Yolov3: An incremental improvement. arXiv 2018, arXiv:1804.02767. [Google Scholar]
- He, K.; Zhang, X.; Ren, S.; Sun, J. Deep residual learning for image recognition. In Proceedings of the IEEE Conference on Computer Vision and Pattern Recognition, Las Vegas, NV, USA, 26 June–1 July 2016; pp. 770–778. [Google Scholar]
- Bochkovskiy, A.; Wang, C.Y.; Liao, H.Y.M. YOLOv4: Optimal Speed and Accuracy of Object Detection. arXiv 2020, arXiv:2004.10934. [Google Scholar]
- Wang, C.Y.; Liao, H.Y.M.; Wu, Y.H.; Chen, P.Y.; Hsieh, J.W.; Yeh, I.H. CSPNet: A new backbone that can enhance learning capability of CNN. In Proceedings of the IEEE/CVF conference on Computer Vision and Pattern Recognition Workshops, Seattle, WA, USA, 14–19 June 2020; pp. 390–391. [Google Scholar]
- Zheng, Z.; Wang, P.; Liu, W.; Li, J.; Ye, R.; Ren, D. Distance-IoU loss: Faster and better learning for bounding box regression. In Proceedings of theAAAI Conference on Artificial Intelligence, New York, NY, USA, 7–12 February 2020; Volume 34, pp. 12993–13000. [Google Scholar]
- Misra, D. Mish: A self regularized non-monotonic activation function. arXiv 2019, arXiv:1908.08681. [Google Scholar]
- Ultralytics. YOLOv8. Available online: https://docs.ultralytics.com/ (accessed on 21 June 2023).
- JOCHER. Network Data. 2020. Available online: https://github.com/ultralytics/yolov5 (accessed on 24 December 2022).
- Zhang, R.; Newsam, S.; Shao, Z.; Huang, X.; Wang, J.; Li, D. Multi-scale adversarial network for vehicle detection in UAV imagery. ISPRS J. Photogramm. Remote Sens. 2021, 180, 283–295. [Google Scholar] [CrossRef]
- Han, S.; Yoo, J.; Kwon, S. Real-time vehicle-detection method in bird-view unmanned-aerial-vehicle imagery. Sensors 2019, 19, 3958. [Google Scholar] [CrossRef]
- Mekhalfi, M.L.; Bejiga, M.B.; Soresina, D.; Melgani, F.; Demir, B. Capsule networks for object detection in UAV imagery. Remote Sens. 2019, 11, 1694. [Google Scholar] [CrossRef]
- Fang, Z.; Zhang, T.; Fan, X. A ViTDet based dual-source fusion object detection method of UAV. In Proceedings of the 2022 International Conference on Image Processing, Computer Vision and Machine Learning (ICICML), Xi’an, China, 28–30 October 2022; pp. 628–633. [Google Scholar]
- Mao, Y.; Chen, M.; Wei, X.; Chen, B. Obstacle recognition and avoidance for UAVs under resource-constrained environments. IEEE Access 2020, 8, 169408–169422. [Google Scholar] [CrossRef]
- Lin, T.Y.; Goyal, P.; Girshick, R.; He, K.; Dollár, P. Focal loss for dense object detection. In Proceedings of the IEEE International Conference on Computer Vision, Venice, Italy, 22–29 October 2017; pp. 2980–2988. [Google Scholar]
- Zhao, X.; Song, Y. Improved Ship Detection with YOLOv8 Enhanced with MobileViT and GSConv. Electronics 2023, 12, 4666. [Google Scholar] [CrossRef]
- Lin, X.; Song, A. Research on improving pedestrian detection algorithm based on YOLOv5. In Proceedings of the International Conference on Electronic Information Engineering and Data Processing (EIEDP 2023), Nanchang, China, 17–19 March 2023; Volume 12700, pp. 506–511. [Google Scholar]
- Cui, Z.; Wang, X.; Liu, N.; Cao, Z.; Yang, J. Ship detection in large-scale SAR images via spatial shuffle-group enhance attention. IEEE Trans. Geosci. Remote Sens. 2020, 59, 379–391. [Google Scholar] [CrossRef]
- Wan, H.; Chen, J.; Huang, Z.; Feng, Y.; Zhou, Z.; Liu, X.; Yao, B.; Xu, T. Lightweight channel attention and multiscale feature fusion discrimination for remote sensing scene classification. IEEE Access 2021, 9, 94586–94600. [Google Scholar] [CrossRef]
- Cheng, C. Real-time mask detection based on SSD-MobileNetV2. In Proceedings of the 2022 IEEE 5th International Conference on Automation, Electronics and Electrical Engineering (AUTEEE), Shenyang, China, 18–20 November 2022; pp. 761–767. [Google Scholar]
- Li, Y.; Fan, Q.; Huang, H.; Han, Z.; Gu, Q. A modified YOLOv8 detection network for UAV aerial image recognition. Drones 2023, 7, 304. [Google Scholar] [CrossRef]
- Kingma, D.P.; Ba, J. Adam: A method for stochastic optimization. arXiv 2014, arXiv:1412.6980. [Google Scholar]
Disclaimer/Publisher’s Note: The statements, opinions and data contained in all publications are solely those of the individual author(s) and contributor(s) and not of MDPI and/or the editor(s). MDPI and/or the editor(s) disclaim responsibility for any injury to people or property resulting from any ideas, methods, instructions or products referred to in the content. |
© 2024 by the authors. Licensee MDPI, Basel, Switzerland. This article is an open access article distributed under the terms and conditions of the Creative Commons Attribution (CC BY) license (https://creativecommons.org/licenses/by/4.0/).