Article

Grid Forming Technologies to Improve Rate of Change in Frequency and Frequency Nadir: Analysis-Based Replicated Load Shedding Events

by
Oscar D. Garzon
1,
Alexandre B. Nassif
1,* and
Matin Rahmatian
2
1
LUMA Energy, San Juan, PR 00907, USA
2
BC Hydro, Vancouver, BC V6B 5R3, Canada
*
Author to whom correspondence should be addressed.
Electronics 2024, 13(6), 1120; https://doi.org/10.3390/electronics13061120
Submission received: 15 January 2024 / Revised: 8 March 2024 / Accepted: 11 March 2024 / Published: 19 March 2024

Abstract

:
Electric power generation is quickly transitioning toward nontraditional inverter-based resources (IBRs). Prevalent devices today are solar PV, wind generators, and battery energy storage systems (BESS) based on electrochemical packs. These IBRs are interconnected throughout the power system via power electronics inverter bridges, which have sophisticated controls. This paper studies the impacts and benefits resulting from the integration of grid forming (GFM) inverters and energy storage on the stability of power systems via replicating real events of loss of generation units that resulted in large load shedding events. First, the authors tuned the power system dynamic model in Power System Simulator for Engineering (PSSE) to replicate the event records and, upon integrating the IBRs, analyzed the system dynamic responses of the BESS. This was conducted for both GFM and grid following (GFL) modes. Additionally, models for Grid Forming Static Synchronous Compensator (GFM STATCOM), were also created and simulated to allow for quantifying the benefits of this technology and a techno-economic analysis compared with GFM BESSs. The results presented in this paper demonstrate the need for industry standardization in the application of GFM inverters to unleash their benefits to the bulk electric grid. The results also demonstrate that the GFM STATCOM is a very capable system that can augment the bulk system inertia, effectively reducing the occurrence of load shedding events.

1. Introduction

Renewable energy inverter-based resources (IBRs) have emerged as integral components in the ongoing evolution of the electrical power system, supporting the utilization of non-conventional and renewable sources such as wind, thermal, photovoltaic (PV), and the integration of battery energy storage systems (BESS). As the vanguard of electric power system research, the effective integration of these generators with the grid remains a critical focus, demanding advanced connection mechanisms. The complexities of connecting IBRs directly to the grid at the nominal voltage magnitude and frequency underscore the importance of inverters [1]. Grid-forming (GFM) and grid-following (GFL) inverters play pivotal roles in bridging the difference between nonconventional generators and the power system [2]. GFM inverters are designed to accurately maintain voltage magnitude and frequency at nominal values, ensuring a stable and reliable power supply. In contrast, GFL inverters are tasked with injecting the required active or reactive power into the grid, contributing to the overall efficiency of the power system.
The landscape is evolving. In the case of conventional synchronous generators, these regulate their terminal voltage via generator–excitation and turbine–governor controls. In the case of all grid interconnected inverters, invariably of GFL technology, all of which use phase-locked loops (PLLs) and require stable voltage sources such as those supplied by synchronous generators to operate [3]. GFL inverters can generally be tuned and programmed to provide grid services such as fast frequency response (FFR), frequency, and voltage regulation. However, a major disadvantage they present is that GFL inverters have limitations in scenarios such as accidental power system separation or blackout events, where autonomous operation is simply not possible, as well as their inability to contribute to system inertia [4]. GFL disadvantages have inspired research on other power inverter control methods for a more seamless integration of renewable energy and BESS into the electrical power system. Needs to be bridged are enhanced inertial response and the ability to create voltage and frequency signals. The GFM technology alternative provides functionalities similar to those of synchronous generators [5]. Legacy GFM controls were originally designed to be deployed in power systems with small footprints and on small islands. Today, GFM controls are being further enhanced for deployment in bulk power systems because of their ability to stabilize these grids and operate in concert with different sources [6].
Within the dynamic environment of power systems, state-of-the-art technologies surface to confront intricate challenges. Enhanced dynamics of grid-forming converters in fault conditions via current limiting control stand as a cornerstone for maintaining grid stability in challenging circumstances. Simultaneously, advancements in the control of power converters in AC microgrids have become instrumental in optimizing energy distribution within microgrid networks. Meanwhile, the investigation into transient stability analysis and control design for droop-controlled voltage source converters navigates the intricacies of enhancing transient stability while accounting for current limitations [7,8]. Furthermore, enhancing the stability of grid synchronization in large-scale wind farms during severe grid faults is crucial for ensuring the reliability of renewable energy sources. These approaches collectively advance the power systems domain toward greater efficiency, resilience, and the seamless integration of sustainable energy [9,10,11].
GFM technologies can be connected to different sources, such as solar PV, wind, and energy storage. The current state of commercialization is somewhat limited to battery energy storage systems as they can more promptly supply energy to provide the services within the GFM inverter capabilities since BESSs can store energy and charge or discharge in a controlled fashion. An additional emerging technology of GFM application, which is one of the focal points of this paper, is based on the STATCOM. A conventional STATCOM, being a GFL device, can provide voltage regulation via high-speed reactive power exchange [12]. However, if coupled with a supercapacitor, a STATCOM can be controlled as a short-duration GFM inverter (depending only on the size and capability of the supercapacitor to store active power). As a result, all STATCOM benefits, such as voltage control, resonance damping, and short-circuit augmentation [13], can be stacked on its GFM capability to strengthen the grid and provide system inertia [14,15].

Contribution and Paper Organization

In this paper, the impact of GFM technology and BESS integration on the stability of power systems is studied. This work contributes to the replication of the load shedding events resulting from the loss of generation units. The authors adjusted the dynamic model of the power system in PSSE to replicate the monitored events and analyze the response of the BESS using GFM and GFL technology. To analyze the impact of the BESS, different states of charge were considered, as well as two BESS sizes. Additionally, STATCOMs, which represent an emerging technology for frequency stability if coupled with GFM capabilities, were also simulated and their benefits quantified.
This paper takes on a practical approach where the researchers analyze BESS and STATCOM-based GFM technologies and their impact on previous records of generation trips and subsequent load shedding events. First, the researchers conduct simulations replicating past load shedding events with two objectives: first, the authors conduct a fine-tuning of the bulk system and conventional generation source models in the PSSE model to match previously recorded SCADA (supervisory control and data acquisition) event data. Second, these models are incorporated with GFM and GFL inverters coupled with BESS and STATCOM. The authors then playback these replicated generation trip events in PSSE and analyze the impact of these GFM technologies and how they could avert many of these previous load shedding scenarios. Via this research, the researchers underscore the importance of GFM assets and the substantial value they can provide in enhancing power system resilience. To date, there are no application guidelines or standards in the application of GFM resources, and it is imperative that the industry moves toward creating and implementing those as the transition to IBR is underway.

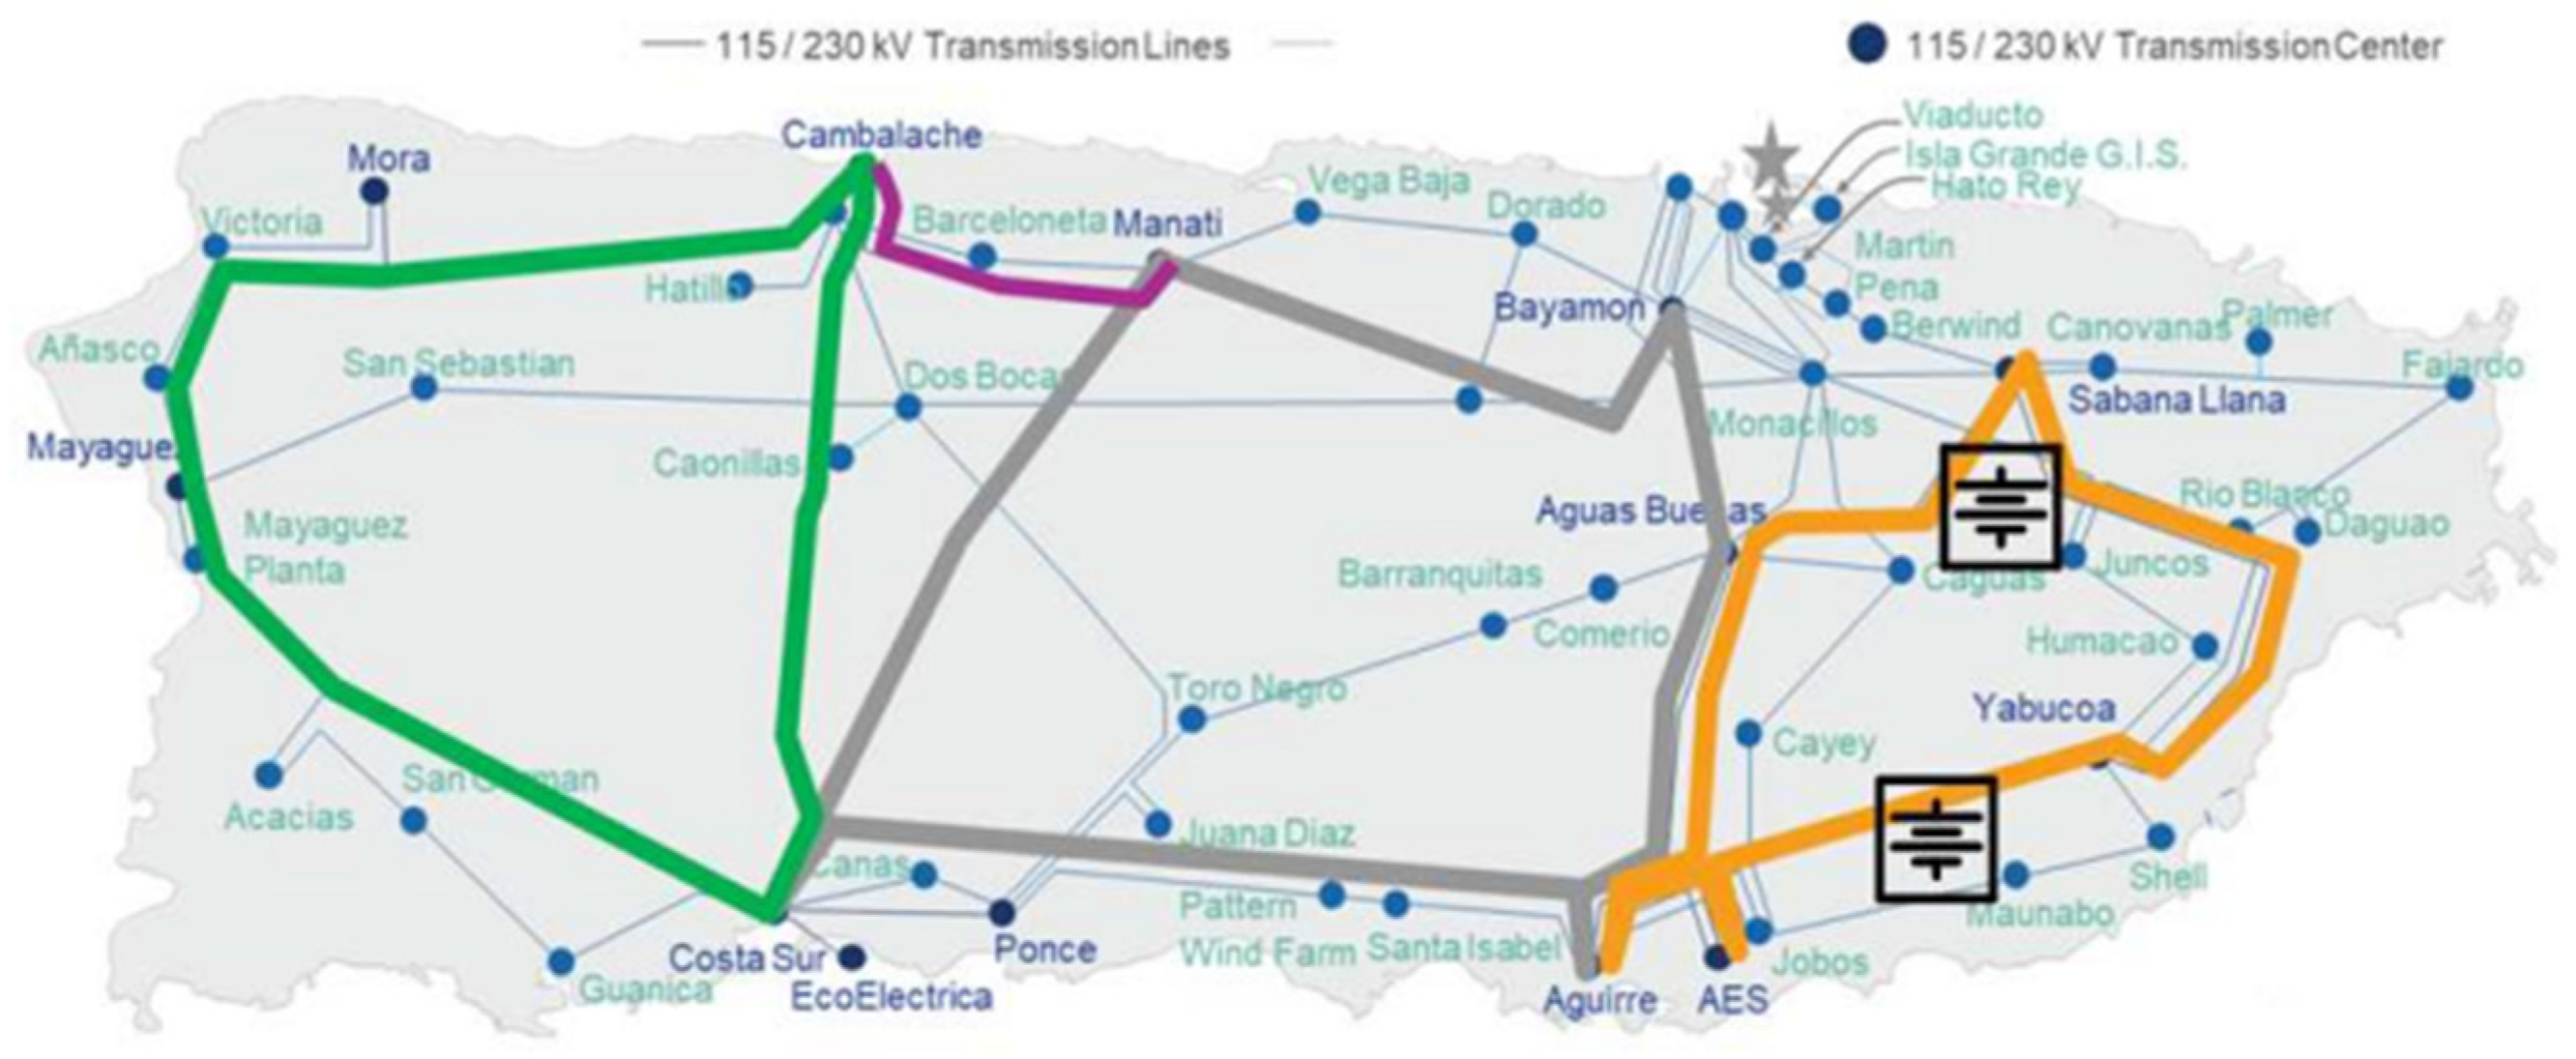
2. System Response—Real Events Monitored

The Puerto Rico Distribution System Operator (DSO) currently operates its distribution system using five supply voltage levels: 13.2 kV, 8.32 kV, 7.2 kV, 4.8 kV, and 4.16 kV. These are about 25%, 15%, 3%, 0%, and 55% of the feeders, respectively. A summary of OH and UG mileage of the feeders is provided in Table 1. The 4.8 kV system is omitted as it is very small. The transmission system in Puerto Rico consists of a meshed 230 kV network as well as a similarly meshed 115 kV. The system also comprises a highly diverse 38 kV subtransmission network. As presented in [16,17], some key indicators of the Puerto Rico grid can be summarized in Figure 1 and Table 2. In those previous works, the authors focused on transmission frequency stability and reliability challenges.

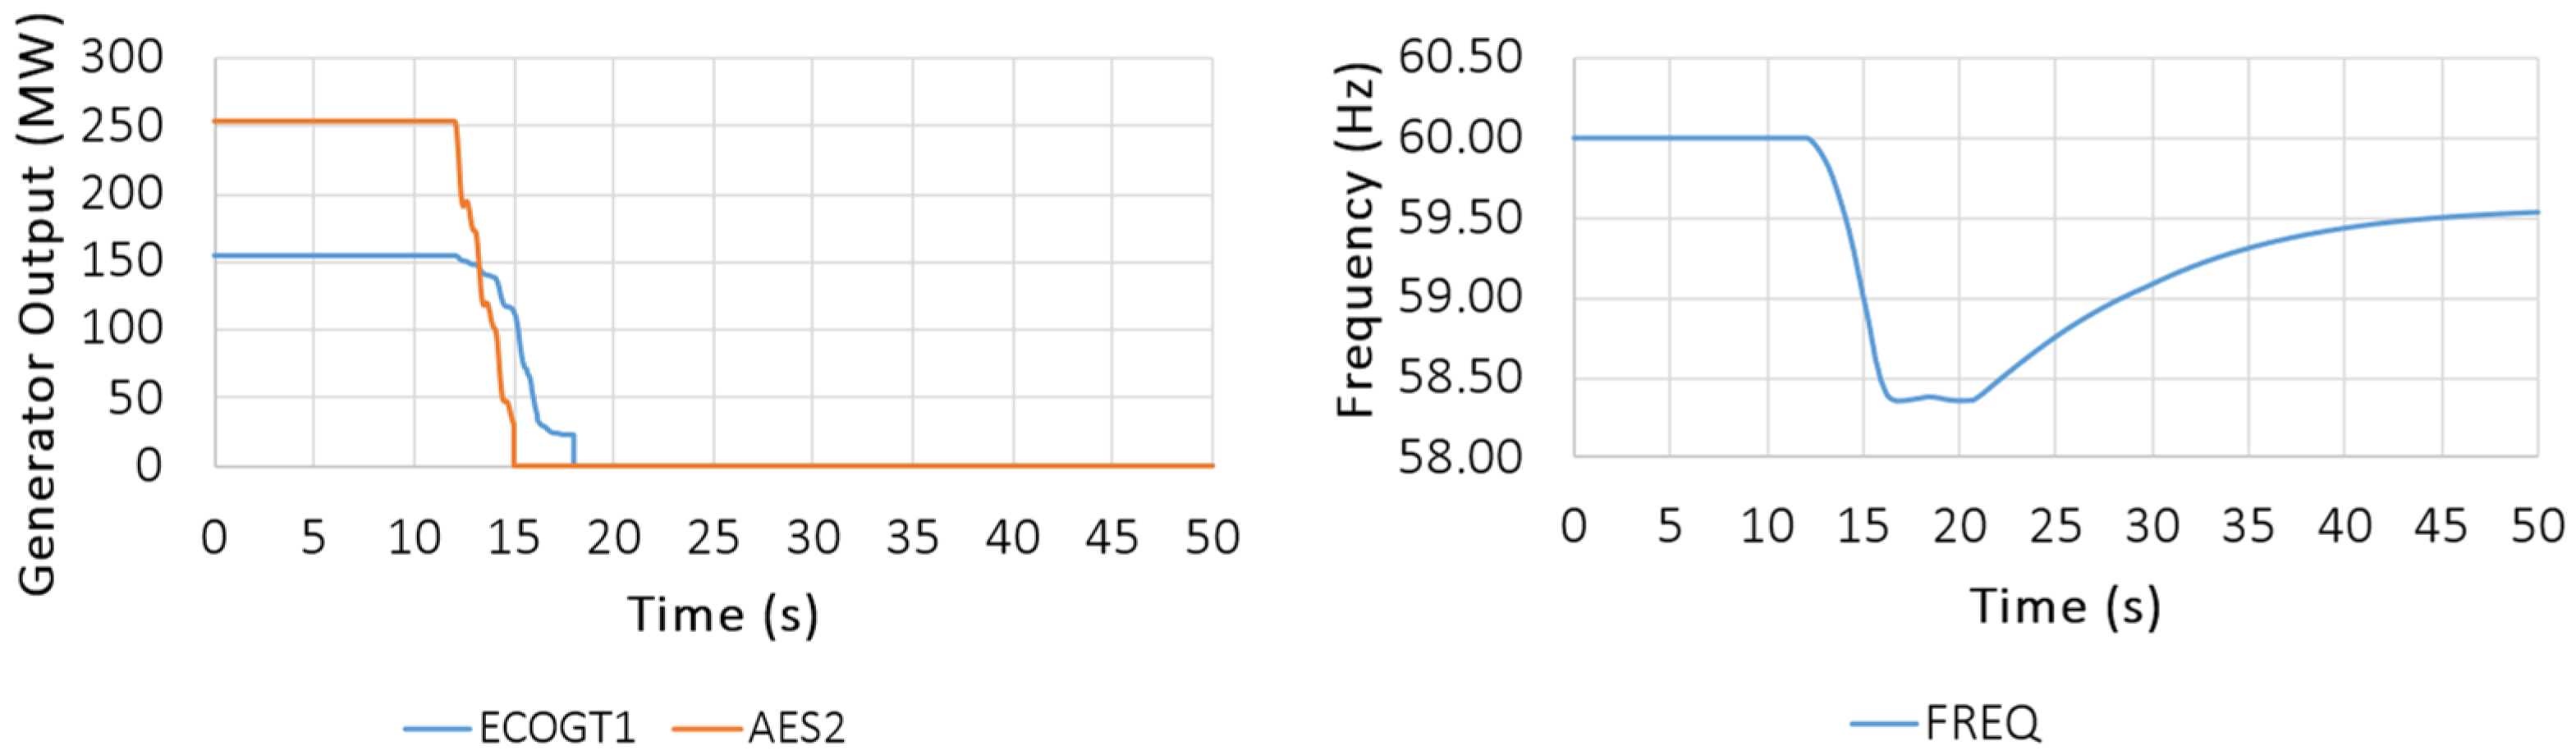
2.1. Event I: Loss of Two Generation Units

Event I involved the loss of two generation units, totaling about 400 MW. Assuming steady-state operation prior to the event, this is a description of the sequence of events: monitoring starts at 0 s; from the 12th to 14th seconds, the output power of the two generation units was gradually reduced due to their shutdown; unit 1 drops at second 15th; and unit 2 drops in second 18th. The behavior described above is depicted in Figure 2, which also shows the frequency behavior on the right-hand side.

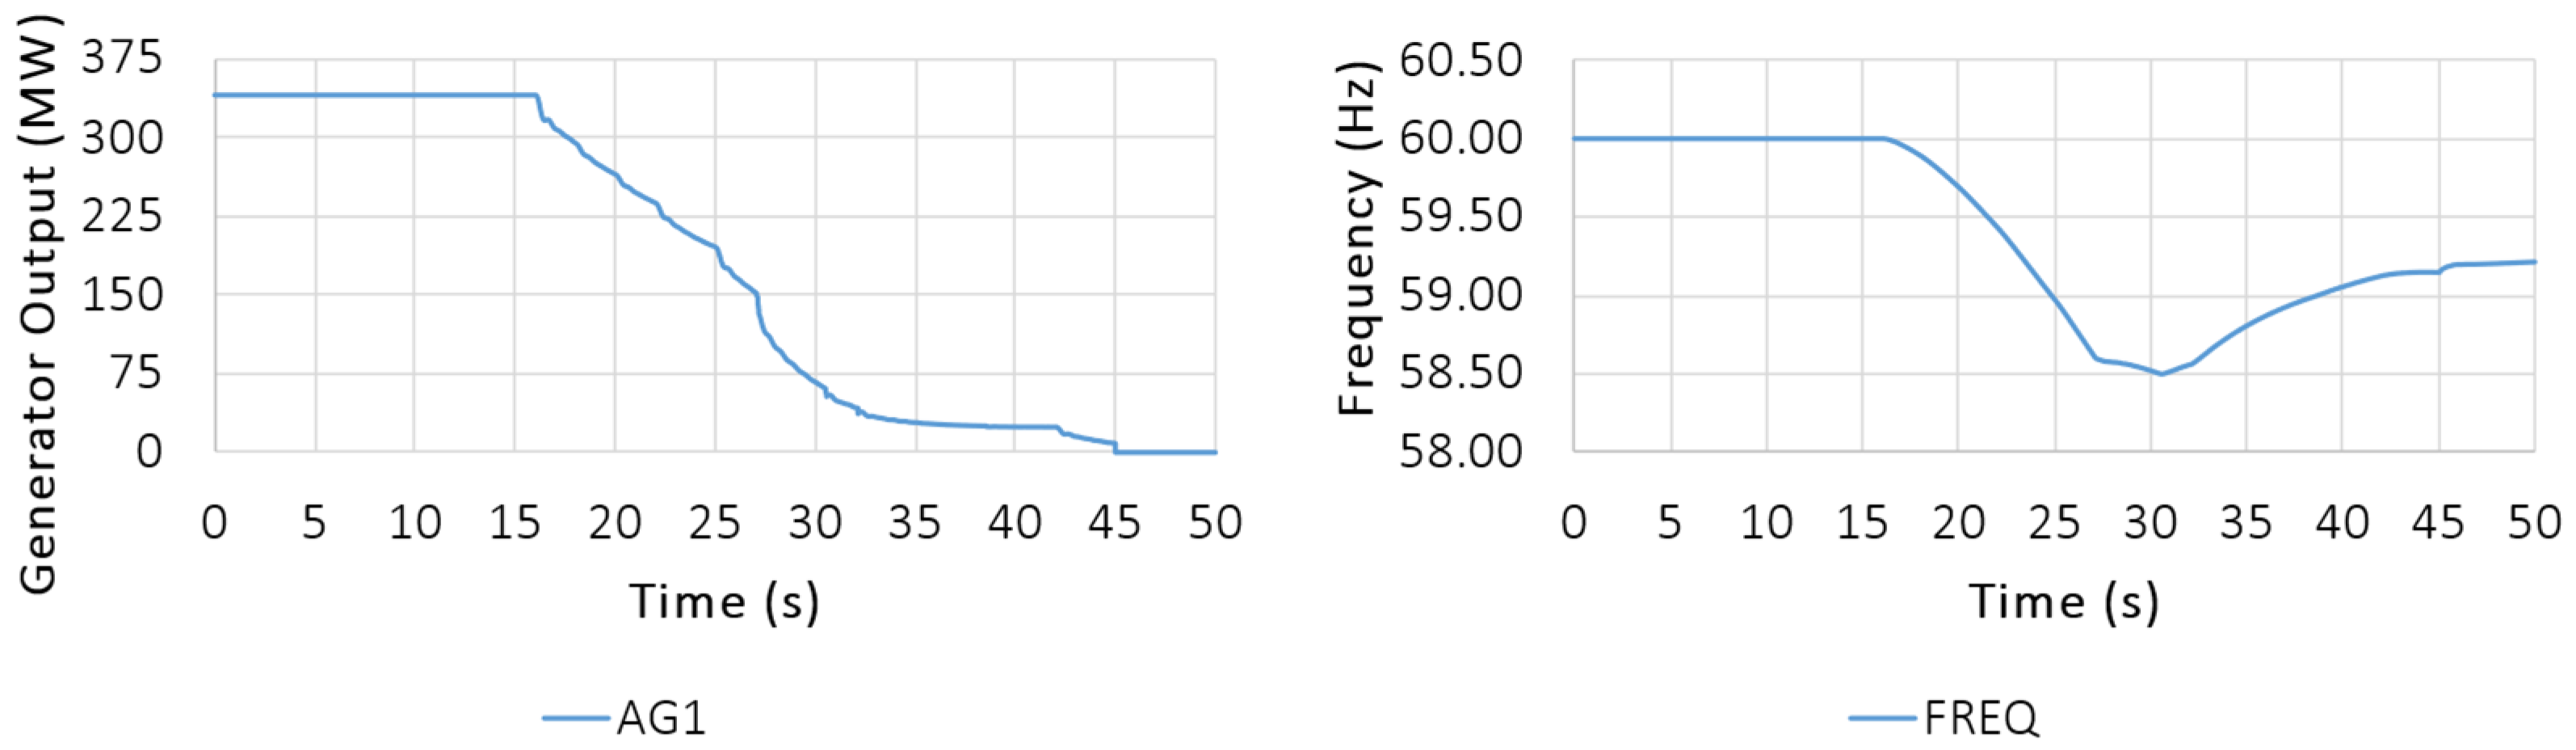
2.2. Event II: Loss of Slack Generation Unit

The monitored behavior of Event II is presented in Figure 3, where, according to measurements, the system experienced the loss of one generation unit. The sequence of events is as follows: the system operates in a steady state beginning at second 0; from seconds 16th to 42nd, the generation unit output power is reduced due to a unit shutdown; in second 45th, the unit trips completely. In Event II, the total power loss was about 340 MW, compromising the system frequency stability, as depicted on the right-hand side of the figure.
To replicate the events presented in this work, it was necessary to adjust the dynamic models of the electrical system in PSSE, integrating relays to regulate frequency and voltage, and adjusting the sequence of the events step by step to obtain the closer behavior in the simulations.

3. GFM Resources for Grid Stability
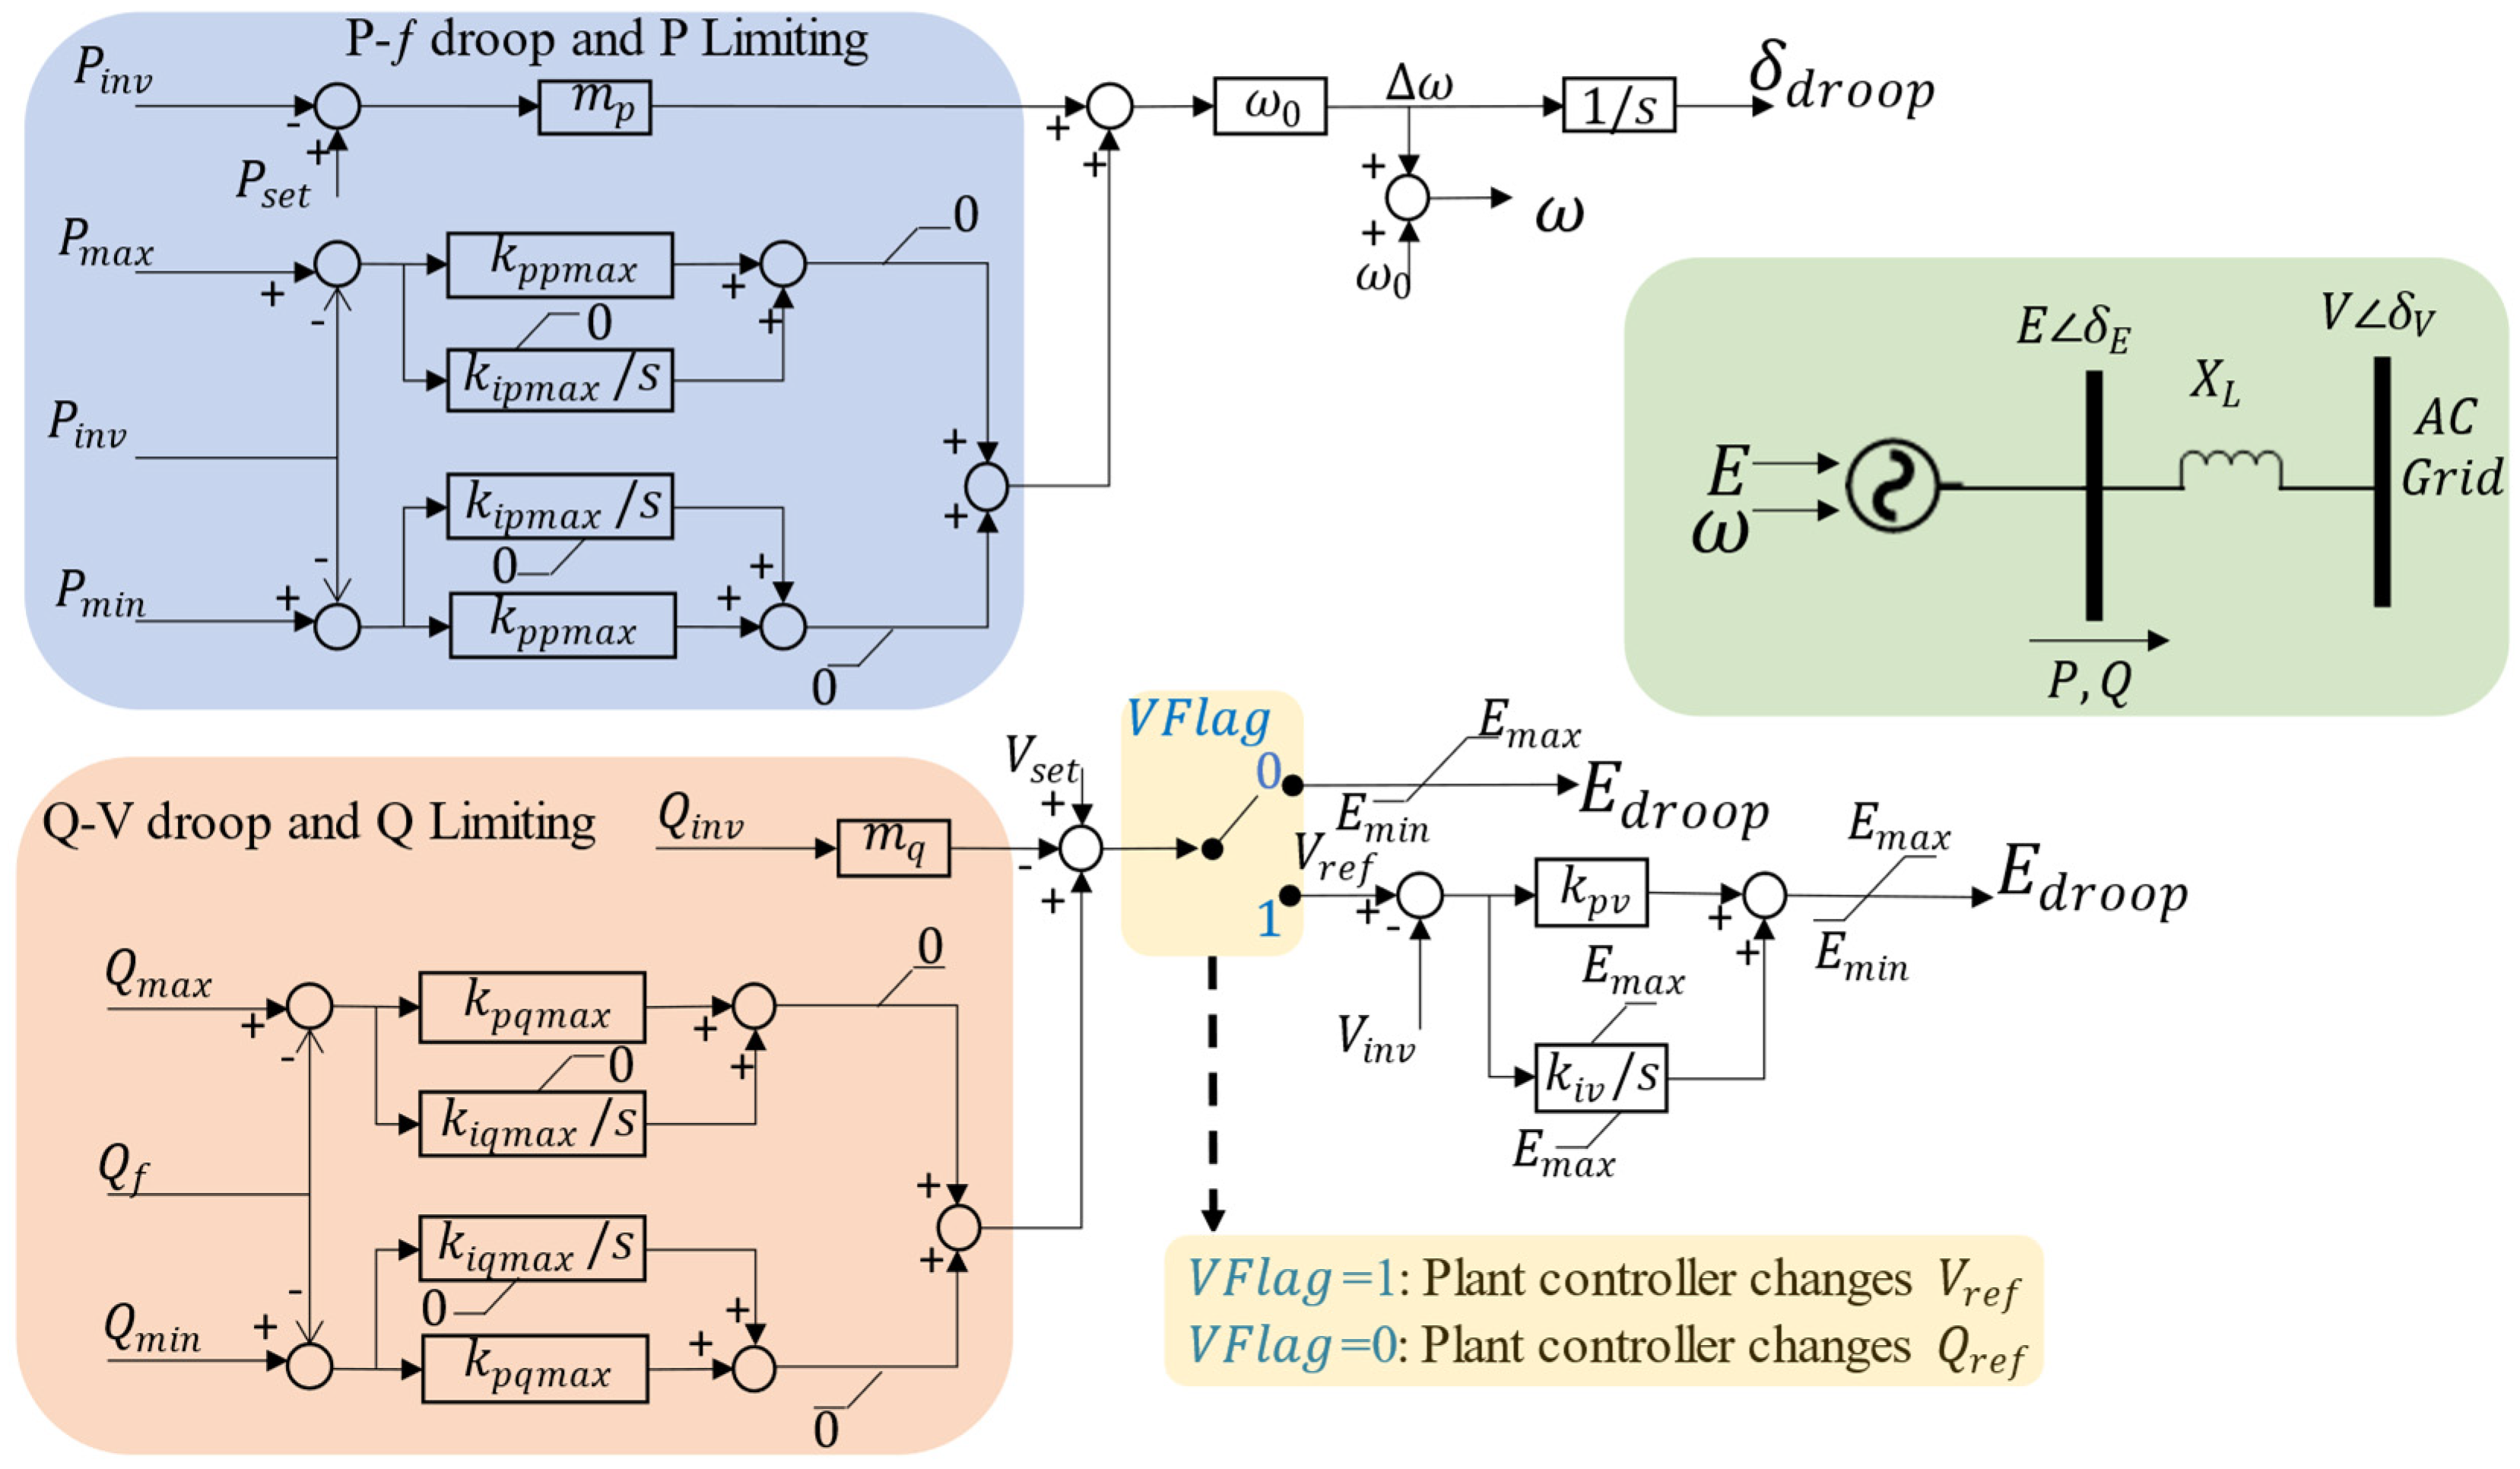
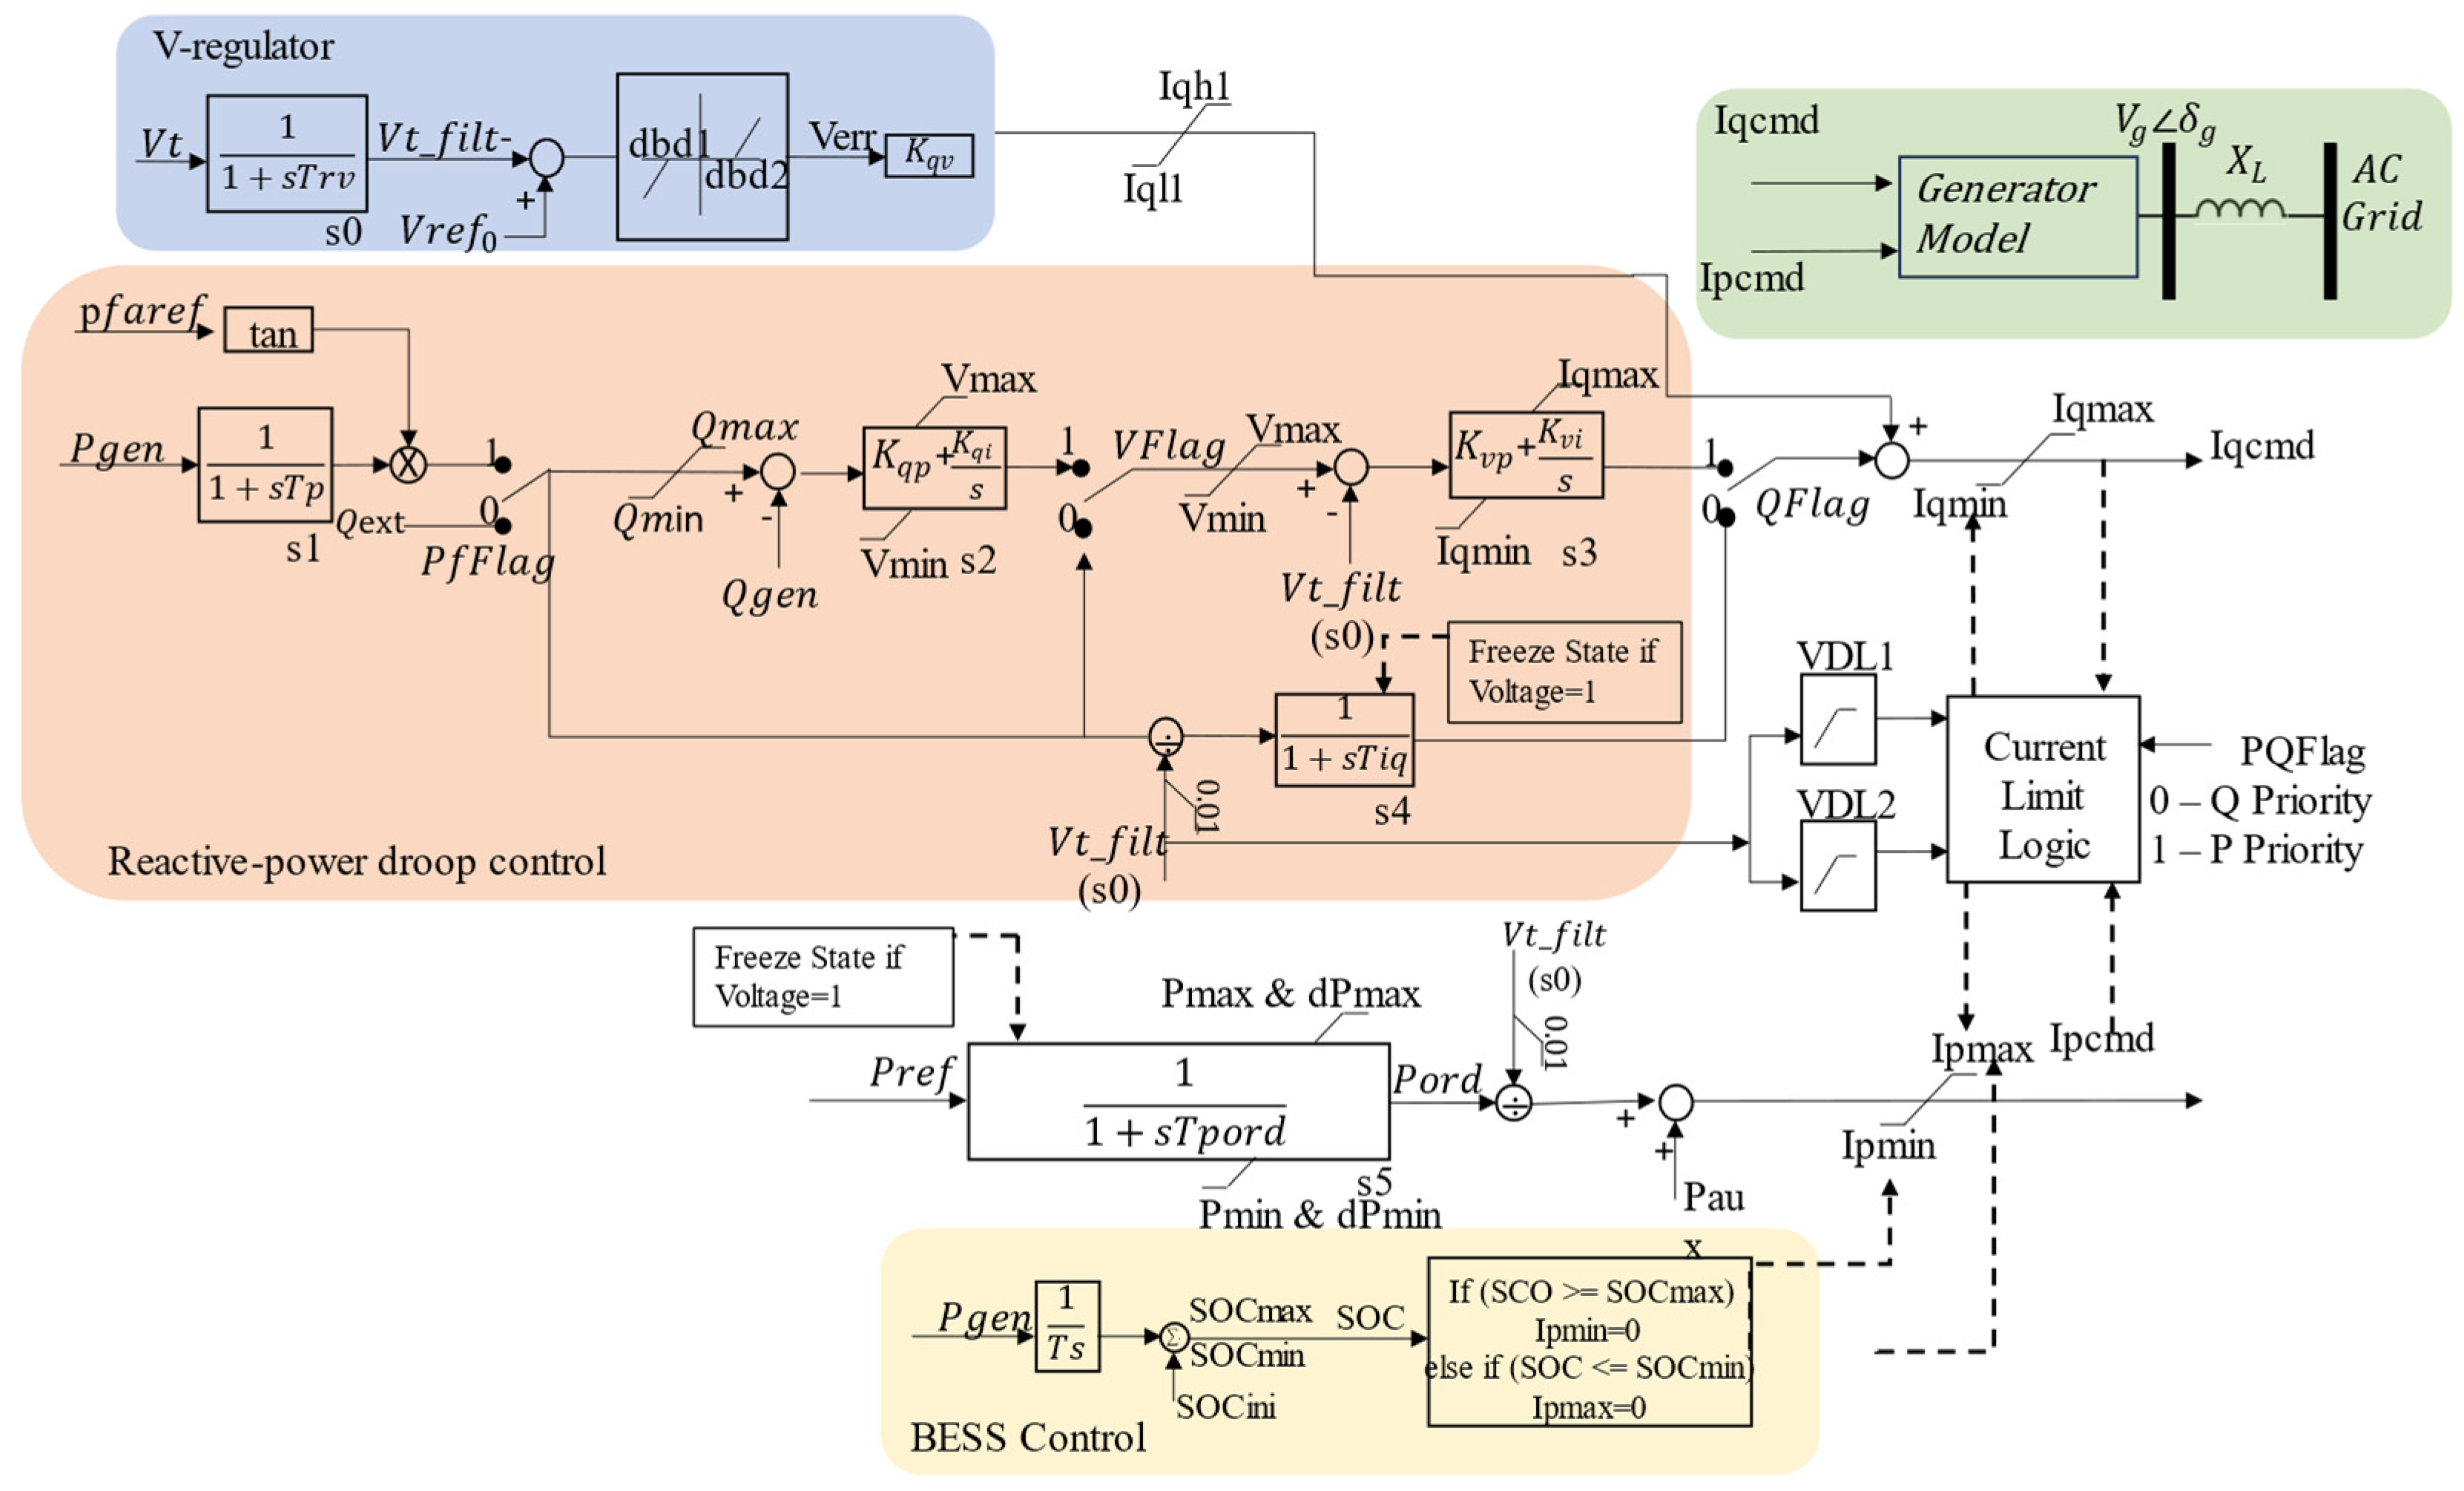
Considering the monitored events presented in Section 2, different options to support the electric system were considered. The researchers investigated technologies that include BESS, which can stabilize voltage and frequency, and can operate as power generation backup when faults or contingencies occur in the main grid. Figure 4 shows the simplified single-line diagram of the BESS, including circuit breakers, transformers, and balance of plant, i.e., all other components of the plant that consume electricity not limited to but including auxiliary transformers, control room, etc.
In this analysis, two sizes of BESS, namely 400 MW and 100 MW, were considered and placed near two important buses connected to the high voltage side of the transmission system (230 kV). Later, a GFM-STATCOM is also simulated. Battery charging, discharging, and idling scenarios are investigated, and the BESS and STATCOM were modeled operating in GFM and GFL modes. Each model considers its own group of variables and control loops. The following subsections present descriptions and diagrams of the control systems used for simulations.

3.1. GFM Model

GFM is a type of control used in power systems and electrical grids to maintain stability, control voltage, and frequency, and ensure reliable operation. With the increasing integration of renewable energy sources, GFM technologies are imperative to manage intermittent resources and their impact on grid stability [5,19,20]. GFM controls can manage grid voltage by adjusting the output power and reactive power devices, as well as setting frequency. GFM responds to changes in power supply and demand to keep frequency close to its nominal value [21]. These control systems are designed to handle grid faults and disturbances, such as short circuits or unexpected load changes, by adjusting power generation and other control parameters to prevent grid instability. GFM control systems are adaptable and can respond to dynamic changes in the grid, such as the addition or removal of generation sources, fluctuations in demand, or the loss of a significant generator. The adaptability of this type of control is due to employing sophisticated control algorithms, including droop control, voltage control loops, and frequency control loops [22]. The GFM model implemented in PSSE to integrate the BESS is shown in Figure 5 and includes a voltage source, P-f and Q-V droop control, P/Q limiting, and fault current limiting. The technical parameters are presented in Table 3. The control blocks and descriptions can be found in [22,23]. In the model, the P-f droop ensures the phase angles of multiple voltage sources are synchronized, and the Q-V droop avoids large circulation Vars between voltage sources.
It is important to highlight that the GFM model used in this work was recently approved by the NERC and tested and adjusted by the Pacific Norwest National Laboratory (PNNL). The simulation carried out by PNNL and presented in [21,22] allowed us to verify the contribution of the GFM model to the stability of the system. This model will be added to the next versions of PSSE. Lastly, the GFM model used in this study is based on droop control. There currently are no industry standards on the type of control and settings to be utilized for the GFM model. The authors used default settings for both the GFM and GFL models.

3.2. GFL Model

GFL control is used in power generation and distribution to synchronize an electrical generator or inverter with the existing electrical grid, ensuring that the generated power closely follows the grid voltage and frequency. This control strategy is commonly used in renewable energy systems and distributed energy resources. The primary objective of this control is to synchronize the electrical generator or inverter with the electrical grid by adjusting the generator or inverter voltage and frequency to match those of the grid [24]. GFL control continuously monitors the grid voltage and frequency via PLL to adjust its output in real time and ensure that it generates electricity at the same voltage and frequency as the grid. The adjustment is made via controllers operating in a synchronous manner, meaning that they align the phase angle and frequency of the generated electricity with those of the grid. This type of control can provide valuable grid services, such as reactive power support and voltage regulation, maintaining grid quality and reliability. In the case of renewable energy systems, GFL controls can accommodate variations in power output due to changing wind speeds or sunlight levels. GFL controls frequently incorporate communication and monitoring systems to exchange data with the grid and ensure that the generator or inverter maintains synchronization [23]. The PSSE model of GFL, called REECCU1, is shown in Figure 6 and corresponds to the utility-scale BESS and Table 4 presents the parameters used by the authors in the simulation studies.

3.3. Test Scenarios

When analyzing the impact of the GFM-BESS integration on the electrical system, three different scenarios were proposed: idling state, charging mode, and discharging mode. Those scenarios are typically the modes in which a BESS can operate and allow identifying the criticality of each mode in the face of load shedding events. For the idling state mode, the BESS is not exporting or absorbing power. In charging mode, the BESS was adjusted to absorb the nominal capacity of active power from the grid. For the discharging mode, the BESS was also adjusted to export the nominal capacity of active power. A GFM-STATCOM is also simulated for completeness and quantifying the impact of GFM technology on system frequency and stability. The STATCOM response is analyzed using a three-phase fault and drop unit simulation. To allow a fair comparison, two sizes of BESS and STATCOM were used, namely 400 MW and 100 MW, as they match those of the BESS.

4. Analysis Results for Events Replication and GFM Technology Implementation

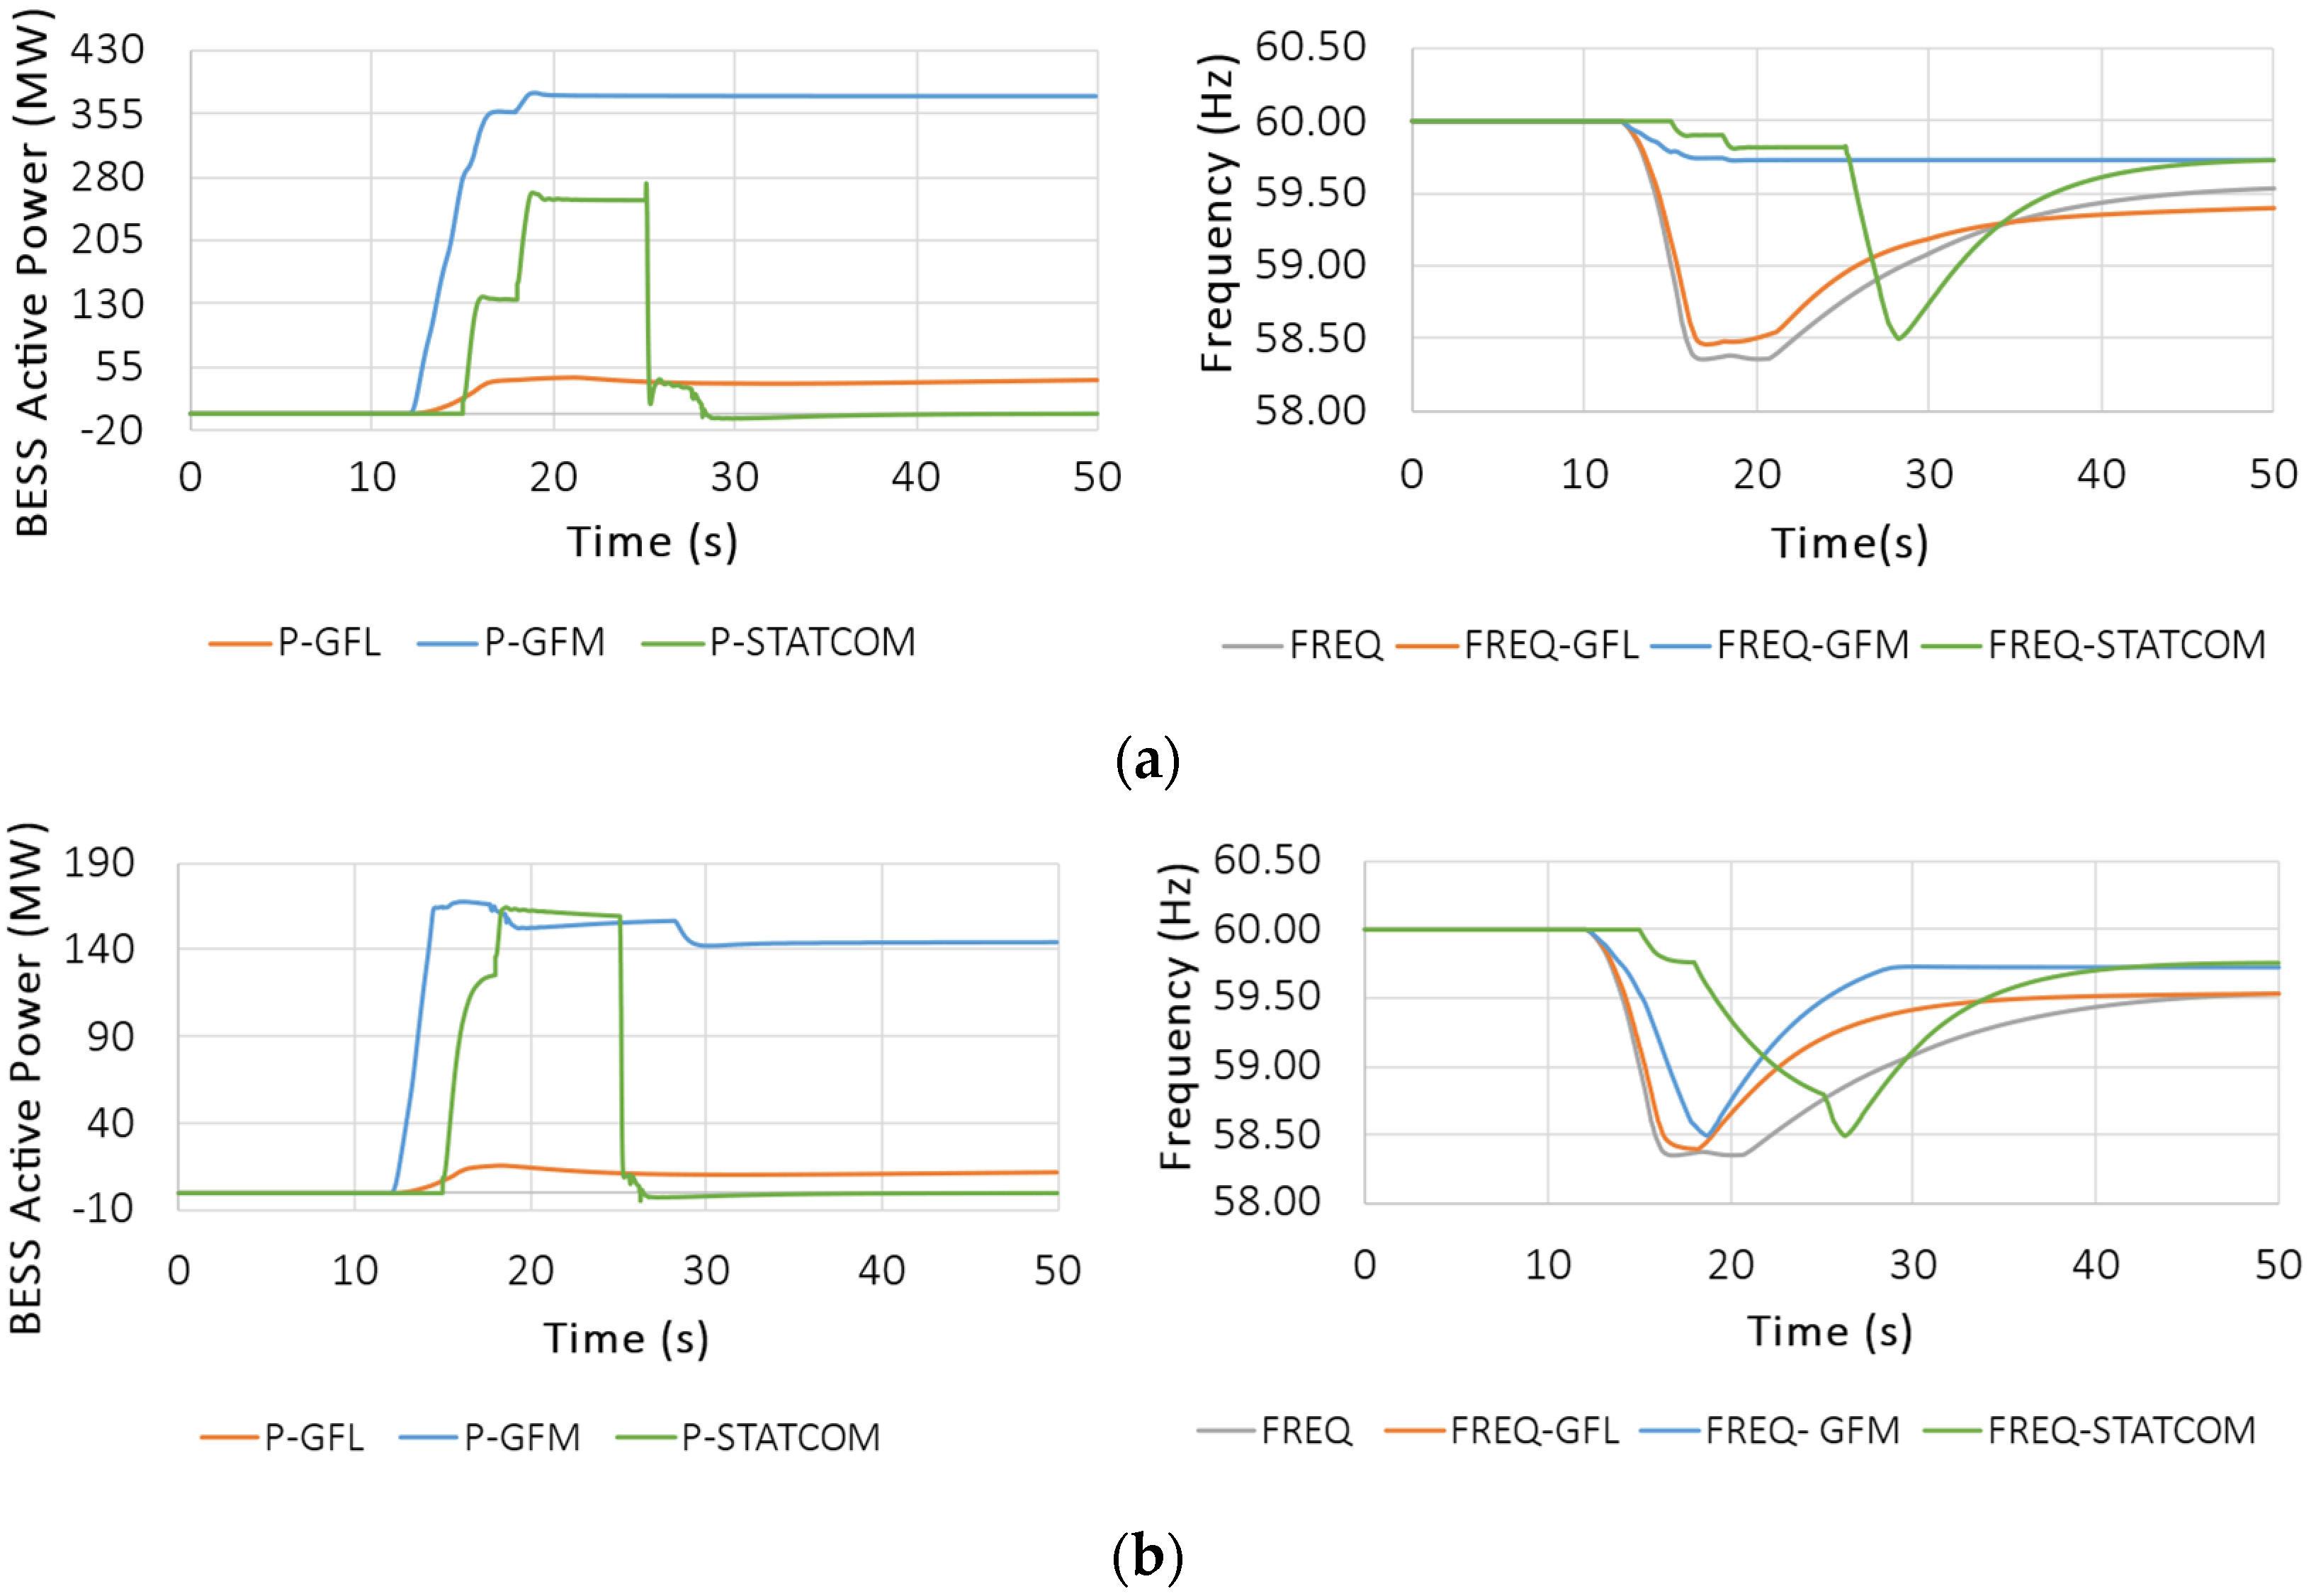
4.1. Event I: Loss of Two Generation Units

In this first set of results, the authors integrated two sizes of BESS (100 MW and 400 MW) and simulated their operation under GFM and GFL modes. These results are presented in Figure 7, Figure 8 and Figure 9, and considering the two sizes of BESS used in the simulations, all figures present a subfigure (a) for the 400 MW BESS and a subfigure (b) for the BESS of 100 MW. For the three sets of results, the plots on the left-hand side present a comparison of BESS active power response, whereas the plots on the right-hand side display the frequency response comparison for the base case, GFM BESS, and GFL BESS. The analysis is mainly focused on frequency nadir and rate of change of frequency (ROCOF). For the identification and comparison of the frequency behavior using the technologies proposed in this work (GFM and GFM), the figures compare the frequency recorded during the event (I and II), represented as FREQ, the frequency with the GFM technology represented as FREQ MON—GFM, and the frequency with GFL technology represented as FREQ MON—GFL.

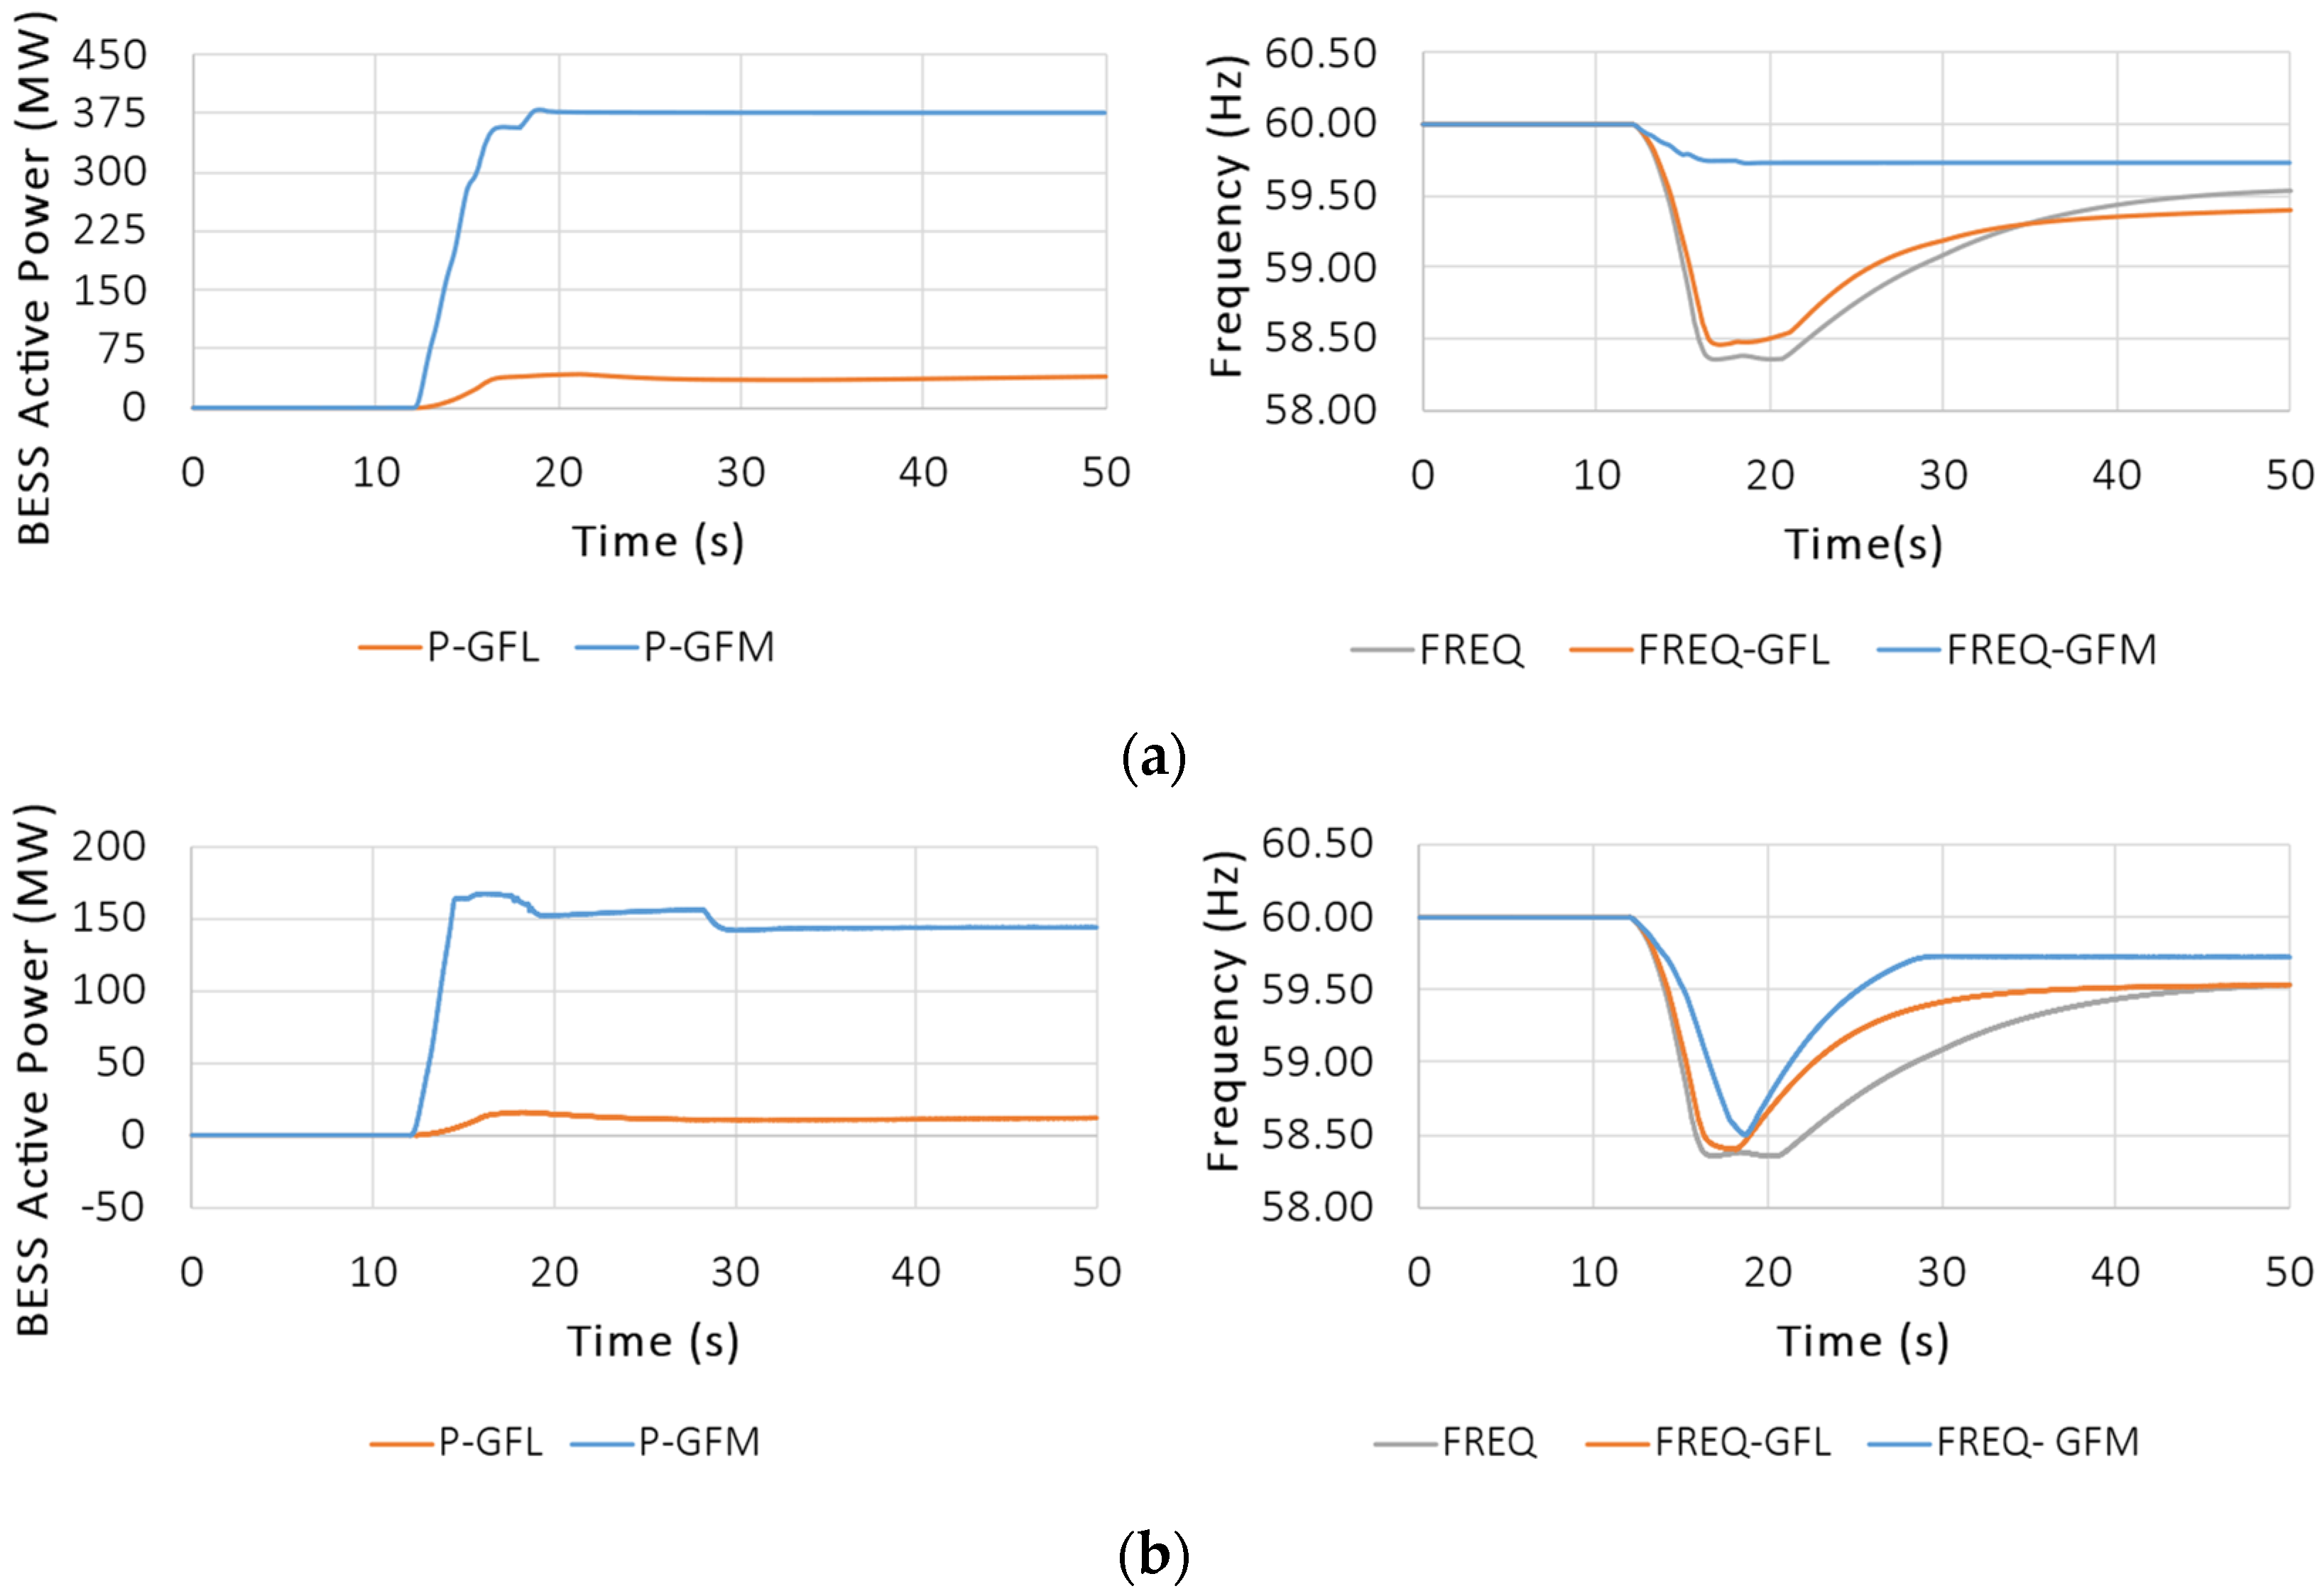
4.1.1. Idling State Mode

The results for idling mode are presented in Figure 7. Figure 7a presents the results for the 400 MW BESS, demonstrating that the active power response is much faster with GFM than with GFL. The GFM operation also results in a much higher export of active power, peaking at 375 MW, which corresponds to 93% of the BESS capacity. Under GFL operation, the maximum active power export only reaches about 75 MW or 18% of the BESS capacity.
For the 100 MW BESS, in Figure 7b, similar conclusions can be drawn. The GFM control provides a much quicker response. However, the loss of two units results in a 400 MW capacity reduction, meaning that the BESS capacity is insufficient to completely avert a load shedding occurrence. As for frequency stabilization, Figure 7a illustrates how the 400 MW GFM BESS can significantly arrest frequency to not drop below 0.8% of nominal. The GFL BESS, conversely, allows a drop close to 3% of the nominal. As for the 100 MW case, the GFM BESS allows a drop close to 2.6%, whereas the GFL case allows a drop of about 3%. For the 100 MW case, neither device can completely avoid a load shedding occurrence; however, the GFM BESS performs better with much less ROCOF.

4.1.2. Charging Mode

When operating under charging mode, Figure 8 suggests a powerful response for the GFM BESS, as it has more room to change operation, i.e., from charging at 400 MW to discharging as much as needed. This is illustrated in Figure 8a. The GFL controls, on the other hand, display lackluster performance with minimum response. This is reflected, again, in the frequency nadir and ROCOF.
The results are more significant for the 100 MW case presented in Figure 8b since the GFM BESS is able to shift from a full charge of 100 MW to its overload discharging rate of 150 MW. This operational room arrests frequency significantly and its inertial contribution very significantly mitigates ROCOF. As in the previous case, the GFL BESS cannot significantly improve the system frequency stability, and the response, although much better than the base case, still exposes the system to load shedding events.

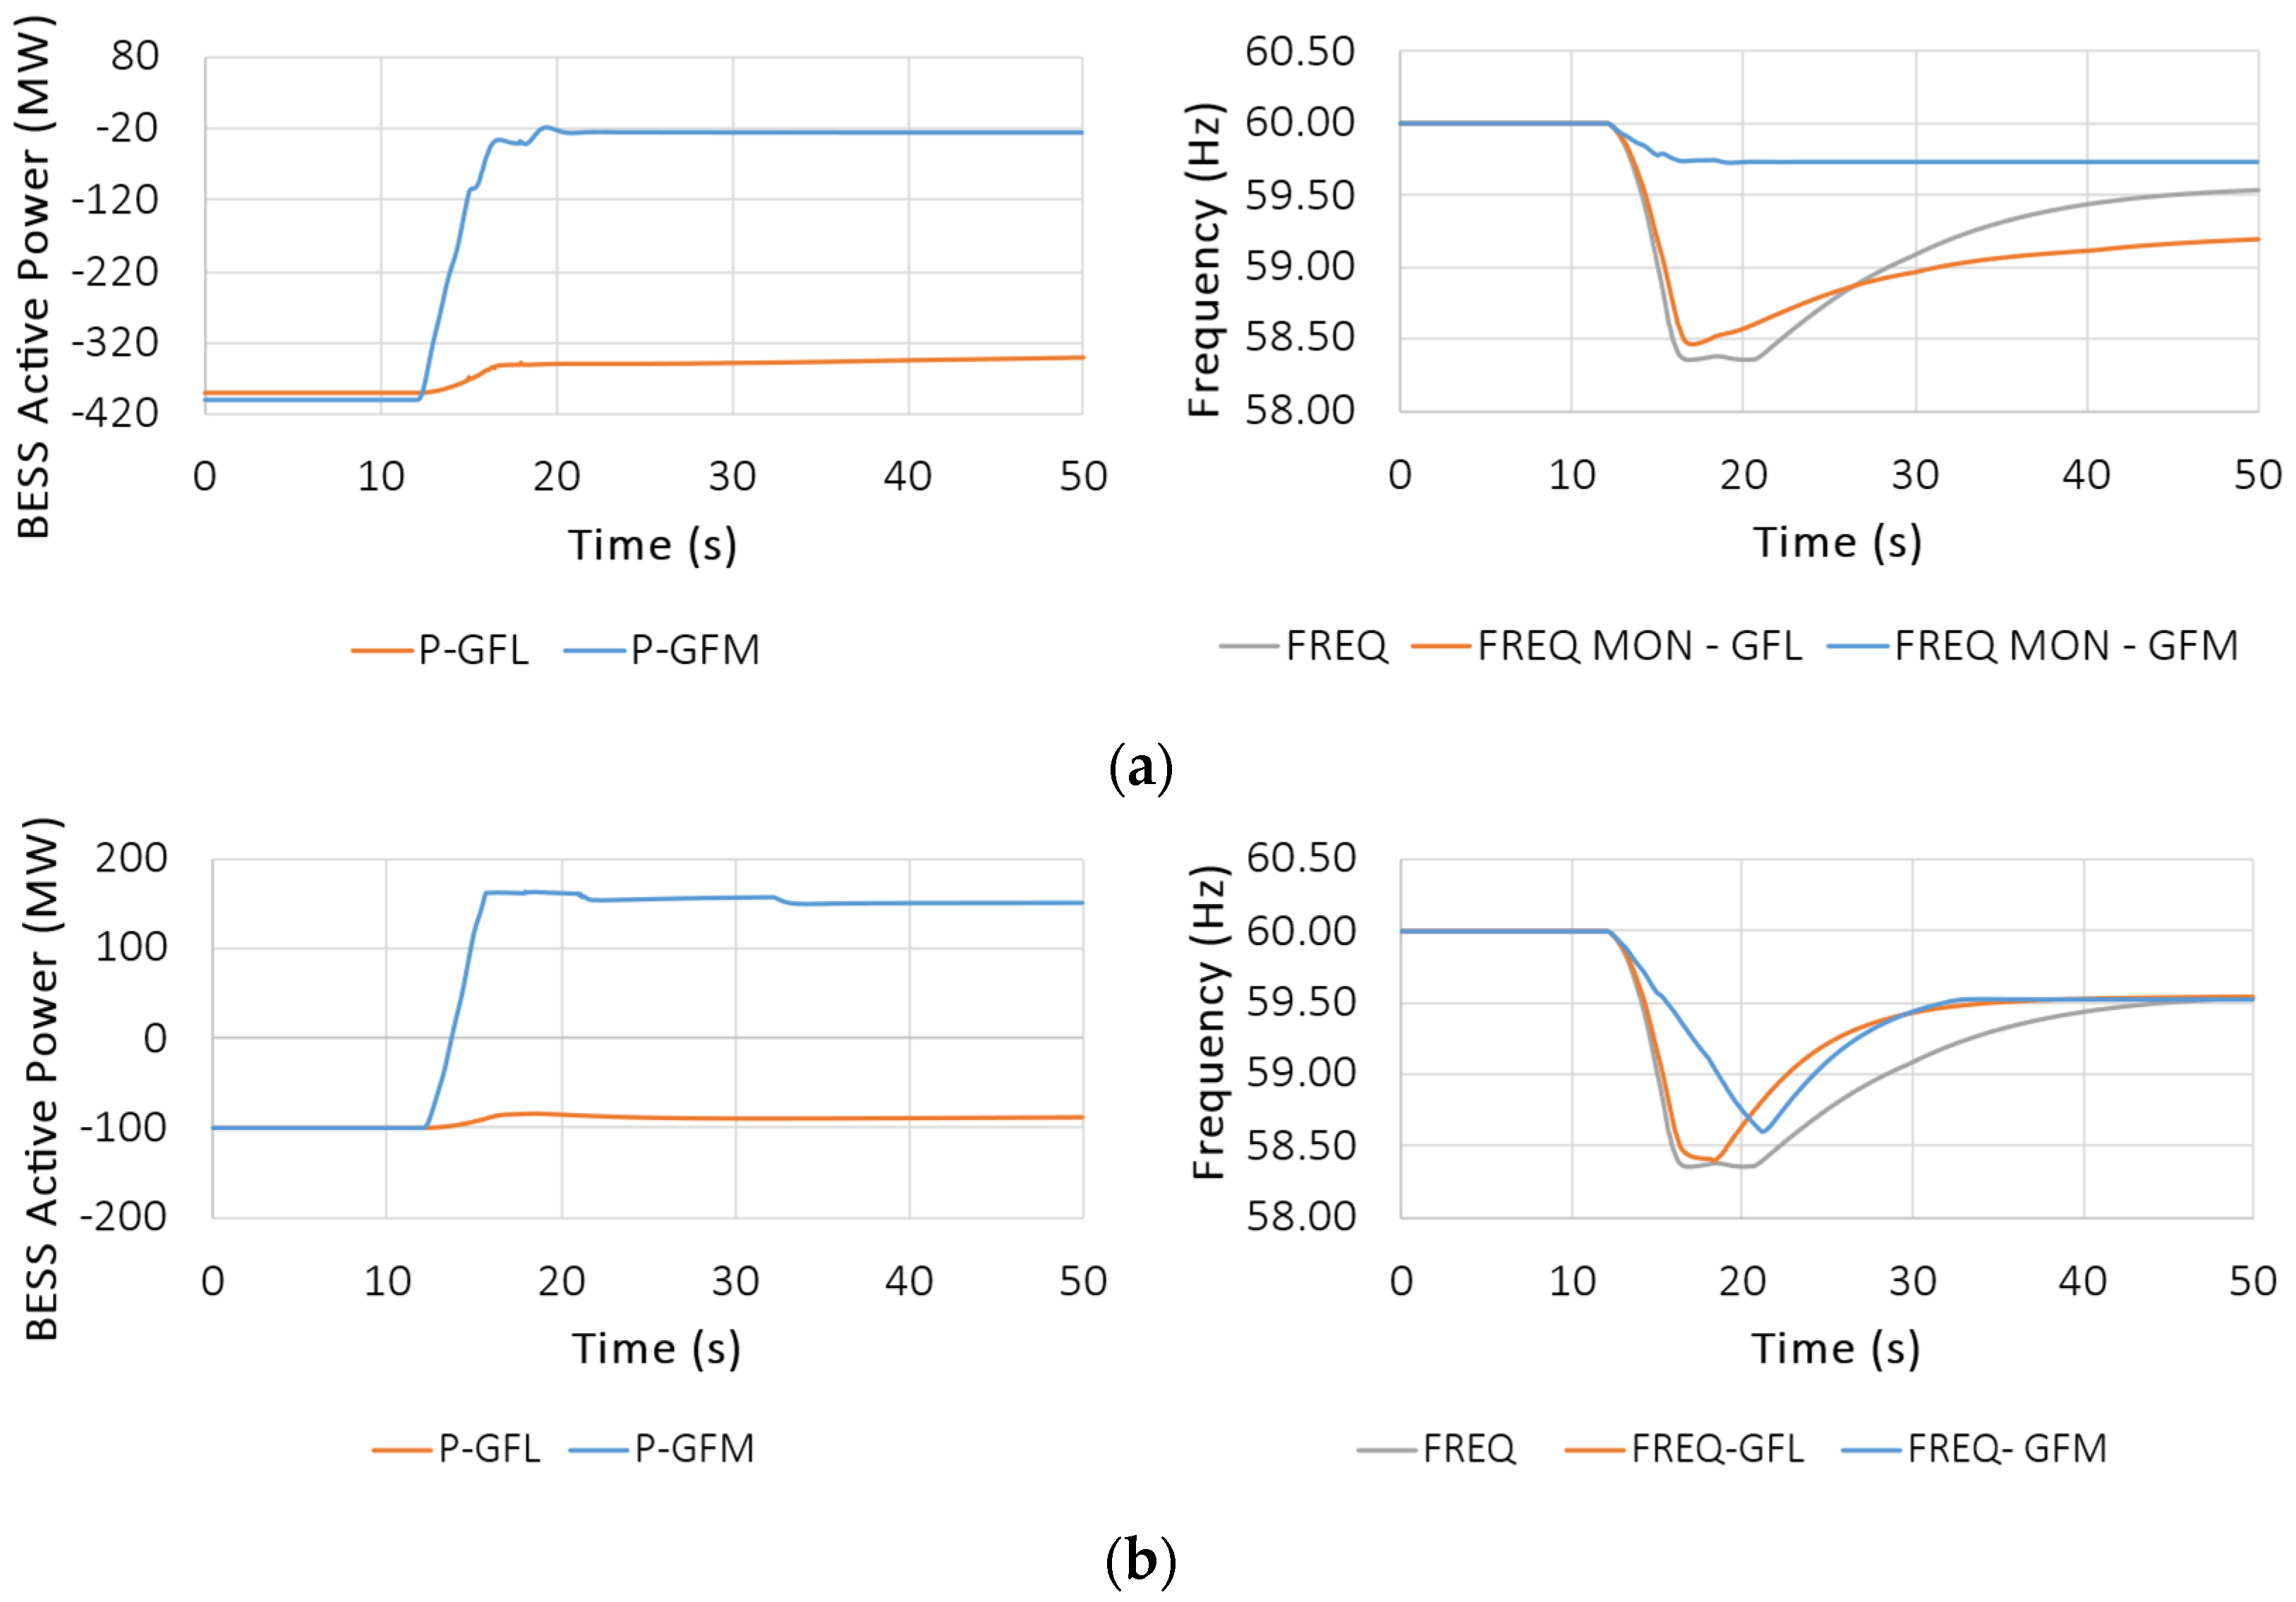
4.1.3. Discharging Mode

When operating under discharge mode, the BESS does not have much room in either GFM or GFL case to sustain the grid. This is because all the BESS capacity was previously being utilized for power export. This highlights the importance of real-time operational planning for reserves of at least some of the energy storage in a power system to provide frequency support. Figure 9 summarizes this condition and conclusion. This is observed for both cases, 400 MW in Figure 9a and 100 MW in Figure 9b, since no capacity room exists for either one.

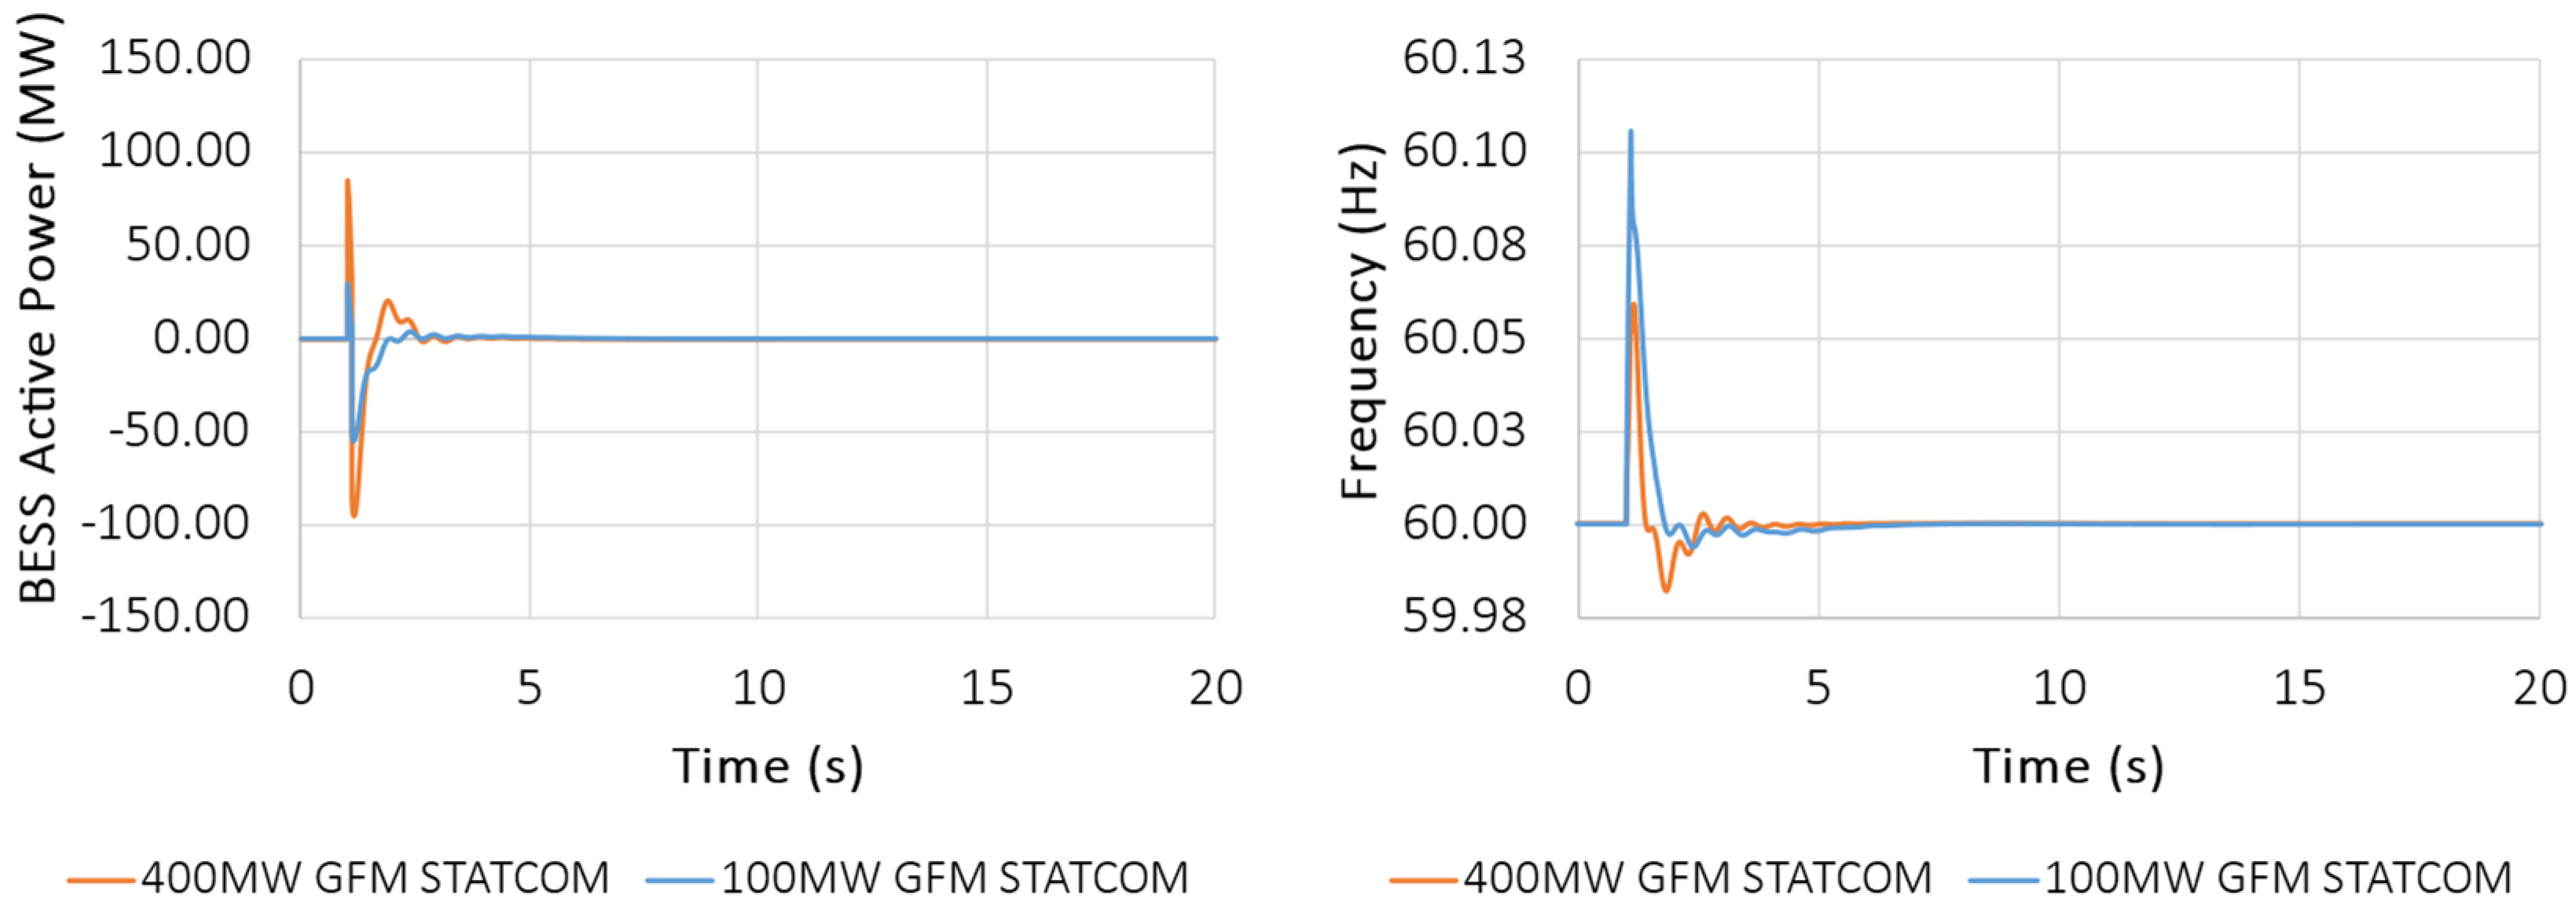
4.1.4. STATCOM Response

In this work, the researchers also simulated and analyzed the capabilities of STATCOM in the stability of the system. This technology is less capable than a BESS; however, it does have a few advantages. Namely, it has a much lower cost since it does not have chemistry battery packs. It can provide similar frequency stability, albeit for a short period of time (depending on the storage capacity of the supercapacitor). And it still works as a conventional STATCOM in steady-state operation by exchanging reactive power. Although a GFM STATCOM is not as widely available in the market, the authors are familiar with some of the technology proposed for such [26].
The simulation results for power and frequency response replicating Event I are presented in Figure 10, where the active power response is basically instantaneous but only lasts 10 s (as the supercapacitor charge depletes thereafter). After the depletion of the supercapacitor in 10 s, the GFM STATCOM cannot continue injecting active power and only continues the reactive power injection. The frequency arrest initially holds at 59.9 Hz, but as soon as the supercapacitor depletes, the frequency dips to about 58.6 Hz before it begins recovering. The described behavior corresponds is the same for both sizes of BESS used in this study, 400 MW presented in Figure 10a and 100 MW presented in Figure 10b.

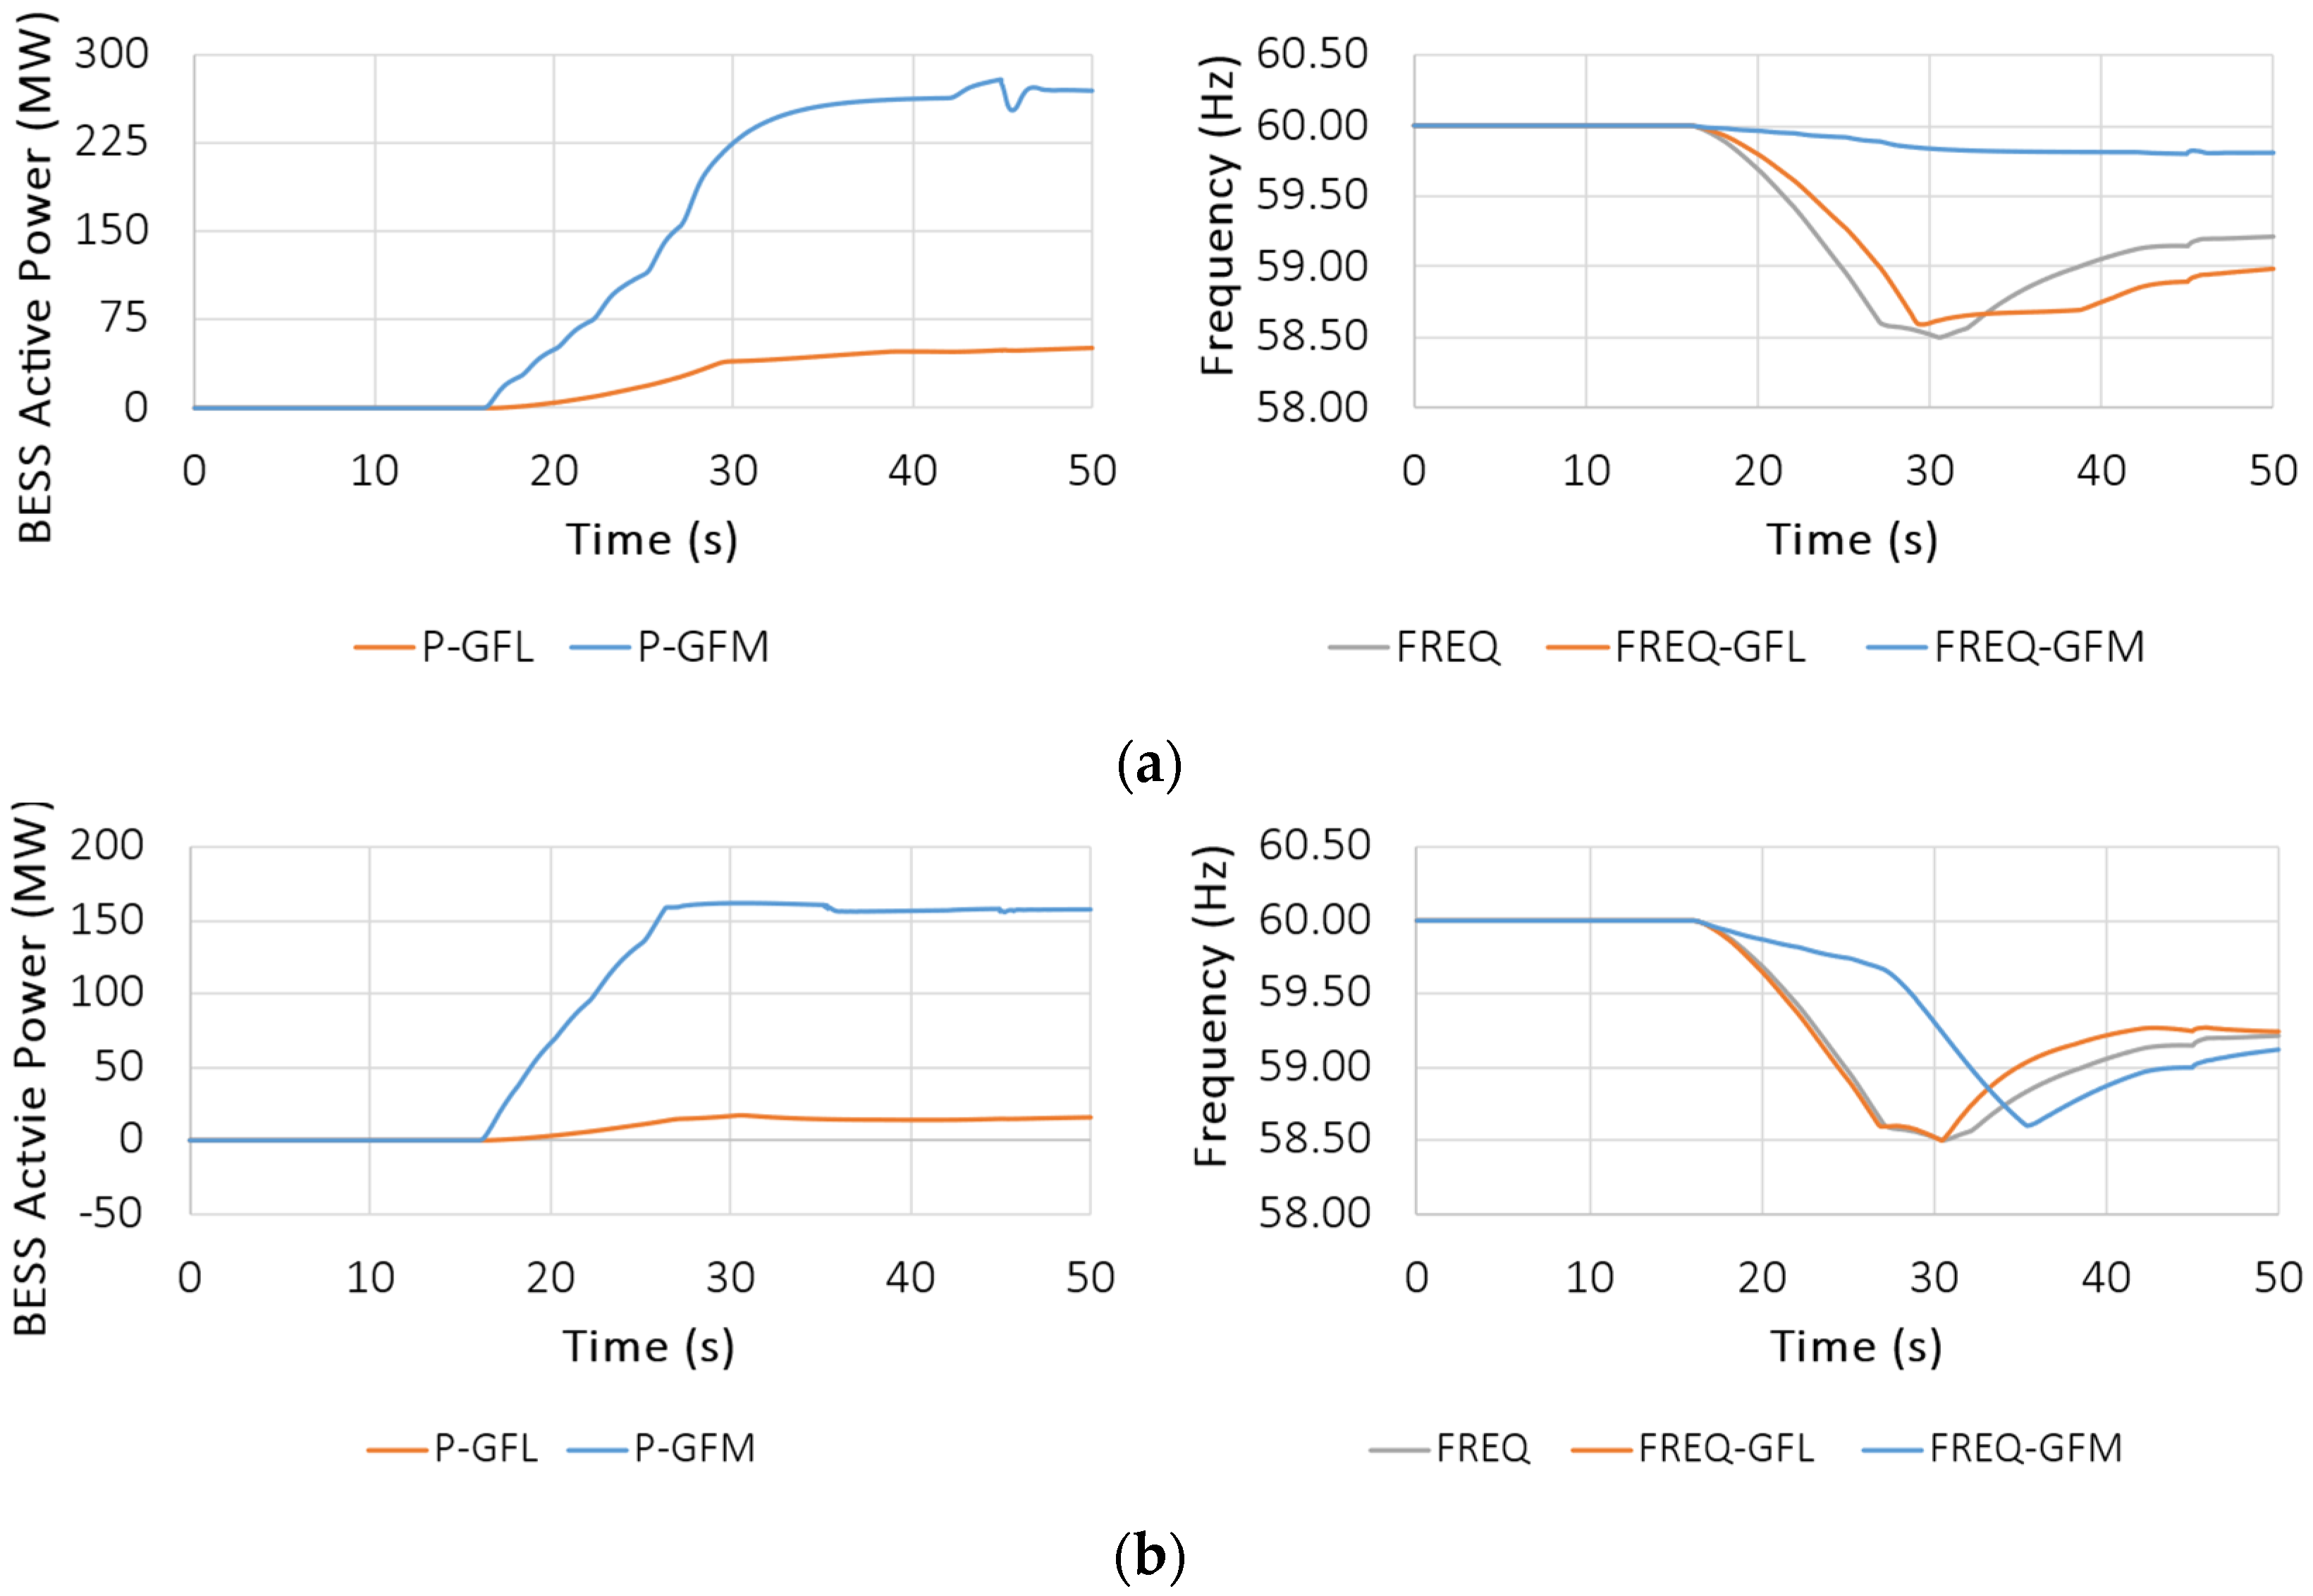
4.2. Event II: Loss of One Generation Unit

Obtained results for replication Event II are presented in Figure 11, Figure 12 and Figure 13. The figures have the same interpretation as those presented previously: on the right-hand side, the researchers present a comparison of BESS active power response with GFM and GFL, and on the left-hand side, a frequency response comparison for the base case, GFM BESS, and GFL BESS.

4.2.1. Idling State Mode

Event II, which represents the BESS in an idling state, illustrates that the GFM technology would respond very well in the face of a load shedding event. The BESS active power export increases in response to the generation power drop, accordingly. As a result, the 400 MW BESS export amounts to about 68% for the GFM case and about 18% with GFL, respectively. For the 100 MW BESS, the export amount is a full overload rating for the GFM BESS and only about 25% for the GFL BESS.
These simulations reveal the fast frequency response capability of the GFM BESS, shown to effectively arrest frequency and greatly reduce the ROCOF, as shown in Figure 11a, where frequency remains close to nominal value and drops less than 0.5%, whereas the GFL BESS shows very little impact. For the 100 MW case, the GFM BESS, although incapable of meaningful impact on frequency nadir, has a significant impact on ROCOF, as illustrated in Figure 11b, reducing the amount of time where the frequency is below 59 Hz by a great extent, although not increasing nadir values.

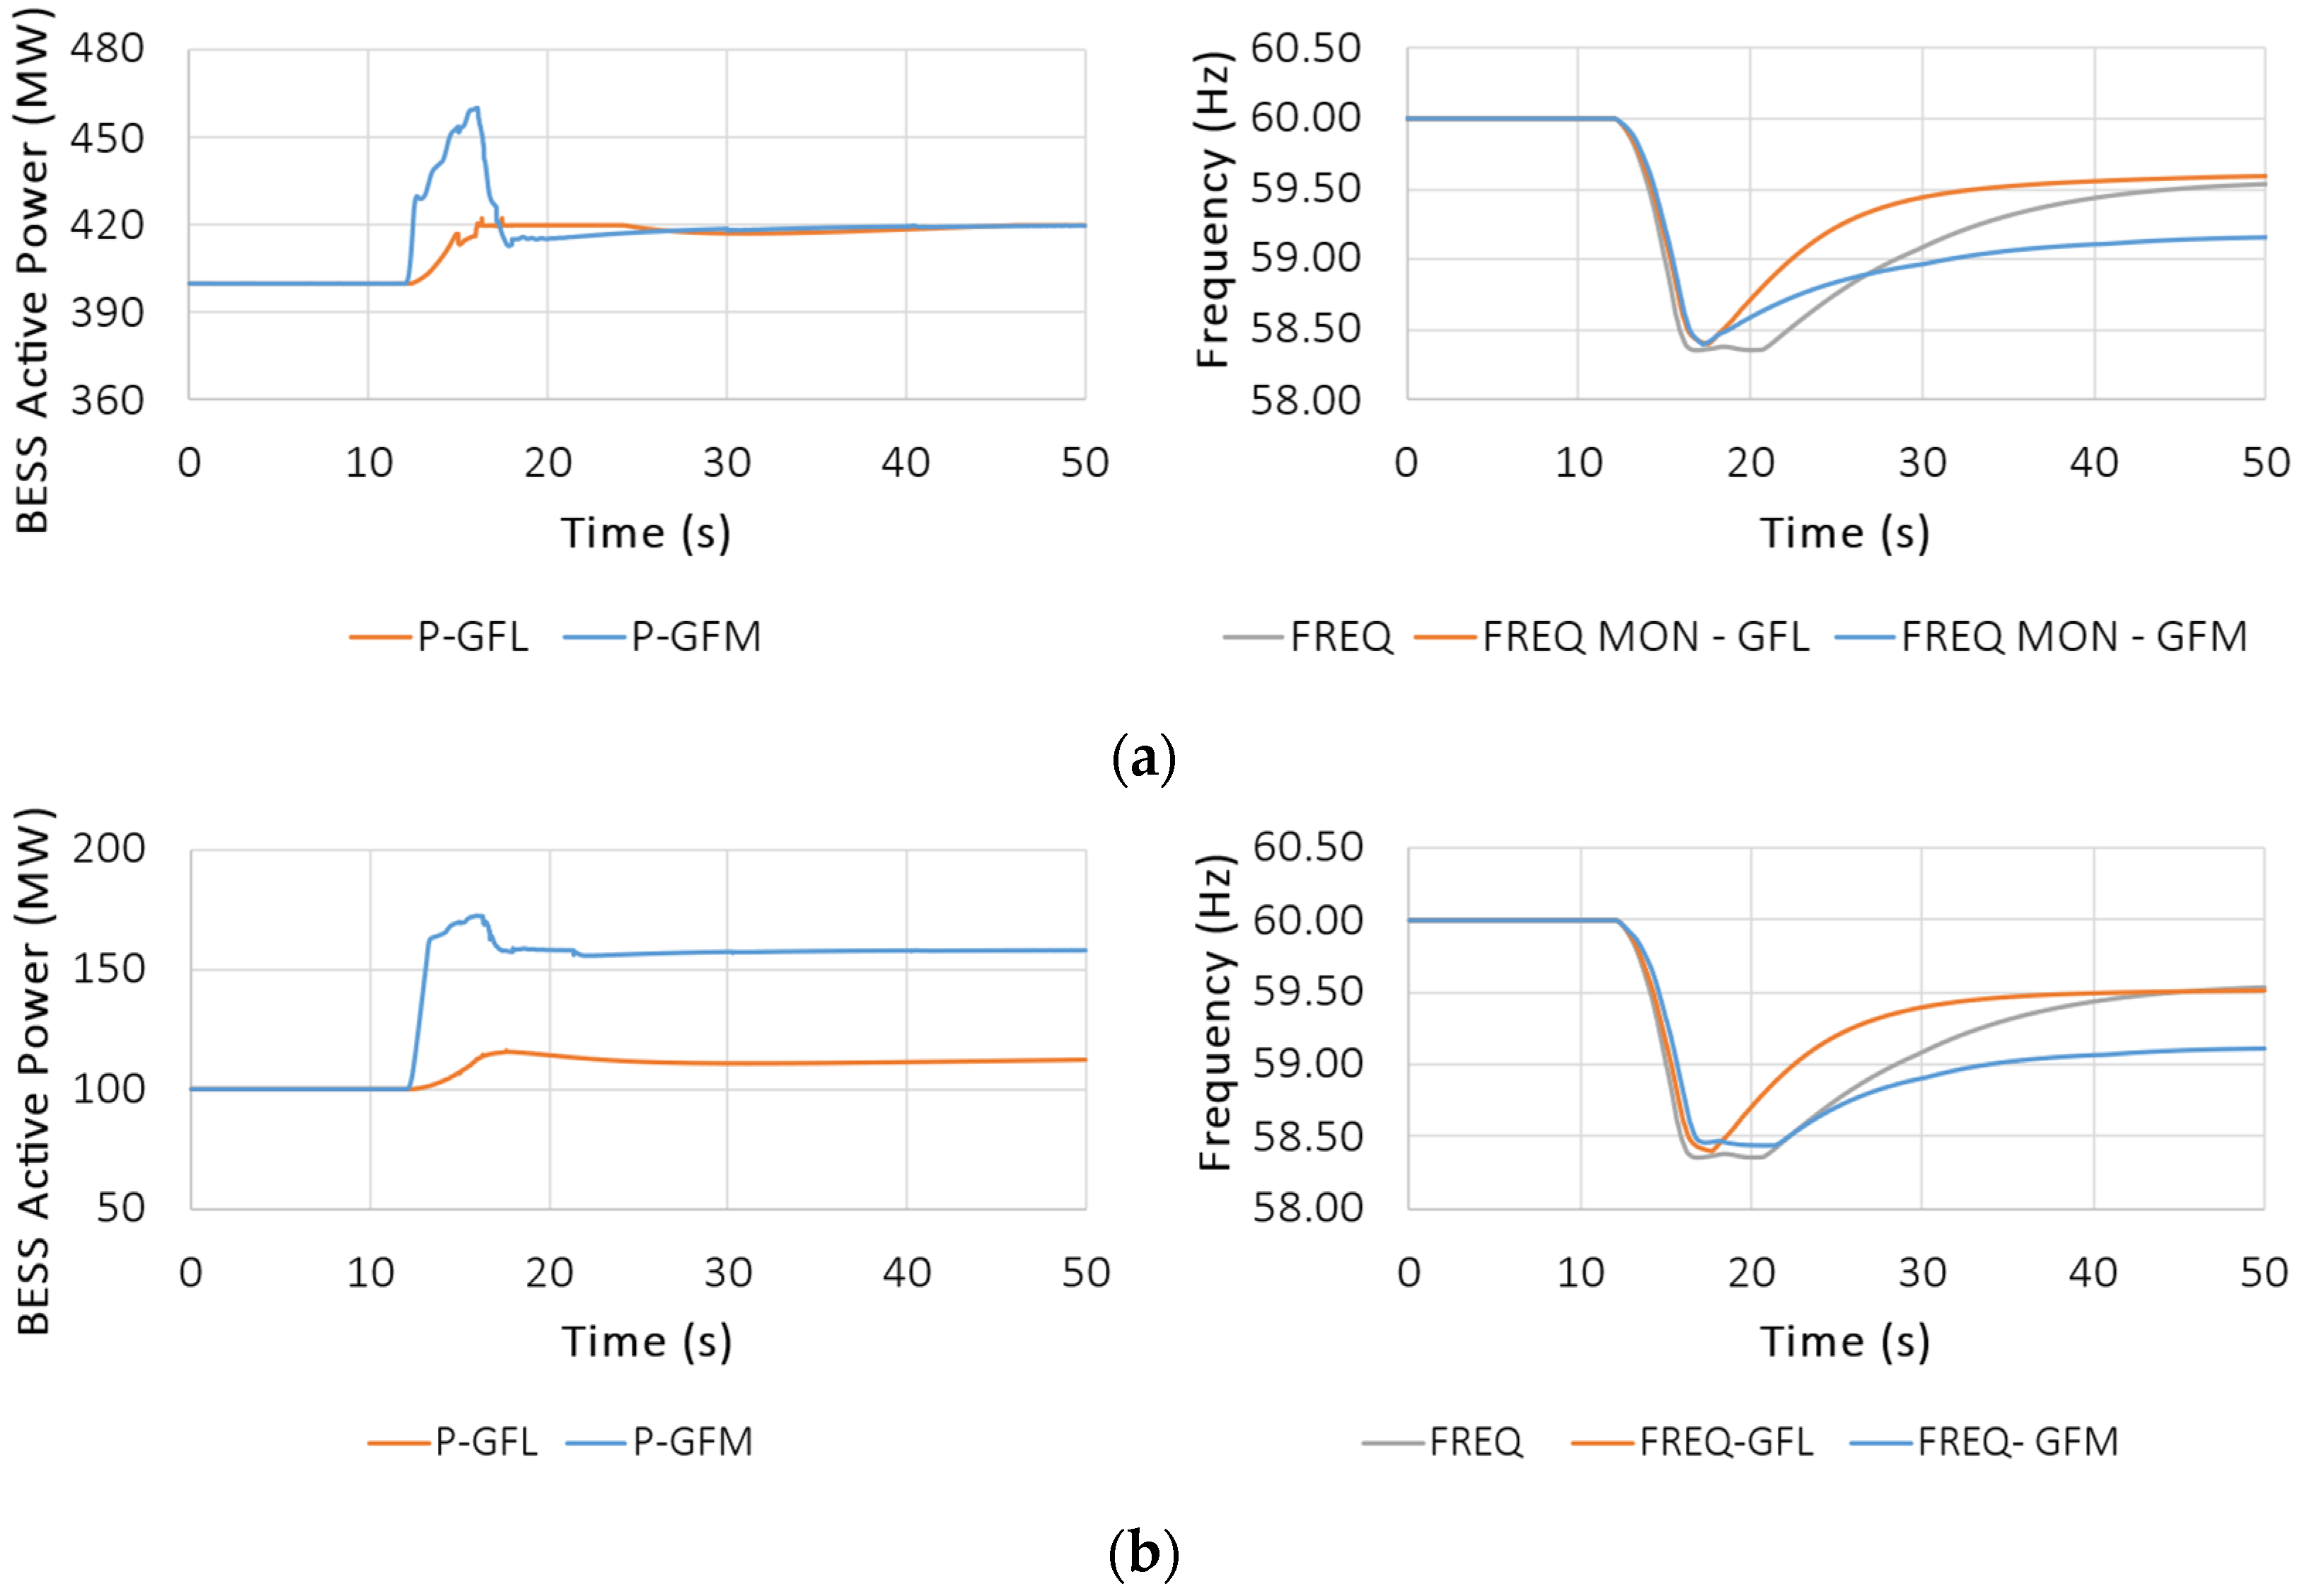
4.2.2. Charging Mode

As in Event I, when previously charging, the GFM BESS performance is very effective in completely averting the frequency drop, as shown in Figure 12, as opposed to the GFL BESS, which displays a lackluster response again. As for the 100 MW case, neither GFL nor GFM BESS are effective in arresting frequency completely due to the small inverter nameplate; however, the GFM response results in a very attenuated ROCOF, and it also has a great impact on frequency nadir (59 Hz vs. 58.5 Hz in the GFL case). These are shown in Figure 12a for BESS of 400 MW and Figure 12b for BESS of 100 MW.

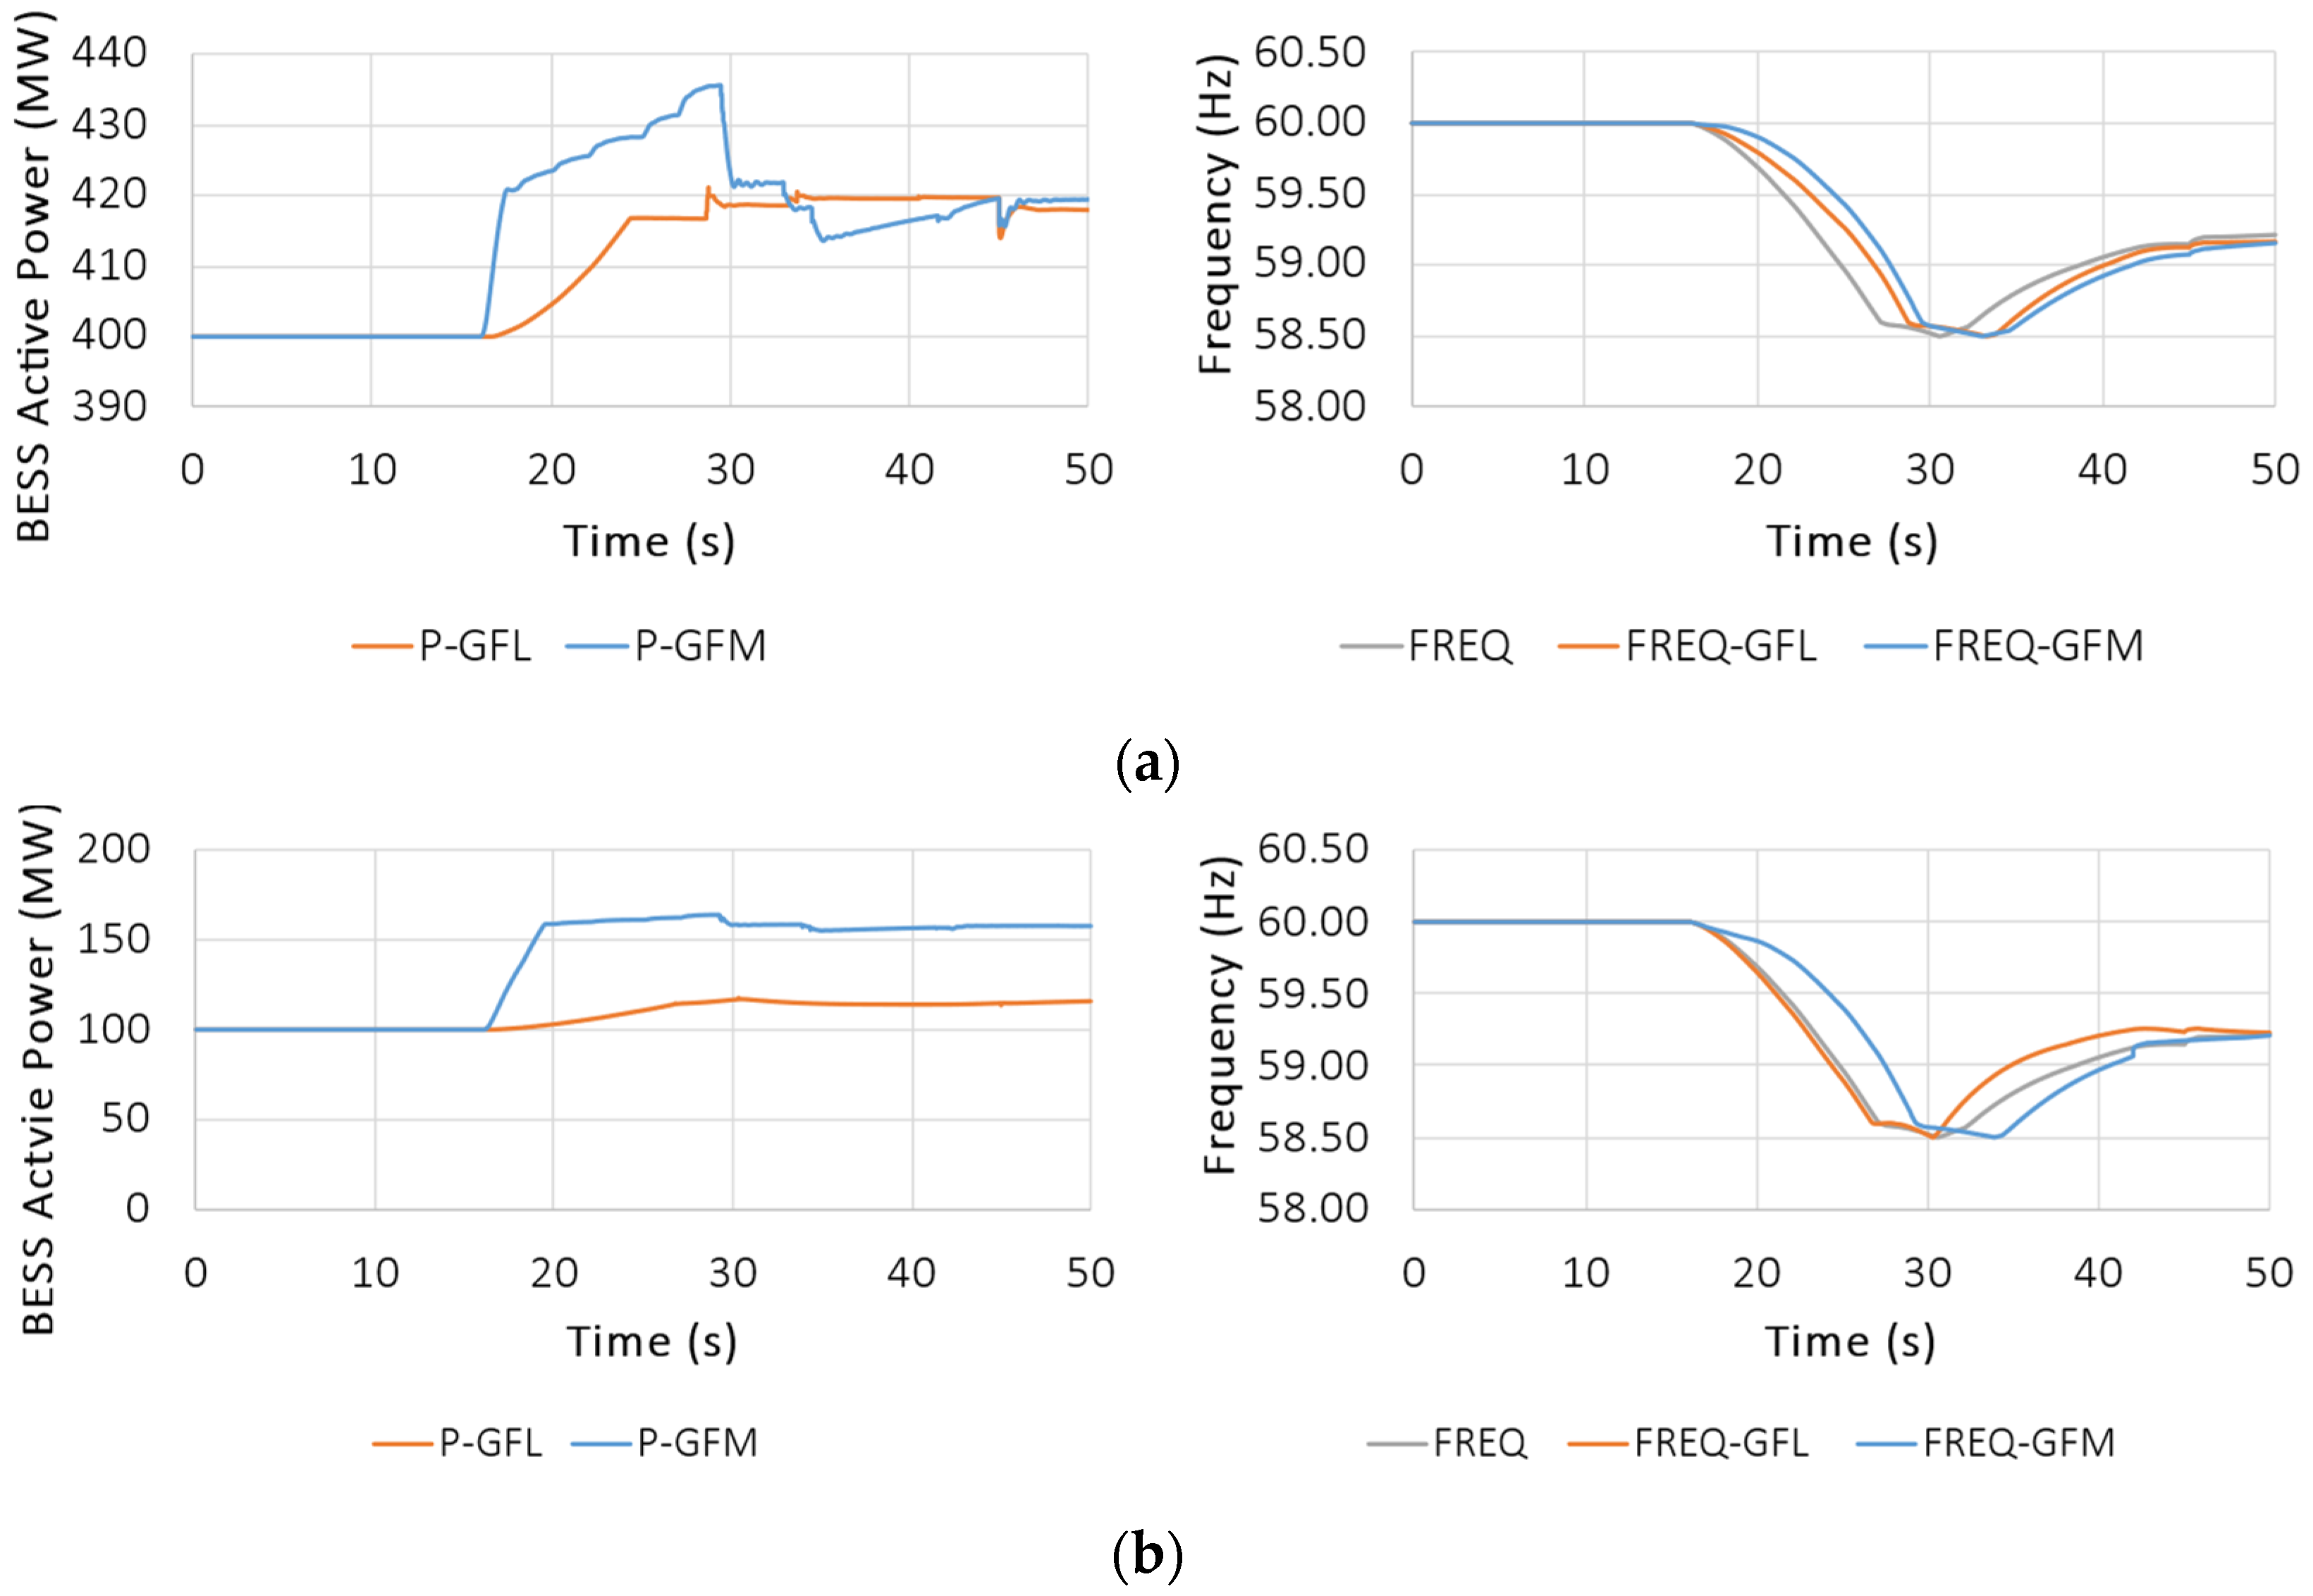
4.2.3. Discharging Mode

The results for the discharge mode are presented in Figure 13. As in the previous case, the fact the BESSs were discharged prior to the event leaves no room for significant response. The same conclusion applies, i.e., the system operator must maintain adequate capacity reserves for the BESS if these devices are intended to provide frequency stability support.

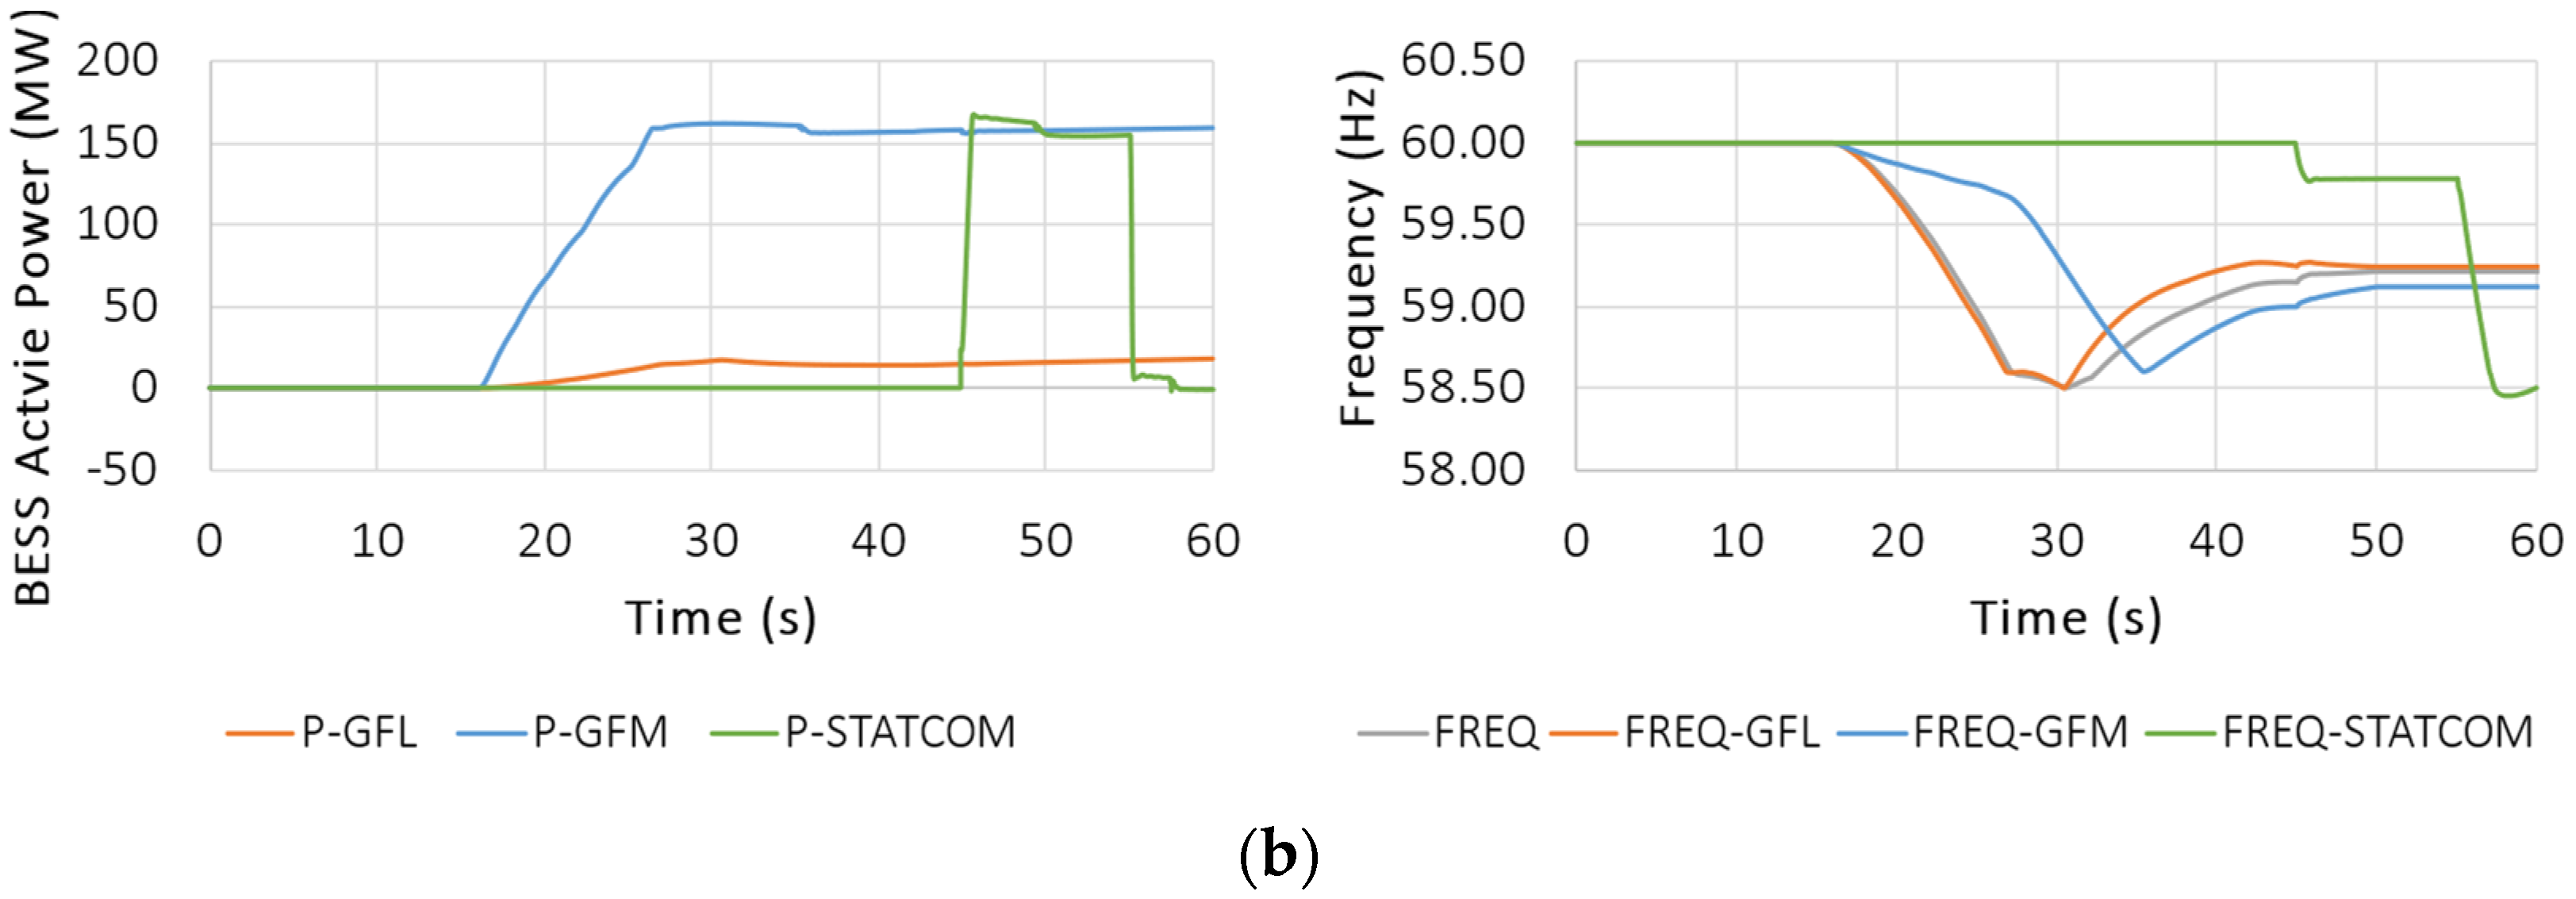
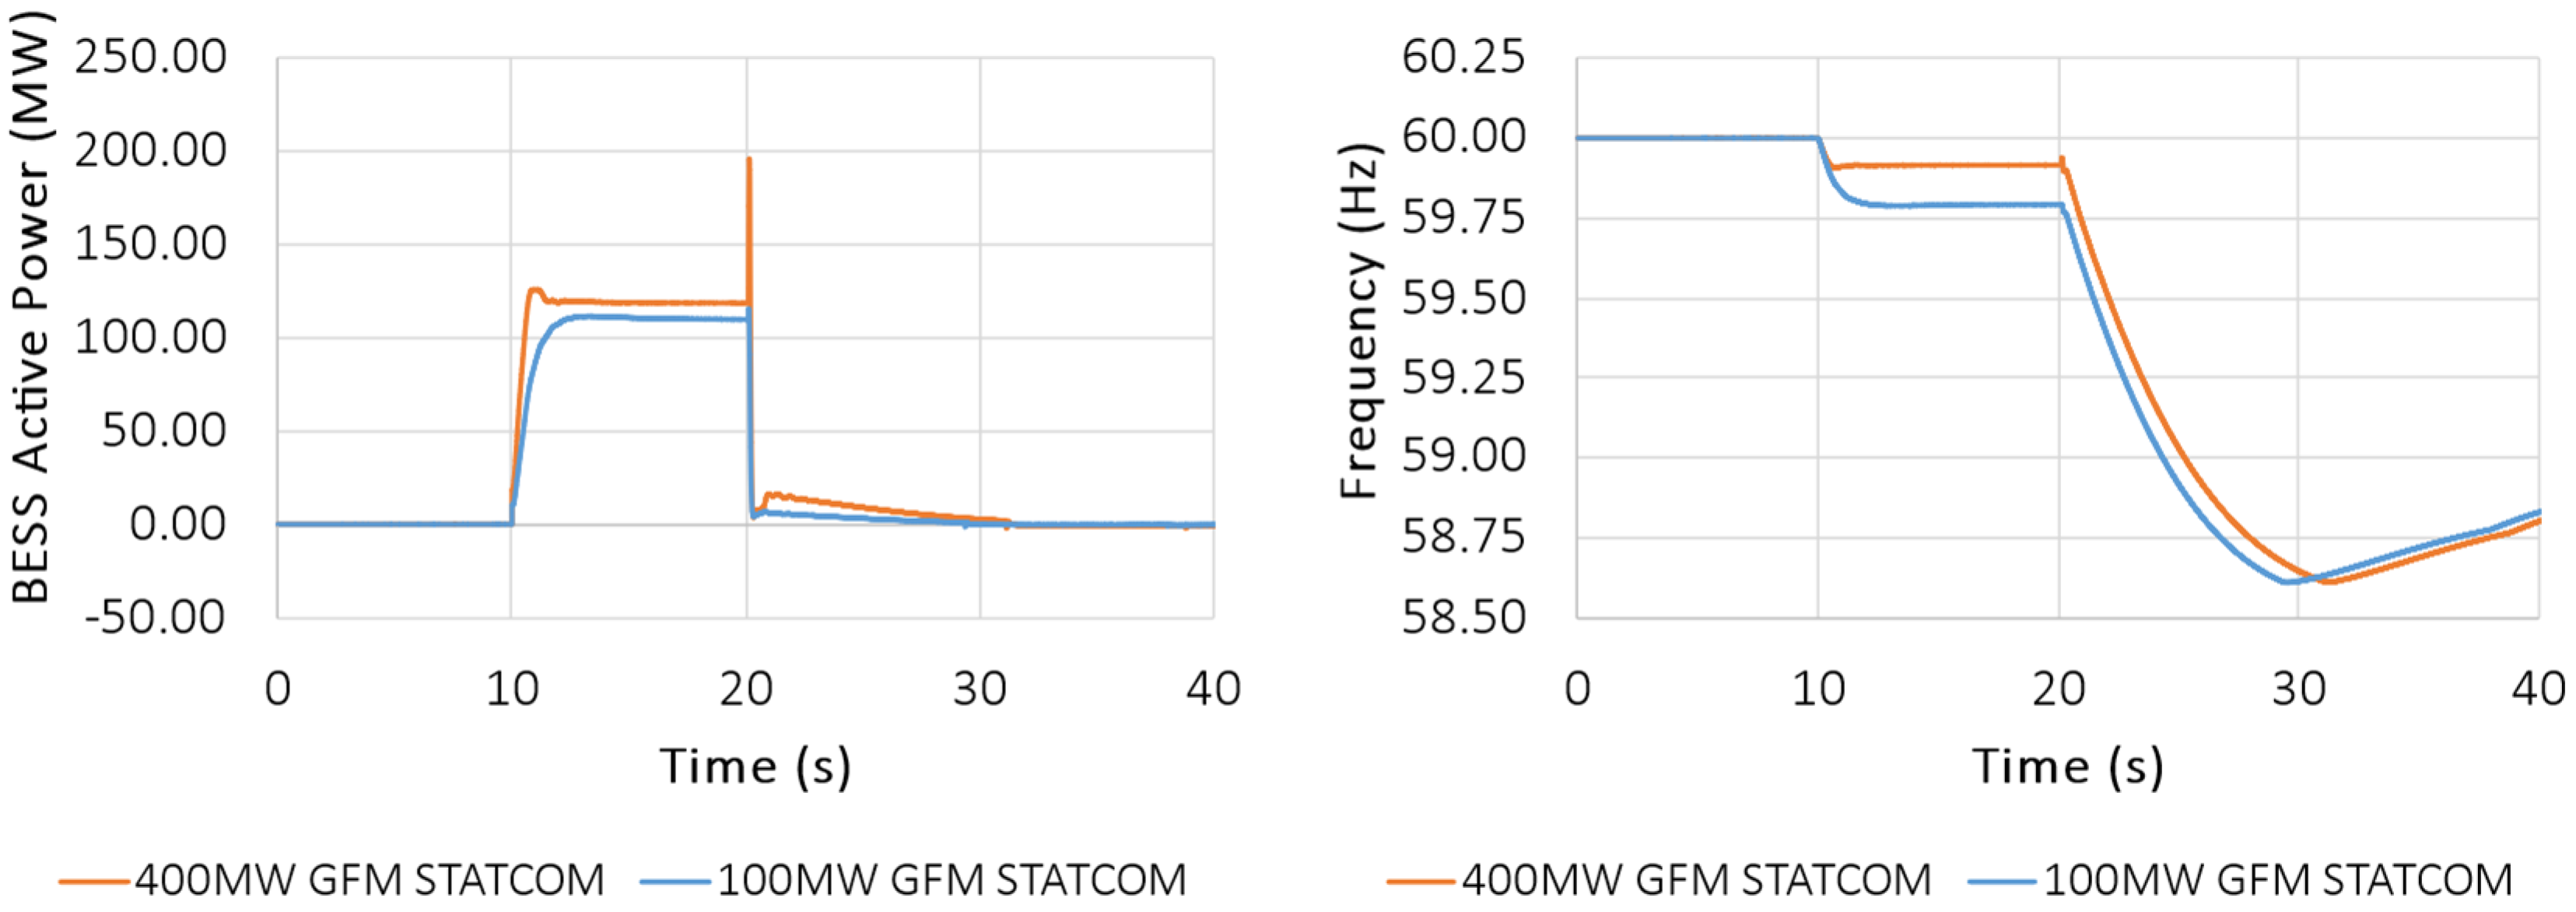
4.2.4. STATCOM Response

Finally, simulations of the STATCOM are also simulated for Event II, and the results are shown in Figure 14. The active power response is basically instantaneous and lasts 10 s, as this was the size simulated in this paper. After the depletion of the supercapacitor, the GFM STATCOM cannot continue injecting active power and only continues the reactive power injection. The frequency is arrested at 59 Hz, but as soon as the supercapacitor depletes, the frequency dips to about 58.5 Hz before it begins recovering.

4.3. Additional Analysis of the STATCOM Response

In this work, two additional tests were carried out. The first test corresponded to a three-phase fault applied on a transmission bus (230 kV), and 5.5 cycles after, the fault was cleared. The simulation results are presented in Figure 15, which shows a very fast active power response to support the fault and subsequently returns to zero. As a result, the frequency oscillates 0.1% above and 0.03% below the nominal value prior to converting to its nominal value. For the three-phase fault simulation, the obtained results for both sizes of GFM STATCOM show a fast response in active power, which contributes to the frequency stability of the system. The difference in frequency response is in the overshoot, since for 100 MW STATCOM, the overshoot reaches a higher value than 400 MW STATCOM. Frequency remains within 1% of the error margin with respect to nominal frequency for STATCOM sizes.
The second test consists of an abrupt trip of a generation unit. The simulation results for power and frequency response are presented in Figure 16, where the active power response is basically instantaneous but only lasts 10 s. After the depletion of the supercapacitor in 10 s, the GFM STATCOM cannot continue injecting active power and only continues the reactive power injection. The frequency is initially arrested to 59.9 Hz, but as soon as the supercapacitor depletes, the frequency dips to about 58.6 Hz before it begins recovering.

5. Conclusions

This paper studied the impact of GFM technology on the stability of power systems, replicating events of loss of generation units that resulted in large load shedding events. The authors adjusted the dynamic model of the power system in PSSE to replicate two past events captured by the SCADA system and used these tuned models to analyze the response of GFM and GFL technologies. These technologies included GFM-BESS and GFM-STATCOMs.
The results obtained from these simulations suggest that the GFM technology responds very fast to disturbances, contributes considerably to the inertia and stability of the power system, and stabilizes frequency in generation trip events. An adequately sized GFM BESS will provide a capacity reserve for frequency arrest and stabilization. GFM STATCOMs represent a more economical alternative to GFM BESS. The researchers are using these results to scope real project developments in Puerto Rico.
One gap currently identified in the industry is the lack of standards for the operation, tuning, and setting of GFM inverters. This need is imperative as research such as the one presented in this paper can only study and quantify their capabilities, but it is uncertain that all tuning required to derive such results is acceptable, endorsed, or mandated by regulatory bodies. Hence, industry bodies such as standards working groups must continue their efforts to allow utilities to better understand the benefits and hazards that can result from applying this technology.
Lastly, the authors would like to caveat that PSS/E simulations are based on positive-sequence network phasor simulations. The simulations in PSS/E utilized the GFM models developed by PNNL [27] that have been approved by NERC, and they are now being incorporated into the PSS/E standard library [28]. As a result, the model is deemed adequate for dynamic stability studies that are in the time scale of several seconds. The models cannot be used for harmonic, high-frequency, or low-frequency oscillations.

Author Contributions

Conceptualization, A.B.N. and O.D.G.; methodology, A.B.N. and O.D.G.; software, A.B.N., O.D.G., and M.R.; validation, A.B.N., O.D.G., and M.R.; formal analysis, A.B.N., O.D.G., and M.R.; investigation, A.B.N., O.D.G., and M.R.; resources, A.B.N. and O.D.G.; data curation, A.B.N. and O.D.G.; writing—original draft preparation A.B.N. and O.D.G.; writing—review and editing, A.B.N. and O.D.G.; visualization, A.B.N. and O.D.G.; supervision, A.B.N. All authors have read and agreed to the published version of the manuscript.

Funding

This research received no external funding.

Data Availability Statement

The data used for this research is of confidential nature and cannot be made publicly available.

Conflicts of Interest

Author Oscar D. Garzon and Alexandre B. Nassif were employed by the company LUMA Energy. Author Matin Rahmatian was employed by the company BC Hydro.

References

  1. Mahamedi, B.; Fletcher, J.E. The equivalent models of grid-forming inverters in the sequence domain for the steady-state analysis of power systems. IEEE Trans. Power Syst. 2020, 35, 2876–2887. [Google Scholar] [CrossRef]
  2. Rocabert, J.; Luna, A.; Blaabjerg, F.; Rodriguez, P. Control of power converters in AC microgrids. IEEE Trans. Power Electron. 2012, 27, 4734–4749. [Google Scholar] [CrossRef]
  3. Yazdani, A.; Iravani, R. Voltage-Sourced Converters in Power Systems: Modeling, Control, and Applications; John Wiley & Sons: Hoboken, NJ, USA, 2010. [Google Scholar]
  4. North American Electric Reliability Corporation (NERC). Protection System Response to Power Swings; NERC System Protection and Control Subcommittee Report; North American Electric Reliability Corporation (NERC): Atlanta, GA, USA, 2013. [Google Scholar]
  5. Sadamoto, T.; Chakrabortty, A.; Ishizaki, T.; Imura, J.I. Dynamic modeling, stability, and control of power systems with distributed energy resources. arXiv 2018, arXiv:1804.04933. [Google Scholar]
  6. Lin, Y.; Eto, J.H.; Johnson, B.B.; Flicker, J.D.; Lasseter, R.H.; Villegas Pico, H.N.; Seo, G.S.; Pierre, B.J.; Ellis, A. Research Roadmap on Grid-Forming Inverters; National Renewable Energy Lab. (NREL): Golden, CO, USA, 2020. [Google Scholar]
  7. Taul, M.G.; Wang, X.; Davari, P.; Blaabjerg, F. Current limiting control with enhanced dynamics of grid-forming converters during fault conditions. IEEE J. Emerg. Sel. Top. Power Electron. 2019, 8, 1062–1073. [Google Scholar] [CrossRef]
  8. Martínez-Gómez, M.; Burgos-Mellado, C.; Morales-Paredes, H.K.; Gómez, J.S.; Verma, A.K.; Bonaldo, J.P. Distributed Control Scheme for Clusters of Power Quality Compensators in Grid-Tied AC Microgrids. Sustainability 2023, 15, 15698. [Google Scholar] [CrossRef]
  9. Huang, L.; Xin, H.; Wang, Z.; Zhang, L.; Wu, K.; Hu, J. Transient stability analysis and control design of droop-controlled voltage source converters considering current limitation. IEEE Trans. Smart Grid 2017, 10, 578–591. [Google Scholar] [CrossRef]
  10. Ma, S.; Geng, H.; Liu, L.; Yang, G.; Pal, B.C. Grid-synchronization stability improvement of large-scale wind farm during severe grid fault. IEEE Trans. Power Syst. 2017, 33, 216–226. [Google Scholar] [CrossRef]
  11. Zhang, W. Control of Grid Connected Power Converters with Grid Support Functionalities; Universitat Politècnica de Catalunya: Barcelona, Spain, 2017. [Google Scholar]
  12. Wang, L.; Truong, D.N. Stability enhancement of DFIG-based offshore wind farm fed to a multi-machine system using a STATCOM. IEEE Trans. Power Syst. 2013, 28, 2882–2889. [Google Scholar] [CrossRef]
  13. Bak-Jensen, B.; El-Moursi, M.S.; Abdel-Rahman, M.H. Novel STATCOM controller for mitigating SSR and damping power system oscillations in a series compensated wind parks. IEEE Trans. Power Electron. 2010, 25, 429–441. [Google Scholar]
  14. Wang, X.; Taul, M.G.; Wu, H.; Liao, Y.; Blaabjerg, F.; Harnefors, L. Grid-synchronization stability of converter-based resources—An overview. IEEE Open J. Ind. Appl. 2020, 1, 115–134. [Google Scholar] [CrossRef]
  15. Zhao, F.; Wang, X.; Zhou, Z.; Kocewiak, Ł.; Svensson, J.R. Comparative study of battery-based STATCOM in grid-following and grid-forming modes for stabilization of offshore wind power plant. Electr. Power Syst. Res. 2022, 212, 108449. [Google Scholar] [CrossRef]
  16. Nassif, A.B.; Lelic, M.; Kushner, D.; Paaso, A. Reliability Challenges and Improvement Strategies in Puerto Rico. In Proceedings of the 2023 IEEE Power & Energy Society Innovative Smart Grid Technologies Conference (ISGT), Washington, DC, USA, 16 January 2023; IEEE: Piscataway, NJ, USA, 2023; pp. 1–5. [Google Scholar]
  17. Nassif, A.B.; Rahmatian, M.; Paaso, A.; Othman, H.; Gevorgian, V.; Fan, X.; Elizondo, M.; Du, W. Improving Frequency Stability and Minimizing Load Shedding Events by Adopting Grid-Scale Energy Storage with Grid Forming Inverters. In Proceedings of the 2023 IEEE PES Innovative Smart Grid Technologies Latin America (ISGT-LA), San Juan, Puerto Rico, 6–9 November 2023; IEEE: Piscataway, NJ, USA, 2023; pp. 5–9. [Google Scholar]
  18. Nassif, A.B.; Daneshpooy, A.; Othman, H.; Vu, K.; Paaso, A. A Resilience Driven Multi-Objective Approach for Optimal Placement of Energy Storage in Islanded Transmission Networks. In Proceedings of the 2023 IEEE PES Innovative Smart Grid Technologies Latin America (ISGT-LA), San Juan, Puerto Rico, 6–9 November 2023; pp. 15–19. [Google Scholar]
  19. Zhang, H.; Xiang, W.; Lin, W.; Wen, J. Grid forming converters in renewable energy sources dominated power grid: Control strategy, stability, application, and challenges. J. Mod. Power Syst. Clean Energy 2021, 9, 1239–1256. [Google Scholar] [CrossRef]
  20. Nassif, A.; Rahmatian, M.; Othman, H.; Paaso, A. Improvement of Frequency Nadir and RoCoF in Puerto Rico under High IBR Scenarios by Using Grid-Forming Capabilities. In Proceedings of the CIGRE Grid of the Future Symposium, Chicago, IL, USA, 7–10 November 2022. [Google Scholar]
  21. Lasseter, R.H.; Eto, J.H.; Schenkman, B.; Stevens, J.; Vollkommer, H.; Klapp, D.; Linton, E.; Hurtado, H.; Roy, J. CERTS microgrid laboratory test bed. IEEE Trans. Power Deliv. 2010, 26, 325–332. [Google Scholar] [CrossRef]
  22. Du, W.; Lasseter, R.H.; Khalsa, A.S. Survivability of autonomous microgrid during overload events. IEEE Trans. Smart Grid 2018, 10, 3515–3524. [Google Scholar] [CrossRef]
  23. Kenyon, R.W.; Sajadi, A.; Hoke, A.; Hodge, B.M. Open-source PSCAD grid-following and grid-forming inverters and a benchmark for zero-inertia power system simulations. In Proceedings of the 2021 IEEE Kansas Power and Energy Conference (KPEC), Manhattan, KS, USA, 19 April 2021; IEEE: Piscataway, NJ, USA, 2021; pp. 1–6. [Google Scholar]
  24. Nassif, A.B. Load Rejection Overvoltage of Distribution-Connected IBRs. IEEE Trans. Power Deliv. 2022, 37, 5488–5491. [Google Scholar] [CrossRef]
  25. SIEMENS Industry. Model Library PSSE 33; Siemens Power Technologies International: Schenectady, NY, USA, 2020; pp. 1–734. [Google Scholar]
  26. Avdiaj, E.; Beerten, J. Control of MMC-based Grid-Forming STATCOM with DC supercapacitors for energy storage. In Proceedings of the 2023 IEEE Belgrade PowerTech, Belgrade, Serbia, 25 June 2023; IEEE: Piscataway, NJ, USA, 2023; pp. 1–6. [Google Scholar]
  27. Du, W.; Liu, Y.; Tuffner, F.K.; Huang, R.; Huang, Z. Model Specification of Droop-Controlled, Grid-Forming Inverters (GFMDRP_A); Pacific Northwest National Laboratory: Richland, WA, USA, 2021. [Google Scholar]
  28. NERC White Paper: Grid Forming Functional Specifications for BPS-Connected Battery Energy Storage Systems, September 2023. Available online: https://www.nerc.com/comm/RSTC_Reliability_Guidelines/White_Paper_GFM_Functional_Specification.pdf (accessed on 14 January 2024).
Figure 1. Puerto Rico Transmission System (230 kV and 115 kV). Adapted from [18].
Electronics 13 01120 g001
Figure 2. Behavior of the generated power and frequency—Event I.
Electronics 13 01120 g002
Figure 3. Behavior of the generated power and frequency—Event II.
Electronics 13 01120 g003
Figure 4. Single line diagram of the BESS proposed.
Electronics 13 01120 g004
Figure 5. Structure of the GFM control used for PSSE simulations [22,23].
Electronics 13 01120 g005
Figure 6. Structure of the GFL control used for PSSE simulations [25].
Electronics 13 01120 g006
Figure 7. Replication Event I; the left side corresponds to active power response, and the right side corresponds to frequency response; (a) 400 MW BESS response and (b) 100 MW BESS response.
Electronics 13 01120 g007
Figure 8. Replication Event I; the left side corresponds to active power response, and the right side corresponds to frequency response; (a) 400 MW BESS response and (b) 100 MW BESS response.
Electronics 13 01120 g008
Figure 9. Replication Event I; the left side corresponds to active power response, and the right side corresponds to frequency response; (a) 400 MW BESS response and (b) 100 MW BESS response.
Electronics 13 01120 g009
Figure 10. STATCOM response: the left side corresponds to active power response, and the right side corresponds to frequency response; (a) 400 MW GFM-STATCOM and (b) 100 MW GFM-STATCOM.
Electronics 13 01120 g010
Figure 11. Replication Event II: the left side corresponds to active power response, and the right side corresponds to frequency response; (a) 400 MW BESS response and (b) 100 MW BESS response.
Electronics 13 01120 g011
Figure 12. Replication Event II: the left side corresponds to active power response, and the right side corresponds to frequency response; (a) 400 MW BESS response and (b) 100 MW BESS response.
Electronics 13 01120 g012
Figure 13. Replication Event II: the left side corresponds to active power response, and the right side corresponds to frequency response; (a) 400 MW BESS response and (b) 100 MW BESS response.
Electronics 13 01120 g013
Figure 14. STATCOM response: the left side corresponds to active power response, and the right side corresponds to frequency response; (a) 400 MW GFM-STATCOM and (b) 100 MW GFM-STATCOM.
Electronics 13 01120 g014aElectronics 13 01120 g014b
Figure 15. GFM STATCOM response for three-phase faults.
Electronics 13 01120 g015
Figure 16. GFM STATCOM response for drop unit.
Electronics 13 01120 g016
Table 1. Summary of OH and UG miles for 1057 feeders.
kV13.28.327.24.16TotalCustomers
OH miles25533673414649713,1541,459,132
UG miles2459346604343299
Table 2. Transmission system information.
Transmission LinesLine/Segment CountLength [Miles]
38-kV185/2851563
115-kV46/99711
230-kV12/18424
Total243/4022698
Table 3. GFM technical parameters.
VariablesDescriptionValue
m q Q-V Droop gain0.02
k p v Proportional gain for voltage controller0.0
k i v Integral gain for voltage controller (>0)5.86
k p p m a x Proportional gain of the Pmax and Pmin controller0.01
k i p m a x Integral gain of the Pmax and Pmin controller0.1
PmaxUpper limit of the inverter’s active power control1.0
PminLower limit of the inverter’s active power control−1.0
PsetPower Set Point ---
EmaxUpper limit of the output of the voltage controller1.25
EminLower limit of the output of the voltage controller0
VsetVoltage Set point ---
QmaxUpper limit of the inverter reactive power control1
QminLower limit of the inverter reactive power control−1
k p q m a x Proportional gain of the Qmax and Qmin controller3
k i q m a x Integral gain of the Qmax and Qmin controller20
ω Frequency
Table 4. GFL technical parameters.
VariablesDescriptionValue
dbd1Voltage error dead band lower threshold (≤0)−0.15
dbd2Voltage error dead band upper threshold (≥0)0.15
KqvReactive current injection gain during over and undervoltage conditions2.0
IqhlMaximum limit of reactive current injection 1.0
IqllMinimum limit of reactive current injection −1.0
V r e f o User-defined reference1.0
TpFilter time constant for electrical power (s)0.1310
QmaxReactive power limit maximum1.0
QminReactive power limit minimum−1.0
VmaxVoltage control maximum1.5
VminVoltage control minimum0
KqpProportional gain on Q control0.3301
KqiIntegral gain on Q control1.49
KvpProportional gain on V control0
KviIntegral gain on V control0
TiqTime constant on delay s40.014
dPmaxPositive Ramp rate on power reference0.0017
dPminNegative Ramp rate on power reference−0.0017
PmaxMaximum power reference1.0
PminMinimum power reference−1.0
TpordFilter time constant on Pord (s)0.001
TBattery discharge time (s)100
SOCiniInitial state of charge 0.5
SOCmaxMaximum allowable state of charge 1.0
SOCminMinimum allowable state of charge −1.0
Disclaimer/Publisher’s Note: The statements, opinions and data contained in all publications are solely those of the individual author(s) and contributor(s) and not of MDPI and/or the editor(s). MDPI and/or the editor(s) disclaim responsibility for any injury to people or property resulting from any ideas, methods, instructions or products referred to in the content.

