Abstract
Community detection has been a subject of extensive research due to its broad applications across social media, computer science, biology, and complex systems. Modularity stands out as a predominant metric guiding community detection, with numerous algorithms aimed at maximizing modularity. However, modularity encounters a resolution limit problem when identifying small community structures. To tackle this challenge, this paper presents a novel approach by defining community structure information from the perspective of encoding edge information. This pioneering definition lays the foundation for the proposed fast community detection algorithm CSIM, boasting an average time complexity of only . Experimental results showcase that communities identified via the CSIM algorithm across various graph data types closely resemble ground truth community structures compared to those revealed via modularity-based algorithms. Furthermore, CSIM not only boasts lower time complexity than greedy algorithms optimizing community structure information but also achieves superior optimization results. Notably, in cyclic network graphs, CSIM surpasses modularity-based algorithms in effectively addressing the resolution limit problem.
1. Introduction
In various fields such as social media, computer science, biology, management science, and engineering, complex systems are often represented in the form of complex networks. These complex networks can be depicted as graphs in graph theory, where nodes in the graph represent entities in the system, and edges represent interactions between entities [1]. For example, in online social networks, nodes may represent users on the platform, and edges could signify friendship relationships or shared interests [2,3], and in a blockchain network, nodes represent participants such as individuals, companies, or servers that execute transactions, while edges represent the connections or interactions between these nodes, often symbolizing specific transactions. Due to varying degrees of connectivity between nodes of different types, these natural connections between nodes inherently facilitate the formation of communities. Communities are subsets of nodes within the network that are tightly connected internally but have sparse connections between them. Communities often reflect common characteristics among nodes, such as similar backgrounds in social networks or related functionalities in cellular metabolism [4,5,6].
Measuring the community structure within networks holds significant implications for understanding complex systems and characterizing organizational structures. Consequently, metrics for community structure have rapidly garnered widespread attention in computer science, leading to the introduction of several prominent measures such as modularity [7], modular density [8], surprise [9], and permanence [10], among others. Among these metrics, modularity, initially proposed by Newman and Girvan [11], stands out as the most renowned and widely applied. A specific class of community detection algorithms is designed to optimize modularity. For example, hierarchical clustering optimization has been utilized to optimize modularity [12], simulated annealing has been introduced into modularity optimization [13], extremum optimization methods have been employed for modularity optimization [14], the optimization of modularity using eigenvalues and eigenvectors of special matrices has been explored [15], and mathematical programming has been introduced for modularity optimization [16], among others. Among these, the Louvain algorithm [12] has become the most commonly used algorithm due to its low time complexity and high accuracy [17].
Despite the widespread application of modularity, it possesses inherent limitations, with the most notable being the resolution limit problem [18]. This refers to modularity optimization’s inability to detect communities smaller than a certain threshold, presenting a challenge, particularly in networks with heterogeneous communities or when certain communities are substantially smaller than the overall network. In such instances, modularity-based community detection algorithms may overlook or merge smaller substructures, resulting in a loss of granularity in community delineation. This challenge stems from the inherent difficulty of the modularity function in striking an optimal balance between the number and size of communities, potentially merging or obscuring small-scale communities and impacting the accuracy and completeness of the detection process. In response to this challenge, researchers have proposed various modifications and alternative metrics [8,19]. However, these methods often address specific scenarios and come with high time complexity.
In 2015, Li et al. introduced an information-theoretic measure of network complexity termed the structure entropy of networks [20]. Structure entropy, defined for a graph, G, represents the average number of bits required to identify the codes of a node, v accessible from a step of random walk in G relative to a stationary distribution. They subsequently proposed an algorithm for community detection in networks by minimizing structure entropy, claiming that their approach achieves a more balanced community size compared to modularity optimization algorithms. While their research presents a promising avenue for community detection, the concept of structural entropy, derived from coded random walks, may pose challenges in terms of intuitiveness and comprehension for some researchers. Furthermore, their proposed algorithm exhibits higher time complexity compared to the widely used Louvain algorithm [12], hindering its widespread adoption and application in practical scenarios.
In summary, current research in community detection confronts several challenges that warrant attention and further exploration. Firstly, modularity-based algorithms such as Louvain, while renowned for their efficiency with low time complexity, are hindered by the resolution limit problem. This limitation poses a significant obstacle, particularly when dealing with networks exhibiting high heterogeneity or containing small-scale communities that may be overlooked or merged. Secondly, methods based on structural entropy have emerged as promising alternatives, boasting claims of achieving a harmonious balance between community size and quantity. However, the concept of structural entropy, derived from coded random walks, presents a steep learning curve and may prove less intuitive and accessible to researchers unfamiliar with its intricacies. Moreover, while some approaches, including those leveraging structural entropy, offer potential solutions to the resolution limit problem in certain contexts, they often come with higher algorithmic complexity. This increased computational overhead may limit their practical applicability, particularly in scenarios where computational resources are limited or where real-time processing is required.
In this paper, we aim to address the above challenging issues. Specifically, we define community structure information as the average amount of information that can be compressed per edge, given a known community structure, providing a more intuitive representation of the essence of structural entropy. Secondly, drawing inspiration from the Louvain algorithm, we introduce a fast community detection algorithm that optimizes the value of community structure information. Finally, we validate the practical effectiveness of the algorithm through experiments. The main contributions of this paper are summarized as follows:
- We introduce a novel approach to defining structural entropy by focusing on the encoding of edge information, named community structure information. This approach calculates the difference in the number of bytes required to encode an edge under unknown and known community structures, capturing the amount of information leaked via the community structure.
- We propose an algorithm, CSIM, for the approximate calculation of the maximum community structure information, which can be employed for community detection. Notably, for a social network with n nodes, the time complexity is the same as that of the Louvain algorithm, with both having an average time complexity of .
- We conducted experiments on real-world network data, and the results demonstrate that the computational output of our proposed algorithm closely approximates the maximum value of community structure information. Furthermore, the community structure obtained through this algorithm aligns more closely with the ground truth community structure.
We organized the paper as follows. Section 2 presents an overview of related works on the measure of complex networks, community detection, and structure entropy. In Section 3, we provide the definition of community structure information from the perspective of encoding edge information and subsequently quantify the information leaked via the community structure. In Section 4, we introduce a novel community detection algorithm that maximizes community structure information, accompanied by proof of the algorithm’s time complexity. In Section 5, we evaluate and analyze the performance of our algorithm using real-world network data. In Section 6, we discuss the contributions and implications of our study. Finally, we conclude our work in Section 7.
2. Related Work
In this section, we mainly focus on the related works on the metrics for structural information in complex network, community detection, and structure entropy.
2.1. Metrics for Structural Information
In the domain of information theory, the precise quantification of structural information poses a prominent challenge to computer and information science. Rashevsky [21] is acknowledged for pioneering the initial measurement of complex networks, inaugurating efforts to capture the intricacies of structural information. Over the years, researchers have introduced a myriad of metrics targeting the delineation of structural complexities across diverse network types, including notable measures like Shannon entropy, von Neumann entropy [22], parametric graph entropy [23], and Gibbs entropy [24], among others.
While these traditional information metrics have made significant contributions, many essentially represent variations of Shannon entropy tailored to distinct distribution types. Recognizing the necessity of innovative approaches, recent advancements have explored alternative perspectives on structural information [25].
Recognizing the importance of community structure in real-world networks, Newman [26] introduced modularity as a metric to assess the strength of community divisions within a network, becoming instrumental in uncovering underlying structures and patterns in complex systems. Drawing inspiration from random walks, Rosvall et al. [27] proposed a novel metric calculating the average bits per step, leveraging ergodic node visit frequencies within a network. This approach provides a nuanced understanding of structural information dynamics. Describing structural information, Li et al. [20,25] introduced the concept of K-dimensional structural entropy for graphs, defining it as the minimum bits required to encode a vertex accessible from a random walk step. This metric explores the multidimensional aspects of structural information, offering a more comprehensive characterization.
Additionally, Zhang et al. [28] proposed a novel metric of structural entropy for complex networks, drawing on nonextensive statistical mechanics to enhance comprehension of complex network structures and characteristics. Liu et al. [29] introduced A-entropy and B-entropy, metrics tailored to gauge self-reinforcing substructures within multi-agent systems. Zhang et al. [30] proposed betweenness structural entropy based on betweenness centrality, with the goal of shedding light on the structural organization and dynamics of complex systems represented by networks. Cai et al. [31] presented SP structure entropy, aiming to capture the complexity and organization of networks, especially those characterized by series-parallel components.
Recent advancements highlight a transition towards more diverse and nuanced methods for measuring structural information in complex networks, surpassing conventional entropy-based metrics. Drawing inspiration from these metrics, this paper introduces a novel approach to gauging structured information by encoding edge information perspectives.
2.2. Community Detection
Community detection, a crucial task in unveiling concealed structures within complex networks, traces its rich history back to 1955, when Weiss and Jacobson pioneered the analysis, leveraging relationships among members in government organizations to discern working groups [32]. In contemporary times, the prevalence of complex networks, spanning online social networks, online transaction networks [33], transportation networks, and biological information networks [34,35], has provided fertile ground for the evolution of community detection research.
Scholars from diverse disciplines have contributed myriad community detection algorithms, each offering unique perspectives. Notably, algorithms for detecting non-overlapping communities span various methodologies, including graph splitting [11,36], spectral analysis [37,38], modularity optimization [15,16,39,40,41], information theory [20,27], and others [42,43,44].
In recent years, traditional neural network approaches have been extended to handle graph data, enabling the swift advancement of graph neural networks for community detection. By directly applying filtering operations to the graph, graph neural networks acquire a concise representation of nodes through semi-supervised training methods [45]. This node representation plays a crucial role in tasks such as node classification and community detection [46]. Representative approaches include recurrent graph neural networks [47], spectral-based convolutional graph neural networks [48], spatial-based convolutional graph neural networks [49], graph autoencoders [50], and spatial-temporal graph neural networks [51].
Among these algorithms, the multilevel modularity optimization algorithm known as Louvain, proposed by Blondel et al. [12], stands out as the most renowned and widely adopted. This algorithm excels in both accuracy and efficiency, contributing significantly to the field. However, despite its widespread application, notable limitations persist, with the resolution limit problem [18] emerging as a prominent concern. Future research may explore novel algorithms that address these limitations and further enhance the efficacy of community detection in complex networks.
2.3. Structure Entropy
In 1953, Shannon [52] proposed addressing communication system issues through quantifying structural information. Over the past seventy years, this problem has remained a significant challenge in information science and computer science. In 2016, Li and Pan [25] introduced the concept of K-dimensional structural entropy as a measure of the structural information of networks, which has since garnered extensive research attention. This concept provides a deeper understanding of the multidimensional aspects of structural information, offering insights into the complexity of network structures. Minimizing K-dimensional structural entropy serves as a principle for detecting natural or ground truth structures in real-world networks [20].
Furthermore, the notion of graph resistance was introduced as a complementary concept to structural entropy, measuring a graph’s resistance against strategic virus attacks that cause cascading failures [53]. Li et al. [54] applied structural entropy to decode topologically associated domains in Hi-C data with ultra-low resolution, demonstrating its applicability in deciphering complex genomic structures. Moreover, Liu et al. [55] proposed community-based structural entropy to express information leakage in community structures and used it to preserve the privacy of community structures, showcasing the versatility of structural entropy in diverse contexts.
In addition, Hirai et al. [56] introduced structural entropy as a measure to assess uncertainty in latent structures within data, aiming to provide insights into the reliability and stability of structural patterns. Wang et al. [57] introduced DS-entropy and applied it to perform label-specificity attacks, emphasizing the role of structural entropy in addressing security and privacy concerns in network data. Tian et al. [58] proposed a novel approach based on structural entropy in social IoT networks, aiming to protect sensitive information while enabling a meaningful analysis of network structure and clustering patterns. Liu et al. [59] presented a graph-generative algorithm based on structural entropy, demonstrating its utility in generating synthetic networks that preserve key structural characteristics.
In summary, the applications of structural entropy are increasingly widespread [60,61], spanning various domains including genomics, network security, privacy preservation, and network synthesis. Inspired by the aforementioned studies, this paper introduces a novel representation of structural information from the perspective of encoding edge information, further contributing to the diverse applications and advancements in structural entropy analysis.
3. Community Structure Information
In this section, we first address the problems with the definition of modularity. Building upon the research of these problems, we introduce the definition of community structure information to overcome the shortcomings of modularity.
3.1. The Problem of Modularity
Modularity stands as the most frequently employed metric for guiding community detection, utilized in methods like simulated annealing [62], extremal optimization [14], and greedy approaches [63]. Grounded in the idea that a random graph should lack a community structure, modularity is calculated as the difference between the actual density of edges in a community and the expected density of the edges that are constructed regardless of community structure [2]. The anticipated edge density is contingent on the chosen null model, which involves creating a copy of the original graph while maintaining the same degree distribution but devoid of any community structure. Elevated discrepancies indicate the potential existence of communities.
Suppose an undirected graph, , consists of a node set, V, and an edge set, E. Let the number of edges between nodes i and j be denoted with , typically 0 or 1, although larger values are possible in networks allowing multiple edges. The quantities are the elements of the adjacency matrix. Simultaneously, the expected number of edges between nodes i and j, if edges are randomly placed, is , where and are the degrees of the nodes, and is the total number of edges in the network. Thus, the modularity Q is the sum of over all pairs of nodes i, j that fall in the same community. If represents the community partition of G, then the modularity associated with C is determined as follows [64]:
where if for some and if not. This equation can be simplified to the following:
where S is the number of communities, is the number of edges inside community , L is the total number of edges in the network, and is the total degree of the nodes in community .
This definition introduces a novel perspective on measuring community detection, specifically the distinction between a real graph and a null model with the same degree distribution. However, certain issues in this definition warrant further consideration:
- The contribution term for community in modularity is a linear function of plus a quadratic function of . This implies that the contribution of adding a new edge within community to the value linearly diminishes with the scale of . However, intuitively, this decay should be superlinear. For example, in two communities with the same number of nodes, where one is densely connected internally and the other is sparsely connected, the contribution of a new edge to the sparse community should be significantly greater than to the dense community.
- On the other hand, considering the addition of a new edge between and other communities, although the term implies a penalty for the new edge, this penalty linearly increases with the scale of the community. This is counterintuitive because the penalty for small communities should be high, while for large communities, it should be low. This makes it easier for the optimization of to lead to the merging of small communities into larger ones.
These issues call for a new metric to measure community structure information. Next, we introduce the logarithmic function from information theory to address the aforementioned problems.
3.2. Community Structure Information
Complex networks represent the sum of all relationships among entities in a complex system. For a network graph, , the relationships are the edges, E, and the individuals are the nodes, V, in . Then, the total information of the graph, G, can be defined as the sum of information for all its edges. However, how much information does each edge carry? As illustrated in Figure 1, if we already know the degree of each node, for any edge , since nodes u and v are independent, the probability of occurring is , where and represent the degrees of nodes u and v, respectively. Consequently, the information content of edge is determined using . Thus, the average information carried by one edge in G is expressed as follows:
Figure 1.
Example of encoding graph G when the community structure is unknown.
According to the definition, represents the average number of bits required to encode the edges or relationships in the graph, G. It is worth noting that in the construction of the edge , the selection of nodes u and v is relatively independent. Therefore, the average number of bits required to encode one edge is equivalent to twice the number of bits required to encode one node:
In the above definition, represents the average information required to encode edges when the community structure is not considered. Let be a partition of the node set V, satisfying that for any , and , thus C divides G into S communities . With the information on the community structure, we know whether any two nodes are in the same community. In this case, the process of selecting two nodes to form an edge is divided into two steps. The first step is to identify the community to which the nodes belong, and the second step is to choose the corresponding nodes from the identified community. Let be the total degree of all nodes in community . For any edge , the execution of these two steps involves two scenarios:
- (i)
- u and v belong to the same community . In this case, we first identify community with a probability of , and then we select u with a probability of and v with a probability of ;
- (ii)
- u and v belong to different communities, and , respectively. In this case, we first identify and with probabilities and , respectively. Then, we independently select u from with a probability of and v from with a probability of .
Therefore, for cases (i) and (ii), the information content of edge is determined via and , respectively. In the case of (ii), this expression can be simplified to . Thus, if the community structure, C, of graph G is known, the average information content per edge can be expressed as follows:
where
and and correspond to cases (i) and (ii), respectively.
The simplification of Equation (5) yields the following:
where , and represents the number of edges within community . Figure 2 illustrates an example of encoding graph G with a known community structure. The value of reflects the average information required to encode an edge when the community structure C is known. In other words, the community structure, C, provides a certain amount of information, eliminating the uncertainty in encoding an edge. This reduction in uncertainty is represented by the absolute value of the second term in Equation (6).
Figure 2.
Example of an encoding graph G when the community structure is known.
We define the information provided via the community, C, as a measure of community structure information:
Definition 1.
Let be the community structure (partition) of the graph, . The community structure information of G relative to the community C is defined as follows:
where S is the number of communities, is the number of edges within community , and is the total degree of nodes in community .
According to the definition, reflects the information saved on average when encoding the edge information of graph G with knowledge of the community structure, C. The more pronounced the community structure, the greater the amount of saved information, and the closer the community structure, C, is to the ground truth community structure. Therefore, optimizing algorithms can be employed to find the maximum value of for community detection.
4. Community Detection Algorithm, CSIM
In this section, we introduce a community detection algorithm based on the maximization of community structure information. Since community detection algorithms based on modularity have been extensively studied, and many excellent algorithms have been proposed [2,12,63], we drew inspiration from the ideas of these previous algorithms in designing our algorithm.
4.1. Preliminaries
Assuming the graph is the network under investigation, represents any community partition of the node set V. Here, and denote the internal edge count and total node degree of community , respectively, and is the total number of edges in graph G. The community structure, D, represents the configuration obtained by merging two communities, and , from the partition, C, into a single community. Without a loss of generality, let . Then, D can be expressed as follows:
Then,
where , , and are the numbers of edges within communities and , respectively, and is the number of edges between communities and .
Let , and a derivation from Equation (8) leads to the following:
As we aim to maximize , we merge communities and if ; otherwise, we refrain from merging. It is noteworthy that, when , the following holds:
Therefore, in the algorithm aimed at maximizing , communities and are not merged when there are no inter-community edges between them.
4.2. CSIM
Inspired by the Louvain algorithm [12], we designed a fast hierarchical aggregation algorithm, CSIM. Assuming a graph to be undetected as and any node , the structure represents the community partition when node is removed from V. So, which community is more suitable for placing ? An intuitive idea is to place in the community that maximizes the gain in after placing in each . This becomes a special type of community merging—merging a node as a standalone community with another community.
Let , , and . Then, according to Equation (9), we have the following:
where is the number of edges between node and community , and is the degree of node . Similarly, it can be observed that, if , then . In such a case, node is not placed in community .
Based on the above analysis, we designed a hierarchical clustering algorithm called CSIM, as shown in Algorithm 1. It mainly consists of two steps: node movement and node aggregation. Specifically, at the node movement step, each node is temporarily removed from its community and then assimilated into the neighboring community that maximizes the gain in . This process is repeated for all nodes, corresponding to lines 4 to 16 in the algorithm. Subsequently, the algorithm performs node aggregation, transforming the communities obtained from node movement into super-nodes. The total degree (weight) within each community becomes the self-loop weight of the super-node, and the number of edges (edge weight) between communities becomes the edge weight between super-nodes. This results in the construction of a new graph, corresponding to lines 17 to 19 in the algorithm. These two steps are iteratively executed until no longer increases.
| Algorithm 1 Community Structure Information Maximization Algorithm: CSIM |
| Input: , ; |
| Output: Community structure C and ; |
| 1: do |
| 2: Set each node as a community, namely ; |
| 3: ; |
| 4: for do |
| 5: ; |
| 6: ; |
| 7: for do |
| 8: if then |
| 9: Calculate the value of ; |
| 10: if then |
| 11: , ; |
| 12: end if |
| 13: end if |
| 14: put node into of C; |
| 15: end for |
| 16: end for |
| 17: if then |
| 18: Aggregate communities into super-nodes, and keep track of the members of each super-node; |
| 19: end if |
| 20: while |
| 21: Extract the super nodes in ; |
| 22: Return: C and |
Now, let us analyze the time complexity of this algorithm. In the first iteration, CSIM executes approximately L times to calculate . In the subsequent iterations, the nodes aggregated into super-nodes reduce the number to approximately . Thus, in the second iteration, CSIM executes a maximum of operations in the worst case, and in the third iteration, the number of super-nodes is roughly , and so on. Similar to the Louvain algorithm [12], CSIM has an average time complexity of , which outperforms the greedy hierarchical aggregation algorithm proposed in [20], where the average time complexity is . In the experimental section, we further compare the performance of these two algorithms in optimizing .
5. Experiment
For this section, we conducted an experimental analysis of our algorithm with three main objectives: (1) that, compared to modularity-based optimization algorithms, our proposed algorithm can discover finer community partitions that are closer to the ground truth community structure; (2) that, in comparison to the greedy algorithm proposed in [20], our designed algorithm not only has lower complexity but also demonstrates advantages in optimizing the maximum value of community structure information; and (3) that our algorithm does not suffer from resolution limit issues on special cyclic graphs compared to modularity-based algorithms.
5.1. Experimental Settings
Datasets with ground truth community structure. The experiments with community-structured data utilized graph data discussed by Fortunato and Barthelemy [18]. Table 1 provides an overview of this data, where and correspond to the number of nodes and edges in the network graph. There are a total of five datasets, datasets Yeast, E. coli, Elect. circuit and Social from link www.weizman.ac.il/mcb/UriAlon (accessed on 20 November 2021), dataset C. elegans from link http://cdg.columbia.edu (accessed on 5 November 2021). The types listed in Table 1 cover various real-world domains, including human society, animals, microorganisms, and electronic circuits. The Yeast and E. coli represent transcriptional regulatory networks of microorganisms, where nodes represent operons, i.e., sets of genes transcribed onto the same mRNA. If operon A activates operon B, an edge is placed between nodes A and B. In this data, yeast has 688 nodes and 1079 edges, while E. coli has 423 nodes and 519 edges. The Elect. circuit represents an electronic circuit network, where nodes are electronic components (capacitors, diodes, etc.), and edges represent wires. The Social represents a social network, where 67 nodes represent a surveyed group of people, and 182 edges denote positive emotions transferred from one person to another (based on questionnaires). The C. elegans represents the neural network of the C. elegans roundworm, where nodes are neurons, and edges represent synaptic or gap connections. The networks can be both undirected and directed, and we uniformly treated them as undirected.

Table 1.
Overview of graph data with ground truth community structure.
Datasets without a ground truth community structure. In comparing our algorithm with the experiments of the paper [20] in seeking the maximum value of community structure information, we introduced some classic datasets, as shown in Table 2, in addition to the data in Table 1. There are a total of seven datasets, datasets Karate, Dolphin, and Facebook from link http://konect.cc/networks/ (accessed on 26 November 2021), datasets Jazz, Email, and PGP from link https://deim.urv.cat/~alexandre.arenas/data/welcome.htm (accessed on 26 November 2021), dataset Jazz from link https://networkrepository.com/power-US-Grid.php (accessed on 26 November 2021). The Karate data are from the well-known Zachary Karate Club network. The data were collected by Wayne Zachary from a university’s karate club. In this network, each node represents a club member, and each edge represents a relationship between two club members. The Dolphin data represents a social network of bottlenose dolphins living near the New Zealand fjord. Edges in the network represent frequent interactions. The Jazz data represent a collaboration network among jazz musicians. The nodes represent jazz musicians, and the edges represent musicians who play together in a band. The Email data represent a communication network among members of the University of Rovira i Virgili, where edges indicate communication between members. The Facebook data represent a friend network among some users on Facebook. Each node represents a user, and the edges represent friendships between users. The Power grid data represents the high-voltage power grid in the western United States. The nodes represent transformers, substations, and generators, while the edges represent high-voltage transmission lines. The PGP data represent a user network for the Pretty-Good-Privacy algorithm used in secure information exchange, where the edges represent instances of secure information exchanges between users. All of these networks are considered undirected.
Table 2.
Overview of graph data without ground truth community structure.
Benchmark. In this experiment, four community detection algorithms were considered. Two were based on maximizing modularity, and two were based on maximizing community structure information. The four algorithms are described as follows: (1) [12] is a heuristic algorithm based on modularity maximization, with average time complexity of ; (2) [63] is a greedy hierarchical clustering algorithm that optimizes modularity through hierarchical merging, with an average time complexity of ; (3) CISM is a heuristic algorithm designed by us based on maximizing community structure information, with an average time complexity of ; and (4) [20] is a hierarchical clustering method based on , achieving the maximization of community structure information through hierarchical community merging, with a time complexity of . In the experiment, the values and modularity Q values of the four algorithms were obtained from the corresponding community detection algorithms. Additionally, the datasets in Table 1 do not have completely ground truth community structures, and the ground truth structure was obtained using the method proposed by Fortunato [18], which involves two rounds of modularity optimization. The network graph was initially partitioned, and then the communities with significant substructures underwent a second round of partitioning until each community had no obvious substructure.
Evaluation index: NMI. Mutual information is one of the most commonly used metrics in information theory. It measures the shared information between two random variables and is typically employed to express the similarity between two variables [65]. If we consider community partitions as variables, mutual information can be used to assess the similarity between the detected community partition and the ground truth community partition. Let be the ground truth community partition of the graph , and let be the artificial partition discovered using the community detection algorithm. Denote that
where represents the number of nodes in community , represents the number of nodes in the intersection of communities and , and represents the total number of nodes. Then, mutual Information is defined as . Normalizing the mutual information yields normalized mutual information (NMI) [66]:
The range of NMI is , making it suitable for assessing the similarity between two community partitions. A higher NMI indicates a closer proximity between the detected and ground truth community structures, reflecting better detection performance. When NMI equals 1, the detected and ground truth communities are in perfect agreement.
5.2. Experimental Analysis
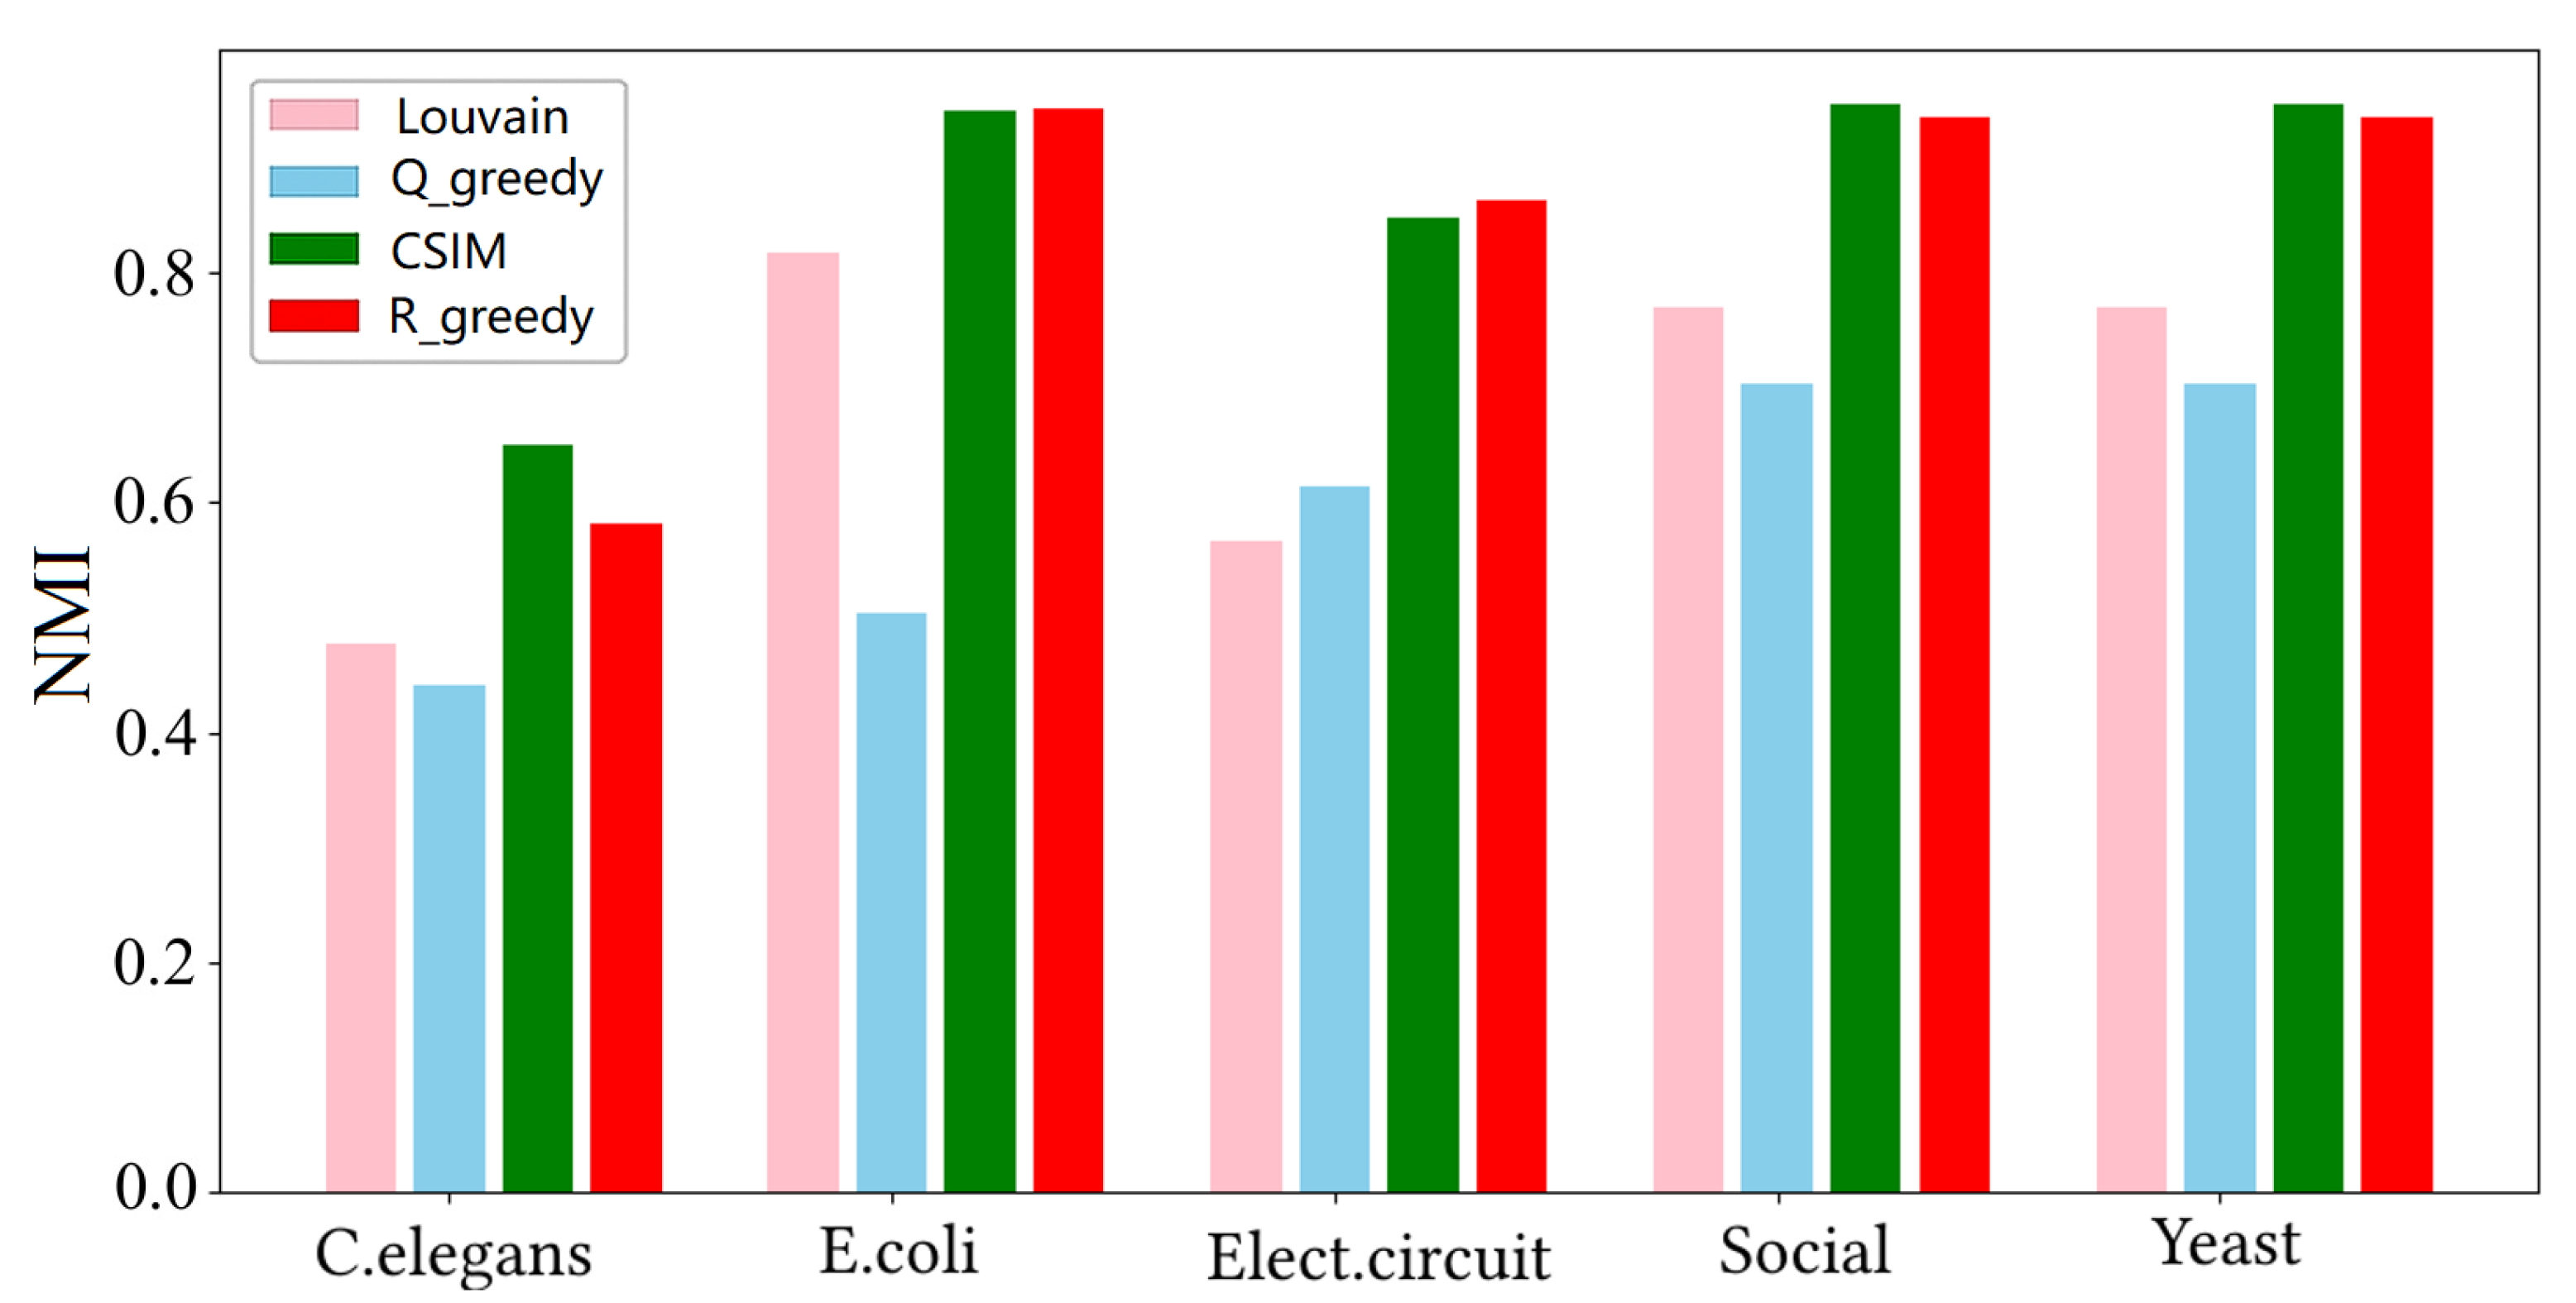
Comparison with optimized modularity. This experiment will use the datasets in Table 1 to validate that, compared to optimizing modularity, detecting communities by optimizing community structure information yields community partitions closer to the ground truth community structure. We used the normalized mutual information (NMI) mentioned in the experimental settings to measure the similarity between the detected community partition and the ground truth community partition. The NMI values ranged from 0 to 1, with values closer to 1 indicating a higher similarity to the ground truth partition and, thus, a better detection result. To achieve this, we first obtained community partitions of the graph data using the four detection algorithms and then calculated their NMI values with the ground truth partition. Figure 3 shows the histogram of NMI values between the partitions obtained via different algorithms and the ground truth partition on different datasets. From the figure, it is evident that the NMI values of the results from optimizing community structure information (algorithms CSIM and ) were significantly higher than those from optimizing modularity ( and ). In particular, the performance of algorithms CSIM and was even close to 1 on the E. coli, Social, and Yeast datasets, indicating that the partitions detected via these two algorithms were nearly identical to the ground truth partition. This implies that maximizing not only approximates the number of ground truth communities but also ensures high consistency among the members within the communities. Additionally, concerning the optimization of community structure information, the results obtained via the CSIM algorithm were slightly better than those obtained via .
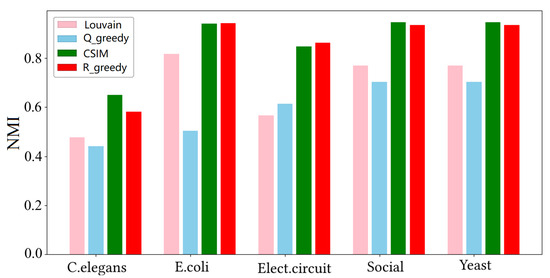
Figure 3.
The NMI values between the partitions detected via the four algorithms and the ground truth partitions.
Comparison of optimized community structure information. This experiment verified the advantage of our proposed algorithm in optimizing community structure information. Table 1 and Table 2 together consist of 12 graph datasets, involving network data from various real-world domains, including offline social domains, online social domains, animal domains, infrastructure, microbial domains, electronic circuits, etc. We conducted community detection using CSIM and on these 12 datasets, outputting the maximum value of the optimized for each algorithm. The results are presented in Table 3. We have highlighted in black and bold text the maximum value for each dataset. It can be observed that, except for the E. coli dataset, for all the other datasets, the CSIM algorithm obtained larger values compared to . On the other hand, although achieved a slightly larger value than CSIM on the E. coli dataset, their values were very close. This suggests that the CSIM algorithm is more effective than in optimizing . Combining our discussion on time complexity in Section 4, it can be concluded that the CSIM algorithm excels in both efficiency and effectiveness compared to .
Table 3.
A comparison between the CSIM algorithm and R_greedy in optimizing the value of community structure information.
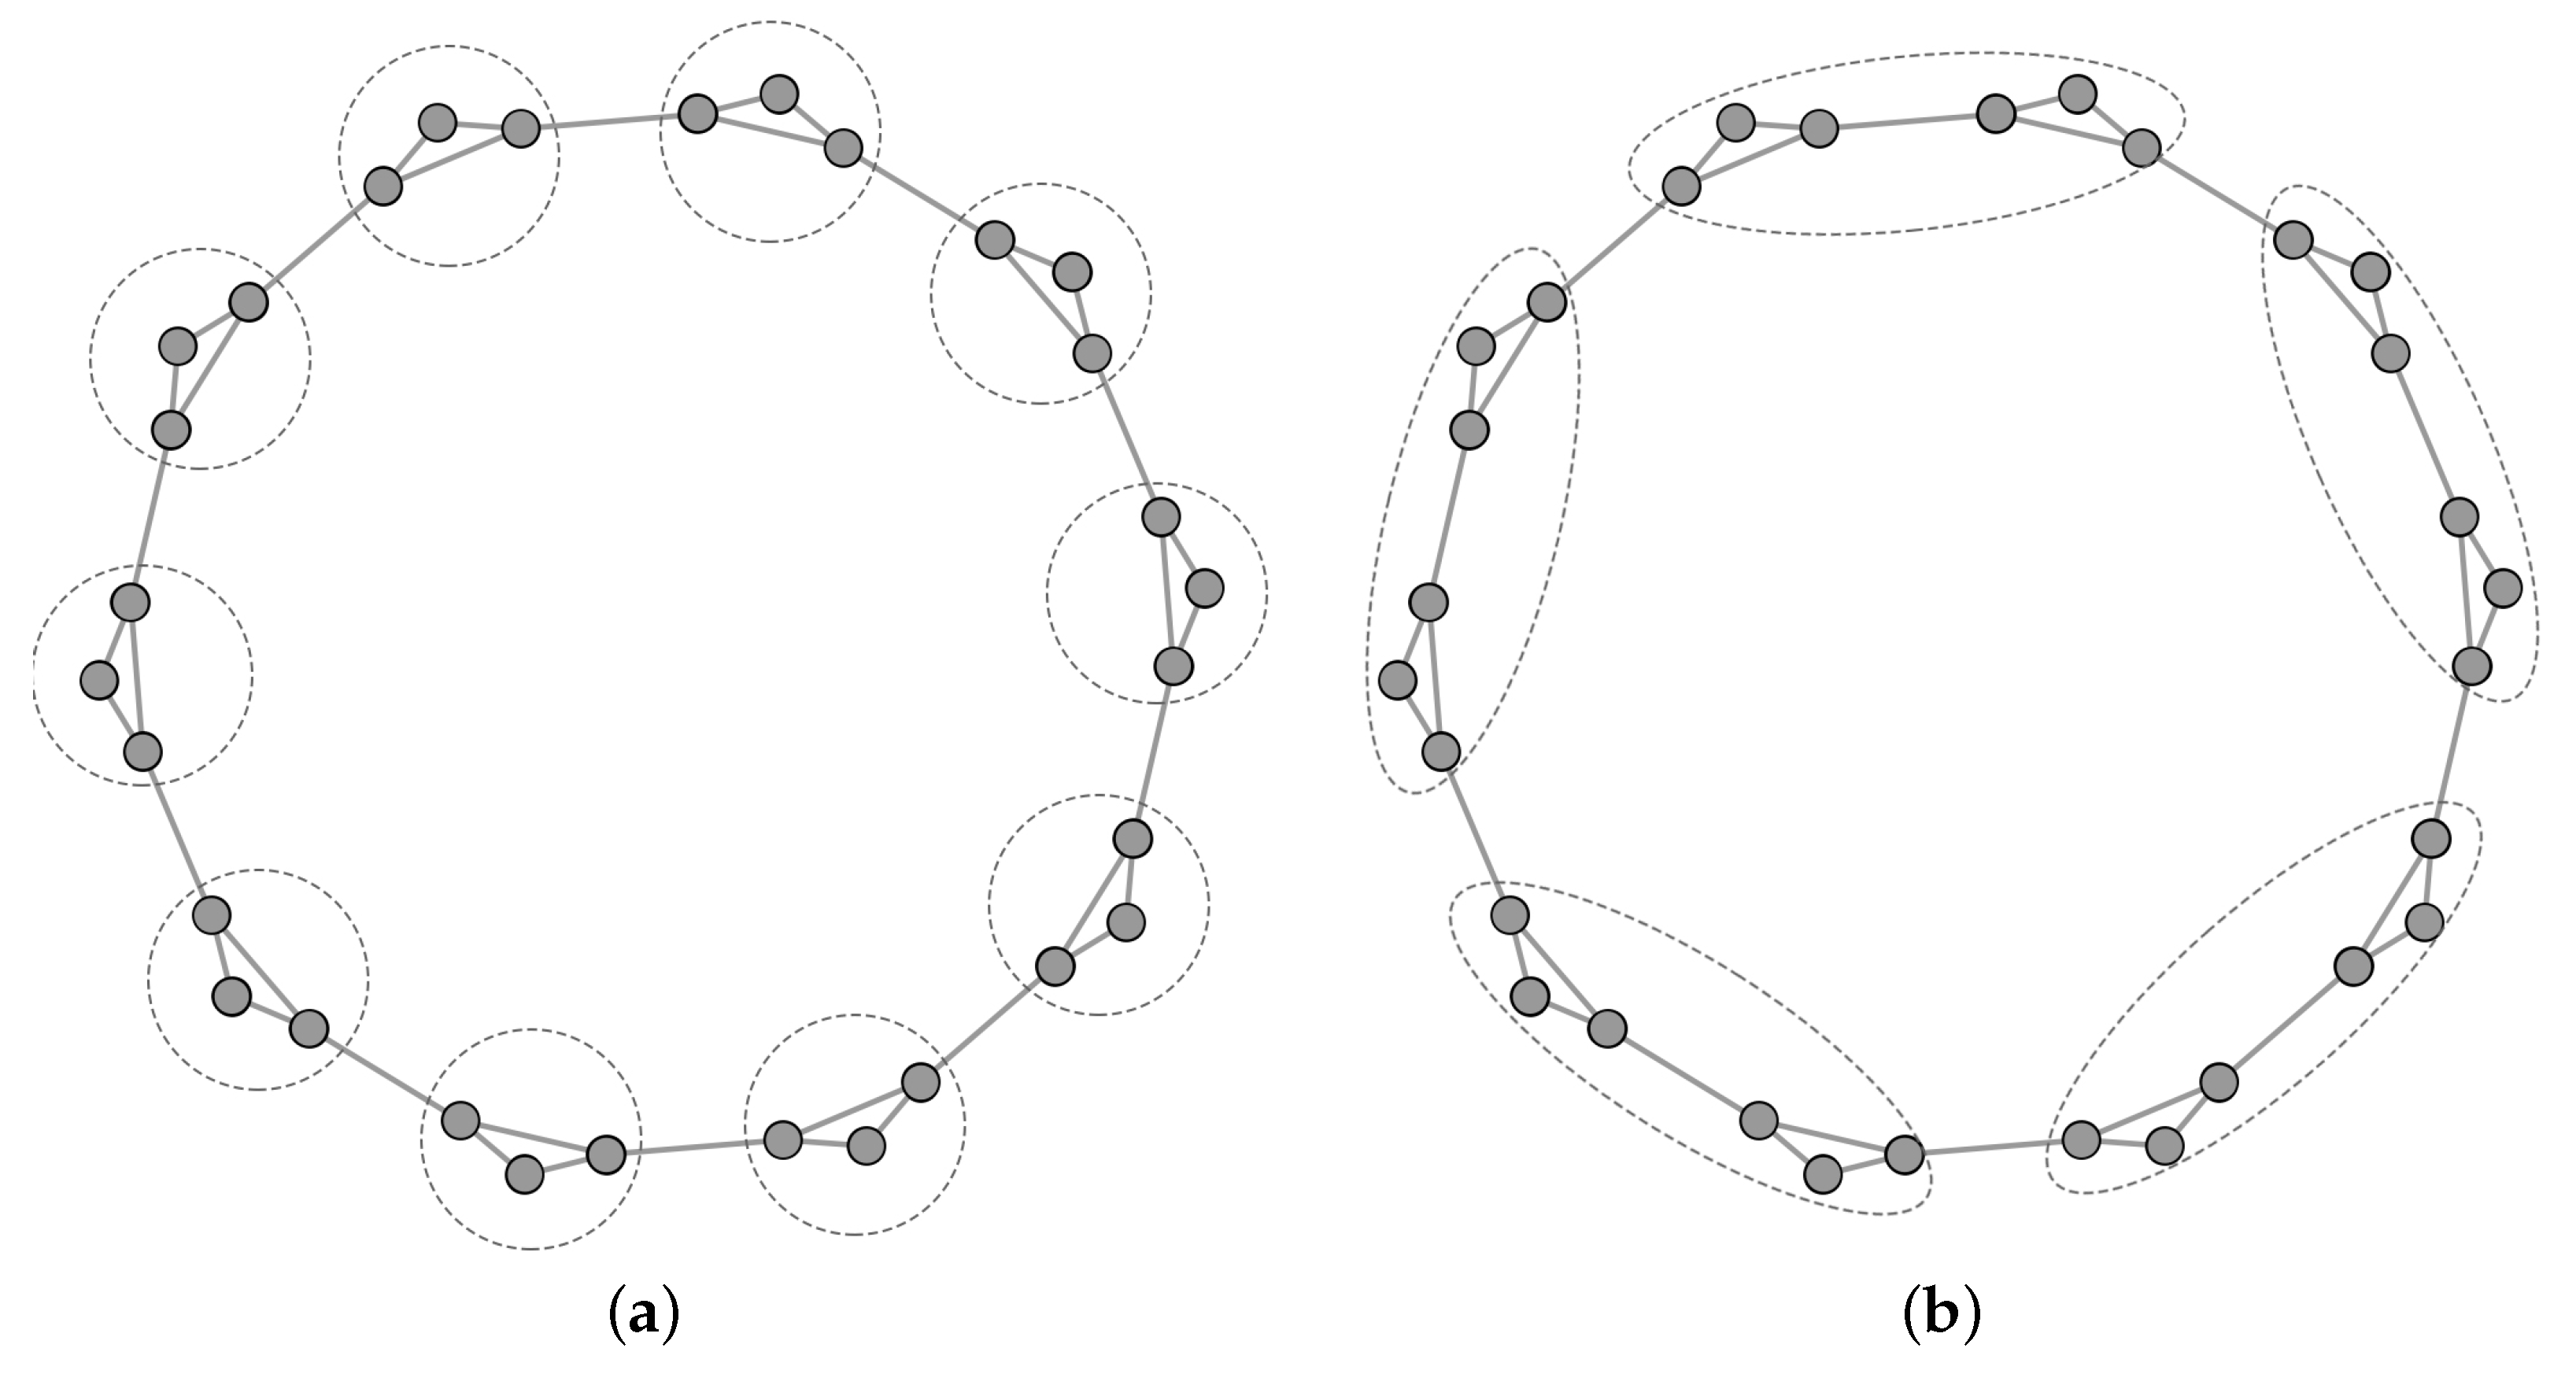
Comparison of resolution limits. This experiment verified the advantage of community structure information over modularity in addressing the resolution limit problem. Fortunato et al. [18] provided an example illustrating the resolution limit problem when optimizing modularity on a cyclic network composed of completely identical subgraphs connected with single edges. In contrast, optimizing community structure information does not suffer from this issue. We consider subgraphs of the cyclic network complete graphs with three nodes, as shown in Figure 4. The portions enclosed in dashed circles represent the community structures detected by optimizing the two metrics. When assuming that the community structure in Figure 4a is A, and that the community structure in Figure 4b is B, it is evident that A is the ground truth community structure. According to the definition of modularity, the modularity value in the ground truth community structure, , is less than the value obtained by maximizing modularity, . On the other hand, the community structure information value in the ground truth community structure, , is significantly greater than its value, , under community structure B. This implies that community structure information has an advantage in addressing the resolution limit problem.
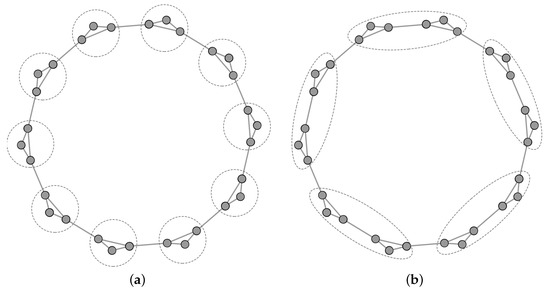
Figure 4.
Comparison of modularity and community structure information in detecting community structure. (a) Community structure detected by optimizing community structure information. (b) Community structure detected by optimizing modularity.
6. Discussion
Here, we discuss the contributions of our study to theory and practice, as well as the implications of the study.
6.1. Analysis of Contribution
In the preceding three sections, we presented the definition of community structure information, devised the CSIM algorithm based on this information, and validated the superior performance of the CSIM algorithm. Next, we explore the key factors contributing to the outstanding performance of the CSIM algorithm, focusing on theoretical foundations, algorithm design, and algorithm execution.
Theoretical foundations. In contrast to modularity, which focuses on the probability of two nodes being connected by an edge [64], our definition of community structure information was inspired by Shannon’s conception of information entropy, and it directly focuses on the amount of information conveyed via the connection of two nodes [52]. It reflects the community structure by compressing the amount of edge information conveyed via the community structure, which better captures the essence of the community structure. Furthermore, compared to structural entropy [25], defining community structure information from the perspective of edge information compression is more intuitive and straightforward than using random walks.
Algorithm design. In the design of the CSIM algorithm, we drew inspiration from the widely used Louvain algorithm and adopted a heuristic clustering method based on node aggregation and graph reconstruction [12]. This approach significantly reduces the algorithmic complexity of optimizing community structure information [20], bringing it down to , thus enabling the algorithm to be applied to large-scale social networks. Moreover, similar to the Louvain algorithm, the CSIM algorithm also outperforms greedy hierarchical clustering algorithms in optimizing community structure information, striking a balance between efficiency and effectiveness.
Algorithm execution. At the algorithm execution level, due to the concept of community structure information being theoretically more reflective of the essence of community structure, the CSIM algorithm, which optimizes community structure information, can achieve a balance between community size and quantity [20]. Unlike algorithms optimizing modularity [18], it does not overlook or merge small-scale communities. Consequently, the communities detected via the CSIM algorithm are closer to the ground truth communities, and to some extent, the CSIM algorithm addresses the resolution limit problem.
6.2. Implications
Although community detection has been studied for many years, this research has provided important theoretical guidance and practical applications for this field. Firstly, defining community structure information from the perspective of encoding edge information is likely to change the traditional definition, which relies on edge density. This is conducive to a deeper exploration of the essence of community structure, including its application in areas such as graph compression, machine learning, and graph neural networks. Secondly, the CSIM algorithm, based on the theory of community structure information, offers advantages in both algorithm complexity and balancing community size and quantity. It can replace traditional algorithms like Louvain, especially for graphs with imbalanced community structures or a large number of small communities. Lastly, the related theory and algorithms can be further expanded for applications such as overlapping community detection and multi-graph analysis, promoting advancements in the field. Overall, this research provides a more intuitive, efficient, and effective method for identifying community structures in complex networks, contributing to the advancement of community detection.
7. Conclusions
This paper has investigated the direction of community structure detection in complex networks. Despite the widespread research and application of community structure detection algorithms in fields such as social media, computer science, and biology, challenges persist, including the lack of an essential definition of community structure, high algorithmic complexity, and the unreasonable structural characteristics of detected communities. In addressing these issues, we introduced, for the first time, the definition of community structure information from the perspective of encoding edge information. This information reflects the essence of community structure by compressing the amount of edge information conveyed via the community structure, thereby better expressing the intrinsic characteristics of the community structure. By maximizing community structure information, we further proposed the CSIM community detection algorithm, which achieves a balance between community size and quantity to identify the most natural community structure. Additionally, inspired by the heuristic clustering Louvain algorithm, we reduced the complexity of CSIM to , enabling its application to large-scale complex networks. Our experimental results show that communities detected by optimizing community structure information are closer to ground truth communities, and they effectively address the resolution limit problem, especially in cyclic graphs.
Future research can delve deeper into the rationale behind the definition of community structure information and provide theoretical validation for the benefits of optimizing it. This will involve investigating its role in striking a balance within a community structure and overcoming the resolution limit problem. Additionally, the application of community structure information will be extended to domains like machine learning and graph neural networks, with the aim of enhancing existing algorithms for tasks such as node or graph classification. Furthermore, diverse forms of community structure information will be explored, including its utilization in identifying communities within multigraphs or those with overlapping structures. Tailoring the granularity of community detection to specific requirements will be a key focus, thereby broadening the scope of its applicability.
Author Contributions
Conceptualization, Y.L. and Y.W.; methodology, Y.L. and W.L.; software, H.Y. and X.T.; validation, W.L., P.Y. and X.X.; writing—original draft preparation, Y.L. and W.L.; writing—review and editing, Y.L., Y.W. and H.Y. All authors have read and agreed to the published version of the manuscript.
Funding
This research was supported in part by the Defense Industrial Technology Development Program (No. JCKY2021602B002 and JCKY2021906A001) and the National Natural Science Foundation of China (No. 62302539).
Data Availability Statement
The data used in this paper are publicly available, and the corresponding links to the datasets can be found in the footnotes of the paper.
Conflicts of Interest
The authors declare no conflicts of interest. The funders had no role in the design of the study or the decision to publish the results.
References
- Zhang, T.; Xu, C.; Lian, Y.; Tian, H.; Kang, J.; Kuang, X.; Niyato, D. When Moving Target Defense Meets Attack Prediction in Digital Twins: A Convolutional and Hierarchical Reinforcement Learning Approach. IEEE J. Sel. Areas Commun. 2023, 41, 3293–3305. [Google Scholar] [CrossRef]
- Fortunato, S. Community detection in graphs. Phys. Rep. 2010, 486, 75–174. [Google Scholar] [CrossRef]
- Zhang, T.; Xu, C.; Shen, J.; Kuang, X.; Grieco, L.A. How to Disturb Network Reconnaissance: A Moving Target Defense Approach Based on Deep Reinforcement Learning. IEEE Trans. Inf. Forensics Secur. 2023, 18, 5735–5748. [Google Scholar] [CrossRef]
- Traud, A.L.; Mucha, P.J.; Porter, M.A. Social Structure of Facebook Networks. Phys. A Stat. Mech. Its Appl. 2012, 391, 4165–4180. [Google Scholar] [CrossRef]
- Ravasz, E.; Somera, A.L.; Mongru, D.A.; Oltvai, Z.N.; Barabasi, A. Hierarchical Organization of Modularity in Metabolic Networks. Science 2002, 297, 1551–1555. [Google Scholar] [CrossRef]
- Zhang, T.; Xu, C.; Zou, P.; Tian, H.; Kuang, X.; Yang, S.; Zhong, L.; Niyato, D. How to Mitigate DDoS Intelligently in SD-IoV: A Moving Target Defense Approach. IEEE Trans. Ind. Inform. 2023, 19, 1097–1106. [Google Scholar] [CrossRef]
- Newman, M.E.J.; Girvan, M. Finding and evaluating community structure in networks. Phys. Rev. E 2004, 69, 026113. [Google Scholar] [CrossRef] [PubMed]
- Li, Z.; Zhang, S.; Wang, R.S.; Zhang, X.S.; Chen, L. Quantitative function for community detection. Phys. Rev. E 2008, 77, 036109. [Google Scholar] [CrossRef] [PubMed]
- Aldecoa, R.; Marín, I. Deciphering network community structure by surprise. PLoS ONE 2011, 6, e24195. [Google Scholar] [CrossRef] [PubMed]
- Chakraborty, T.; Srinivasan, S.; Ganguly, N.; Mukherjee, A.; Bhowmick, S. On the permanence of vertices in network communities. In Proceedings of the 20th ACM SIGKDD International Conference on Knowledge Discovery and Data Mining, New York, NY, USA, 24–27 August 2014; pp. 1396–1405. [Google Scholar]
- Girvan, M.; Newman, M.E. Community structure in social and biological networks. Proc. Natl. Acad. Sci. USA 2002, 99, 7821–7826. [Google Scholar] [CrossRef] [PubMed]
- Blondel, V.D.; Guillaume, J.; Lambiotte, R.; Lefebvre, E. Fast unfolding of communities in large networks. J. Stat. Mech. Theory Exp. 2008, 2008, 10008. [Google Scholar] [CrossRef]
- Guimera, R.; Amaral, L.A.N. Functional cartography of complex metabolic networks. Nature 2005, 433, 895–900. [Google Scholar] [CrossRef]
- Duch, J.; Arenas, A. Community detection in complex networks using extremal optimization. Phys. Rev. E 2005, 72, 027104. [Google Scholar] [CrossRef]
- Newman, M.E. Finding community structure in networks using the eigenvectors of matrices. Phys. Rev. E 2006, 74, 036104. [Google Scholar] [CrossRef] [PubMed]
- Agarwal, G.; Kempe, D. Modularity-maximizing graph communities via mathematical programming. Eur. Phys. J. B 2008, 66, 409–418. [Google Scholar] [CrossRef]
- Lancichinetti, A.; Fortunato, S. Community detection algorithms: A comparative analysis. Phys. Rev. E 2009, 80, 056117. [Google Scholar] [CrossRef] [PubMed]
- Fortunato, S.; Barthelemy, M. Resolution limit in community detection. Proc. Natl. Acad. Sci. USA 2007, 104, 36–41. [Google Scholar] [CrossRef] [PubMed]
- Yang, L.; Cao, X.; He, D.; Wang, C.; Wang, X.; Zhang, W. Modularity Based Community Detection with Deep Learning. In Proceedings of the Twenty-Fifth International Joint Conference on Artificial Intelligence (IJCAI-16), New York, NY, USA, 9–15 July 2016; Volume 16, pp. 2252–2258. [Google Scholar]
- Li, A.; Li, J.; Pan, Y. Discovering natural communities in networks. Phys. A Stat. Mech. Its Appl. 2015, 436, 878–896. [Google Scholar] [CrossRef]
- Rashevsky, N. Life, Information Theory, and Topology. Bull. Math. Biophys. 1955, 17, 229–235. [Google Scholar] [CrossRef]
- Braunstein, S.L.; Ghosh, S.; Severini, S. The laplacian of a graph as a density matrix: A basic combinatorial approach to separability of mixed states. Ann. Comb. 2006, 10, 291–317. [Google Scholar] [CrossRef]
- Dehmer, M. Information processing in complex networks: Graph entropy and information functionals. Appl. Math. Comput. 2008, 201, 82–94. [Google Scholar] [CrossRef]
- Anand, K.; Bianconi, G. Entropy measures for networks: Toward an information theory of complex topologies. Phys. Rev. E Stat. Nonlinear Soft Matter Phys. 2009, 80, 045102. [Google Scholar] [CrossRef] [PubMed]
- Li, A.; Pan, Y. Structural Information and Dynamical Complexity of Networks. IEEE Trans. Inf. Theory 2016, 62, 3290–3339. [Google Scholar] [CrossRef]
- Newman, M.E. Detecting community structure in networks. Eur. Phys. J. B 2004, 38, 321–330. [Google Scholar] [CrossRef]
- Rosvall, M.; Bergstrom, C.T. Maps of random walks on complex networks reveal community structure. Proc. Natl. Acad. Sci. USA 2008, 105, 1118–1123. [Google Scholar] [CrossRef] [PubMed]
- Zhang, Q.; Li, M.; Deng, Y. A new structure entropy of complex networks based on nonextensive statistical mechanics. Int. J. Mod. Phys. C 2016, 27, 1650118. [Google Scholar] [CrossRef]
- Liu, Y.; Liu, J.; Wan, K.; Qin, Z.; Zhang, Z.; Khoussainov, B.; Zhu, L. From local to global norm emergence: Dissolving self-reinforcing substructures with incremental social instruments. In Proceedings of the International Conference on Machine Learning, PMLR, Virtual, 18–24 July 2021; pp. 6871–6881. [Google Scholar]
- Zhang, Q.; Li, M. A betweenness structural entropy of complex networks. Chaos Solitons Fractals 2022, 161, 112264. [Google Scholar] [CrossRef]
- Cai, M.; Liu, J.; Cui, Y. A Network Structure Entropy Considering Series-Parallel Structures. Entropy 2022, 24, 852. [Google Scholar] [CrossRef] [PubMed]
- Weiss, R.S.; Jacobson, E. A method for the analysis of the structure of complex organizations. Am. Sociol. Rev. 1955, 20, 661–668. [Google Scholar] [CrossRef]
- McCorry, P.; Möser, M.; Shahandasti, S.F.; Hao, F. Towards bitcoin payment networks. In Proceedings of the Australasian Conference on Information Security and Privacy, Melbourne, Australia, 4–6 July 2016; Springer: Cham, Switzerland, 2016; pp. 57–76. [Google Scholar]
- Vidal, M.; Cusick, M.E.; Barabási, A.L. Interactome networks and human disease. Cell 2011, 144, 986–998. [Google Scholar] [CrossRef]
- Barabási, A.L.; Gulbahce, N.; Loscalzo, J. Network medicine: A network-based approach to human disease. Nat. Rev. Genet. 2011, 12, 56–68. [Google Scholar] [CrossRef]
- Gregory, S. Local Betweenness for Finding Communities in Networks; University of Bristol: Bristol, UK, 2008. [Google Scholar]
- Shi, J.; Malik, J. Normalized cuts and image segmentation. IEEE Trans. Pattern Anal. Mach. Intell. 2000, 22, 888–905. [Google Scholar]
- Von Luxburg, U. A tutorial on spectral clustering. Stat. Comput. 2007, 17, 395–416. [Google Scholar] [CrossRef]
- Brandes, U.; Delling, D.; Gaertler, M.; Gorke, R.; Hoefer, M.; Nikoloski, Z.; Wagner, D. On modularity clustering. IEEE Trans. Knowl. Data Eng. 2007, 20, 172–188. [Google Scholar] [CrossRef]
- Chen, M.; Kuzmin, K.; Szymanski, B.K. Community detection via maximization of modularity and its variants. IEEE Trans. Comput. Soc. Syst. 2014, 1, 46–65. [Google Scholar] [CrossRef]
- Zhuang, D.; Chang, J.M.; Li, M. DynaMo: Dynamic community detection by incrementally maximizing modularity. IEEE Trans. Knowl. Data Eng. 2019, 33, 1934–1945. [Google Scholar] [CrossRef]
- Fortunato, S.; Hric, D. Community detection in networks: A user guide. Phys. Rep. 2016, 659, 1–44. [Google Scholar] [CrossRef]
- Jin, D.; Yu, Z.; Jiao, P.; Pan, S.; He, D.; Wu, J.; Philip, S.Y.; Zhang, W. A survey of community detection approaches: From statistical modeling to deep learning. IEEE Trans. Knowl. Data Eng. 2021, 35, 1149–1170. [Google Scholar] [CrossRef]
- Ruggeri, N.; Contisciani, M.; Battiston, F.; De Bacco, C. Community detection in large hypergraphs. Sci. Adv. 2023, 9, eadg9159. [Google Scholar] [CrossRef]
- Bronstein, M.M.; Bruna, J.; LeCun, Y.; Szlam, A.; Vandergheynst, P. Geometric deep learning: Going beyond euclidean data. IEEE Signal Process. Mag. 2017, 34, 18–42. [Google Scholar] [CrossRef]
- Qu, L.; Zhu, H.; Duan, Q.; Shi, Y. Continuous-time link prediction via temporal dependent graph neural network. In Proceedings of the Web Conference 2020, Taipei, Taiwan, 20–24 April 2020; pp. 3026–3032. [Google Scholar]
- Dai, H.; Kozareva, Z.; Dai, B.; Smola, A.; Song, L. Learning steady-states of iterative algorithms over graphs. In Proceedings of the International Conference on Machine Learning, PMLR, Stockholm, Sweden, 10–15 July 2018; pp. 1106–1114. [Google Scholar]
- Kipf, T.N.; Welling, M. Semi-supervised classification with graph convolutional networks. arXiv 2016, arXiv:1609.02907. [Google Scholar]
- Veličković, P.; Cucurull, G.; Casanova, A.; Romero, A.; Lio, P.; Bengio, Y. Graph attention networks. arXiv 2017, arXiv:1710.10903. [Google Scholar]
- Yu, W.; Zheng, C.; Cheng, W.; Aggarwal, C.C.; Song, D.; Zong, B.; Chen, H.; Wang, W. Learning deep network representations with adversarially regularized autoencoders. In Proceedings of the 24th ACM SIGKDD International Conference on Knowledge Discovery & Data Mining, London, UK, 19–23 August 2018; pp. 2663–2671. [Google Scholar]
- Guo, S.; Lin, Y.; Feng, N.; Song, C.; Wan, H. Attention based spatial-temporal graph convolutional networks for traffic flow forecasting. In Proceedings of the AAAI Conference on Artificial Intelligence, Honolulu, HI, USA, 27 January–1 February 2019; Volume 33, pp. 922–929. [Google Scholar]
- Shannon, C. The lattice theory of information. Trans. IRE Prof. Group Inf. Theory 1953, 1, 105–107. [Google Scholar] [CrossRef]
- Li, A.; Zhang, X.; Pan, Y. Resistance maximization principle for defending networks against virus attack. Phys. A Stat. Mech. Appl. 2017, 466, 211–223. [Google Scholar] [CrossRef]
- Li, A.; Yin, X.; Xu, B.; Wang, D.; Han, J.; Wei, Y.; Deng, Y.; Xiong, Y.; Zhang, Z. Decoding topologically associating domains with ultra-low resolution Hi-C data by graph structural entropy. Nat. Commun. 2018, 9, 3265. [Google Scholar] [CrossRef] [PubMed]
- Liu, Y.; Liu, J.; Zhang, Z.; Zhu, L.; Li, A. REM: From structural entropy to community structure deception. Adv. Neural Inf. Process. Syst. 2019, 32, 12938–12948. [Google Scholar]
- Hirai, S.; Yamanishi, K. Detecting latent structure uncertainty with structural entropy. In Proceedings of the 2018 IEEE International Conference on Big Data (Big Data), Seattle, WA, USA, 10–13 December 2018; IEEE: Piscataway, NJ, USA, 2018; pp. 26–35. [Google Scholar]
- Wang, H.; Liu, Y.; Yin, P.; Zhang, H.; Xu, X.; Wen, Q. Label specificity attack: Change your label as I want. Int. J. Intell. Syst. 2022, 37, 7767–7786. [Google Scholar] [CrossRef]
- Tian, Y.; Zhang, Z.; Xiong, J.; Chen, L.; Ma, J.; Peng, C. Achieving graph clustering privacy preservation based on structure entropy in social IoT. IEEE Internet Things J. 2021, 9, 2761–2777. [Google Scholar] [CrossRef]
- Liu, W.; Liu, J.; Zhang, Z.; Liu, Y.; Zhu, L. Residual Entropy-based Graph Generative Algorithms. In Proceedings of the 21st International Conference on Autonomous Agents and Multiagent Systems, Auckland, New Zealand, 9–13 May 2022; pp. 816–824. [Google Scholar]
- Wan, K.; Liu, J.; Liu, Y.; Zhang, Z.; Khoussainov, B. Attacking community detectors: Mislead detectors via manipulating the graph structure. In Proceedings of the International Conference on Mobile Computing, Applications, and Services, Virtual, 23–24 November 2021; Springer: Cham, Switzerland, 2021; pp. 112–128. [Google Scholar]
- Zhang, S.; Liu, J.; Liu, Y.; Zhang, Z.; Khoussainov, B. Improving togetherness using structural entropy. In Proceedings of the International Conference on Mobile Computing, Applications, and Services, Virtual, 23–24 November 2021; Springer: Cham, Switzerland, 2021; pp. 85–98. [Google Scholar]
- Reichardt, J.; Bornholdt, S. Statistical mechanics of community detection. Phys. Rev. E 2006, 74, 016110. [Google Scholar] [CrossRef]
- Clauset, A.; Newman, M.E.J.; Moore, C. Finding community structure in very large networks. Phys. Rev. E 2004, 70, 066111. [Google Scholar] [CrossRef]
- Newman, M.E.J. Modularity and community structure in networks. Proc. Natl. Acad. Sci. USA 2006, 103, 8577–8582. [Google Scholar] [CrossRef] [PubMed]
- Cover, T.M.; Thomas, J.A. Elements of Information Theory; John Wiley & Sons: Hoboken, NJ, USA, 2012. [Google Scholar]
- Vinh, N.X.; Epps, J.; Bailey, J. Information theoretic measures for clusterings comparison: Variants, properties, normalization and correction for chance. J. Mach. Learn. Res. 2010, 11, 2837–2854. [Google Scholar]

Disclaimer/Publisher’s Note: The statements, opinions and data contained in all publications are solely those of the individual author(s) and contributor(s) and not of MDPI and/or the editor(s). MDPI and/or the editor(s) disclaim responsibility for any injury to people or property resulting from any ideas, methods, instructions or products referred to in the content. |
© 2024 by the authors. Licensee MDPI, Basel, Switzerland. This article is an open access article distributed under the terms and conditions of the Creative Commons Attribution (CC BY) license (https://creativecommons.org/licenses/by/4.0/).