1. Introduction
According to [
1], 10 million people worldwide are affected by Parkinson’s disease (PD) and suffer from different symptoms. Some of the most cardinal motor symptoms are tremors, freezing of gait (FOG), bradykinesia, and postural instability, which fritter away their independence and quality of life (QoL).
Since PD is an irreversible neurodegenerative disorder and although there is no standard treatment for it, the medication named Levodopa, even after more than 50 years of development [
2], is considered more effective and provides symptomatic relief [
3], especially at an early stage of the disease. Levodopa works by replenishing dopamine in the brain, a neurotransmitter whose depletion is a hallmark of PD. In newly diagnosed patients, the drug effects lie for several hours, but with the increased severity of the disease, the response turns to short duration and patients with PD (PwPD) need to alter the intervals between drug intake or increase or decrease the dosage [
4,
5]. Despite its efficacy, Levodopa’s long-term use is associated with complications, such as motor fluctuations and dyskinesias, underscoring the complex relationship between the drug and the disease’s pathophysiology. PD is evaluated through clinical assessment by using Movement Disorder Society-Unified PD Rating Scale (MDS-UPDRS) or by Hoehn and Yahr (H and Y) scale [
6] and, to evaluate any specific motor disability, i.e., tremor, bradykinesia or rigidity, the summation of relevant UPDRS III items is performed.
Moreover, ensuring appropriate medical treatment and determining the correct dosage of medication for individual patients often involves frequent qualitative clinical assessments based on rating scales conducted by observers. However, due to the complexity and variability of PD symptoms among patients, relying solely on these rating scales and assessments by a single observer poses challenges. Such evaluations can be time-consuming, subject to significant variation, and influenced by the observer’s experience and background, potentially leading to bias in interpreting the Unified PD Rating Scale (UPDRS) or H and Y ratings. Additionally, the motor state of a patient observed during clinical examinations often fails to accurately reflect their usual condition, as it can be significantly influenced by factors such as fatigue, anxiety, or dehydration resulting from travel. Consequently, clinical assessments provide only a snapshot in time, lacking comprehensive information about the patient’s condition before and after examination. Therefore, the most accurate approach to capturing and understanding patients’ motor function is through continuous monitoring of their body movements over an extended period, rather than relying solely on brief assessments during specific exercises. Thanks to the availability of small form factor, lightweight and low-power inertial sensors have already paved the way in the wearable healthcare domain [
7,
8] and free-living activity monitoring [
9,
10,
11].
Table 1 explains the different proposals suggested for PD patients. Each device is for a specific PD application scenario, such as in [
12], who measured the stiffness in muscles while performing tasks, ref. [
13], who used wearable devices on each limb to diagnose PD, and ref. [
14], who analyzed signals from the lower limb to detect FOG episodes. Each proposed system used multiple nodes for data collection and was unable to provide an end-to-end system to track the motor activities of PD patients. In addition to this, most of the discussed work in
Table 1 explored different sensors with different methods to analyze motor symptoms, including soft computing techniques and statistical analysis. Since tremor and bradykinesia exhibit features relevant to classification both in the time and frequency domain, a TF (time–frequency) representation is able to provide a holistic view of such information. This is the first study in which TF representations of movement data are used to evaluate motor function and the severity in PD patients. Since a link exists between the severity levels (0–4) and the mutual relationship between the time–frequency maps can provide information about motion planning at different spatial locations. The deep convolutional neural network (CNN) takes these TF maps as input and could learn the intended severity levels from the mutual relationship between TF patterns of the various scores. Hence, a wrist-based wearable device is proposed in this study which monitors PD patient locomotion continuously and analyzes the severity of symptoms by converting inertial signals to TF mapping using continuous wavelet transform and CNN models. This helps medical personnel monitor PD patients in an uninterrupted way.
The paper is structured as follows:
Section 2 provides a review of the literature regarding PD detection,
Section 3 introduces the proposed system,
Section 4 discusses the designed hardware and its features,
Section 5 describes the implementation on the cloud,
Section 6 discusses the designed deep learning (DL) model,
Section 7 presents the results, and the discussion is concluded in
Section 8, with future work and limitations presented in
Section 9.
2. Literature Review
The research literature of the past decade has extensively discussed the utilization of wearable devices for measuring motor disability, tracking disease progression, and assessing daily life activities (DLAs) in PD patients. Numerous studies have explored the integration of wearable sensor devices with machine learning (ML) methods for various purposes. However, despite these efforts, the practical implementation of technological systems to support PD diagnosis, online monitoring, and home monitoring in everyday clinical practice remains elusive.
Researchers developed and designed wearables specifically for improving early diagnosis and monitoring the PD patients based on ML or DL. In [
19], researchers conducted experiments involving 10 PD cases and two healthy subjects to evaluate tremor severity using integrated pullover triaxial accelerometers. Tremor assessment and peak detection techniques were employed to determine movement frequency. The study found that accelerometers, along with UPDRS scores, demonstrated 71% and 89% sensitivity in detecting the correlation of rest tremor and posture tremor, respectively. However, while the pullover, or smart clothes, showed promising results, they posed challenges in routine and continuous PD assessment. Consequently, the study provides limited insights into UPDRS severities, potentially impacting performance measurements. Similarly, in [
20], researchers utilized wearable accelerometers on arms to estimate tremor severity across various activities involving PD cases and healthy subjects. The study achieved an 87% accuracy in severity classification using a Hidden Markov Model (HMM), a statistical model that assumes the system being modeled is a Markov process with unobserved (hidden) states. HMMs are particularly useful in applications where the observation sequence is influenced by underlying factors that are not directly observable, making them ideal for analyzing temporal patterns in Parkinson’s disease symptoms. However, the study’s applicability is limited due to the absence of data for tremor severity level 4.
In [
21], triaxial accelerometer data collected via a smartwatch during hand motor activities in 19 PD patients was analyzed. The study employed wavelet feature extraction and a support vector machine (SVM) classifier to predict tremor severity. The model achieved 78.91% accuracy in Leave-One-Out Cross-Validation (LOOCV), indicating promising results. In this study, the method LOOCV was employed to ensure the robustness of the model’s performance. LOOCV involves using a single observation from the original sample as the validation data, and the remaining observations as the training data. This process is repeated such that each observation in the sample is used once as the validation data. This technique is particularly beneficial in scenarios where the dataset is limited, as it maximizes the use of available data for training and testing, thereby providing a thorough evaluation of the model’s predictive capabilities. However, combining severity levels 2, 3, and 4 into one score could potentially complicate tremor level identification by neurologists. In [
22], the authors used BioStamp nPoint to transmit inertial sensor signal data to a cloud computing environment for PD hand tremor quantification. A multilayer perceptron neural network yielded considerable accuracy. Similarly, in [
23], the study aimed to quantify PD tremor response to different deep brain stimulation (DBS) amplitude settings using a deep learning convolutional neural network. The model demonstrated 100% classification accuracy for tremor quantification across various DBS settings.
In [
24], five ML algorithms were evaluated to distinguish between DBS amplitude settings. The support vector machine (SVM) achieved the highest classification accuracy, with K-nearest neighbors showing considerable performance with minimal model development time. However, these studies had limited validation, focusing on hand tremor assessment and involving only one subject for proof of concept. Similarly, in our previous work regarding the development of the A-WEAR bracelet [
25], the device had several limitations, i.e., no wireless data transmission, no continuous monitoring and battery life changes.
In summary, although efforts have been made to develop wearable devices for aiding in PD management, their practical application in clinical practice for diagnosis and management remains challenging. Key challenges include battery life limitations, device size and weight concerns, privacy and security considerations, communication capabilities, and real-time monitoring requirements. Implementing ML and DL algorithms in medical applications also presents challenges, such as data distribution issues and lack of clinical validation. Moreover, previous studies often overlook all tremor levels, focus on specific tasks rather than daily life activities, and neglect wearable device efficiency and cloud framework robustness. Additionally, the time-consuming nature of UPDRS assessments and their impracticality in routine clinical settings hinder efficient PD management.
To overcome these shortfalls, it has been shown that motion signals recorded using inertial sensors come with specific patterns both in the time and frequency domain. Features that are extracted with continuous wavelet transform (CWT) [
26] can discriminate well between PD symptoms. So, a time–frequency (TF) approach is proposed in the present work. The inertial signals recorded from 17 PD patients are converted to TF mapping using CWT which provides sufficiently detailed information to distinguish complex sub-levels of motor symptoms and further classified using the DL approach. Indeed, the tremor and bradykinesia severity in PwPD can be decoded from the TF representations better than the features extracted using statistical methods. The proposed bracelet is capable of recording all the physical movements of a patient in the home environment (such as walking, turning around, hand resting tremor, or opening and closing of the bottle cap) for consecutive 6 h without recharging needs; this has been tested and validated and the setting can even be altered to make it work for 12 to 20 h. The device is capable of efficiently and timely storing the collected information. As whole-day home monitoring data from the inertial sensors is huge and not manageable by a single computer, in order to solve this issue and provide efficient data storage and fast computing, we also designed and implemented a cloud computing environment where the great amount of data is stored and analyzed very fast by ad hoc DL algorithm. The output of the computation is transferred to the end users on demand in the most secure way. Thus, in this research study, a small form factor device developed as a smart bracelet is proposed. It consumes little power and automatically connects to a smartphone using Wi-Fi, storing data on a cloud platform continuously from where the computation, analysis, and processing of movements are performed. The bracelet’ses an MT3620 microcontroller which has built-in inertial sensors, a Wi-Fi subsystem and can connect to the Microsoft Azure platform for efficient data storage. Using Azure Cloud, the stored data are automatically sent for a processing stage in which the PD patients’ data are differentiated in the form of severity level for effective management of L-dopa dose. The proposed model maintains the users’ privacy and data security, and all data transmitted and received from the ServiceNow platform (a cloud-based IT service management platform) [
27] are encrypted and accessed via defined Azure Sphere APIs (Application Programming Interfaces). In this way, the whole novel PD evaluation system can be seen as a cloud-based solution combined with a dedicated acquisition device (the A-WEAR bracelet). To sum up, this paper offers the following contributions:
Development of a comprehensive system tailored for autonomous tracking of PD symptoms, involving continuous monitoring and analysis of everyday movements.
Creation of a sophisticated framework utilizing a wearable bracelet integrated with wireless inertial sensors and cloud connectivity to assess the severity of tremor and bradykinesia symptoms. This framework enables remote monitoring by medical professionals, fostering enhanced patient care.
The primary focus is on the development of a cutting-edge DL model aimed at predicting the response of PD patients to L-dopa medication. The derived insights are poised to elevate patient well-being by empowering clinicians with valuable tools to optimize medication dosage and mitigate associated risks.
4. A-WEAR PD Bracelet
Lately, there has been a proliferation of fitness wearable gadgets equipped with IMUs, such as the Apple Watch (Apple Inc., Cupertino, San Francisco, CA, USA), Samsung Gear S (Samsung, Seoul, Republic of Korea), and Mio Alpha (MioLabs Inc., Santa Clara, CA, USA), among others. These devices have the capability to monitor various metrics including daily step count, oxygen saturation (SpO
2), skin temperature, breathing rate, resting heart rate, sleep activity, and heart rate variability. According to [
28], these commercially available motion-tracking wearables offer convenience in observing the natural behavior of clinical patients. However, the pertinent question remains: are these wearable devices appropriate for assessing PD patients? All these smart devices can count steps and determine stride lengths, which is suitable for fitness tracking or managing the daily routine of PD patients. However, the variability of PD patients is different from the rest of the patients. Therefore, these commercially available smart wearables lack the capacity to offer an unbiased evaluation for PD patients. They primarily offer feedback on activity levels, which can be beneficial for their rehabilitation but may not provide comprehensive objective assessments. Some other commercially available prototypes such as Fitbit, Garmin, Actigraph, and Xsens are more comfortable to patients in a home environment, used by subjects without any assessment with long battery lifetime and regarded as an extended duration monitoring system for individuals with PD. In a cross-sectional study conducted by the authors in [
29], the Fitbit Zip demonstrated the highest accuracy among all tasks. The study evaluated the accuracy of four consumer-grade activity trackers (including the Fitbit Zip, Fitbit Surge, Jawbone Up 2, and Jawbone Up Move) among individuals with PD while they engaged in continuous and intermittent walking within a simulated environment. Similarly, the researchers in [
30] compared the results of Fitbit Charge HR and Garmin Vivosmart HR with ActivPAL3 and concluded that Garmin gives less error than Fitbit. However, all these prototypes and systems mentioned in
Table 2 lack a specific cloud-based assessment environment. In essence, there is a requirement for a system that not only quantifies the severity of the illness but also aids in the rehabilitation of PD patients in their everyday environment. This system should allow patients to utilize it independently, even during their ON/OFF stage, without requiring constant supervision. Other proposed wrist-worn wearable solutions for PD patients are reported in
Table 2. As can be seen, each of them has a drawback associated with them and is not easily affordable in terms of cost, but our proposed device costs around 400 euros which is a low price, but offer robust results due to the innovation of our proposed architecture.
To overcome these limitations, we present an updated version of the A-WEAR bracelet [
25], as depicted in
Figure 2. This version now supports direct uploading of accelerometer sensor data to the cloud platform, offering several enhancements over its initial iteration shown in
Figure 3. In the past, the functionality of the bracelet was confined to conducting standard motor tests lasting 1 min or 45 s for diagnosing tremor and bradykinesia. However, significant advancements have transformed its capabilities, allowing seamless data transmission directly to the cloud platform. This enables real-time data retrieval by neural networks or DL algorithms, facilitating features such as sending predictions directly to medical staff or back to patients, thereby introducing automation and intelligence.
With the emergence of microcontrollers featuring IoT capabilities, the connectivity of wearable devices to the Internet has become feasible. Leveraging REST API methods through the libcurl [
39] library cURL, which enables data transfer to and from servers, the wearable device can utilize POST and GET operations to interact with the cloud platform. For this purpose, we opted for the MediaTek MT3620 [
40] microcontroller, renowned for its high integration, performance, and robust security, essential for modern Internet-connected devices. The MT3620 is specifically designed for a wide range of IoT applications, including but not limited to smart home automation, industrial monitoring, and healthcare devices, offering extensive I/O peripheral subsystems for enhanced design flexibility. Additionally, being the first Microsoft Azure Sphere solution [
40], the MT3620 seamlessly integrates with the Azure [
41] platform for database storage, further enhancing its utility across various domains.
Currently, ServiceNow [
42] is chosen as the support cloud platform. ServiceNow represents a PaaS platform, and it gives all the necessary infrastructure (network and database) that satisfies our application. It also provides the possibility to write applications directly on top of it, so it makes sense to use it to integrate the neural network or DL in it and makes it possible for the microcontroller to interact with it through cURL and thus transfer data using different network protocols.
4.1. The MT3620 Microcontroller
We chose the Avnet Azure Sphere MY3620 Starter Kit [
43] for prototyping due to its integration of a MediaTek microcontroller, USB interface, power circuits, and MEMs sensors into a compact package ideal for placement on a patient’s arm during data testing and training. The MT3620 comprises a tri-core package: (i) an Arm Cortex-A7 [
44] application processor, and (ii) two Arm Cortex-M4 [
45] processors dedicated to real-time applications. The incorporated MEMs sensors have accelerometer, gyroscope, barometric and temperature sensors that can communicate through I2C (inter-integrated circuit) with any of the three processors inside the microcontroller. I2C is a communication protocol by which devices communicate with each other directly.
The MT3620 also features a Wi-Fi subsystem, making it well suited for IoT applications like the A-WEAR bracelet [
25]. It supports various low-power operation modes, enabling users to adjust the processor’s power profiles for optimal performance or energy conservation. Furthermore, it offers sleep mode functionality when no measurements are being taken. In terms of security, the MT3620 provides a high level of protection for connected devices, with its security features and Wi-Fi networking operating independently from end-client applications. Access to security features and Wi-Fi capabilities is restricted to defined Azure Sphere APIs, ensuring enhanced security measures.
4.2. Wireless Connectivity-Wi-Fi
Advancements in technology have facilitated the integration of wireless communication into healthcare wearables, enabling the development of point-of-care diagnostic and monitoring devices. Most of these devices prefer short-range wireless communication technology, e.g., BLE (Bluetooth low energy), Zigbee, or Wi-Fi. The choice of the communication technology profoundly depends on the architecture of the application [
46], e.g., if the designated application depends on a high data rate, then Wi-Fi is an optimal choice, which is the reason why this research study prefer Wi-Fi over other wireless communication technologies. The other reason for employing Wi-Fi is the collected data are encrypted, stored, displayed, processed, and synchronized to the cloud platform. The user thus has full control of the device and the data provide a real-time or historical view of the collected sensor readings in numerical representation or diagrams within the cloud, which allows multiple authorized users to access them.
4.3. Power Consumption
MT3620 offers a couple of options to save power in an energy constrained system. The first option represents a power profile scheme [
47] available for the Cortex-A7 processor as this one is running at a rate of 500 MHz and utilizes significant energy. There are three power profiles called high performance, balanced and power saver. As the Cortex-A7 is not performing any demanding computation, it is set to the power saver mode during data measurement, as it is sufficient for watching the mailbox through interruptions and uploading data to the cloud from time to time. For instance, considering a 10 ms data sample and accounting for accelerometer data on three axes, a single row of data consists of six numeric values, occupying approximately 25 to 30 bytes of data represented as strings in the CSV file. With this rate, the 100 KB limit is reached within approximately 30 s, allowing sufficient time for the Cortex-A7 to execute its task. Additionally, in power saver mode, the frequency is halved.
Currently, two buttons are accessible to the user: one initiates the sampling and transmission of data, while the other halts this process. During periods of inactivity, the bracelet transitions into sleep mode to conserve battery life [
48]. According to [
40], the MT3620 is expected to consume approximately 0.01 to 0.02 mA in sleep mode, but this may rise to 520 mA under extreme conditions, such as when all three processors are operational and Wi-Fi transmission is at maximum capacity on the 5 GHz band (although such a scenario is unlikely). In a study conducted by [
49], measurements indicated that the Starter Kit typically consumes around 100–110 mA under normal Wi-Fi usage. However, the power consumption with different Wi-Fi configurations is detailed in
Table 3 and shown in graphs in
Figure 4.
Table 3 details our device’s power consumption under different Wi-Fi configurations, crucial for ensuring its practicality for continuous PD monitoring. This analysis reveals the device’s energy efficiency, highlighting its capability to operate for extended periods essential for real-time symptom tracking without frequent recharges. Specifically, the comparison between 2.4 GHz and 5 GHz Wi-Fi setups, with and without Azure cloud connectivity, informs our design decisions towards optimizing battery life. These findings align with our study’s aim to develop a wearable PD monitor that balances performance with user convenience, setting the stage for future enhancements in wearable PD technology. It is clear that enabling Wi-Fi results in a rise in current from around ≈115 mA to roughly ≈130 mA. This change is noticeable particularly when the application connects to Azure. At the beginning of the power-up cycle, there is a phase where the device processes cryptographic algorithms, keeping Wi-Fi inactive, and then the current surges. The graphs illustrate that during the power down state, the board draws around ≈40 mA of current. It is observed that ideally, the MT3620 should only consume approximately 0.01 mA, implying that the majority of the 40 mA is utilized by the Starter Kit hardware. However, in the future we want to extend the working hours of the device without charging it the limitations of typical current consumption and hardware wakeup latency must be kept in mind for this the worst-case scenarios are also added in
Table 4. Incorporated within this discussion on wireless connectivity and demonstrated through
Table 3, we have conducted a comprehensive analysis of the device’s power consumption across different Wi-Fi configurations to assess its battery life and durability. These insights are crucial for ensuring the device’s viability for continuous, reliable monitoring of PD symptoms without necessitating frequent recharging or replacement. The detailed examination of power usage under various operational scenarios underscores our commitment to optimizing the device for extended use in real-world conditions, ensuring that patients can rely on this technology for continuous symptom monitoring with minimal interruption.
5. Cloud Service
5.1. The ServiceNow Platform
ServiceNow offers PaaS, delivering comprehensive technical management support, including IT service management, to large corporate IT operations, encompassing essential help desk functionalities. While primarily designed to cater to the IT workflows of businesses, it provides a robust infrastructure for cloud applications, complete with pre-configured databases for rapid deployment. Moreover, it facilitates the development of JavaScript applications with seamless integration of REST API methods for third-party tools (such as the bracelet in our case). Additionally, it supports various other types of applications, including Java and PowerShell, enabling local execution with seamless data transfer to the cloud. Furthermore, it offers free instances to developers keen on exploring and experimenting with the platform.
Given these benefits, it is evident that this platform can serve as a conduit between the wearable device and the DL computation method. By utilizing ServiceNow, we have the capability to establish a POST method (or utilize pre-existing ones) for transferring the gathered data to a specified database table. Subsequently, a script can retrieve this data via a GET method and input it into the DL algorithm. The algorithm can be developed directly in JavaScript on the platform or executed locally on a computer using Python or MATLAB scripts. Finally, the results can be transmitted back to the platform for further processing.
5.2. The Application Design
This section outlines the data measurement and transmission process to the ServiceNow platform for storage, aimed at future training purposes.
Figure 5 provides an abstract overview of the bracelet application design.
To meet the requirements of real-time data sampling and cloud data transmission, two out of the three microprocessors are utilized. The Wi-Fi subsystem constraint dictates that only the Cortex-A7 processor can interact with the cloud. However, experimental testing revealed that using the A7 for both real-time sampling and data transmission within the sample period is impractical. To address this, a system with two processors is employed: the Cortex-M4 performs real-time data sampling and sends each new sample to the Cortex-A7 for temporary storage in a 100 KB buffer.
Communication between the two processors is facilitated via a mailbox, functioning as a ring buffer to allow independent operation in the producer-consumer paradigm. The Cortex-A7, equipped with a 4 MB system memory, can adequately store 100 KB data chunks supported by libcurl. Once the buffer reaches capacity, data chunks are sent to the ServiceNow platform. Meanwhile, the Cortex-M4 continues sampling and storing new data in the mailbox buffer for future transmission.
In version 2.0, CSV files are sent to the ServiceNow platform, with each file being 100 KB in continuous sampling. Users have the option to stop sampling, prompting the Cortex-A7 to transmit the remaining data (potentially less than 100 KB). Data on the ServiceNow platform are stored in CSV format and parsed into data tables accessible for querying by third-party tools, including scripts for feeding data to the neural network.
6. Enhancing PD Severity Scoring through a Proposed DL Model
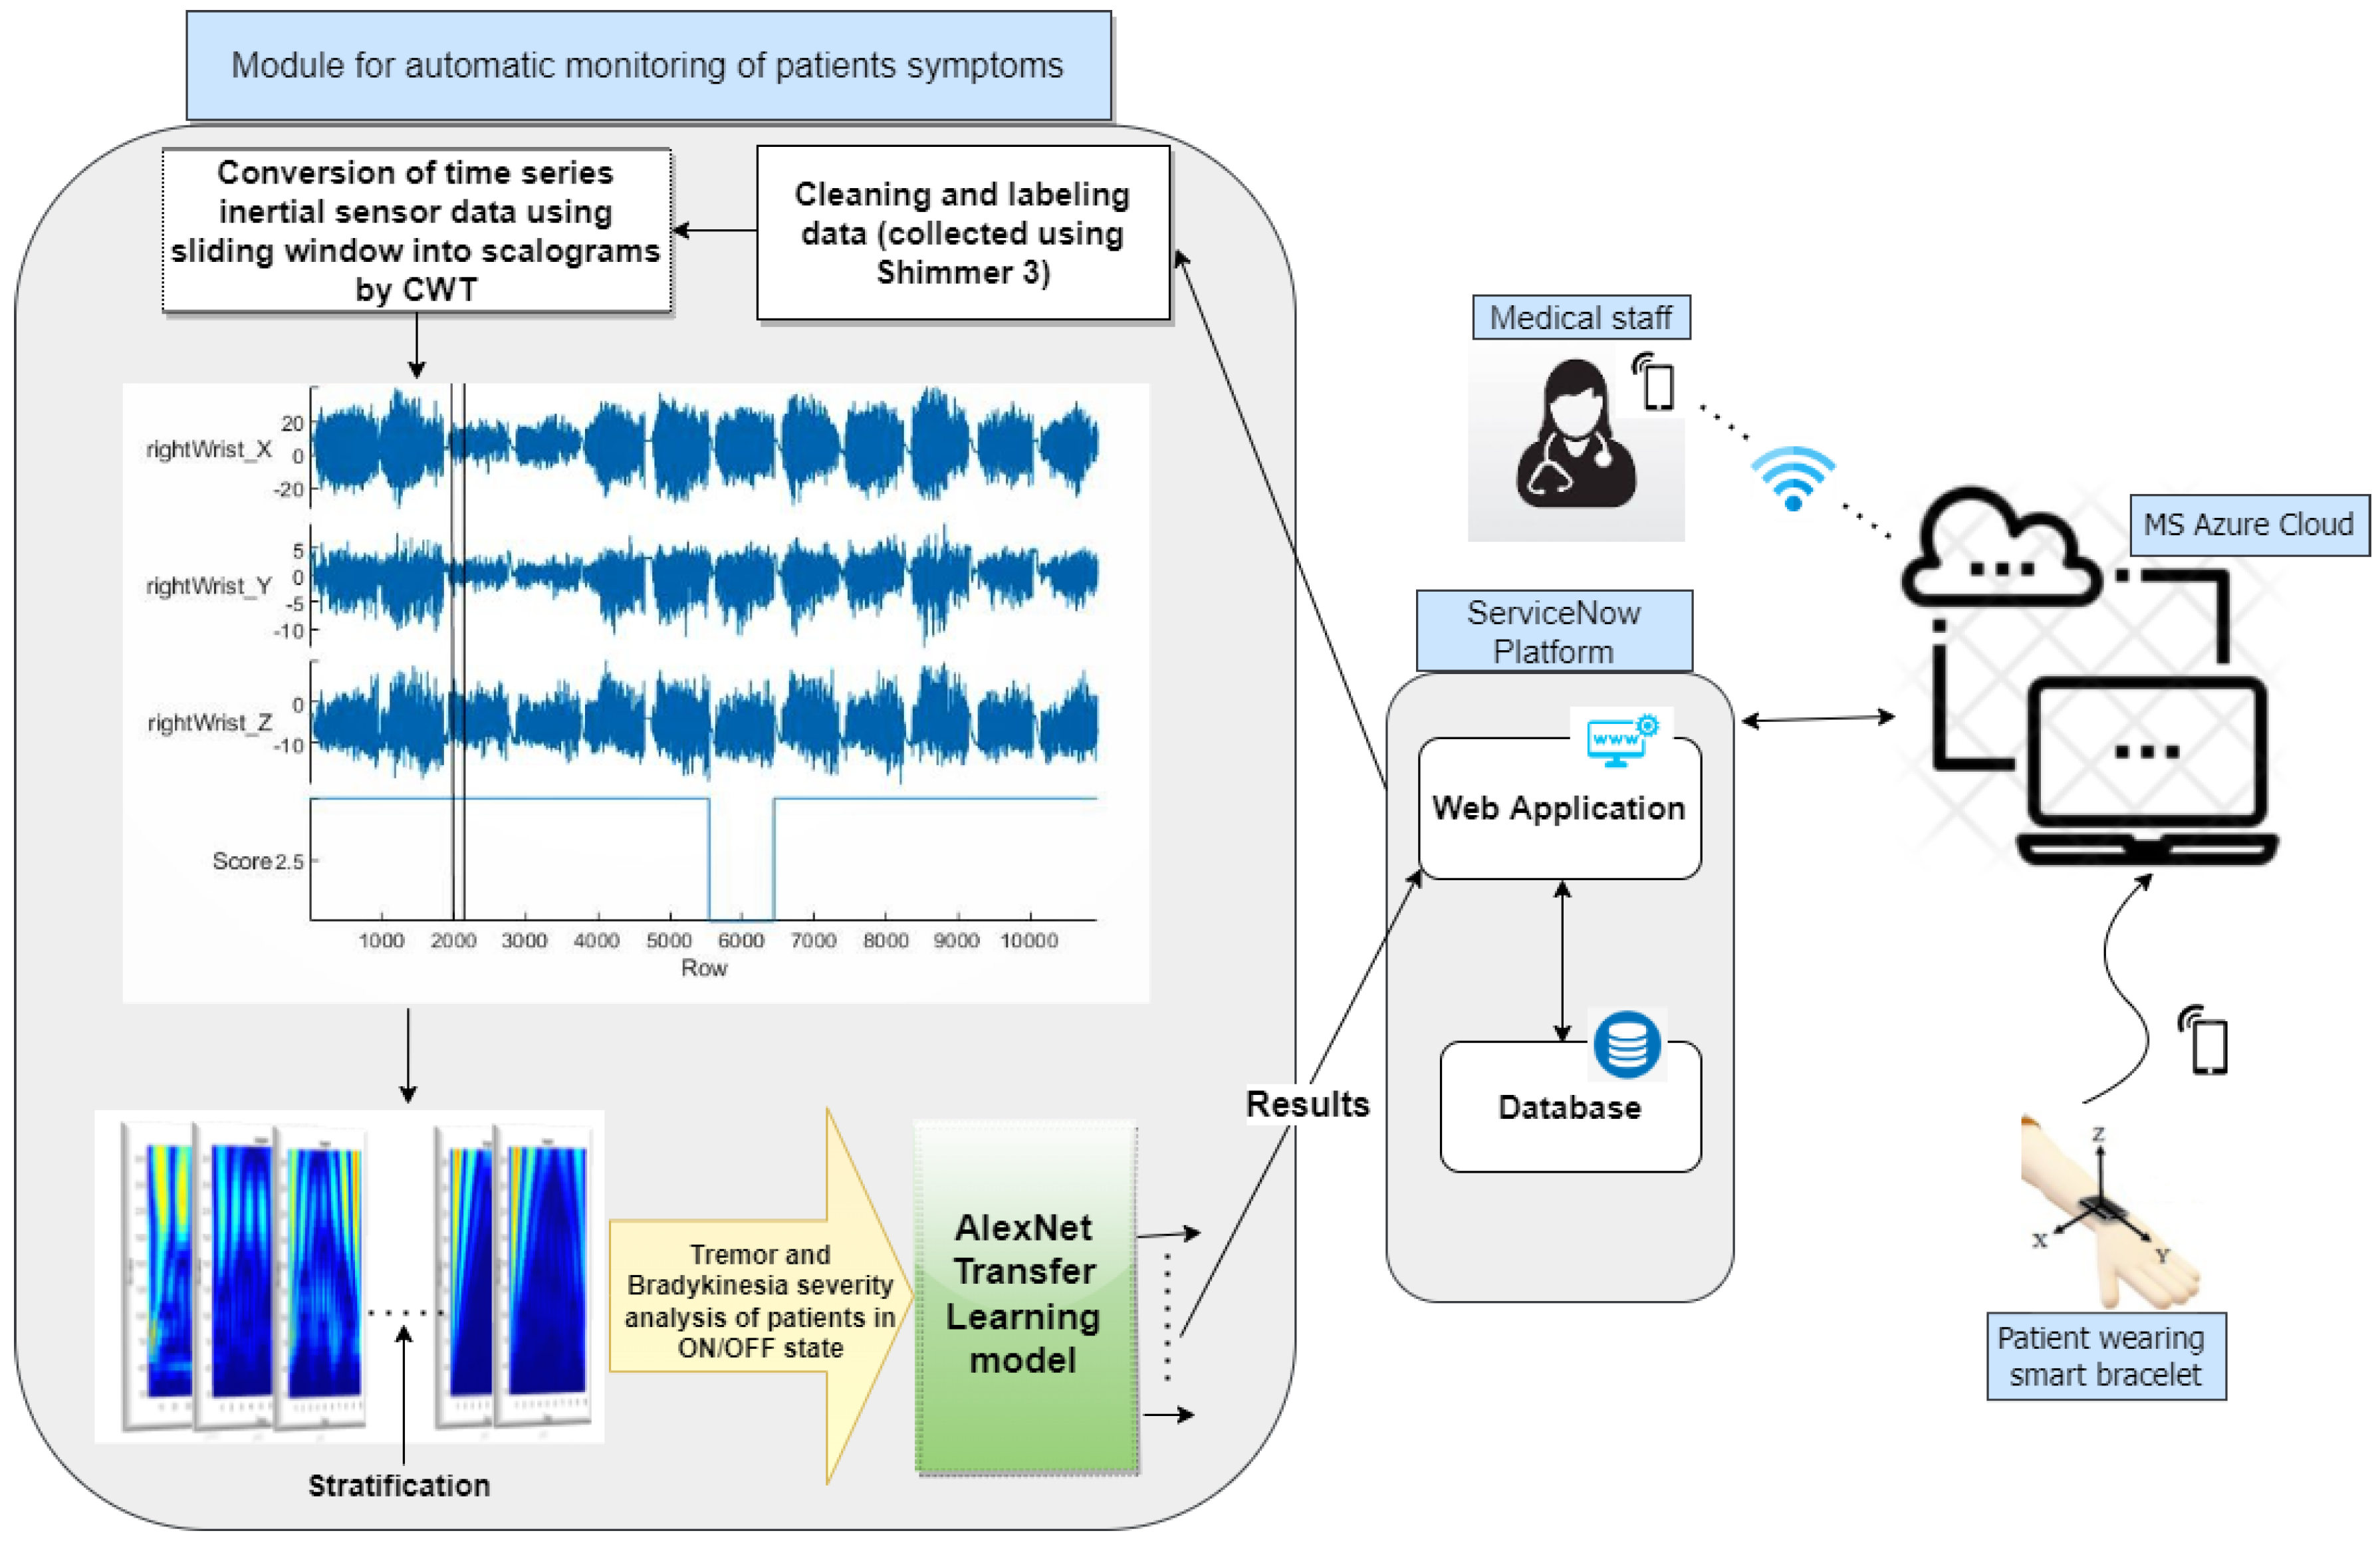
The data processing and analysis flowchart is depicted in
Figure 1. Accelerometer data are gathered from PwPD in both ON and OFF states, pre-processed, and labeled according to UPDRS scoring by neurologists. Subsequently, the time series data undergo conversion into scalograms using CWT. Finally, the sorted and analyzed database is utilized with the transfer learning AlexNet model.
6.1. Comparison of Data Collected from the Proposed Bracelet and from Shimmer Device
We performed a comparative analysis by utilizing data gathered from both the Shimmer device and our proposed bracelet. The accelerometer-equipped Shimmer device provided readings similar to those obtained from our device. To validate our results, we collected comparative data from a single patient using both our bracelet (with adherence to COVID-19 precautions) and the Shimmer device. Notably, both sets of recordings exhibited nearly identical six-digit numeric values and sampling rates. The sampling rate for the Shimmer device was configured at 100 Hz, a setting also applicable to our A-WEAR bracelet. Importantly, minimal accelerometer noise was observed in both devices, exerting negligible influence on the datasets. This validation underscores the suitability of datasets obtained from the Michael J. Fox Foundation using Shimmer wearable sensors for validating our proposed computational algorithm. To ensure the accuracy and reliability of the data collected from the A-WEAR PD bracelet, we employed a rigorous verification process against the established Shimmer device, known for its precision in capturing movement data. This comparative analysis involved several key steps:
Sampling rate alignment: We first ensured that both devices operated at equivalent sampling rates. This alignment was critical for a fair comparison of the temporal characteristics of the data.
Data synchronization: We meticulously synchronized the start and end times of data collection for both devices. This synchronization was achieved through manual initiation and termination of the recording sessions, ensuring temporal congruence.
Feature extraction consistency: Both devices extracted identical features from the raw data, including amplitude, frequency, and variability measures of movement. This step ensured that comparisons were made on a like-for-like basis.
Statistical correlation analysis: We conducted correlation analyses to assess the degree of similarity between the datasets. High correlation coefficients indicated strong agreement between the devices, reinforcing the validity of the A-WEAR PD bracelet’s data.
Error margin evaluation: We acknowledged the inherent measurement error in any device and established acceptable error margins based on literature precedents. Comparative data that fell within these margins were considered verified.
Expert review: Finally, movement disorder specialists reviewed random samples of the data visualizations from both devices, providing qualitative validation of the A-WEAR PD bracelet’s performance.
This verification process not only validated the accuracy of the A-WEAR PD bracelet but also reinforced its potential as a reliable tool for continuous monitoring of Parkinson’s disease patients.
6.2. Data Description
The data utilized in this study originate from the MJFF Levodopa Wearable Sensors Dataset, which is backed by the Michael J. Fox Foundation [
50]. This dataset can be accessed at the following link:
https://www.michaeljfox.org/news/Levodopa-response-study (accessed on 3 March 2024). Participants underwent monitoring both in-clinic, engaging in a sequence of standard activities, and at home while performing DLAs. Further details regarding the patients are provided in
Table 5.
The cohort that was chosen for this study’s data collection wore Shimmer3 on both upper limbs. However, the data analyzed in this study originate from the most impaired upper limb of the patients. The participants wore these wearables for four days.
On the first day of data collection, participants were in the ON state (after medication intake) in the laboratory. They answered demographic and medical history questions, completed sections I, II, and IV of the MDS-UPDRS, and wore wearable devices. They then performed section III of the MDS-UPDRS and various ADL tasks, including standing, walking, finger-to-nose maneuvers, drawing, typing, bottle opening, organizing sheets, assembling nuts and bolts, towel folding, and sitting. Clinical observers rated symptoms such as tremors, bradykinesia, and dyskinesia on a scale of 0–4 during each task.
On days 2 and 3, participants engaged in their regular daily activities while wearing all the sensors. Shimmer subjects were additionally instructed to perform specific tasks corresponding to section III of MDS-UPDRS, including alternating hand movements for 30 s (once per arm), finger-to-nose maneuvers for 30 s, and sitting quietly for 30 s, repeated every 30 min, seven times each day, at home.
On day 4, participants arrived at the laboratory in an OFF state after abstaining from medication for approximately 12 h. The procedure from day 1 was repeated, starting with motor tasks performed in the OFF state. Participants then took their morning medication dose and repeated the motor tasks 5 to 7 times at the same intervals as day 1 (every 30 min). Severity scores and symptom presence were reassessed, followed by the removal of sensors.
For each task instance, clinicians provided severity labels and/or noted symptom presence. Tremor severity scores (0–4) and bradykinesia severity scores (0–4), along with symptom presence, were recorded for both day 1 and day 4. We analyzed data solely from these two days to estimate tremor and bradykinesia severity.
6.3. Continuous Wavelet Transform
In previous research, various applications of the continuous wavelet transform (CWT) have been explored in biomedical contexts. For instance, Narin et al. [
51] utilized CWT to identify epileptic seizure areas in EEG signals, while He et al. [
52] employed CWT for atrial fibrillation detection from ECG signals. Similarly, Rezvanian et al. [
53] utilized CWT for real-time detection of freezing of gait (FOG) and gait analysis, achieving a sensitivity and specificity of 82.1% and 77.1%, respectively. Alafeef et al. [
54] applied CWT to measure gait abnormalities in Parkinson’s patients compared to healthy subjects. Additionally, Pham et al. [
55] developed a CWT-based algorithm for step detection using sensors attached to participants’ lower backs. These studies collectively demonstrate the effectiveness of CWT in detecting various motor symptoms of Parkinson’s disease (PD).
Traditionally, Fourier transform or short-time Fourier transform methods were commonly employed to extract features from PD motor symptom signals, particularly from the lower body or upper limb motion signals [
56]. However, these methods often lack precise event localization, leading to the extraction of a large number of features. This increase in feature count can impact various aspects such as energy consumption, latency, and data storage and processing efficiency. To overcome these limitations, we adopted the continuous wavelet transform (CWT) method in our study, which provides both time and frequency domain features.
In our research, we applied the CWT method to accelerometer signals obtained during standard hand movement exercises and DL assessments (DLAs) of PD with varying severity scores. Prior to CWT implementation, the data were organized and labeled according to severity scores in the ON/OFF state. The CWT representation of a signal is expressed in Equation (
1), where
represents the wavelet mother function,
a and
b signify the dilatation (or scale) and shifting (or translation) variables, respectively, and
denotes the wavelet coefficients.
The choice of wavelet type is crucial, as it defines the scale-to-frequency relationship. In our study, we adopted the Morlet wavelet mother. The range of scales for CWT analysis [1,
] was determined using the frequency scale relationship indicated in Equation (
2), where
is determined based on the mother wavelet us core frequency
(), the sampling frequency
(), and the tremor or bradykinesia frequency
(f).
With the selected wavelet and parameters, we calculated the CWT by tracing the frequency range relevant to bradykinesia and tremor occurrences. Subsequently, using MATLAB scripts with a 3 s temporal window before motion initiation, the raw signals were projected to the time–frequency (TF) domain by the CWT and segmented into individual procession events. The accelerometer data yielded a total of 7263 scalograms, comprising 637 bradykinesia scalograms and 6763 tremor scalograms, as displayed in
Table 6. Scalograms provide a clear, three-dimensional representation of the wavelet coefficients at a given time and frequency, as depicted in
Figure 6, where we employed a modified jet colormap for visualization.
As a tremor is trembling or shaking of the limb, the most common type of tremor faced by PD patients is resting tremors, which occur when the upper limb is resting but continues to tremble. In
Figure 6, the scalograms represent the TF mapping of inertial signals. Considering tremor scalograms, it is observed that at lower scales, the waves are seen to be compressed and at higher scales they are stretched. This is because of the fast-changing details of movement signals, i.e., tremor while in bradykinesia; the scalograms are less condensed at lower scales compared to tremor, and this compression lessens further with higher severity scores. Bradykinesia is characterized by very low-frequency movements and sluggish shifts in movement signals. Apart from this, it can also be seen that as the severity scores increase, color variations also increase. Likewise, bradykinesia is a dull movement during an action, which resembles a decrease in movement amplitude. From bradykinesia’s scalograms, as depicted in
Figure 6, it is evident that as the severity score increases, the navy blue tone is more dominant. Hence, each epoch calculated by CWT acts as the input for the matrix, with all cases showing similar severity levels. Motor-related disorders, i.e., tremors and bradykinesia, are typically not recorded with accurate severity scores, especially at such low frequency, and most of the features are lost in hand-crafted feature extraction methods. On the other hand, the complete spectrum of movement is produced by this CWT approach, allowing one to see the variations at every level. Additionally, a MATLAB script is used to stratify these scalograms according to severity score in a different folder before a DL classifier is used to classify them.
6.4. Deep Learning-Based Model for Classification
In recent years, DL has garnered significant attention across various computer vision domains, including the detection of PD. Studies now aim to identify varying severity levels of diseases, such as PD. For instance, researchers in [
57] detected PD and its severity from gait abnormalities using data from the Physionet database. They processed vertical ground reaction force (VGRF) signals within a deep neural network (DNN) composed of convolutional and max-pooling layers, achieving superior results compared to hand-crafted feature extraction methods. Similarly, ref. [
58] assessed disease severity using speech signals, employing a DNN architecture with input, hidden, and output layers.
In our study, we utilize the AlexNet deep convolutional neural network (CNN) architecture for image classification. As far as we are aware, this study represents the inaugural endeavor to utilize image-based accelerometer data from a significant cohort to assess the severity of bradykinesia and tremors in both ON and OFF modes among patients. Furthermore, our proposed method outputs severity scores ranging from 0 to 4, providing richer diagnostic information compared to a binary “severe/non-severe” output.
6.4.1. AlexNet Transfer Learning Model
Transfer learning represents an advanced strategy for addressing pattern recognition challenges. It leverages knowledge acquired from one or more source tasks, such as the ImageNet database [
59], to enhance generalization in a related target task. Compared to conventional DL methods, transfer learning offers several advantages: (1) it employs a pre-trained model as a foundation, and (2) fine-tuning a pre-trained network is considerably simpler and faster when knowing which layers to reuse and how many to retrain for the specific problem, as opposed to training a random deep neural network (DNN) model from scratch. Fundamentally, transfer learning involves adopting a sufficiently complex and effective pre-trained model, typically trained on datasets like ImageNet, a comprehensive database developed for visual object recognition, containing over 20,000 categories. Many pre-trained models are trained on a subset of ImageNet with 1000 categories, and then they transfer the acquired knowledge to simpler tasks that involve limited confidential data. The aim of this research is to effectively classify the scalograms generated using continuous wavelet transform (CWT) into different stages of PD patients’ ON and OFF states. With the increasing prevalence of PD cases, there is a pressing need to swiftly categorize patients into distinct disease phases, spanning from mild to severe. The utilization of AlexNet architecture in this study involves experimenting with its weights to attain optimal results. As depicted in
Figure 7, modifications have been made to the architecture with the objective of enhancing classification accuracy for assessing severity levels, thereby facilitating more precise medical evaluations.
Table 7, provides details on the hyperparameters. The dataset is divided into training and testing sets at a ratio of 70/30. This investigation employs a score-based approach, where each subject is assigned a severity score considering the varying degrees of severity observed in the patient data. The severity-score-based data are partitioned for training, testing, and validation purposes.
The operational framework of our proposed AlexNet architecture is delineated in
Figure 7, and is initiated by resizing the input scalograms to dimensions of 227 × 227 × 3, denoting the width, height, and RGB channels, corresponding to the data flow sequentially through convolutional layers, max-pooling layers, and additional convolutional layers, followed by subsequent max-pooling layers. This cascading process is defined by specific mathematical operations detailed by formula (
3), where parameters such as ‘n’ represent the image dimensions, ‘s’ indicate the stride, ‘f’ denote the filter size, and ‘p’ signify the padding.
In
Figure 7, the convolutional operations commence with ‘n’ set to 227, utilizing 11 × 11 filters with a stride of 2, resulting in image dimensions of 55 × 55 with 96 kernels. Following this, the data undergo max-pooling, maintaining the kernel count, before proceeding to another convolutional layer with padding set to 2 and a stride of 1, preserving the image size at 27 × 27. This pattern continues through the subsequent convolutional layers, where padding remains at 1, maintaining the image size at 13 × 13 while kernel configurations vary. Finally, in the last max-pooling layer, a stride of 2 reduces the image size to 6 × 6.
The convolutional layer computes the scalar product of image portions with corresponding weights to generate neuron outputs. The Rectified Linear Unit (RELU) layer applies an element-wise activation function, while the pooling layer executes spatial decimation, decreasing sample size along with spatial coordinates. The Fully Connected (FC) layer assigns class scores for each sample and delivers predictions. Predicted classes are determined based on maximum probability scores.
Modifications to the last Fully Connected Layer (FCL) entail outputting five classes, diverging from the original 1000-class setup. Training utilizes 70% of the dataset, with the remaining 30% reserved for testing. Performance evaluation employs k-fold cross-validation with k = 10, reporting results as average values ± standard deviation. The model achieves 86.4% ± 0.07 accuracy for bradykinesia severity analysis and 90.9% ± 0.03 accuracy for tremor severity analysis.
6.4.2. Performance Metrics
The confusion matrices that are produced when the model is separately trained and tested for bradykinesia and tremor are shown in
Figure 8. The green box represents accurate forecasts, whereas the red boxes indicate the quantity of incorrect guesses. Every score is regarded as a distinct class. The algorithm’s performance metrics are presented for each class as sensitivity and specificity. As indicated in Equations (
4) and (
5), we used the mathematical method to determine the sensitivity and specificity. True positive rates are represented by TPR, false negative rates by FNR, true negative rates by TNR, and false positive rates by FPR. The overall produced results are elaborated in
Table 8. The cases where the error is large are because of the lower number of samples in that class.
7. Results and Discussion
The suggested web-based system serves as a solution for PD patients requiring continuous home assessment and monitoring, alongside accurate diagnosis and severity estimation. To achieve precise labeling and L-dopa dosage determination, accelerometer data from PwPD were utilized and collected using a Shimmer device under the auspices of the Michael J. Fox Foundation. The data description and the motor activities explanation are provided in
Section 6.2. The data are classified into two stages: the ON state, which occurs when patients take their medication on schedule, and the OFF state, which occurs when patients miss their medication and engage in activities. We removed the hand-crafted feature extraction and feature selection procedure from this proposed model in comparison to earlier research studies and systems. In lieu of that, the time-series data of the accelerometer are converted into scalograms through CWT, over-passing the hefty amount of work conducted prior to the classifier as it was performed in several research studies. The use and implementation of CWT for creating various levels of severity is explained in
Section 6.3 and some of the tremor and bradykinesia scalograms are shown in
Figure 6. For severity estimation, we employed the DL-based model, which is AlexNet transfer learning. The architecture and the work progress of the model are well explained in
Section 6.4.
The model undergoes separate training and testing phases for the analysis of tremor and bradykinesia severity scores. The AlexNet model demonstrates highly encouraging outcomes, achieving an accuracy of 86.4% for bradykinesia estimation and 90.9% for tremor, alongside commendable sensitivity and specificity across each scoring category, as detailed in
Table 8. The severity estimated on day 1 and day 4 for each subject is shown in the bar graphs
Figure 9. In
Figure 9b, it can be seen that there is a variation in all patients’ severity in the ON/OFF state. Mostly the severity level is increased. In cases when the severity is not increased or stays the same, there may be a variation in terms of consistency or frequency of tremors. However, if the level is decreased, this is a hint for clinicians to change the amount of Levodopa shot.
Figure 9b depicts patients’ bradykinesia scoring level. Mostly, there is no change in its level. Further clinicians can provide the best medical and neurological analysis considering the required medicine and treatment.
Table 9 displays the comprehensive findings and contrasts them with the current state-of-the-art. The table outlines the observed cardinal motor symptoms, the associated sensors, the ML or DL methods utilized for analysis, the evaluation metrics, and the recorded severities. In [
60], high classification performance was attained; however, this study was not effective at all severity levels. Similar to this, the research [
60,
61,
62] extracted a large number of features and carried out the feature selection stage, wherein a significant number of features could be missed. The study [
63] was the only one to use a CNN classification model and 2D image representation of inertial data; nonetheless, the accuracy was only 85%. Therefore, measuring tremors in addition to bradykinesia and all degrees or kinds of severities was not taken into account in the majority of the research. Furthermore, none of the prior studies examined TF mapping using the CWT method for classification, a novel approach that our research adopted. Our study yielded promising results, achieving an accuracy of 86.5% for bradykinesia and 90.9% for tremor classification.
8. Conclusions
This study presents an innovative approach through an eHealth platform designed to assess and monitor PwPD. A smart wristband that is always connected to the cloud is the centerpiece of this platform. The wrist of the upper limb that is most impacted is where the bracelet records motion data and transfers it via Wi-Fi to a cloud-based PaaS. Here, the data undergo automatic processing and analysis to determine the severity of tremor and bradykinesia in both ON and OFF states of patients, offering real-time feedback.
Furthermore, this study contributes to objective severity assessments, particularly following surgical interventions or rehabilitation exercises (physiotherapy). A key advantage of our smart-bracelet-based solution is its infrastructure, which optimally balances power consumption, network coverage, data transmission rate, and cost. This robust solution addresses the ongoing need for continuous and immediate data transmission from wearable sensors, ensuring effective monitoring of PD patients in both home and unfamiliar environments. This needs huge data storage, bandwidth, and data processing capability to run learning algorithms, all elements that a cloud-based approach has proven to fit best. Benefits can also be derived from any other healthcare system wherein the doctor can easily assess the medication’s impact on the patient’s symptoms and assist them in choosing different drug dosages.
9. Study Limitations and Future Directions
Our study confirms the wristband’s efficacy in monitoring PD symptoms under standard conditions. However, it is important to recognize that extreme environmental conditions—like significant temperature shifts, high humidity, and electromagnetic interference—can impact data accuracy. Preliminary testing under varied conditions has shown that while the device is highly accurate in moderate environments, extreme conditions may affect sensor sensitivity and data processing, leading to potential inaccuracies in symptom detection. Additionally, factors like intense physical activity and sweat could introduce noise, complicating the differentiation between PD symptoms and non-PD-related movements. One limitation of this study is that to increase the availability of data to be used in our experiments, we proceeded with the acquisition of initial data through our bracelet and the recorded signals were verified and compared to the available largest data set acquired using a Shimmer device. Once the coherence between the acquired data was verified, a large amount of data from Shimmer was also used to test our signal processing and DL proposed algorithm. In the future, the bracelet will be improved with more input inertial sensors like a gyroscope, magnetometer, and EMG sensor, and the data will be collected from PwPD using this bracelet. With more sensor diversity, the data are expected to give more validation in assessing the PD motor symptoms from hand movements. Also, edge/fog-based solutions, alternatives to those based on the cloud, will be taken into account to enhance the overall system performance. Future iterations of the device will also focus on enhancing its robustness against environmental extremes and reducing susceptibility to interference from external factors.


 ,
, 


