Article

Enhanced Crowd Dynamics Simulation with Deep Learning and Improved Social Force Model

Key Laboratory of Digital Performance and Simulation Technology, School of Computer Science, Beijing Institute of Technology, Beijing 100081, China
*
Author to whom correspondence should be addressed.
Electronics 2024, 13(5), 934; https://doi.org/10.3390/electronics13050934
Submission received: 30 December 2023 / Revised: 18 February 2024 / Accepted: 28 February 2024 / Published: 29 February 2024
(This article belongs to the Special Issue Multi-Agent Systems: Planning, Perception and Control)

Abstract

:
The traditional social force model (SFM) in crowd simulation experiences difficulty coping with the complexity of the crowd, limited by singular physical formulas and parameters. Recent attempts to combine deep learning with these models focus more on simulating specific states of crowds. This paper introduces an advanced deep social force model, influenced by crowd states. It utilizes deep neural networks to accurately fit crowd trajectory features, enhancing behavior simulation capabilities. Geometrical constraints within the model provide control over varied crowd behaviors, adjustable to simulate different crowd types. Before training, we use the SFM to refine behaviors in real trajectories with excessively small distances, aiming to enhance the general applicability of the model. Comparative experiments affirm the effectiveness of the model, showing comparable performance to both classic physical models and modern learning-based hybrid models in pedestrian simulations, with reduced collisions. In addition, the model has a certain ability to simulate crowds with high density and diverse behaviors.

1. Introduction

Crowd simulation, crucial in computer graphics and system modeling, plays a key role in applications that extensively use electronic systems and technologies. These include urban modeling [1,2], emergency evacuation planning [3,4,5,6,7], game design [8], and behavior analysis [9,10]. This paper introduces an innovative method for crowd simulation that integrates deep learning with the traditional social force model. The approach enhances the accuracy and interpretability of crowd simulation trajectories and enables the construction of simulations involving high-density crowds and various crowd behaviors, to some extent vital for applications in electronic systems that require realistic modeling of crowds.
Existing crowd simulation methods can generally be categorized into rule-based methods and data-driven methods. Rule-based methods are extensively applied across various crowd simulation tasks and rely heavily on empirical modeling. They often involve the use of expert knowledge or specific rules to construct crowd simulations. Many of these methods have achieved outstanding results in specific areas. For instance, the optimal reciprocal collision avoidance algorithm (ORCA) [11] excels in collision avoidance, and improved algorithms based on the classical social force model [12] have demonstrated remarkable performance in tasks such as high-density crowd simulation [13] and evacuation simulation [3,4]. However, human behavior is inherently complex, and representing the intricate dynamics of crowds solely through homogeneous rules or physical calculations can be challenging. Rule-based methods often rely on empirical knowledge and may require parameter tuning to achieve accurate simulations. With advancements in sensing technologies, acquiring crowd trajectory data has become more accessible, leading to the development of data-driven crowd simulation methods. Early approaches involved constructing simulations based on crowd databases [14,15]. However, these methods struggled to adapt to environments with complex interactions. Other methods utilized statistical learning [16,17] and optimization algorithms [18] to analyze crowd data and construct simulations. These methods, however, are limited by the data-fitting capabilities of their respective algorithms. In recent years, the evolution of deep learning techniques has led to a surge in research exploring deep learning-based crowd simulation methods. Some studies [5,6,10,19] applied deep reinforcement learning techniques to various crowd simulation tasks. Others [20,21,22] utilized a variety of deep learning methods to extract crowd trajectory features and build simulations by predicting crowd behaviors. However, subsequent work [23] indicated that directly predicting trajectories using deep learning for simulation may not generalize well to simulations longer than the training data. Amirian et al. [24] and Lin et al. [25] employed generative adversarial networks [26] to generate pedestrian simulation trajectories. While these deep learning methods have achieved impressive simulation results, their black-box nature often lacks interpretability. Some recent research has aimed to combine deep learning with rule-based methods to construct crowd simulations. Zhang et al. [27] and Li et al. [28] integrated deep learning with the ORCA algorithm [11] to enhance the realism of crowd simulations based on traditional algorithms. Zhang et al. [23] employed deep learning to construct network structures resembling the social force model for crowd simulation. However, these approaches still predominantly rely on neural network designs and struggle to simulate crowd behaviors beyond the training data distribution.
To address these challenges, we introduce a crowd simulation approach that combines deep learning techniques with traditional social force models. Our model leverages deep learning to capture intricate crowd behavior features, enhancing interpretability by incorporating behavior representation akin to the improved social force model for high-density autonomous crowds (HiDAC) [13] as an inductive bias into the physical structure model. By harnessing the strengths of both deep learning and the social force model, we aim to improve crowd simulation. During model training, we take a unique approach by not directly using real-world crowd data as input. Instead, we preprocess the data by filtering out instances of individuals that are too close to each other and expanding their distances using a method similar to SFM [12]. This preprocessing step enhances the generalization capabilities of the model. Learning from this modified real-world crowd data allows the model close resemblance of the features of real data when simulating pedestrian behavior. Additionally, we retain a portion of adjustable parameters in the structure of the model to endow it with similar capabilities to HiDAC [13] in simulating high-density crowds and diverse crowd behaviors.
The innovations and contributions of this paper can be summarized as follows:
  • Introduction of a generic multi-agent simulation model that combines deep learning techniques with the social force model, enabling the model to learn group behavior features from real data while applying constraints based on the social force model. In comparison to conventional social force model, our model yields superior simulation results across multiple evaluation metrics, without necessitating frequent parameter adjustments.
  • Preservation of critical parameters of the HiDAC model within the architecture of the model. Our approach enables the flexible simulation of high-density crowds and a variety of crowd behaviors through parameter adjustments, demonstrating that the integration of deep learning with traditional models for crowd simulation, guided by a meticulous design process, is a feasible method that effectively preserves the strengths of classical models.
  • Introduction of a novel training mechanism to enhance the generalization of crowd simulation. Instead of learning directly from natural crowd behavior data, the model benefits from training on modified natural crowd data, resulting in simulations characterized by reduced collision rates and more generalized crowd behaviors.

2. Related Work

2.1. Rule-Based Crowd Simulation Methods

Rule-based crowd simulation methods can be categorized into macroscopic models and microscopic models [29]. At the macroscopic level, crowd simulation algorithms emphasize group path planning or global control. They typically employ methods like the continuum model [30,31], the aggregate dynamics model [32], or potential field [33] to guide group movement. Conversely, at the microscopic level, the focus centers on individual agent characteristics and interactions among agents. Microscopic models involve the modeling of different behaviors of agents based on attributes such as an agent’s velocity [11,34], visual properties [35,36], or dynamic attributes [12,13] to establish rules for each agent, thus constructing the overall group simulation. For example, the SMF [12] interprets the motion of each agent as a result of the attraction of targets on agents, avoidance forces among agents, and repulsive interactions between agents and the environment. These methods abstract crowd motion into mathematical equations or deterministic systems, demonstrating excellent scalability and robustness. They are applicable to various tasks, including pedestrian simulation [7], high-density crowd simulation [13], and crowd evacuation simulation [3,4], among others. However, these homogeneous behavior models may not fully capture the complexity of crowd behavior, resulting in limitations in achieving realism. Our model enhances the classical SFM [12] and the HiDAC [13] model to improve the realism of simulating pedestrians in general scenarios while preserving scalability.

2.2. Application of Deep Learning Methods in Crowd Tasks

The rapid advancement of artificial intelligence technology has established deep learning as a vital tool for applications in crowd tasks. Extensive research in crowd trajectory prediction leverages various neural network architectures such as Multilayer Perceptron (MLP) [37], Long Short-Term Memory (LSTM) [38,39], Graph Neural Networks (GNN) [40], and Transformer [41,42,43,44] to extract crowd trajectory features. Several methods [37,39,44] adopt direct prediction for trajectory forecasting, while others focus on the stochastic nature of crowd behavior, employing Generative Adversarial Networks (GAN) [42,45] and Variational Auto-Encoders (VAE) [43] for multimodal prediction. These approaches indicate that deep learning-based crowd tasks necessitate fitting real crowd characteristics and modeling the uncertainty in Agent behavior. Furthermore, Yue et al. [46] achieve state-of-the-art results in recent trajectory prediction tasks by combining deep learning with the social force model, suggesting potential in other crowd tasks. In crowd simulation, Yao et al. [20] and Song et al. [22] construct simulations through predictive methods, while Amirian et al. [24] and Lin et al. [25] generate crowd trajectories using GANs. Despite their capability to build simulations, these methods face challenges with interpretability due to their pure network structures. To enhance interpretability, Zhang et al. [23] develop a network mimicking the social force model for simulating crowd trajectories, yet its design primarily remains network-centric, limiting broader application in crowd behavior simulation. Additionally, Yu et al. [47] control crowd behavior at two levels using a continuum model and neural networks, further demonstrating the effectiveness of integrating traditional methods with deep learning for crowd simulation. In this context, this study draws inspiration from previous ideas and improves upon the HiDAC [13] model as an inductive bias. Neural network models are employed to fit crowd data features and calculate critical parameters for the physical model component. This model retains the architecture of the physical model, allowing for the simulation of more diverse crowd behaviors through parameter adjustments while maintaining the realism of crowd simulations.

3. Method

This chapter outlines the methodology for simulating crowds using the model, where the position of agent i at time t is denoted as p i t = ( x i t , y i t ) , and its velocity as v i t = ( x i t ˙ , y i t ˙ ) . The combined set of position and velocity is represented as q i t = ( p i t , v i t ) , implying q i t R 4 . The observable trajectory set is defined as P i t = { p i 1 , p i 2 , . . . , p i t 1 , p i t } , and the corresponding velocity set as T i t = { q i 1 , q i 2 , . . . , q i t 1 , q i t } . The target location is represented by d i t . The set N i t encapsulates the position and velocity information of the surrounding agents perceived by agent i at time t, expressed as { q j t : j N i t } . The environmental information perceived by agent i at time t, including the locations of nearby obstacles, is denoted as E i t . Thus, the state of agent i at time t can be formulated as S i t = { d i t , T i t , N i t , E i t } . The model infers the future position of an agent based on its current state, described by the following equation:
p ^ i t + 1 = f ( S i t )
For each agent, the next position is computed, followed by an update to obtain the state of each agent as S i t + 1 . This iterative process constructs crowd simulation.
The model employs a hybrid architecture combining physical and deep learning models. This hybrid structure, anchored in a physical model, provides a strong inductive bias, ensuring the fundamental physical realism and intuitiveness of the simulation. Concurrently, the integration of a deep learning model enhances the data-driven nature of the model, enabling efficient extraction of key features from complex crowd behavior data. Its main structure is depicted in Figure 1. Drawing inspiration from the design of the HiDAC model [13], different methods are used to calculate the next position of agents involved in collisions (overlap with other agents or obstacles) and those not in collisions. For agents not involved in collisions or under special rules, their future positions are determined by a neural social force F i t , which is subsequently adjusted for gait randomness ϵ ^ using a conditional variational autoencoder (CVAE) [48] module. This neural social force is derived from three independent neural network modules that fit data features to key parameters of the social force model. Agents in a state of collision have their repulsive forces F ^ i t calculated by a repulsion force module to determine their future positions. Special rules, including StoppingRule and WaitingRule, are configured in accordance with the HiDAC model. Subsequent sections delve deeper into the calculation process and the model’s architecture; Section 3.1 presents the model’s physical structure, Section 3.2 outlines the neural network-related structures, and Section 3.3 describes the optimization strategies of the model.

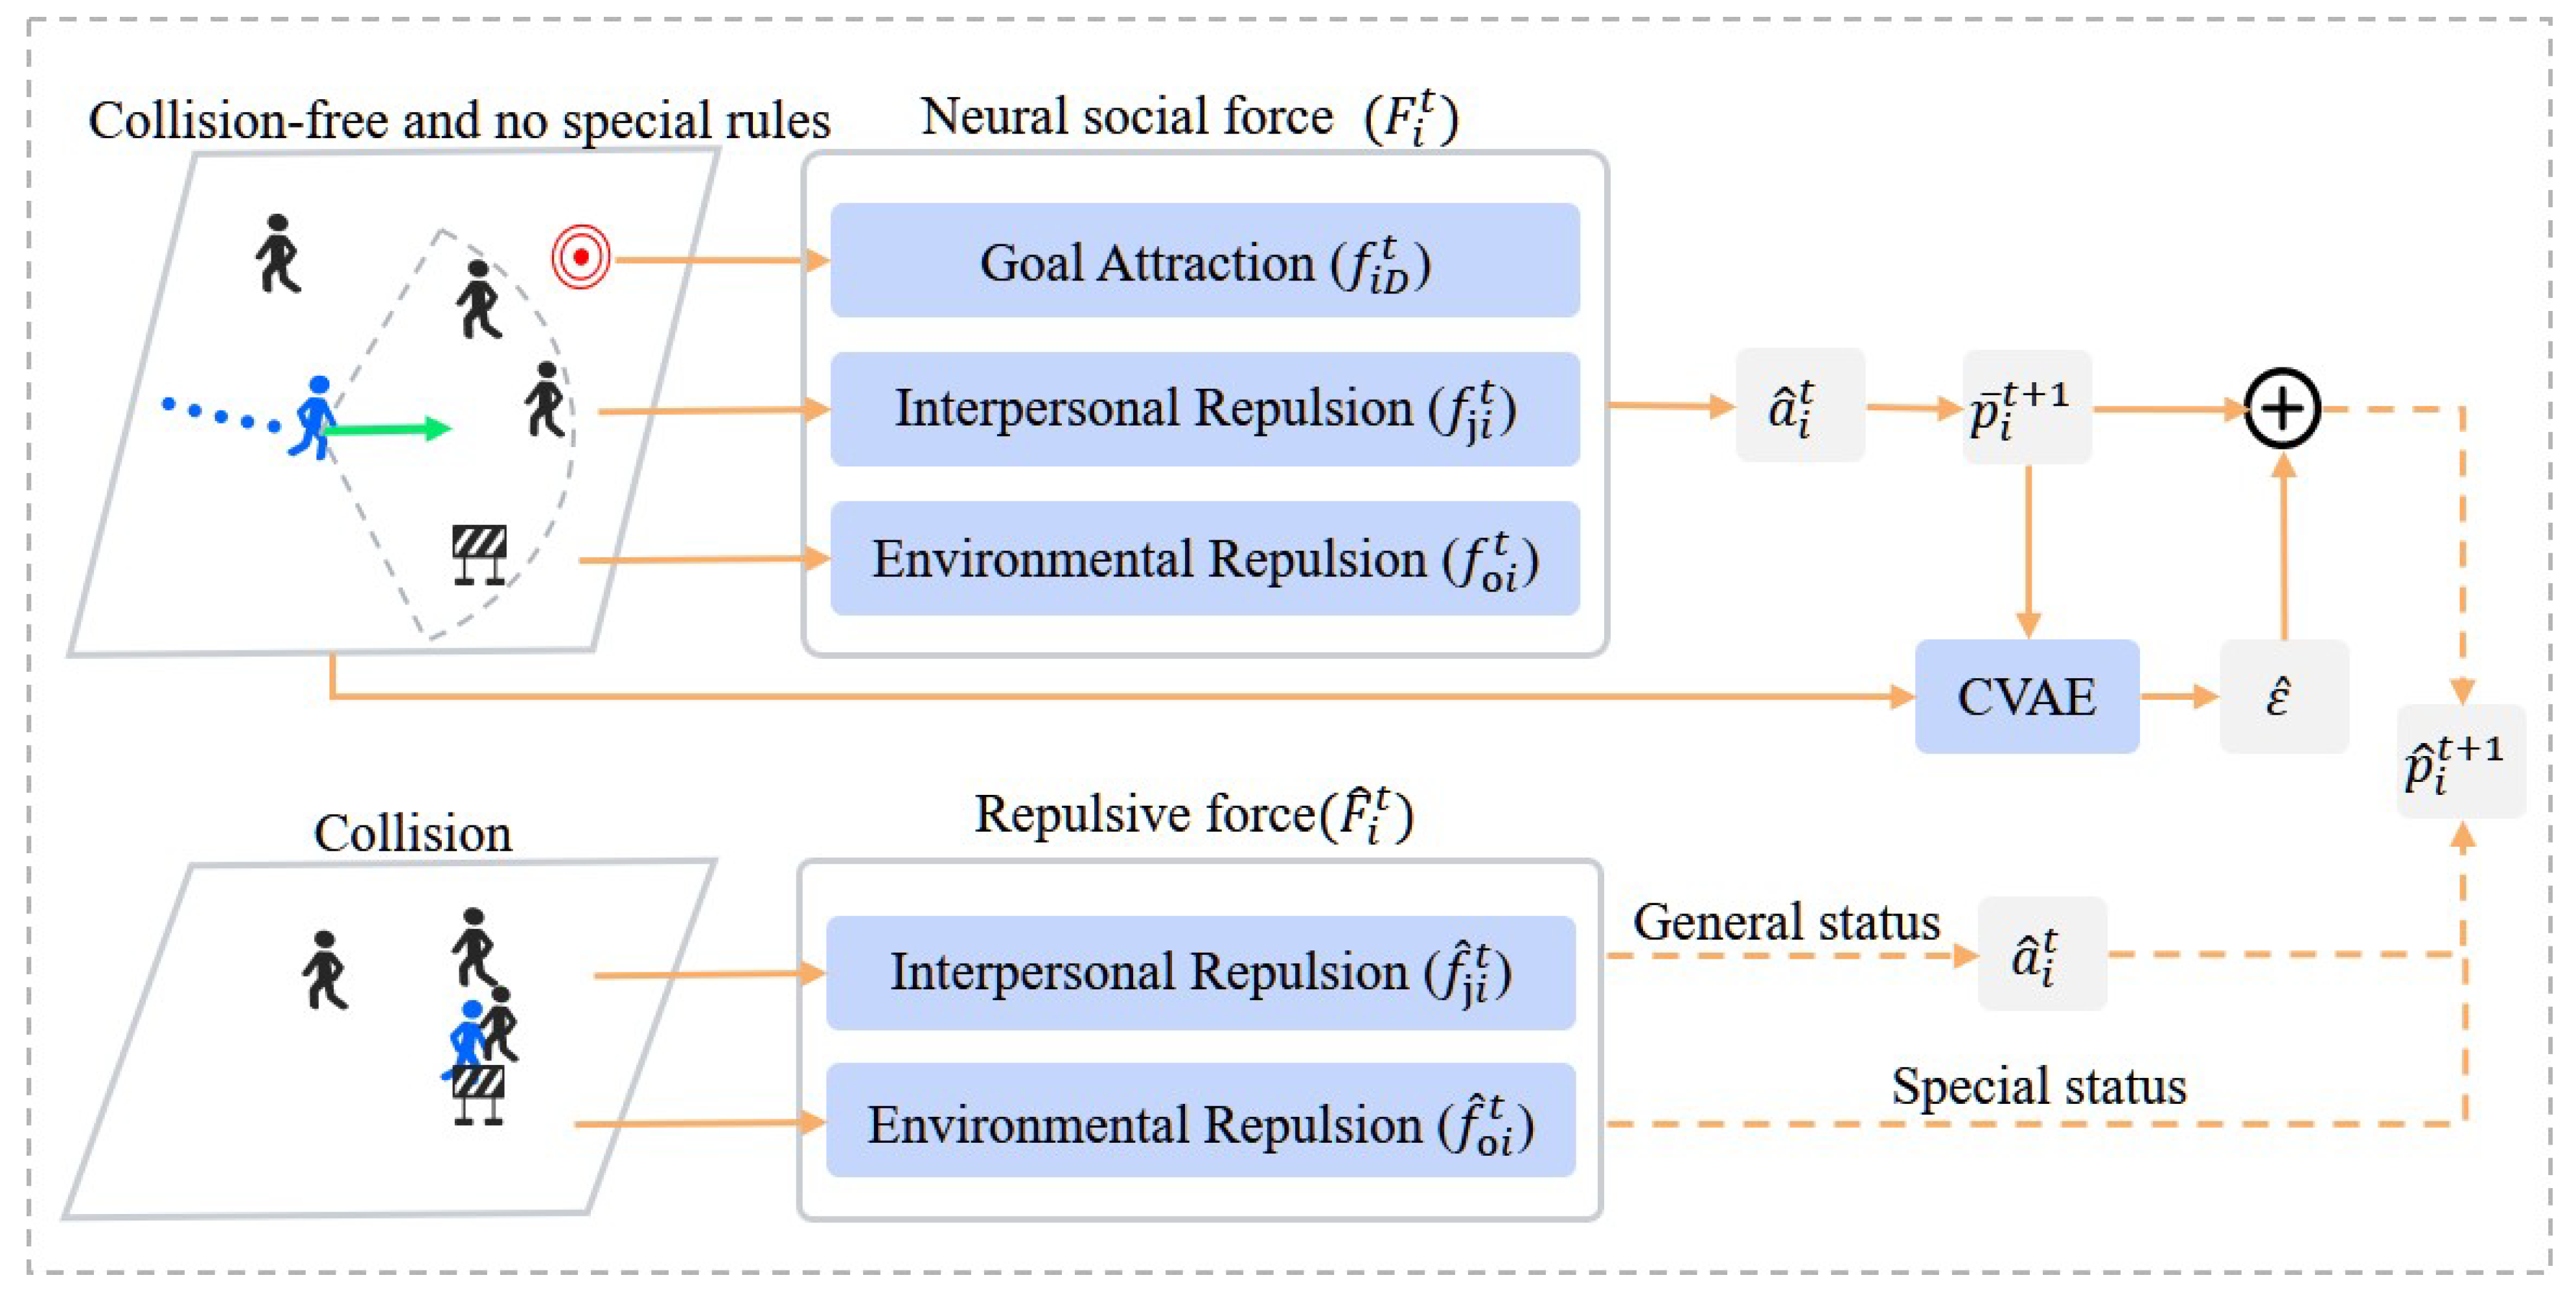
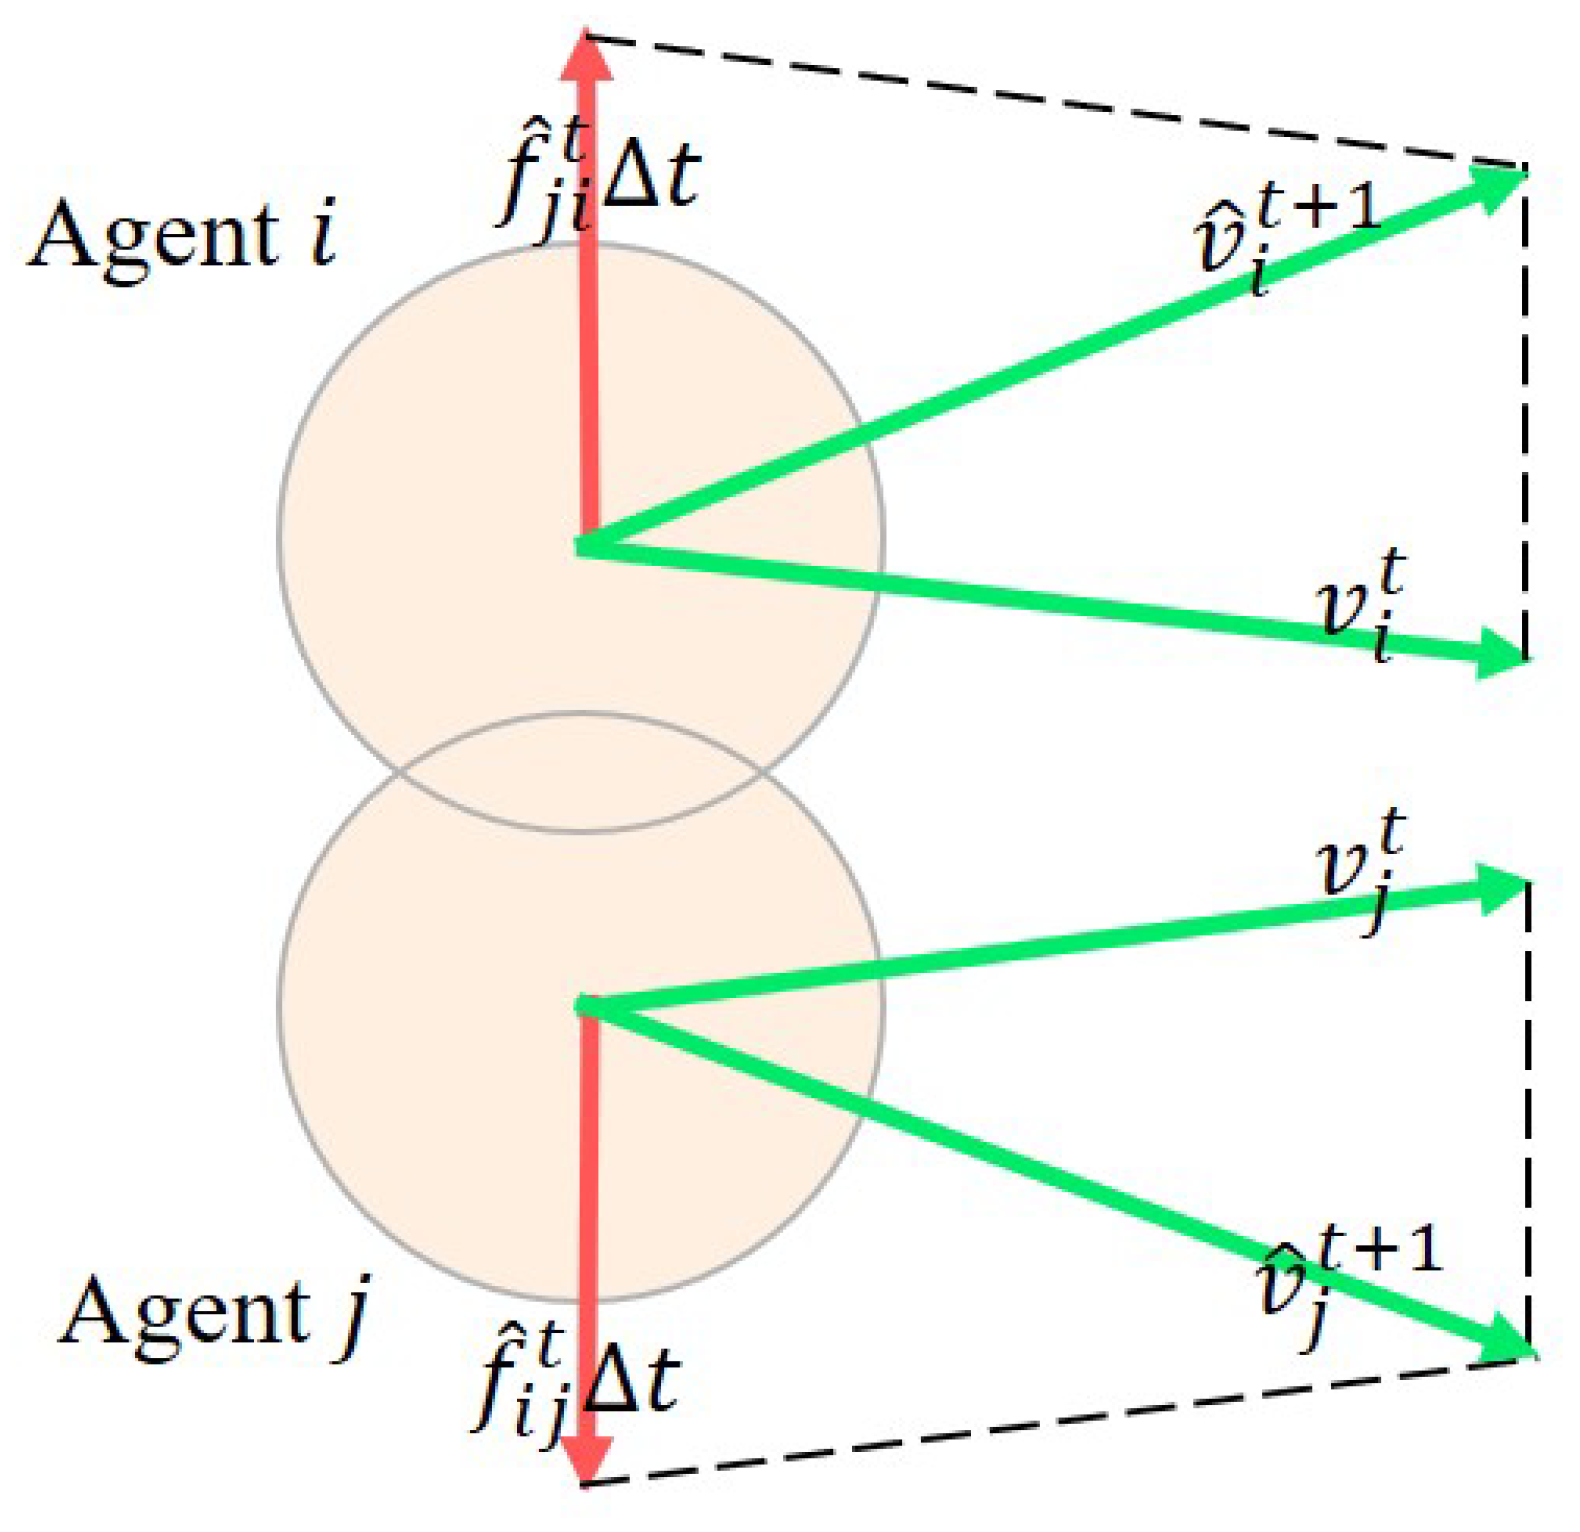
3.1. Physical Structure

The physical architecture of the model is an enhancement of the HiDAC model [13], itself an advancement of the traditional SFM. Building upon SFM, the HiDAC model introduces capabilities for simulating high-density crowds and diverse crowd behaviors, thus offering a solid physical basis for interactions among agents and between agents and their environment. The physical structure of the model is formulated as follows:
a ^ i t = α i t F i t + β i t F ^ i t
In conventional mechanics models, the force is generally the product of mass and acceleration (i.e., F = m a ). This model assumes a uniform mass for all agents and omits the mass factor in the formula, a decision made to facilitate relative scaling of the force. Coefficients α i t and β i t are employed to control the calculation of the force, and their values are defined as follows:
α i t = 0 Collision or StoppingRule or WaitingRule 1 Otherwise β i t = 1 Collision 0 Otherwise
When agent i is in a collision state at time t, the model employs F ^ i t as the force acting on the agent. Conversely, in non-collision and non-specific rule states, F i t serves as the force. StoppingRule and WaitingRule are utilized to simulate diverse crowd behaviors.
Neural social force F i t represents the social force exerted on agent i at time t, which can be further decomposed, as follows, in the formula:
F i t = f i D t + j i , j N i t f j i t + o E i t f o i t , f i D t = n i D t v i d v i t τ , f j i t = λ 1 e d j i t / λ 2 n j i t , f o i t = λ 3 e d o i t / λ 4 n o i t
f i D t represents the target attraction force for agent i at time t, indicating the force directing the agent towards its target position. Unit vector n i D t points from the agent’s current position towards the target. The desired velocity is denoted as v i d , and τ is a tuning parameter controlling the rate at which the agent reaches this desired velocity. Force f j i t denotes the repulsive force between agents at time t, occurring when other agents approach agent i, generating a force to prevent collisions. The distance from agent j to agent i is represented by d j i t , and n j i t is the unit vector from agent j to agent i. Model parameters λ 1 and λ 2 , respectively, regulate the intensity and range of the repulsive force. For environmental obstacles, the model discretizes them into points with similar spacing, allowing the calculation of repulsive forces between agents and obstacles in a manner analogous to inter-agent forces. Force f o i t represents the repulsion between an agent and environmental elements (e.g., obstacles), with n o i t being the unit vector from an obstacle to an agent. Parameters λ 3 and λ 4 control environmental repulsion. These parameters, including τ , λ 1 , λ 2 , λ 3 , and λ 4 , are computed through neural networks, as discussed in the following section. This model, based on a hybrid structural design, can bring a certain level of interpretability to the behavior of simulated crowds. As previously mentioned, force F i t is directly considered as predicted acceleration a ^ i t . The next velocity and position of an agent are then calculated according to the following equation:
v ^ i t + 1 = v i t + Δ t · a ^ i t , p ¯ i t + 1 = p i t + Δ t · v ^ i t + 1 , p ^ i t + 1 = p ¯ i t + 1 + ϵ ^
In calculating future positions, the model does not directly use the results from the neural social force. Instead, it incorporates crowd gait randomness ϵ ^ , constructed using a CVAE model, following the approach suggested in [46]. This addition aids in simulating randomness in crowd behavior.
The collision repulsive force F ^ i t adapts to physical behaviors post collision, serving as the dominant force when an agent encounters a collision. This approach is a significant enhancement to traditional physical laws within the model, ensuring more accurate simulations of agent interactions in high-density crowd scenarios. The model assumes each agent as a circle with a radius of 0.2 m. A collision is considered to have occurred if the distance between two agents’ coordinates is less than 0.4 m. Similarly, obstacles are modeled as circles with a radius of 0.1 m, with a collision deemed to have occurred if the distance between an agent and an obstacle is less than 0.3 m. The specific implementation formula for F ^ i t is as follows:
F ^ i t = j i , j N ^ i t f ^ j i t + λ o E ^ i t f o i t ^ , f ^ j i t = ( p i t p j t ) ( 0.4 + ϵ 1 d j i t ) / d j i t , f ^ o i t = ( p i t p o t ) ( 0.3 + ϵ 2 d o i t ) / d o i t
f ^ j i t and f ^ o i t represent the repulsive forces exerted on an agent by other agents and obstacles, respectively, during collisions. Sets N ^ i t and E ^ i t consist of agents and obstacles involved in collisions with agent i. Parameters ϵ 1 and ϵ 2 denote the personal space thresholds of an agent towards other agents and obstacles. The position of obstacle o at time t is given by p o t , and the distance between obstacle o and agent i is d o i t . Following the configuration in HiDAC [13], when collisions occur simultaneously between agents and between an agent and an obstacle, λ is set to 0.3 to prioritize preventing overlap with obstacles. This prioritization is crucial for maintaining realistic simulations of crowd dynamics, as it reflects the natural tendency of individuals to avoid physical obstacles that pose a more immediate risk to their safety. Unlike the method in HiDAC [13] where F ^ i t directly affects positional changes, this model calculates it as acceleration impacting velocity changes in general scenarios. However, in several specific cases, we directly apply the force to positional changes. If an agent collides with an obstacle twice in succession, the model follows the method in HiDAC, applying the force directly to positional changes to prevent the agent from passing through walls. When StoppingRule or WaitingRule are enabled, the force is also directly applied to positional changes to ensure the effectiveness of these rules. Figure 2 illustrates an example of velocity change post collision between agents in general scenarios. When collision occurs, the next position moves towards resolving the collision, also considering the current velocity of the agent. This approach, factoring in the current dynamics agents, results in a smoother and more natural transition process. All parameters used in F ^ i t are manually adjusted rather than derived through deep learning, mainly because collision behaviors are less frequent compared to normal movement behaviors in crowd data. Moreover, the outcomes calculated from collision repulsive force F ^ i t do not incorporate randomness ϵ ^ , preventing the induction of more intense collisions.

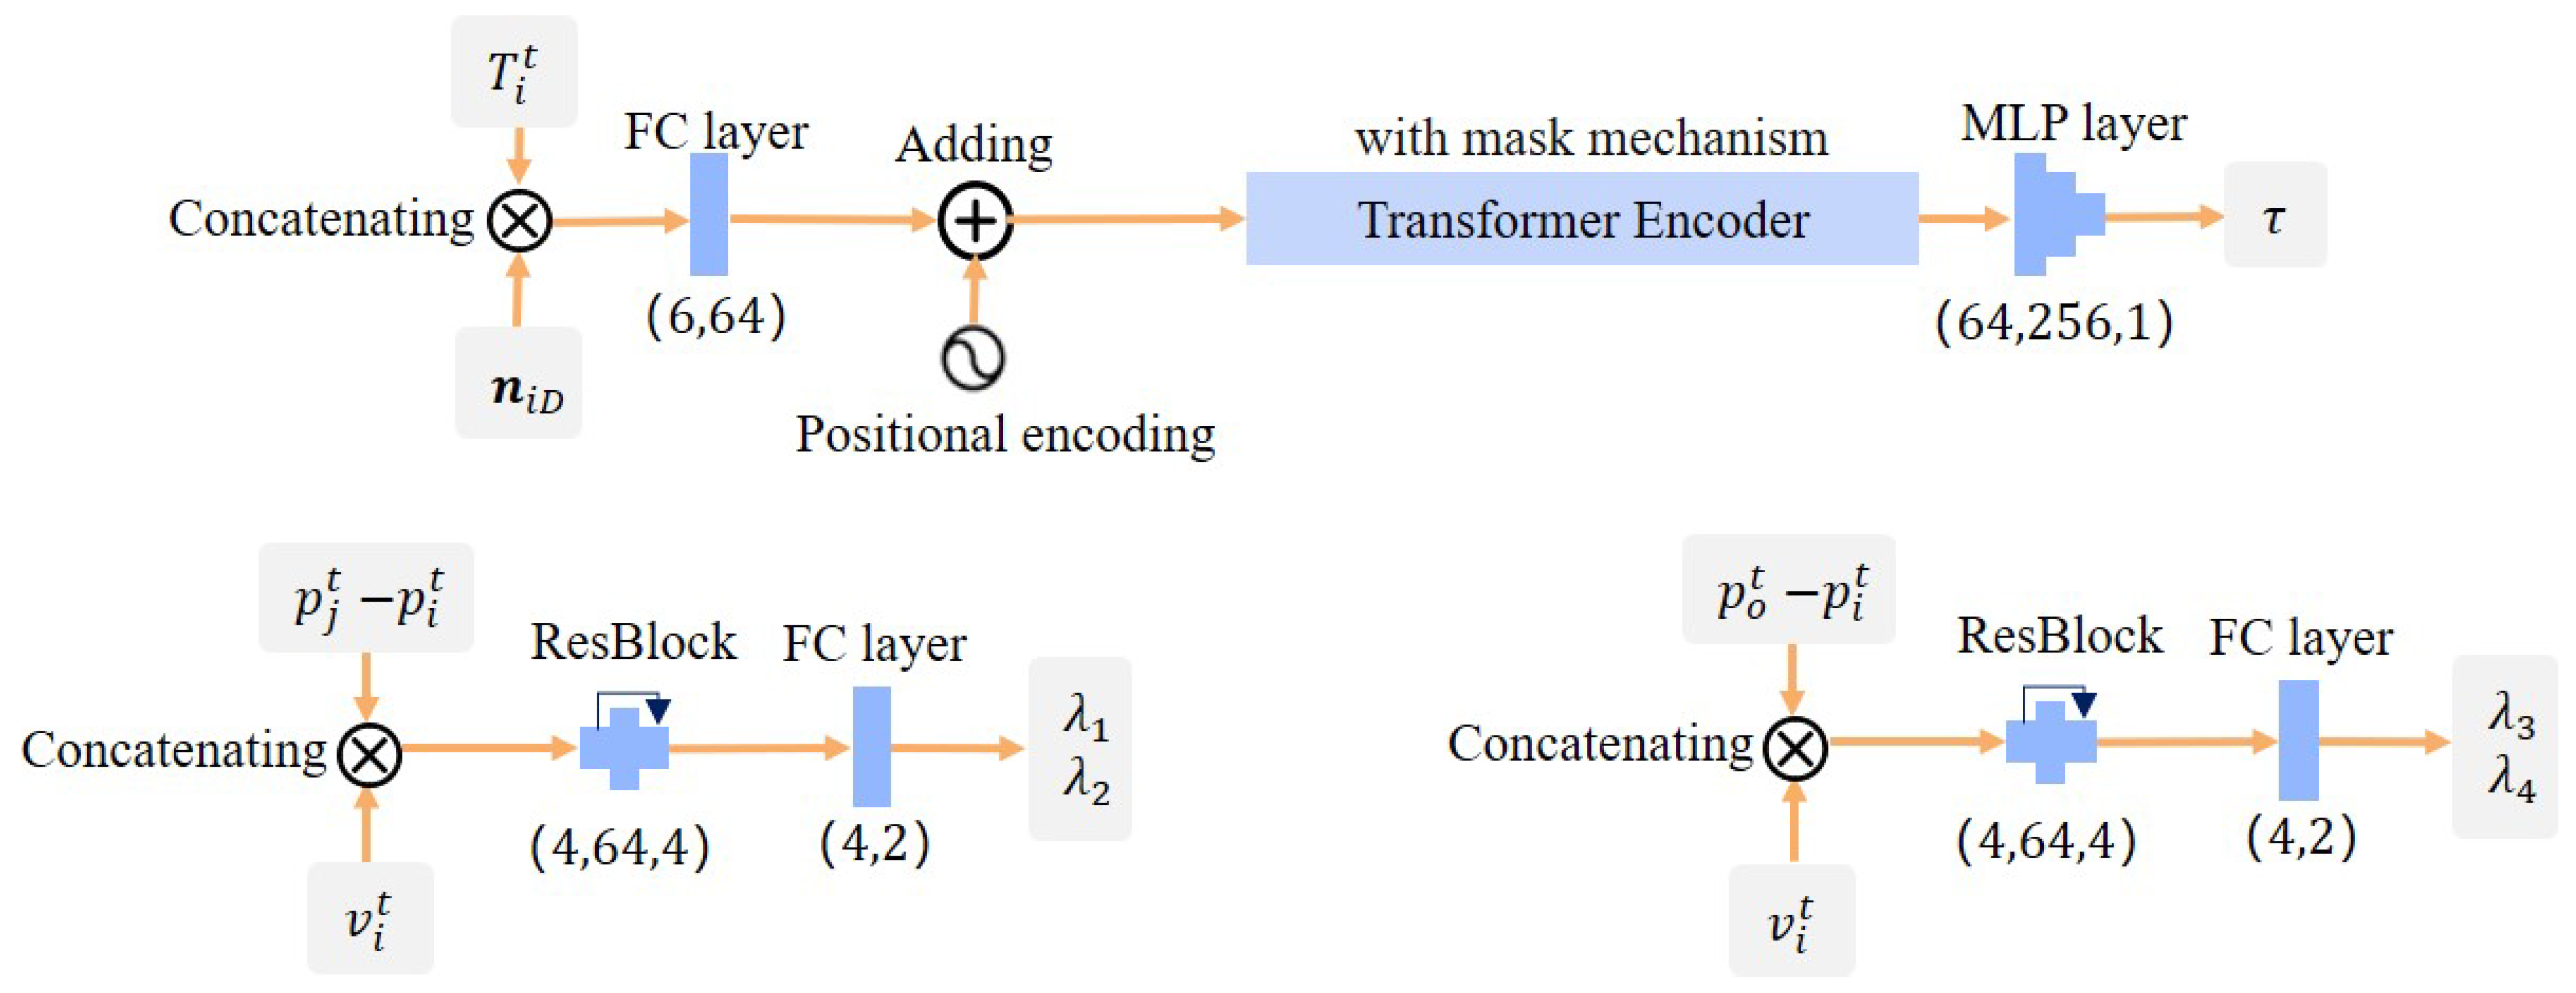
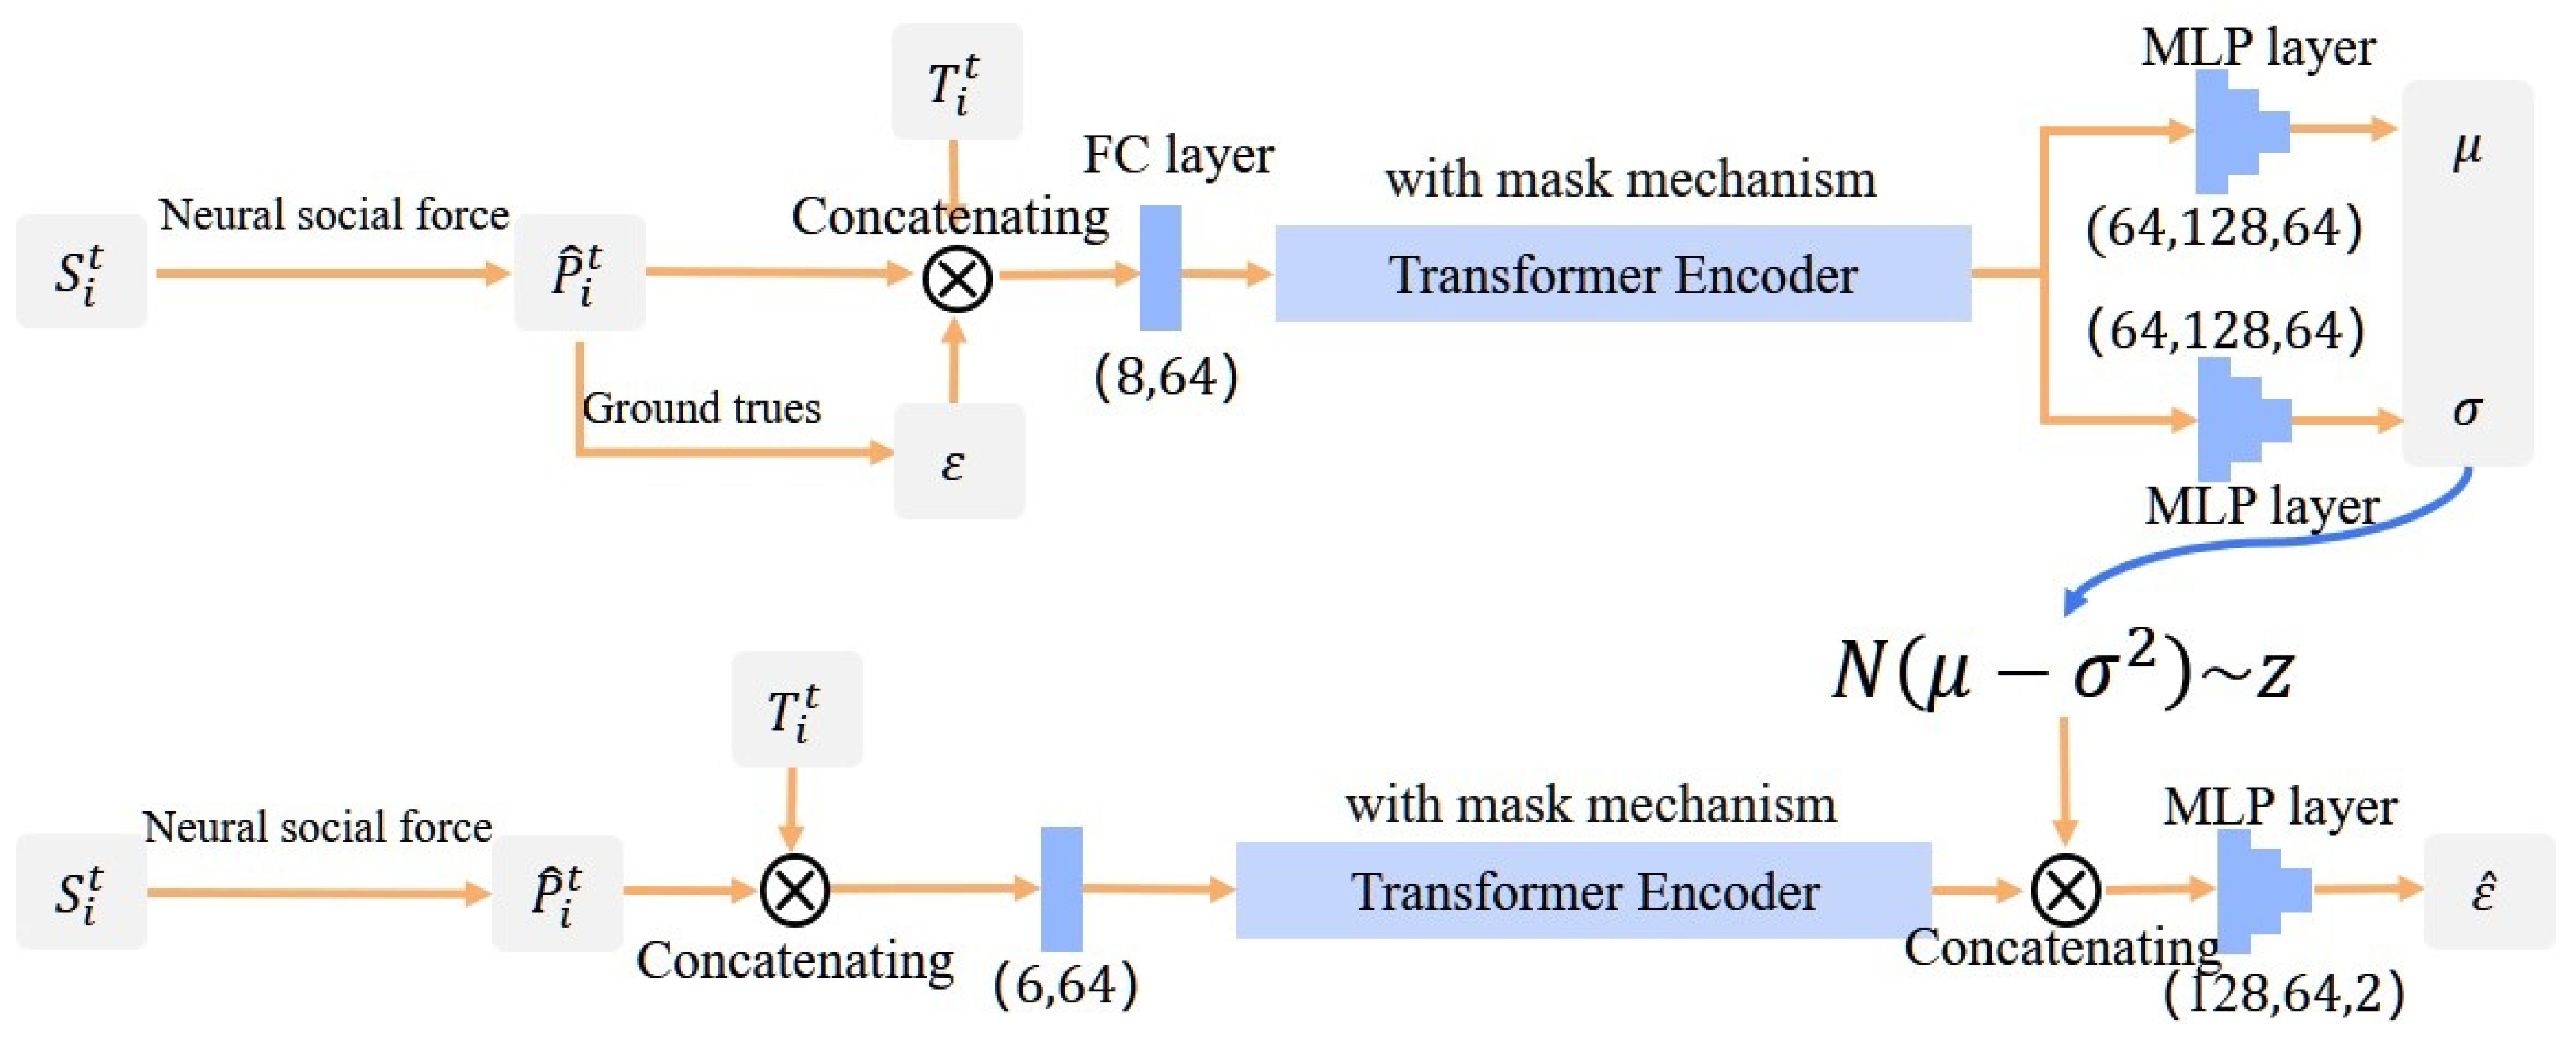
3.2. Neural Network Structure

In our model, some key parameters are derived from data features using neural network models. To effectively extract these features and compute the corresponding parameters, the design incorporates three distinct networks: target The Network D, interaction Network C, and obstacle Network O. After training with real crowd trajectory data, these networks estimate parameters in neural social force F i t based on the state of the crowd. The basic structure of these networks is illustrated in Figure 3.
Network D focuses on estimating parameters related to target attraction force τ in the social force model. It determines the most suitable value of τ by analyzing the target direction and current state of the agent, ensuring that the agent moves towards its desired direction at appropriate speed. Specifically, Network D first concatenates historical trajectory T i t with unit direction vectors n i D pointing towards the target position at each moment, forming a 6-dimensional input vector. This vector is then mapped to a 64-dimensional space through a fully connected layer (FC), followed by the addition of position encoding and subsequent input into a transformer [49] encoder module. Within this module, a masking mechanism is employed so that the aggregated features at each position relate only to previous trajectories. After this series of processes, the data are mapped through an MLP with a sigmoid activation function at its end, ensuring output values range between 0 and 1. The final output is adjusted (increased by 0.4) to determine the range of τ . The number of predicted τ values corresponds to the length of the trajectory sequence, with each moment’s τ value influenced only by prior trajectories due to the masking mechanism. This intricate design enables Network D to effectively adapt to various agent states and provide accurate parameters for target attraction force.
Network C is responsible for calculating parameters related to the repulsive force between agents. Given that people typically focus on others within a specific field of view ahead while walking, Network C concentrates on analyzing other agents within the perceptual area of the agent. A sector area spanning 75° to either side of the current velocity direction and within two meters is designated as the perception zone of the agent, a rule also applicable to obstacles. The network initially computes relative position vectors p j t p i t between agent i and other agents j within its perception zone. These data, concatenated with the velocity information into a 4-dimensional vector, are then processed through a residual block (ResBlock) to extract features. The process concludes with mapping through an FC layer with a sigmoid activation function to a 2-dimensional vector, yielding values between 0 and 1. These values determine parameters λ 1 and λ 2 . Network O, structurally similar to Network C, focuses on analyzing interactions between agents and environmental elements, particularly obstacles. The final output calculates repulsive force parameters λ 3 and λ 4 between agents and obstacles. Furthermore, predicted values of λ 1 and λ 3 less than 0.1 are set to 0.1 to ensure the force does not diminish due to excessively small values, thereby enhancing the lower bound of simulation effectiveness. The design of Networks C and O effectively leverages deep learning capabilities to capture complex dynamics between agents and between the agents and their environment while ensuring the validity and interpretability of the model’s output parameters. In this manner, the model accurately simulates complex crowd dynamics, especially agent behaviors in intricate environments.
Additionally, in line with the workflow shown in Figure 1, the model uses the neural social force to compute initial positions and then employs the CVAE module to introduce gait randomness. Figure 4 details the CVAE’s structure. Based on the crowd prediction results from the social force component and the crowd state, it adjusts the final crowd positions. The encoder part extracts features from the given conditional data to generate a latent space representation of the predicted trajectory error and future trajectory. The encoder initially fuses the neural social force model’s predicted trajectory positions P ^ i t = { p ^ i 2 , p ^ i 3 , . . . , p ^ i t , p ^ i t + 1 } , trajectory error ϵ , and T i t into an 8-dimensional vector. This vector is then mapped to a 64-dimensional feature vector through an FC layer, followed by sequence feature extraction using a transformer encoder with a masking mechanism. This feature implicitly considers the environment and other agents. It is finally mapped to μ and σ through two separate MLP layers. The decoder part is responsible for reconstructing reasonable and random trajectory errors from the encoded latent space. It has a structure similar to that of the encoder, merging past trajectory positions of the agent, velocity information, and predicted trajectory positions into a 6-dimensional vector. This vector is then mapped to a 64-dimensional feature vector by an FC layer. Following feature extraction of the trajectory by the transformer, it is concatenated with a sample from a normal distribution and then mapped to the trajectory error by an MLP layer with a Tanh activation function. This design effectively enables the model to simulate realistic and dynamic crowd movements, incorporating both deterministic and stochastic elements of pedestrian behavior.

3.3. Model Optimization Strategy

For model training, fixed-length trajectory data of multiple simultaneously present agents are sampled, with predictions of relevant parameters at each moment of the trajectory sequence. A two-stage model training strategy is adopted, employing loss function minimization for optimization. This process involves separate training for the Neural Social Force model and the CVAE model. For Networks D, C, and O, an L 2 loss function is used for optimization. The formula of the loss function is as follows:
L 2 = 1 n t i = 1 n j = 2 t | | p ^ i j p i j | | 2
For the sampled number of agents n and trajectory sequence length t, predictions focus on the next position at each moment. Therefore, in loss calculation, j starts from 2. The CVAE employs a combined loss comprising L 2 loss and KL divergence. The formula for its loss function is as follows:
L C V A E = L r e c o n + L K L L r e c o n = 1 n t i = 1 n j = 2 t | | ϵ ^ i j ϵ i j | | 2 L K L = 1 2 ( 1 + log ( σ 2 ) μ 2 σ 2 )

4. Experiments

Two publicly available large-scale crowd datasets, the ETH BIWI Walking Pedestrians Dataset (ETH) [50] and the University of Cyprus Dataset (UCY) [14], are used to train the model. The ETH dataset contains pedestrian data from two scenarios, ETH and Hotel, while the UCY dataset includes pedestrian data from three scenarios, Univ, Zara1, and Zara2. These datasets encompass pedestrian trajectories within complex real-world environments, featuring thousands of nonlinear paths from over 1500 individuals across four distinct settings. These datasets consist of pedestrian trajectories sampled at 2.5 Hz, featuring diverse crowd sizes, data distributions, and rich social behaviors. Prior to initiating the model training process, the training datasets undergo a review to identify and address any collision events present. For detected collisions, the SFM is applied to adjust these trajectories to create collision-free paths. This preprocessing not only aids the model in more effectively generating collision-free trajectories, but also, given the rarity of collision events in real crowds, necessitates adjustments for only a small portion of the data. The training involves 100 epochs each for both the Neural Social Force model and the CVAE model. During model training, we train on sequences of 8 consecutive trajectory positions of agents present in the same scene. The initial learning rate is set to 0.0005, with a decay factor of 0.8 applied every 10 epochs. The depth of the Transformer module is configured to 2, and the number of attention heads is set to 4.

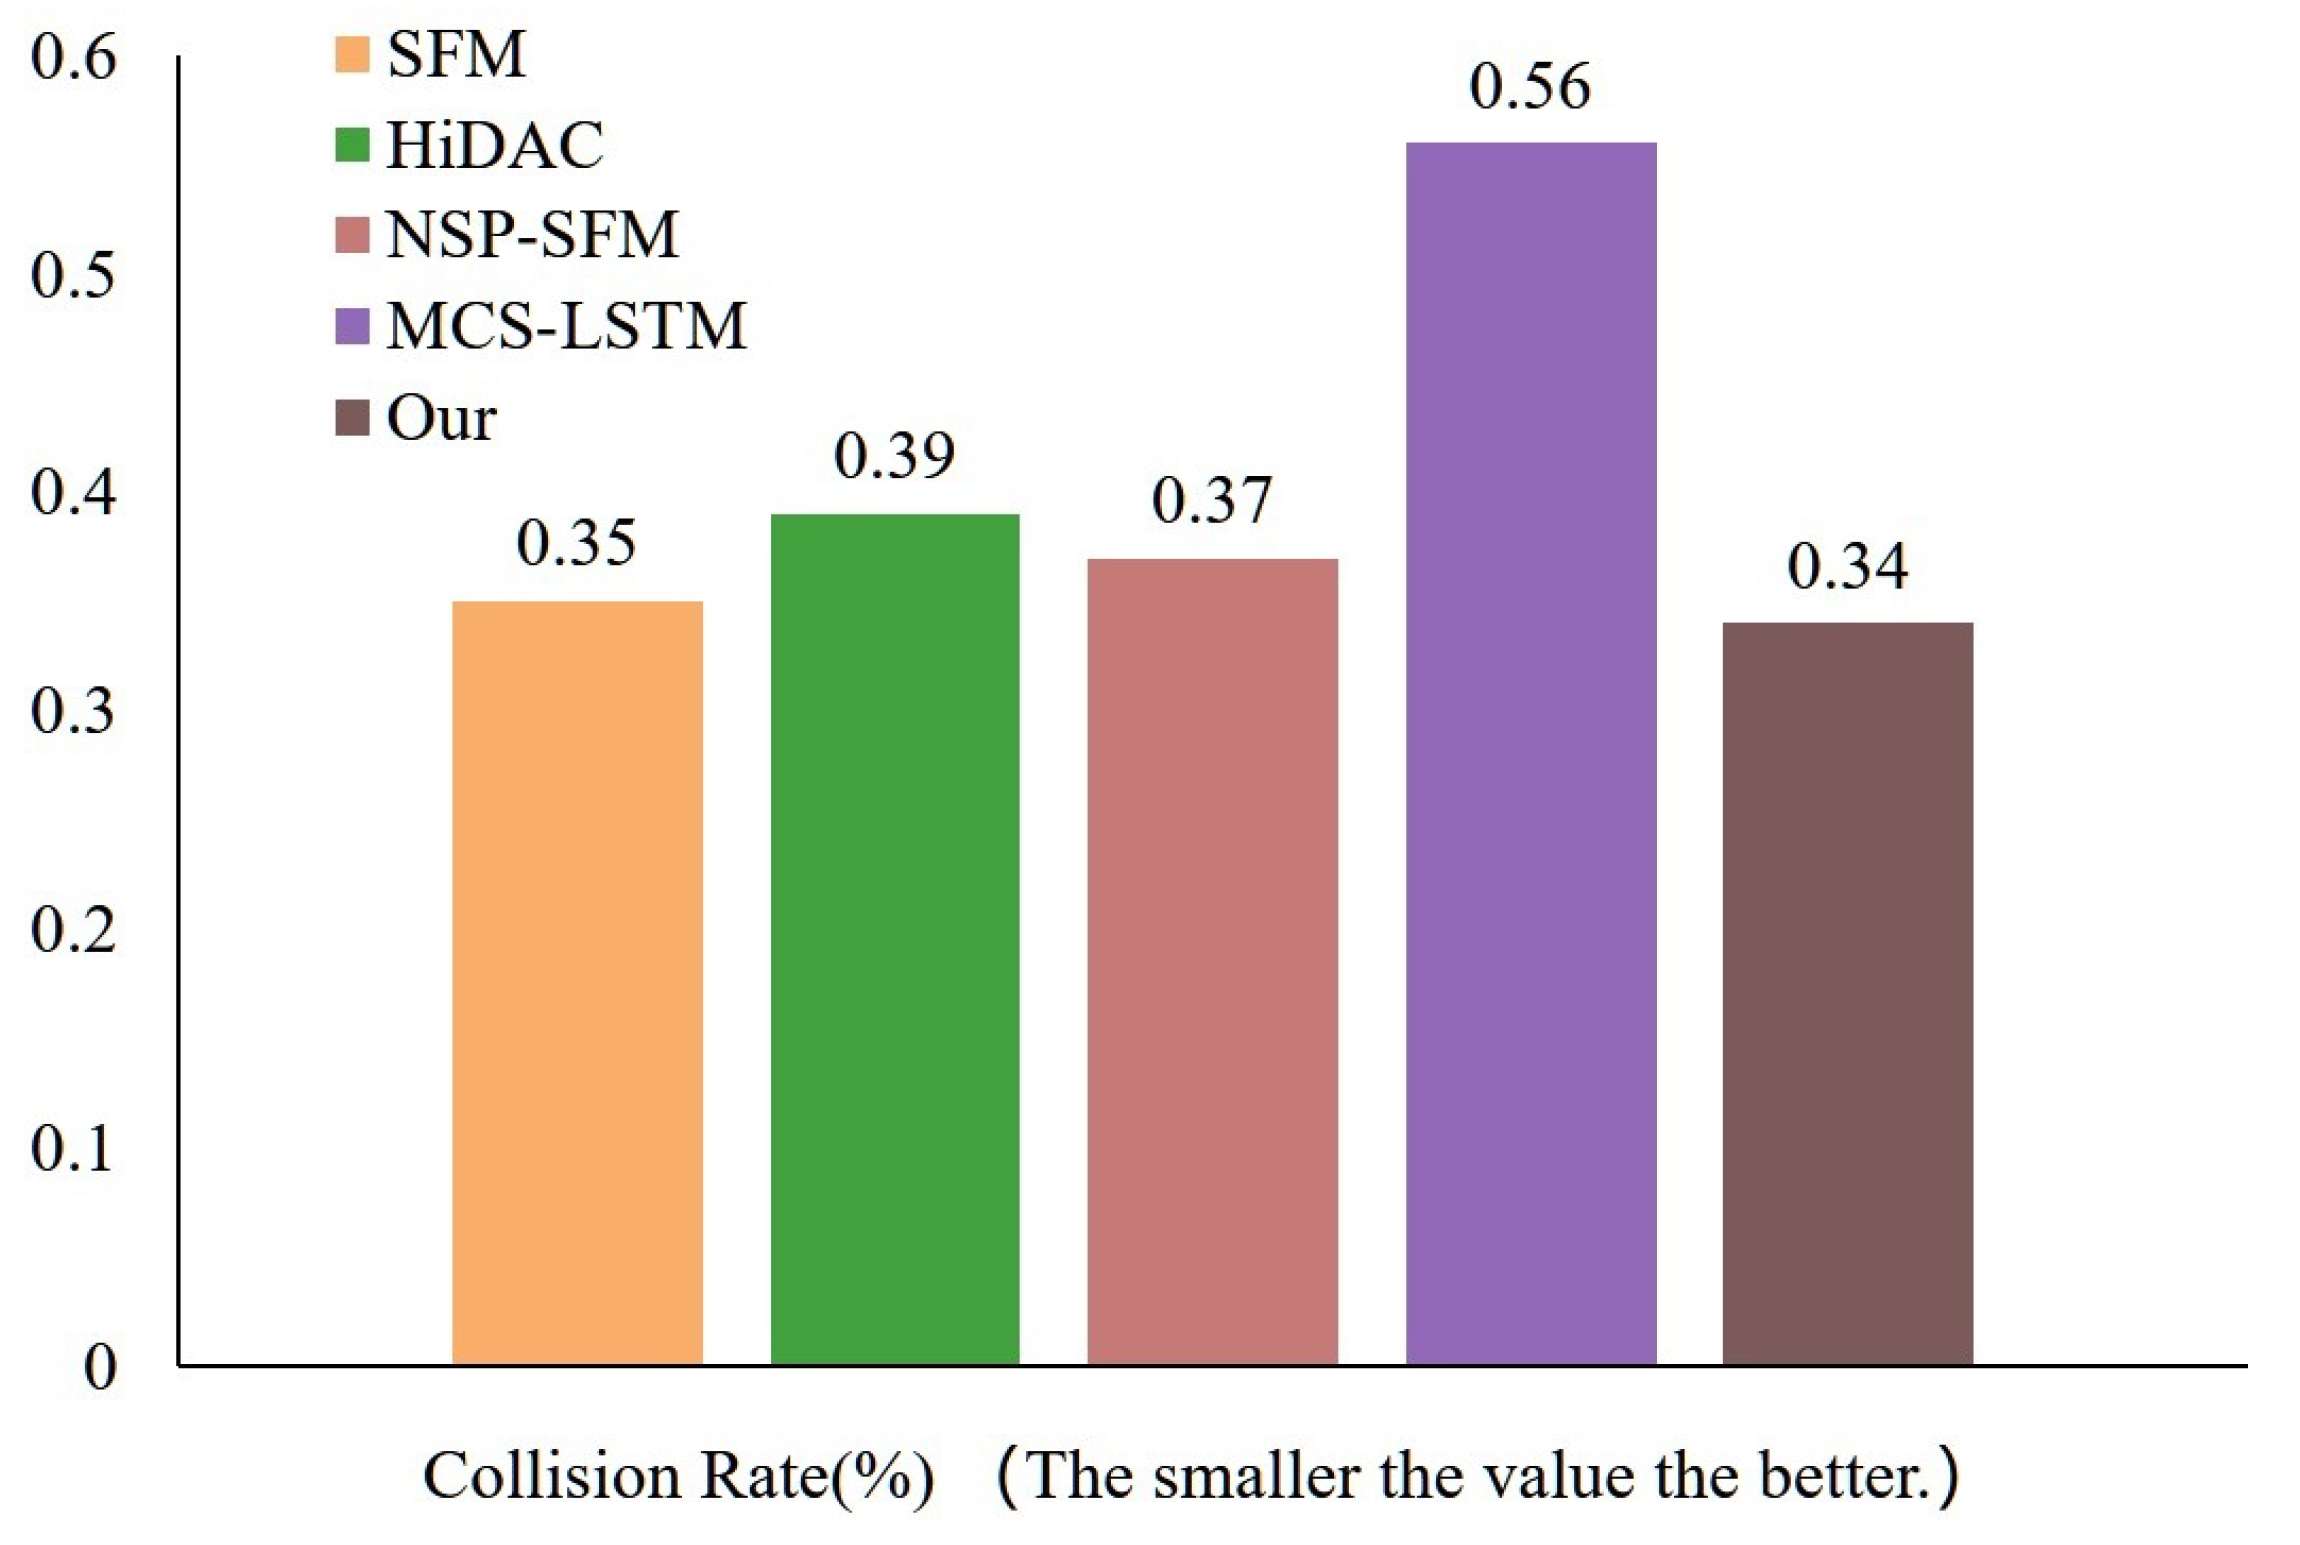
4.1. Performance Analysis

In the experiments, trajectories from the ETH and UCY datasets are merged, utilizing their diverse data distributions to enhance model performance. During training, trajectories from each dataset are time segmented, with 50% of the data used for training, 25% for validation, and 25% for testing. Once trained, the model constructs crowd simulations based on the initial states and target locations from the test data. For simulation construction, the same number of agents as in the real data is used, starting with the first two positions of the actual pedestrians and aiming for their final target positions. The iterative generation of simulation trajectories continues until the simulated trajectories match the length of the real trajectories. Due to the randomness in pedestrian movement, 20 different outcomes are generated each time, with the scenario having the fewest collisions selected as the simulation result. The model is evaluated using the same assessment metrics as in [47], comparing the statistical results of simulated crowd velocity and minimum distance (distance to the nearest agent) with the distribution in the real data. Comparative evaluation encompasses classic pure physical models such as SFM [12] and HiDAC [13], as well as the hybrid NSP-SFM model [46], which integrates neural network and physical elements to achieve state-of-the-art efficacy in trajectory prediction and is applicable for simulation development. The model is also benchmarked against the advanced multi-level crowd simulation social LSTM (MCS-LSTM) [47], a paradigm that synergizes conventional techniques with data-driven approaches. For SFM and HiDAC models, we base our simulations on the average velocity of agents within the dataset as their desired speed. Key parameters τ , λ 1 , λ 2 , λ 3 and λ 4 are fixed at values derived from the mean outputs across all real data by our neural social force model. For NSP-SFM and MCS-LSTM models, we adhere to their officially recommended settings. The results of distribution comparison are shown in Figure 5.
It can be observed from the distribution diagram that the simulation results of the data-driven model have distribution that is closer to the real data. For quantitative assessment, differences in distribution are measured using root mean square error (RMSE) and further calculated as a score. These data represent the dynamics and density of the crowd, and the calculation formula is as follows:
R M S E = 1 n i = 1 n ( X i X ^ i ) 2 S c o r e = 1 1 + R M S E
Table 1 presents the experimental results. Our model achieves optimal results in two metrics, reflecting its effectiveness in capturing the complexities of crowd behavior. Its exceptional performance in dynamics and density metrics indicates that the model not only accurately simulates individual movement patterns within crowds, but also effectively replicates the overall structure and flow of the crowd.
Additionally, collision rate serves as an evaluative metric, calculated by expressing the percentage of agent positions involved in collisions against the total movement positions of all agents. This further validates the results generated by the model. Figure 6 shows the results. Our model shows better performance in collision avoidance during crowd simulation.

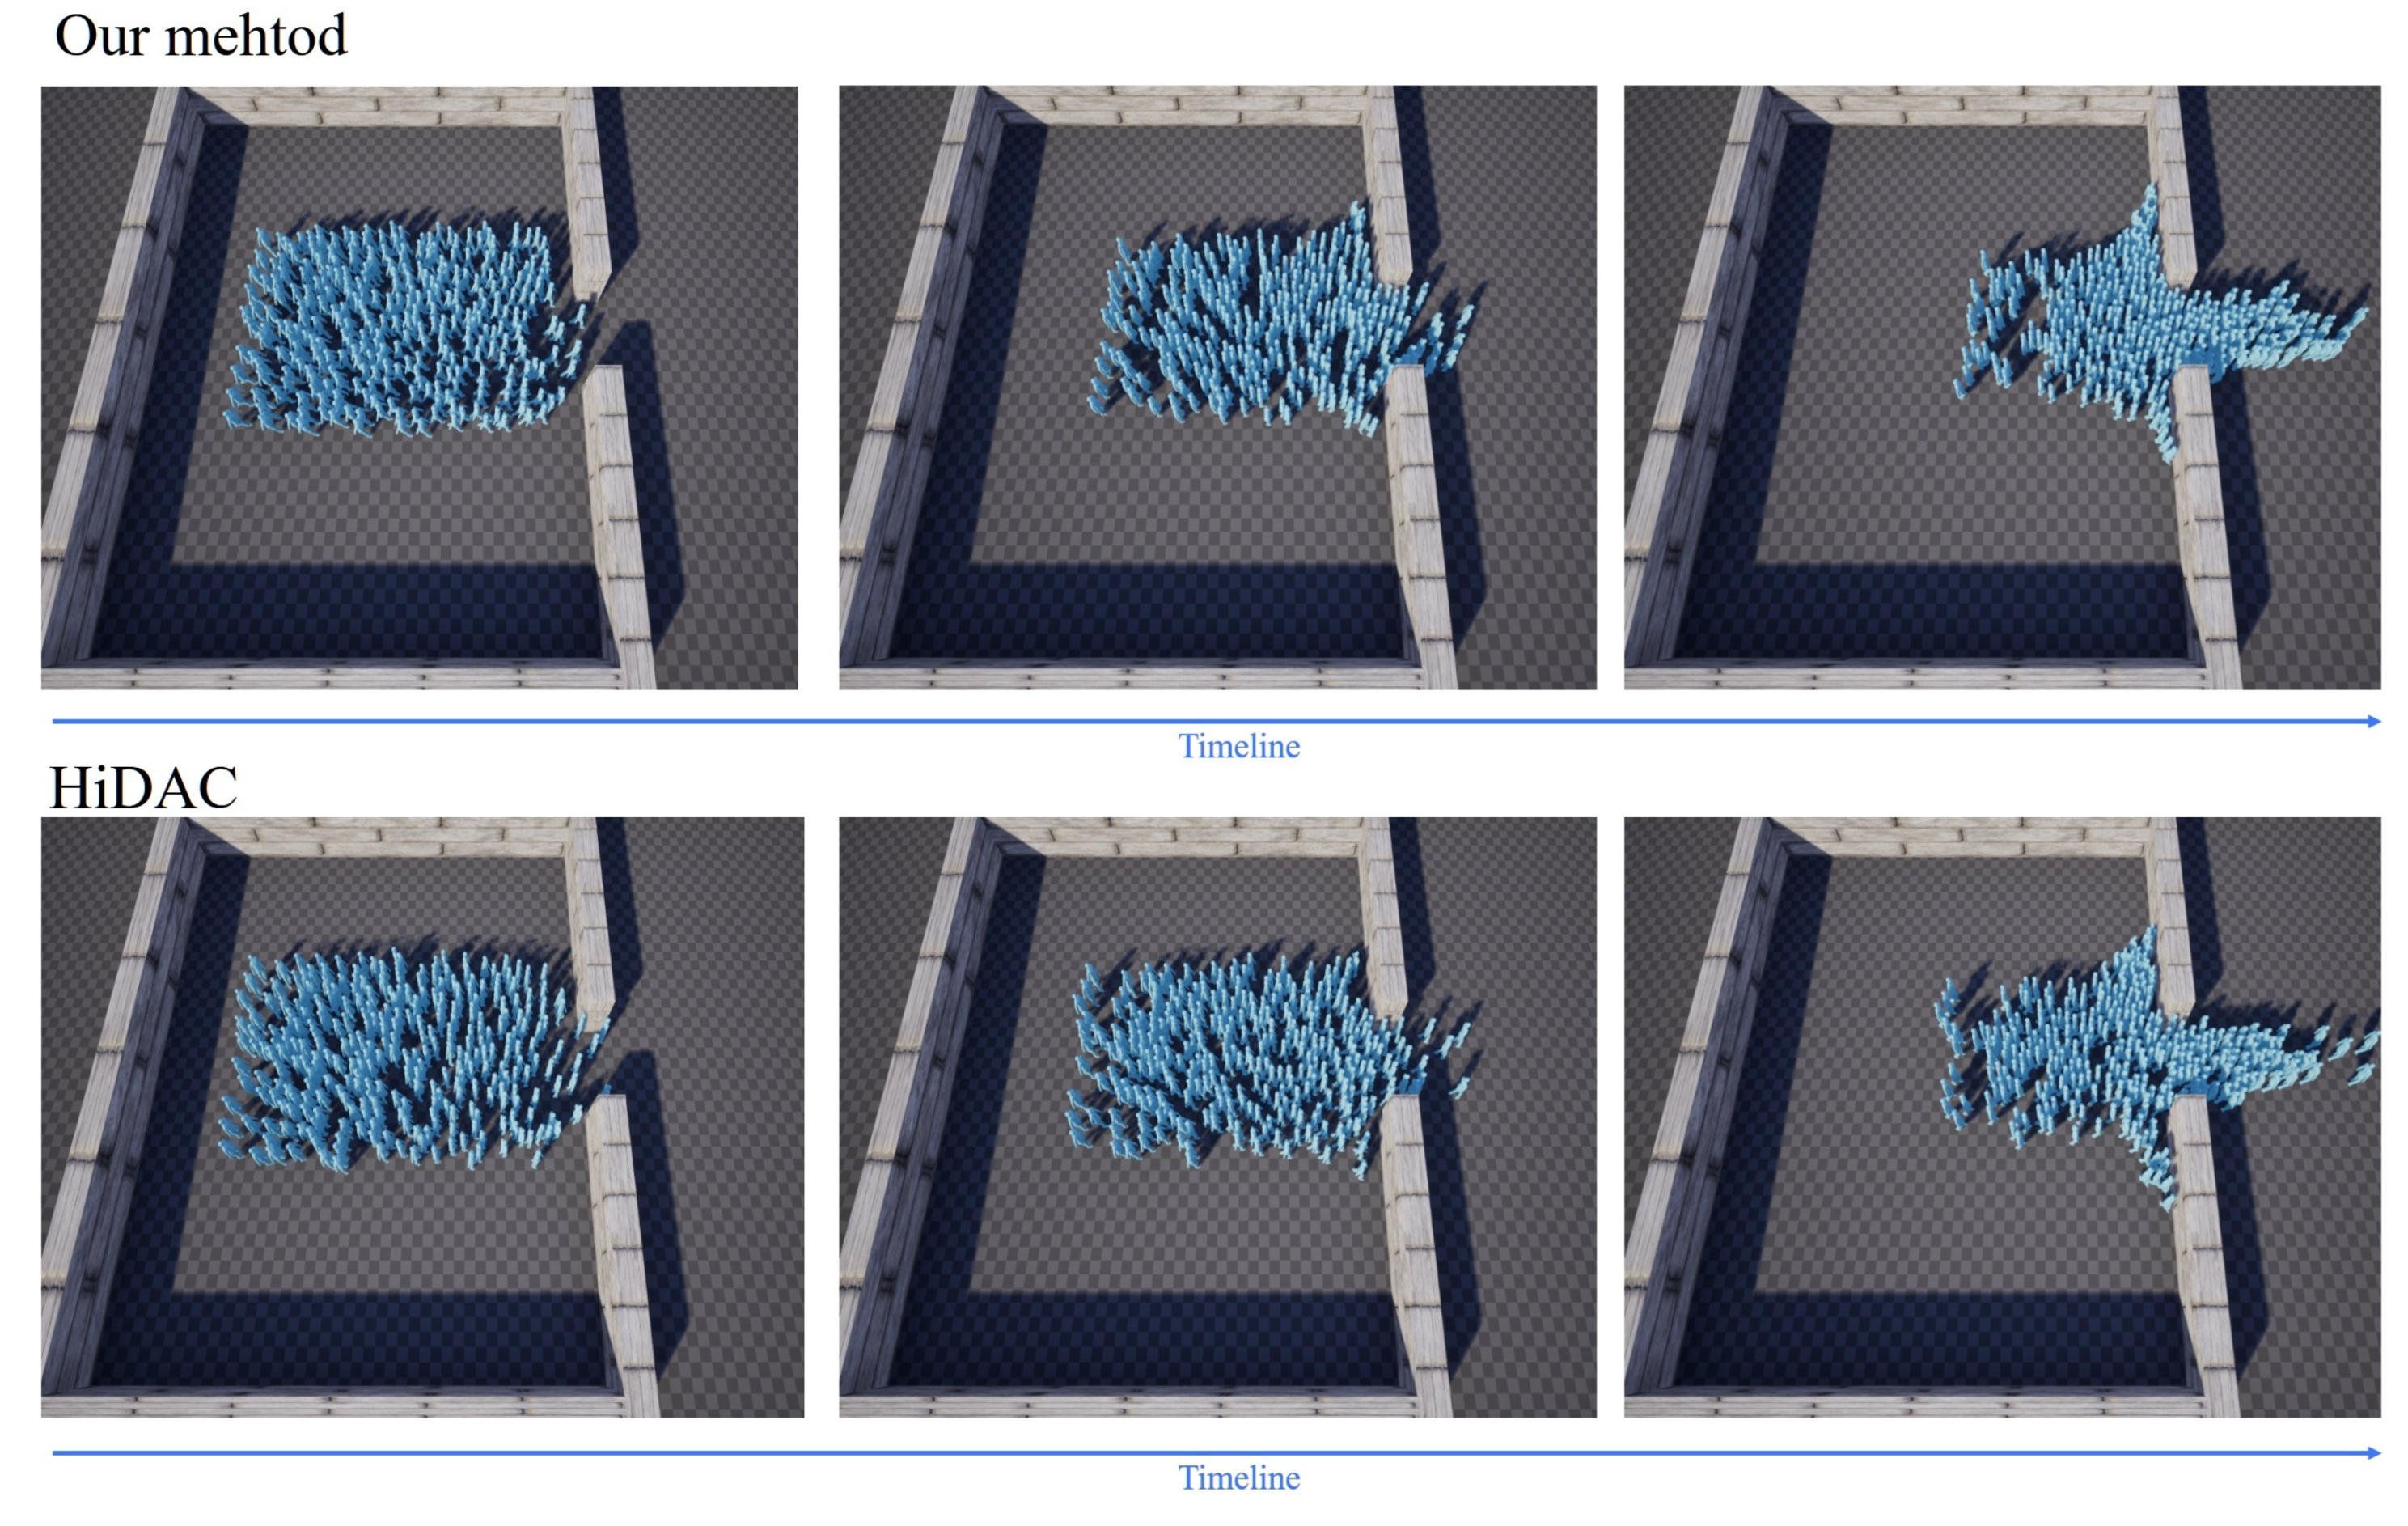
4.2. Trajectory Analysis

To further validate simulation results, Figure 7 displays the simulated trajectories constructed by various methods in the ETH scenario, and a heatmap is constructed based on the positions of agents within these trajectories. The heatmap reflects the concentration of crowds in different areas of the scene. From the trajectories, it is evident that all methods can generate reasonable crowd movement processes. However, the heatmaps reveal certain differences in the crowd distribution areas produced by each method.
We propose a multi-level trajectory evaluation method. The Structural Similarity Index (SSIM) is computed to analyze the composite similarity between simulated crowd heatmaps generated by various methods and an actual crowd heatmap. Subsequently, pixel threshold values are employed to categorize the hotspots in each image into three levels, comparing the similarities accordingly. The highest level, represented by red regions, denotes areas with the most concentrated trajectories. The medium level, indicated by yellow regions, reflects areas with a general distribution of trajectories. The lowest level, depicted by green regions, signifies areas with fewer trajectory occurrences. The Jaccard similarity index is utilized to calculate the similarity of the different levels of heatmap regions generated by each method compared to the actual values. Results summarized in Table 2 show that pure physical models such as SFM and HiDAC have certain discrepancies in crowd position distribution within their generated trajectories compared to actual crowd trajectories. In contrast, hybrid models integrating data-driven learning outperform pure physical models in trajectory features. Further analysis of the hotspot levels reveals that data-driven methods generate crowd trajectories in the most concentrated areas more similar to real crowds at the highest level. This suggests that simulations closely match the actual data in areas of highest crowd density. At the medium level, our method maintains the highest similarity, indicating effective simulation of areas with a general trajectory distribution. At the lowest level, our method achieves the highest similarity, demonstrating close alignment with actual situations even in regions with sparse crowds. Overall, our method surpasses other methods in average similarity, indicating that it more accurately captures and reproduces the positional distribution and movement trends of real crowds.

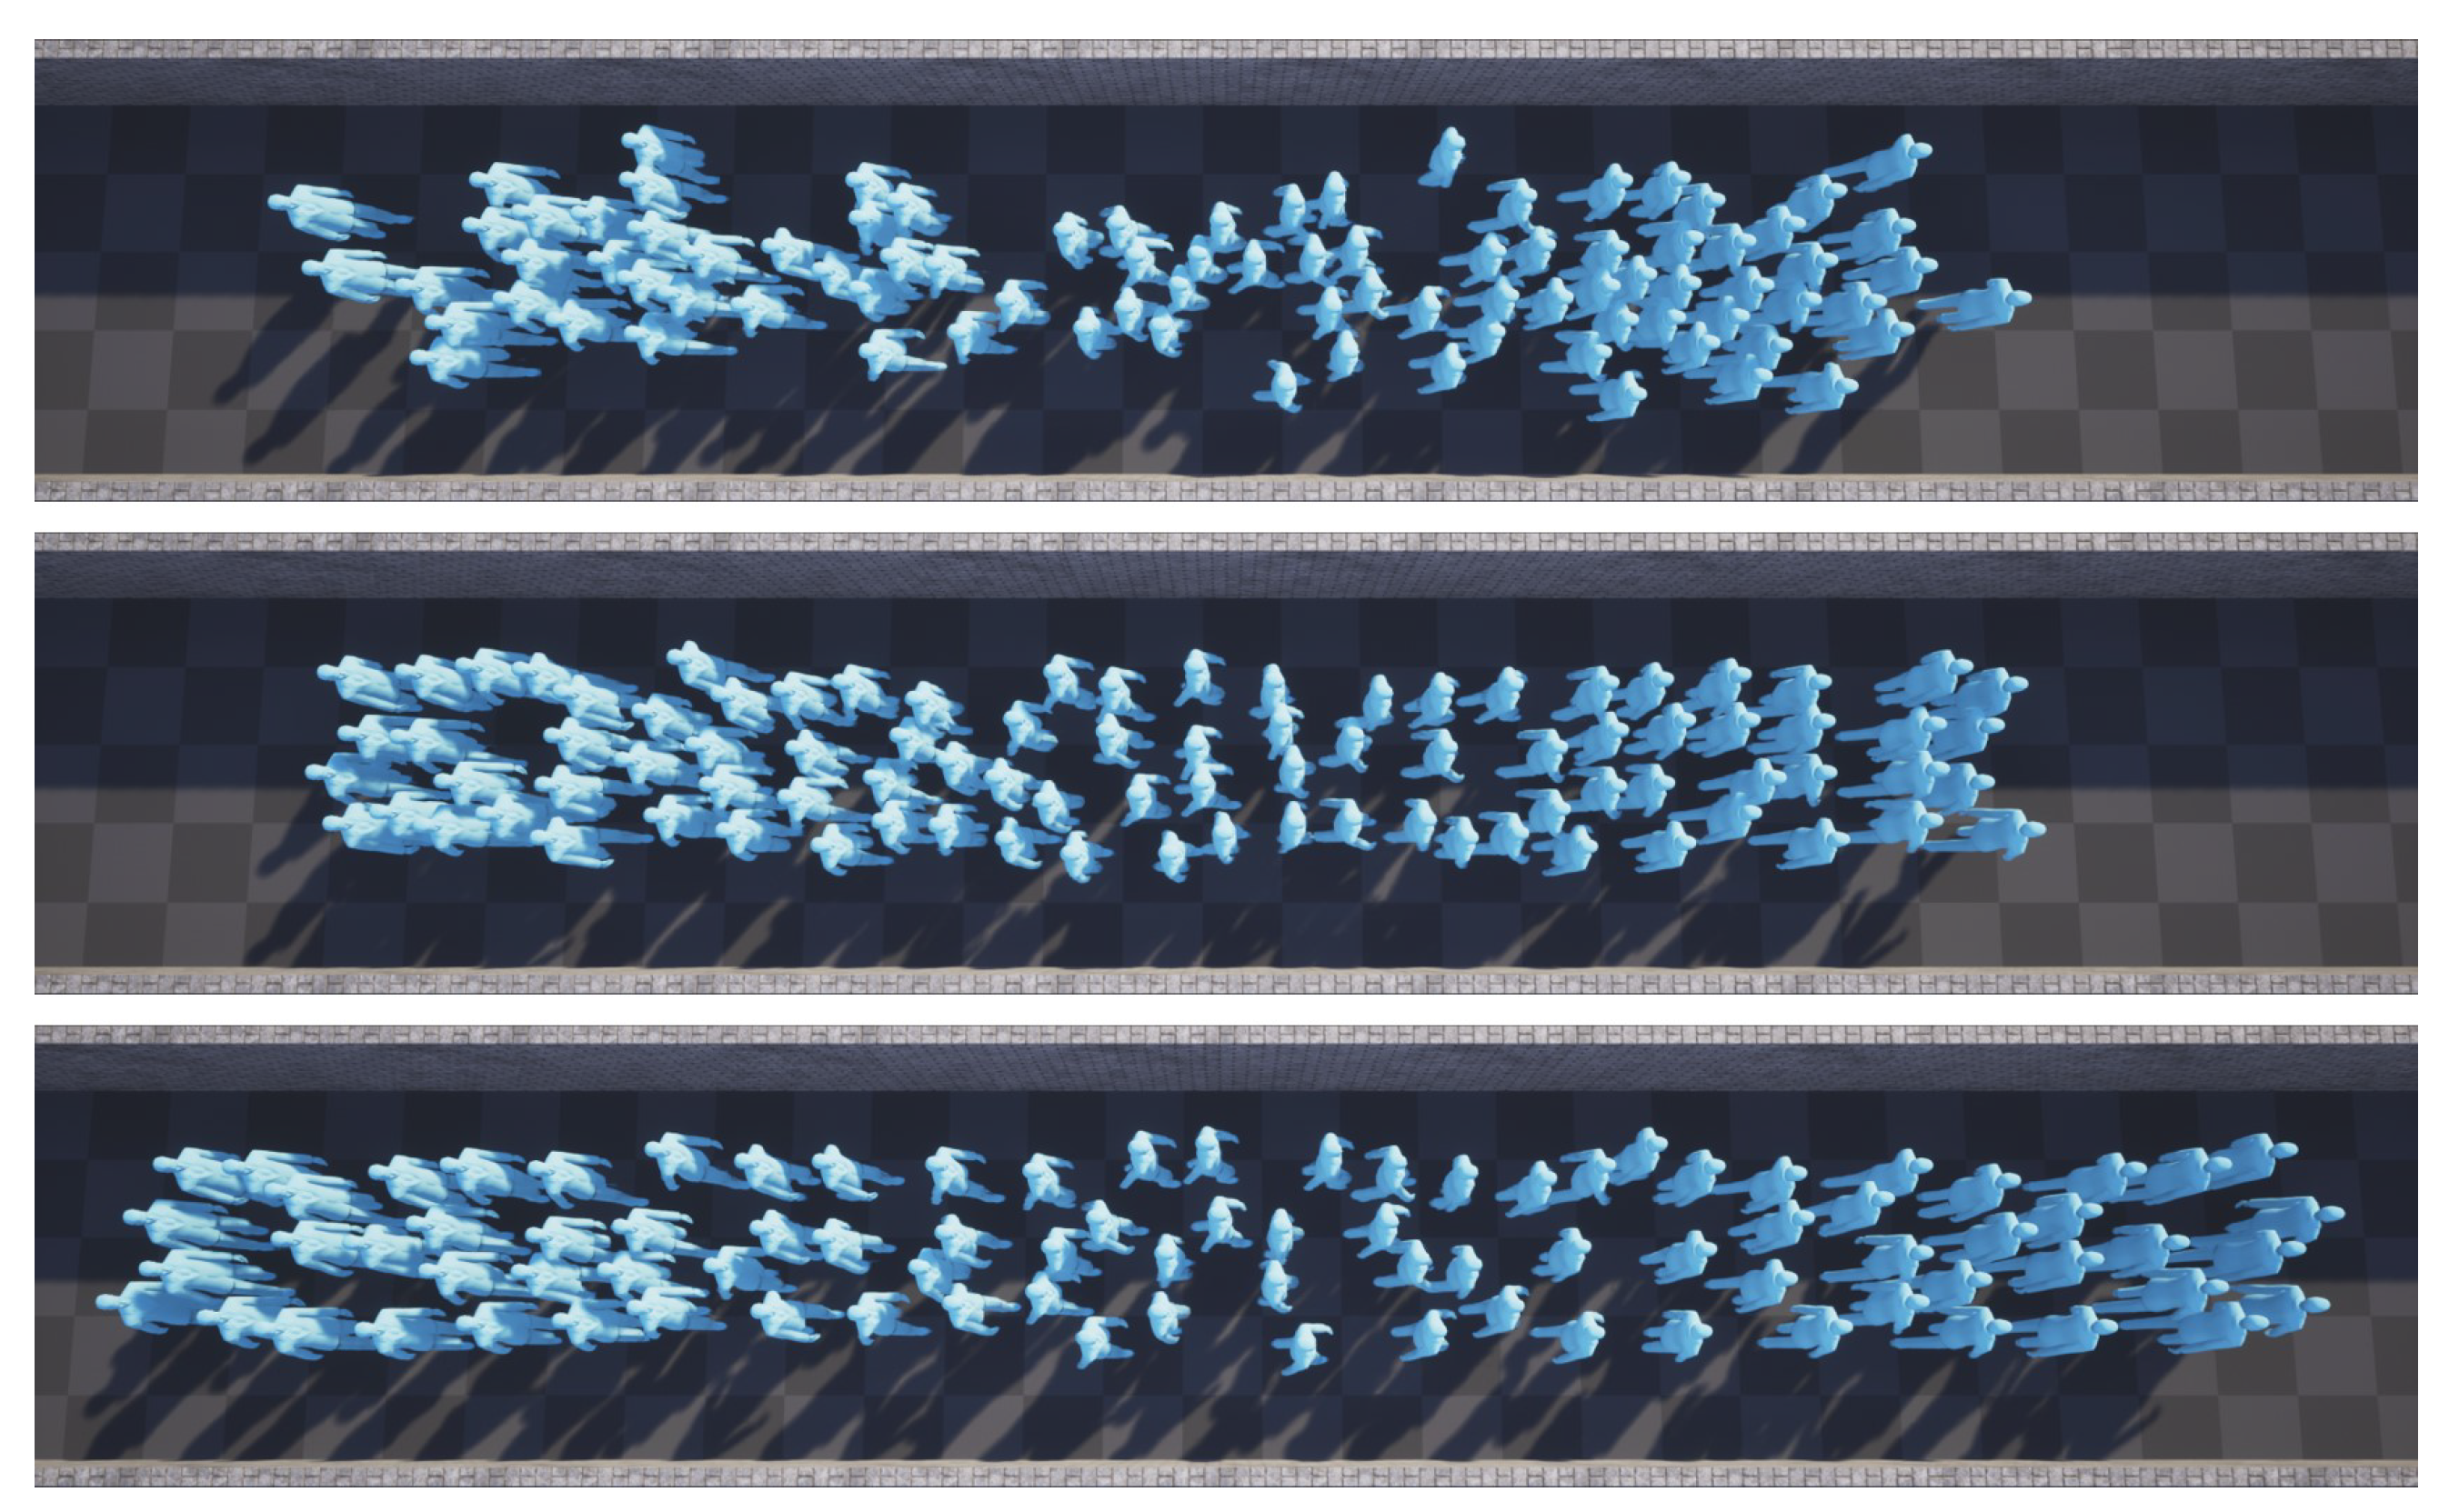
4.3. Simulation of Different Behaviors of Crowds

The HiDAC model, with its StoppingRule and WaitingRule, facilitates the construction of high-density crowd simulations and simulations of crowds in various states. These rules apply in our model as well. Drawing on the approach of HiDAC for simulating high-density crowds, our model sets StoppingRule for an agent when the repulsive force from other agents opposes the velocity direction of the agent, along with a brief random time lock to prevent deadlocks. When the countdown ends, the agent resumes movement, avoiding deadlock. Additionally, agents are permitted to collide in this scenario, enabling pushing behavior. Agents being pushed do not adhere to the stopping rule, allowing for scenarios where groups become pushed towards an exit in high-density conditions. The simulation of 300 agents exiting through a small door is demonstrated like the simulation of HiDAC, as shown in Figure 8, where observable congestion forms at the doorway.
Regarding WaitingRule, it is used to simulate more organized crowd states (such as queuing). Referring to HiDAC settings, when WaitingRule is enabled, the influence area is set for each agent. If other agents moving in the same direction enter the personal influence area of the current agent, WaitingRule value is set to True. A random timer rule is also employed to prevent deadlock. This rule facilitates the simulation of crowd queuing movement, and setting different influence area ranges allows for varying densities in queue formation. Figure 9 demonstrates the effects of simulating different crowd states through parameter adjustments by our method. The effect of adjusting using HiDAC is similar to our method and therefore is not shown. We use three metrics to further evaluate the simulation results as follows.
Mean Nearest Neighbor Distance (MNND): MNND is calculated by determining the distance between each individual and their closest neighbor, and then computing the average of these distances across the entire crowd. Lower MNND value generally indicates denser crowd formation.
Standard Deviation of Nearest Neighbor Distance (SDNND): It is derived from the variance in nearest neighbor distances. A smaller SDNND reflects a more consistent spacing between individuals, suggesting a higher degree of formation neatness.
Convex Hull Area (CHA): CHA measures the total area encompassed by the outermost individuals of the crowd, providing insight into the overall spatial spread of the formation. A larger CHA may imply a more dispersed and less compact crowd formation.
The results are summarized in Table 3. When WaitingRule is not enabled, a higher SDNND is observed, suggesting a more irregular distribution of the crowd. Concurrently, the relatively lower values of MNND and CHA indicate a closer average distance between agents. In contrast, upon the activation of WaitingRule, there is a significant reduction in SDNND, denoting a more orderly and uniform crowd distribution. Furthermore, employing varying agent influence areas leads to notable changes in MNND and CHA, indicating that increasing the influence area enlarges the spatial gap between agents. These findings are highly consistent with the visual results presented in Figure 9, further validating our analysis.
After different parameters in the model are adjusted, the model can simulate various crowd states, a feature not present in previous deep learning models. This indicates that through meticulous design, using deep learning models combined with traditional methods for constructing crowd simulations can retain the intrinsic characteristics of traditional methods, demonstrating the immense potential of hybrid models in the development of crowd simulations. Additionally, these scenarios differ from those used in training the model, demonstrating the generalizability of our approach.

4.4. Ablation Experiment

In the final phase, ablation studies take place to validate the roles of modules and experimental strategies. The same strategies from performance analysis experiments apply in these ablation studies. Two ablation experiments occur: first, a comparison between models trained on real data and those trained on collision-free data. Then, the study examines the impact on model performance by removing collision repulsion force module F ^ i t . The results displayed in Figure 10 show that training the model only with real data slightly improves the similarity in dynamics and density between simulated and real crowds but increases collision rate in simulation results. This suggests that using collision-free trajectories for training helps reduce collisions in simulated crowds. Since real crowds infrequently encounter very close distances, processing a small portion of the data has minimal impact on the ability to simulate the realism of the model. In the experiment without collision repulsion force F ^ i t , both crowd speed and minimum distance exhibit a slight increase, while the change in collision rate remains minimal. This indicates that using collision repulsion force F ^ i t may slightly decrease performance, but the extent of this decrease is minimal, and previous experiments demonstrate that effectively simulating different crowd behaviors is possible by controlling the use strategy of collision repulsion force F ^ i t .

5. Conclusions

In this study, an innovative approach combining deep learning with the enhanced traditional social force model HiDAC was introduced for simulating crowd dynamics. Our approach aimed to achieve a more accurate and interpretable simulation of crowd behaviors. To delineate the difference of our approach compared to the HiDAC model, we summarized the major differences in Table 4.
Through meticulous experiment setups involving the analysis of diverse crowd scenarios captured in the ETH and UCY datasets, our model was rigorously tested against existing benchmarks. These experiments were designed to not only validate the model’s effectiveness in simulating realistic crowd dynamics, but also explore its limits and potential areas for improvement. The results underscored our model’s superior performance, particularly highlighted by its ability to reduce collision rates and more effectively manage complex interactions within crowds. Such findings are pivotal, as they demonstrate the feasibility of combining traditional modeling techniques with the latest advances in machine learning to enhance the fidelity and applicability of crowd simulations.
The academic implications of our work extend beyond the immediate realm of crowd simulation, suggesting a broader applicability of hybrid modeling approaches in understanding complex systems. For practitioners, especially urban planners and emergency responders, the insights garnered from our model offer a new lens through which to view crowd management strategies, potentially leading to safer and more efficient public spaces.
However, acknowledging the limitations of our current model, particularly in terms of computational demands and the extensive data requirements for training, sets the stage for future research directions. Our forthcoming efforts will be directed towards refining the model to enhance its computational efficiency and generalizability, with an eye towards real-world applications that can benefit from improved crowd management and simulation techniques.

Author Contributions

Conceptualization, D.Y. and K.H.; methodology, D.Y. and C.B.; software, D.Y.; validation, K.H.; formal analysis, L.Z.; investigation, D.Y.; resources, D.Y., K.H. and L.H.; data curation, D.Y.; writing—original draft preparation, D.Y.; writing—review and editing, G.D. and L.Z.; visualization, D.Y. and L.H.; supervision, L.Z.; project administration, D.Y.; funding acquisition, G.D. and L.Z. All authors have read and agreed to the published version of the manuscript.

Funding

This research has been supported by the National Natural Science Foundation of China (NSFC, No. 62177005).

Data Availability Statement

Data are contained within the article.

Conflicts of Interest

The authors declare no conflict of interest.

References

  1. Basori, A.H.; Malebary, S.J.; Firdausiah Mansur, A.B.; Tenriawaru, A.; Yusof, N.; Yunianta, A.; Barukab, O.M. Intelligent Socio-Emotional Control of Pedestrian Crowd behaviour inside Smart City. Procedia Comput. Sci. 2021, 182, 80–88. [Google Scholar] [CrossRef]
  2. Zhang, J.; Jin, D.; Li, Y. Mirage: An Efficient and Extensible City Simulation Framework (Systems Paper). In Proceedings of the SIGSPATIAL ’22: 30th International Conference on Advances in Geographic Information Systems, Seattle, WA, USA, 1–4 November 2022; Association for Computing Machinery: New York, NY, USA, 2022; pp. 1–4. [Google Scholar]
  3. Zhang, J.; Zhu, J.; Dang, P.; Wu, J.; Zhou, Y.; Li, W.; Fu, L.; Guo, Y.; You, J. An improved social force model (ISFM)-based crowd evacuation simulation method in virtual reality with a subway fire as a case study. Int. J. Digit. Earth 2023, 16, 1186–1204. [Google Scholar] [CrossRef]
  4. Wu, W.; Li, J.; Yi, W.; Zheng, X. Modeling Crowd Evacuation via Behavioral Heterogeneity-Based Social Force Model. IEEE Trans. Intell. Transp. Syst. 2022, 23, 15476–15486. [Google Scholar] [CrossRef]
  5. Yao, Z.; Zhang, G.; Lu, D.; Liu, H. Data-driven crowd evacuation: A reinforcement learning method. Neurocomputing 2019, 366, 314–327. [Google Scholar] [CrossRef]
  6. Zhang, D.; Li, W.; Gong, J.; Zhang, G.; Liu, J.; Huang, L.; Liu, H.; Ma, H. Deep reinforcement learning and 3D physical environments applied to crowd evacuation in congested scenarios. Int. J. Digit. Earth 2023, 16, 691–714. [Google Scholar] [CrossRef]
  7. Deng, K.; Hu, X.; Li, M.; Chen, T. An extended social force model considering the psychological impact of the hazard source and its behavioural manifestation. Phys. A Stat. Mech. Its Appl. 2023, 627, 129127. [Google Scholar] [CrossRef]
  8. Haworth, B.; Usman, M.; Schaumann, D.; Chakraborty, N.; Berseth, G.; Faloutsos, P.; Kapadia, M. Gamification of Crowd-Driven Environment Design. IEEE Comput. Graph. Appl. 2021, 41, 107–117. [Google Scholar] [CrossRef] [PubMed]
  9. Nicolas, A.; Hassan, F.H. Social groups in pedestrian crowds: Review of their influence on the dynamics and their modelling. Transp. A Transp. Sci. 2023, 19, 1970651. [Google Scholar] [CrossRef]
  10. Lv, P.; Yu, Q.; Xu, B.; Li, C.; Zhou, B.; Xu, M. Emotional Contagion-Aware Deep Reinforcement Learning for Antagonistic Crowd Simulation. IEEE Trans. Affect. Comput. 2022, 1–15. [Google Scholar] [CrossRef]
  11. Berg, J.v.d.; Guy, S.J.; Lin, M.; Manocha, D. Reciprocal n-body collision avoidance. In Robotics Research; Springer: Berlin/Heidelberg, Germany, 2011; pp. 3–19. [Google Scholar]
  12. Helbing, D.; Molnár, P. Social force model for pedestrian dynamics. Phys. Rev. E 1995, 51, 4282–4286. [Google Scholar] [CrossRef]
  13. Pelechano, N.; Allbeck, J.M.; Badler, N.I. Controlling Individual Agents in High-Density Crowd Simulation. In Proceedings of the SCA ’07: 2007 ACM SIGGRAPH/Eurographics Symposium on Computer Animation, San Diego, CA, USA, 2–4 August 2007; Eurographics Association: Goslar, Germany, 2007; pp. 99–108. [Google Scholar]
  14. Lerner, A.; Chrysanthou, Y.; Lischinski, D. Crowds by Example. Comput. Graph. Forum 2007, 26, 655–664. [Google Scholar] [CrossRef]
  15. Charalambous, P.; Chrysanthou, Y. The PAG crowd: A graph based approach for efficient data-driven crowd simulation. Comput. Graph. Forum 2014, 33, 95–108. [Google Scholar] [CrossRef]
  16. Zhao, M.; Cai, W.; Turner, S.J. Clust: Simulating realistic crowd behaviour by mining pattern from crowd videos. Comput. Graph. Forum 2018, 37, 184–201. [Google Scholar] [CrossRef]
  17. Kim, S.; Bera, A.; Best, A.; Chabra, R.; Manocha, D. Interactive and adaptive data-driven crowd simulation. In Proceedings of the 2016 IEEE Virtual Reality (VR), Greenville, SC, USA, 19–23 March 2016; pp. 29–38. [Google Scholar]
  18. Ren, J.; Xiang, W.; Xiao, Y.; Yang, R.; Manocha, D.; Jin, X. Heter-Sim: Heterogeneous Multi-Agent Systems Simulation by Interactive Data-Driven Optimization. IEEE Trans. Vis. Comput. Graph. 2021, 27, 1953–1966. [Google Scholar] [CrossRef]
  19. Zhao, Y.; Geraerts, R. Automatic Parameter Tuning via Reinforcement Learning for Crowd Simulation with Social Distancing. In Proceedings of the 2022 26th International Conference on Methods and Models in Automation and Robotics (MMAR), Międzyzdroje, Poland, 22–25 August 2022; pp. 87–92. [Google Scholar]
  20. Yao, Z.; Zhang, G.; Lu, D.; Liu, H. Learning crowd behavior from real data: A residual network method for crowd simulation. Neurocomputing 2020, 404, 173–185. [Google Scholar] [CrossRef]
  21. Wei, X.; Lu, W.; Zhu, L.; Xing, W. Learning motion rules from real data: Neural network for crowd simulation. Neurocomputing 2018, 310, 125–134. [Google Scholar] [CrossRef]
  22. Song, X.; Han, D.; Sun, J.; Zhang, Z. A data-driven neural network approach to simulate pedestrian movement. Phys. A Stat. Mech. Its Appl. 2018, 509, 827–844. [Google Scholar] [CrossRef]
  23. Zhang, G.; Yu, Z.; Jin, D.; Li, Y. Physics-Infused Machine Learning for Crowd Simulation. In Proceedings of the KDD ’22: 28th ACM SIGKDD Conference on Knowledge Discovery and Data Mining, Washington, DC, USA, 14–18 August 2022; Association for Computing Machinery: New York, NY, USA, 2022; pp. 2439–2449. [Google Scholar]
  24. Amirian, J.; van Toll, W.; Hayet, J.B.; Pettré, J. Data-Driven Crowd Simulation with Generative Adversarial Networks. In Proceedings of the CASA ’19: 32nd International Conference on Computer Animation and Social Agents, Paris, France, 1–3 July 2019; Association for Computing Machinery: New York, NY, USA, 2019; pp. 7–10. [Google Scholar]
  25. Lin, X.; Liang, Y.; Zhang, Y.; Hu, Y.; Yin, B. IE-GAN: A data-driven crowd simulation method via generative adversarial networks. Multimed. Tools Appl. 2023, 1–34. [Google Scholar] [CrossRef]
  26. Goodfellow, I.; Pouget-Abadie, J.; Mirza, M.; Xu, B.; Warde-Farley, D.; Ozair, S.; Courville, A.; Bengio, Y. Generative adversarial nets. In Advances in Neural Information Processing Systems; Curran Associates, Inc.: Red Hook, NY, USA, 2014; Volume 27. [Google Scholar]
  27. Zhang, J.; Li, C.; Wang, C.; He, G. ORCANet: Differentiable multi-parameter learning for crowd simulation. Comput. Animat. Virtual Worlds 2023, 34, e2114. [Google Scholar] [CrossRef]
  28. Li, Y.; Mao, T.; Meng, R.; Yan, Q.; Wang, Z. DeepORCA: Realistic crowd simulation for varying scenes. Comput. Animat. Virtual Worlds 2022, 33, e2067. [Google Scholar] [CrossRef]
  29. Yang, S.; Li, T.; Gong, X.; Peng, B.; Hu, J. A review on crowd simulation and modeling. Graph. Model. 2020, 111, 101081. [Google Scholar] [CrossRef]
  30. Jiang, Y.Q.; Hu, Y.G.; Huang, X. Modeling pedestrian flow through a bottleneck based on a second-order continuum model. Phys. A Stat. Mech. Its Appl. 2022, 608, 128272. [Google Scholar] [CrossRef]
  31. Liang, H.; Du, J.; Wong, S. A Continuum model for pedestrian flow with explicit consideration of crowd force and panic effects. Transp. Res. Part B Methodol. 2021, 149, 100–117. [Google Scholar] [CrossRef]
  32. Narain, R.; Golas, A.; Curtis, S.; Lin, M.C. Aggregate Dynamics for Dense Crowd Simulation. In Proceedings of the SIGGRAPH Asia ’09: ACM SIGGRAPH Asia 2009 Papers, Yokohama, Japan, 16–19 December 2009; Association for Computing Machinery: New York, NY, USA, 2009; pp. 1–8. [Google Scholar]
  33. Tsai, T.Y.; Wong, S.K.; Chou, Y.H.; Lin, G.W. Directing virtual crowds based on dynamic adjustment of navigation fields. Comput. Animat. Virtual Worlds 2018, 29, e1765. [Google Scholar] [CrossRef]
  34. Kim, S.; Guy, S.J.; Hillesland, K.; Zafar, B.; Gutub, A.A.A.; Manocha, D. Velocity-based modeling of physical interactions in dense crowds. Vis. Comput. 2015, 31, 541–555. [Google Scholar] [CrossRef]
  35. Hughes, R.; Ondřej, J.; Dingliana, J. DAVIS: Density-Adaptive Synthetic-Vision Based Steering for Virtual Crowds. In Proceedings of the MIG ’15: 8th ACM SIGGRAPH Conference on Motion in Games, Paris, France, 16–18 November 2015; Association for Computing Machinery: New York, NY, USA, 2015; pp. 79–84. [Google Scholar]
  36. Dutra, T.B.; Marques, R.; Cavalcante-Neto, J.; Vidal, C.A.; Pettré, J. Gradient-based steering for vision-based crowd simulation algorithms. Comput. Graph. Forum 2017, 36, 337–348. [Google Scholar] [CrossRef]
  37. Ma, Y.; Lee, E.W.M.; Yuen, R.K.K. An Artificial Intelligence-Based Approach for Simulating Pedestrian Movement. IEEE Trans. Intell. Transp. Syst. 2016, 17, 3159–3170. [Google Scholar] [CrossRef]
  38. Salzmann, T.; Ivanovic, B.; Chakravarty, P.; Pavone, M. Trajectron++: Dynamically-Feasible Trajectory Forecasting with Heterogeneous Data. In Proceedings of the Computer Vision—ECCV 2020; Vedaldi, A., Bischof, H., Brox, T., Frahm, J.M., Eds.; Springer: Cham, Switzerland, 2020; pp. 683–700. [Google Scholar]
  39. Song, X.; Chen, K.; Li, X.; Sun, J.; Hou, B.; Cui, Y.; Zhang, B.; Xiong, G.; Wang, Z. Pedestrian Trajectory Prediction Based on Deep Convolutional LSTM Network. IEEE Trans. Intell. Transp. Syst. 2021, 22, 3285–3302. [Google Scholar] [CrossRef]
  40. Mohamed, A.; Qian, K.; Elhoseiny, M.; Claudel, C. Social-STGCNN: A Social Spatio-Temporal Graph Convolutional Neural Network for Human Trajectory Prediction. In Proceedings of the IEEE/CVF Conference on Computer Vision and Pattern Recognition (CVPR), Seattle, WA, USA, 13–19 June 2020. [Google Scholar]
  41. Wang, Z.; Guo, J.; Hu, Z.; Zhang, H.; Zhang, J.; Pu, J. Lane Transformer: A High-Efficiency Trajectory Prediction Model. IEEE Open J. Intell. Transp. Syst. 2023, 4, 2–13. [Google Scholar] [CrossRef]
  42. Lv, Z.; Huang, X.; Cao, W. An improved GAN with transformers for pedestrian trajectory prediction models. Int. J. Intell. Syst. 2022, 37, 4417–4436. [Google Scholar] [CrossRef]
  43. Yuan, Y.; Weng, X.; Ou, Y.; Kitani, K. AgentFormer: Agent-Aware Transformers for Socio-Temporal Multi-Agent Forecasting. In Proceedings of the 2021 IEEE/CVF International Conference on Computer Vision (ICCV), Los Alamitos, CA, USA, 11–17 October 2021; pp. 9793–9803. [Google Scholar]
  44. Giuliari, F.; Hasan, I.; Cristani, M.; Galasso, F. Transformer Networks for Trajectory Forecasting. In Proceedings of the 2020 25th International Conference on Pattern Recognition (ICPR), Milan, Italy, 10–15 January 2021; pp. 10335–10342. [Google Scholar]
  45. Agarwal, A.; Lalit, M.; Bansal, A.; Seeja, K. iSGAN: An Improved SGAN for Crowd Trajectory Prediction from Surveillance Videos. Procedia Comput. Sci. 2023, 218, 2319–2327. [Google Scholar] [CrossRef]
  46. Yue, J.; Manocha, D.; Wang, H. Human Trajectory Prediction via Neural Social Physics. In Proceedings of the Computer Vision—ECCV 2022; Avidan, S., Brostow, G., Cissé, M., Farinella, G.M., Hassner, T., Eds.; Springer: Cham, Switzerland, 2022; pp. 376–394. [Google Scholar]
  47. Yu, Y.; Xiang, W.; Jin, X. Multi-level crowd simulation using social LSTM. Comput. Animat. Virtual Worlds 2023, 34, e2180. [Google Scholar] [CrossRef]
  48. Sohn, K.; Lee, H.; Yan, X. Learning Structured Output Representation using Deep Conditional Generative Models. In Proceedings of the Advances in Neural Information Processing Systems; Cortes, C., Lawrence, N., Lee, D., Sugiyama, M., Garnett, R., Eds.; Curran Associates, Inc.: Red Hook, NY, USA, 2015; Volume 28. [Google Scholar]
  49. Vaswani, A.; Shazeer, N.; Parmar, N.; Uszkoreit, J.; Jones, L.; Gomez, A.N.; Kaiser, L.u.; Polosukhin, I. Attention is All you Need. In Proceedings of the Advances in Neural Information Processing Systems; Guyon, I., Luxburg, U.V., Bengio, S., Wallach, H., Fergus, R., Vishwanathan, S., Garnett, R., Eds.; Curran Associates, Inc.: Red Hook, NY, USA, 2017; Volume 30. [Google Scholar]
  50. Pellegrini, S.; Ess, A.; Schindler, K.; Van Gool, L. You’ll never walk alone: Modeling social behavior for multi-target tracking. In Proceedings of the 2009 IEEE 12th International Conference on Computer Vision, Kyoto, Japan, 29 September–2 October 2009; pp. 261–268. [Google Scholar]
Figure 1. Model overview. For non-colliding agents, preliminary future positions are calculated using neural social force, followed by CVAE for precise positioning with dynamic randomness. For colliding agents, future positions are determined by repulsive force.
Electronics 13 00934 g001
Figure 2. Dynamics of velocity change under initial velocity and repulsive force.
Electronics 13 00934 g002
Figure 3. Neural network structures within the neural social force module for automatic calculation of key parameters in the social force model. (Top): D, (Bottom Left): C, (Bottom Right): O. Dimensions and layers of each module are indicated in parentheses. Unless specified otherwise in the context, intermediate layers utilize LeakRelu as the activation function.
Electronics 13 00934 g003
Figure 4. Structure of the CVAE Module. (Top): Encoder, (Bottom): Decoder.
Electronics 13 00934 g004
Figure 5. Comparative distribution of key indicators across various methods. (Left): Velocity, (Right): Minimum distance.
Electronics 13 00934 g005
Figure 6. Comparison of collision rate of simulated crowds using different methods.
Electronics 13 00934 g006
Figure 7. Comparison of crowd trajectories and positions in the trajectories under the ETH dataset. The upper part is the trajectory of the real crowd and the crowd simulated by each method, and the lower part is the heatmap composed of the positions in the trajectory. (a) Real crowd, (b) SFM [12], (c) HiDAC [13], (d) NSP-SFM [46], (e) MCS-LSTM [47], (f) our model.
Electronics 13 00934 g007
Figure 8. Simulation of the congestion state of 300 agents at a small exit.
Electronics 13 00934 g008
Figure 9. The simulation state of 88 agents walking on the road after running for 1 min based on the same initial state and different parameter settings. (Top): Without the use of WaitingRule, (Middle): Using WaitingRule with a smaller influence area (0.6) for each agent. (Bottom): Using WaitingRule with a larger influence area (1.0) for each agent.
Electronics 13 00934 g009
Figure 10. Ablation Study Results: Comparison with results from a model trained only on real data and results from removing the collision repulsion force module.
Electronics 13 00934 g010
Table 1. Comparison of various indicators used to measure the closeness of generated results to real-world crowd data under different methods.
MetricSFM [12]HiDAC [13]NSP-SFM [46]MCS-LSTM [47]Our
Velocity Score0.640.640.670.620.69
Minimum Distance Score0.540.530.640.620.64
Note: Bold indicates better indicator results (range of values from 0 to 1. The larger the value, the better).
Table 2. Comparison of Similarity between Simulated Crowd Heatmaps by Different Methods and a Real Crowd Heatmap.
MetricSFM [12]HiDAC [13]NSP-SFM [46]MCS-LSTM [47]Our Model
SSIM0.830.820.880.850.90
High0.240.230.410.530.68
Medium0.280.240.610.110.73
Low0.340.270.590.080.62
Avg0.420.390.620.390.73
Note: Bold indicates better indicator results.
Table 3. The neatness assessment of crowds.
MetricNo WaitingRuleSmaller AreaLarger Area
MNND0.530.580.77
SDNND0.140.090.11
CHA41.1841.5452.35
Table 4. The differences between our approach and the HiDAC model.
-Our ModelHiDAC
Theoretical BasisIntegrates deep learning with social force theories for enhanced accuracy.Based on traditional social force theories.
Parameter Calculation MethodAdaptively calibrated based on real-time analysis of crowd behavior data.Set based on experience.
Simulation RealismData distribution closer to the real crowd.General distribution.
Computational EfficiencyAims for future enhancements to balance computational demand with simulation depth.Efficient within its scope of complexity.
Disclaimer/Publisher’s Note: The statements, opinions and data contained in all publications are solely those of the individual author(s) and contributor(s) and not of MDPI and/or the editor(s). MDPI and/or the editor(s) disclaim responsibility for any injury to people or property resulting from any ideas, methods, instructions or products referred to in the content.

