Abstract
The Spanish government is a strong advocate of reducing CO2 emissions and has made a clear commitment to the implementation of renewable energies. As reflected in Spain’s National Energy and Climate Plan (NECP), its objective is to double the current capacity of pumped hydropower storage (PHS) plants by 2030. Therefore, the study presented here is both current and forward-looking. This paper presents the results of the analysis of the technical potential of installing floating photovoltaic (FPV) plants at 25 PHS plants in Spain, i.e., the total capacity of Spanish hydropower plants. The study was conducted using various assessment indicators: the global horizontal irradiance ratio, electrical efficiency ratio, area required ratio, pumping area ratio, volume ratio of water pumped per day, and achievable power ratio. In summary, the following conclusions can be drawn: (i) The global horizontal irradiance ratio indicates whether a FPV plant is economically viable. From this point of view, the Aguayo PHS plant and the Tanes PHS plant are not suitable, as this ratio is very low; (ii) the compliance with the electrical efficiency ratio is flexible, and all hydropower plants meet this criterion; (iii) maximising the use of the assigned grid connection capacity is one of the goals sought by electrical companies when implementing FPV plants at existing PHS plants. The following hydropower plants are not suitable for the implementation of an FPV plant in view of the following: La Muela I, La Muela II, Aguayo, Sallente, Aldeadavila II, Moralets, Guillena, Bolarque II, Montamara, and IP; (iv) if the aim is energy storage, the following hydropower plants are not suitable for the implementation of an FPV plant: the La Muela I, La Muela II, Tajo de la Encantada, Aguayo, Sallente, Aldeadavila II, Conso, Moralets, Guillena, Bolarque II, Tanes, Montamara, Soutelo, Bao-Puente Bibey, Santiago de Jares, IP, and Urdiceto; (v) if the aim is to expand an FPV plant already installed at a PHS plant, the following hydropower plants do not meet this criterion: the La Muela I, La Muela II, Aguayo, Sallente, Aldeadavila, Moralets, Guillena, Bolarque II, Montamara, and IP. There are only eight hydropower plants that meet conditions (i), (iii) and (iv): the Villarino, Torrejon, Valparaiso, Gabriel y Galan, Guijo de Granadilla, Pintado, and Gobantes.
1. Introduction
The energy sector is essential for the development of mankind, and at the same time, it is responsible for almost of all greenhouse gas emissions [1]. The United Nations promotes action plans capable of ensuring a sustainable future by significantly reducing greenhouse gas emissions. This requires the electricity sector to make considerable efforts in the transition from fossil fuels to renewable energies.
In view of increasing global warming, renewable energies are preferred because of their environmental friendliness. Renewable energy sources, such as wind, photovoltaic (PV), and hydro, have proven to be suitable options for electricity generation without depending on fossil fuels. A hybrid renewable energy system combines various renewable energy sources. Both hydropower and floating photovoltaic technologies are clean, free and highly developed energy sources that offer several advantages, but also disadvantages, which can be minimised by operating them in combination.
The first floating PV projects were comprised of small systems for self-consumption, with capacities between 10 and 100 (kWp). They were implemented in 2006–2007 in California, Spain, Italy and Japan [2]. The first commercial floating PV plant was built at the Far Niente winery in California in 2008 with an electrical power of 175 (kWp) [3]. This project led to several patents for floating photovoltaic systems being filed in several countries, including the United States, France, Denmark, Japan and Italy, during the period from 2007 to 2014 [2].
Although these facilities began operating around 2006, it was not until 2012 that the floating PV market began to take off [2]. The first floating PV plant projects with an installed capacity of more than 1 (MWp) began operating in 2013. From 2015 onwards, the average size of these facilities grew significantly due to the improved reliability. And, by 2019, there were already numerous plants with an installed capacity of more than 100 (MWp) [3].
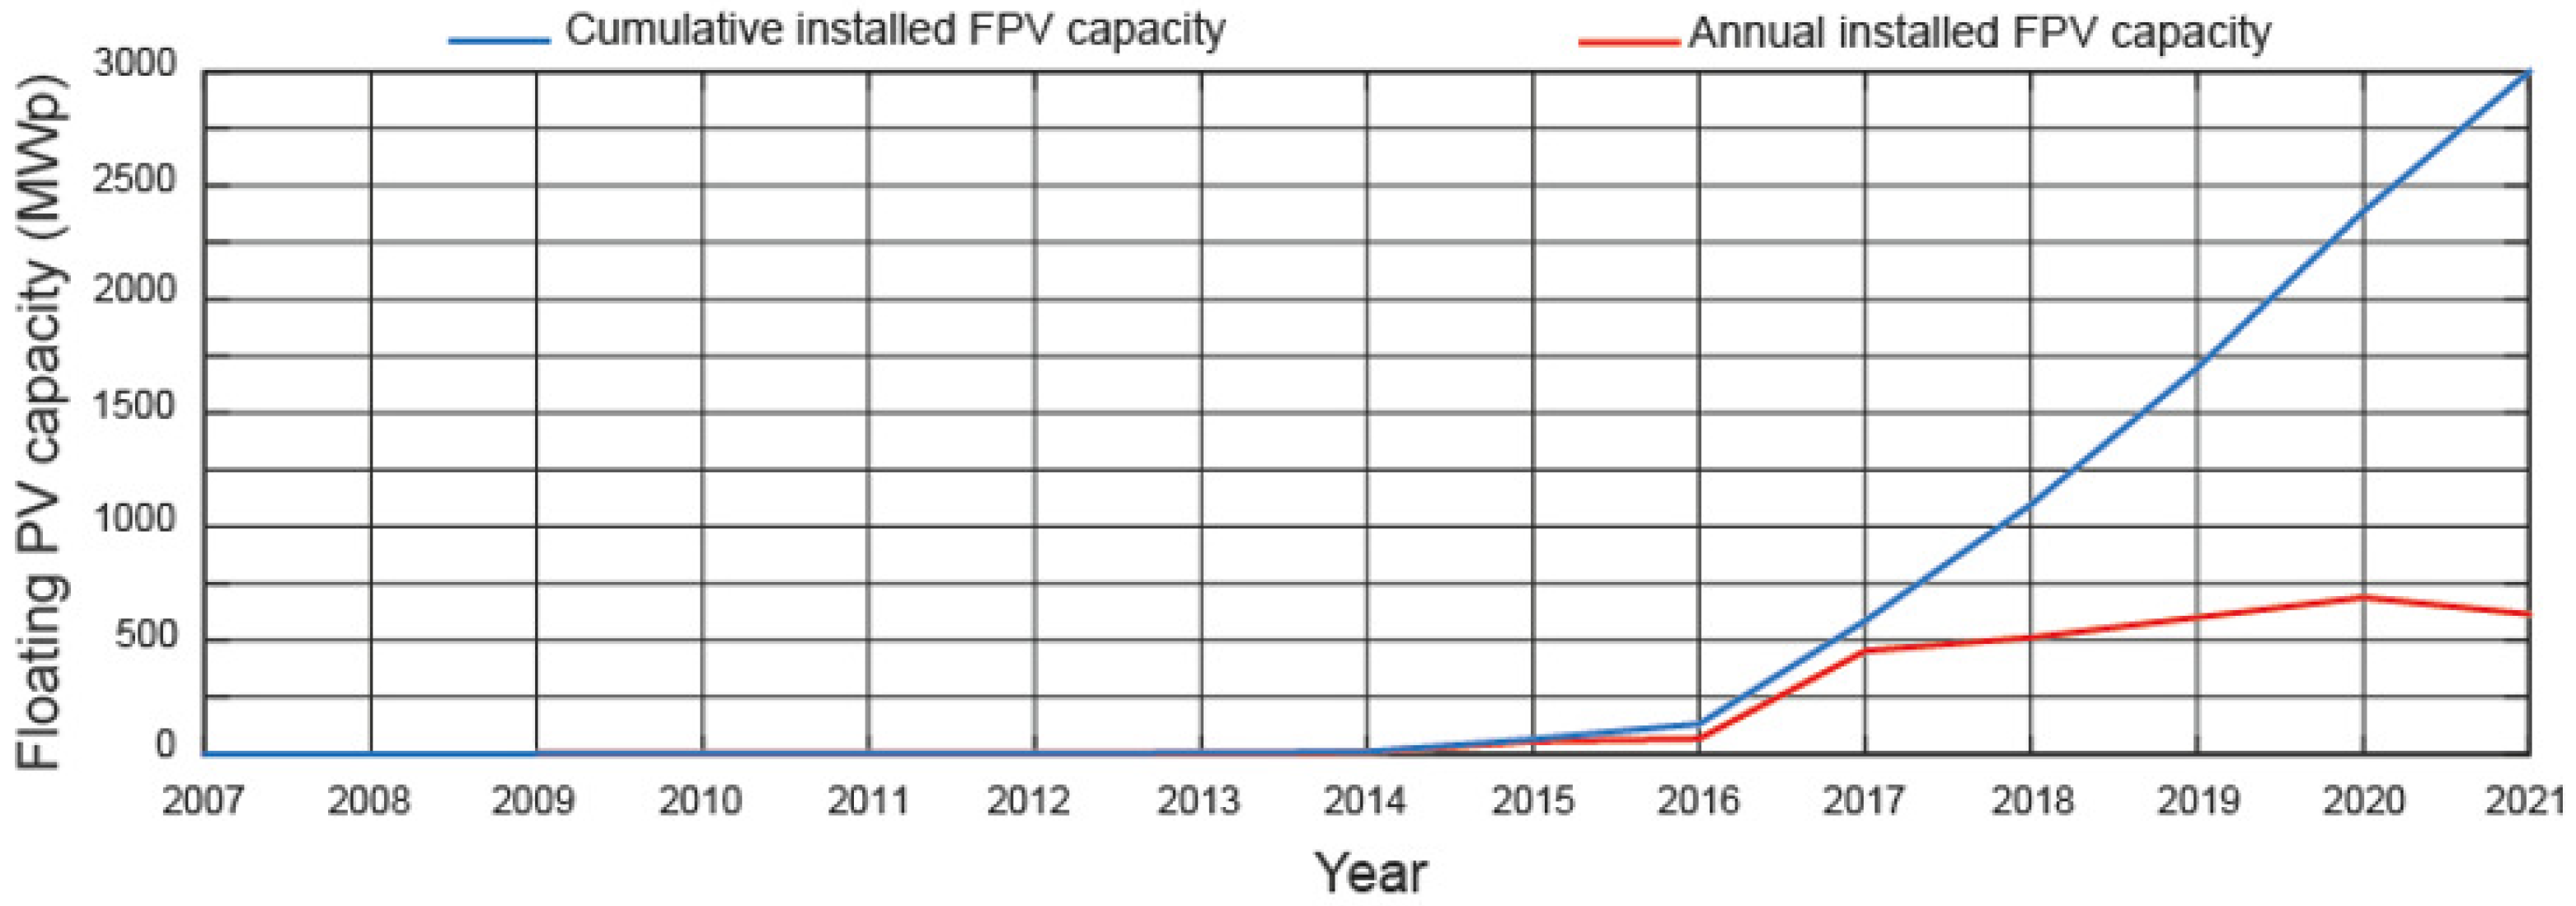
According to a World Bank report [3], 132 (MWp) FPV systems were installed in 2016, growing to 1097 (MW) in 2018 and increasing to 2385 (MW) in 2020 [4]. This growth progression shows the interest of electricity companies in this technology. Figure 1 shows the evolution of the installed capacity of FPV plants. A remarkable growth can be observed from 2015 onwards.
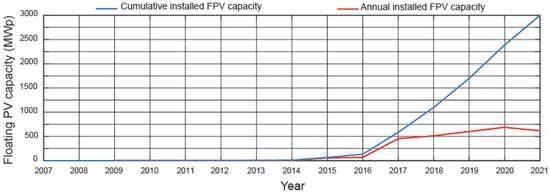
Figure 1.
Global installed floating PV capacity.
This increase in the global capacity of FPV plants is due to the proven advantages of these systems, which include:
- (i)
- Higher energy efficiency. Thanks to the cooling effects of water, PV modules achieve higher energy yields compared to ground-based systems. Studies on the efficiency increase in PV modules in FPV plants compared to ground-based systems range from [5] to [6].
- (ii)
- A lower presence of dust. The presence of dust in these systems is lower compared to ground-based systems.
- (iii)
- Less external near shadows. The water surfaces are free of obstacles, such as trees, thus minimising losses due to nearby external shadows [7].
These benefits affecting the PV module performance vary depending on the installation site, boundary conditions, etc., and therefore need to be analysed over time, although several studies conclude that they can offset any increase in capital cost in most cases.
- (iv)
- No land occupancy. By using water bodies for the implementation of FPV plants, a competition for land is avoided, leaving these areas available for agriculture or other green uses [8].
At present, hydropower is still the largest renewable source of electrical power generation, producing more electricity than all other renewable technologies together [9]. Global electricity generation per capita by source in 2022 was: hydropower 538 (kWh), wind 263 (kWh) and solar 164 (kWh) [10]. The world hydropower capacity was 1353 (GW) in 2021, and is estimated to increase by 230 (GW) between 2021 and 2030 [9]. Therefore, the trend for this technology in the electricity mix is set to increase.
Hydropower plants can be divided into three categories, depending on the type of plant involved, including run-of-river plants, reservoir plants and pumped hydropower storage plants. In this paper, we will focus on pumped hydropower storage (PHS) plants. The mode of operation of a PHS plant is as follows: water is stored in the upper reservoir until the PHS plant must fulfill its obligations to the electricity market, i.e., produce electricity, at which time the water is released through the penstock, spinning the hydro turbine and generating electricity with the electric generator, and stored it in the lower reservoir. When there is excess electricity in the system, the process can be reversed: water is pumped back from the lower reservoir to the upper reservoir, storing the potential energy for later use. PHS plants are the only mass electrical energy storage systems that allow for the efficient management of coverage at peak consumption times. In the opposite case, however, when there is a surplus of electrical energy in the system, this surplus can be used to pump water from the lower reservoir to the upper reservoir to be stored.
The power of such a plant depends on factors like the height difference between the upper and lower reservoirs, the volume of water moved, and the efficiency of the system.
The possibility of adding another renewable resource such as FPV plants to existing PHS plants is of particular interest to hydropower companies, as it makes the operation of PHS plants more flexible. The synergies between the two power plants is analysed below:
- (i)
- The variable production of an FPV plant. As solar energy is intermittent, the output of an FPV plant is variable, affecting the stability of the electricity grid. PHS plants are like nature’s batteries; they store and release energy as needed. Therefore, a PHS plant brings stability to the operation of an FPV plant.
- (ii)
- The increase in the utilisation rate of the assigned grid connection capacity. The grid connection capacity assigned to a PHS plant is the right to use a certain connection line up to a certain capacity for the transmission of electricity from the PHS plant. This assigned capacity is underutilised during most PHS plant operating hours. The joint use of both plants with the assigned grid connection capacity ensures an increase in electricity generation.
- (iii)
- The joint use of existing electricity transmission infrastructure in PHS plants.
- (iv)
- Less water evaporation from reservoirs. The mounting systems used with PV modules do not allow the sun’s rays to hit the water [5], and the PV modules also limit the effects of wind. Assessing surface water evaporation involves a complex mix of different factors. Water temperature, open water surface, vapour pressure difference, wind, atmospheric pressure and water properties are the most important factors [8]. Several studies have been published in the literature on water savings due to the evaporation phenomenon in a reservoir with an FPV plant [8,11,12]. The baseline data in these studies are very different, and so are the results. For guidance, the annual reduction in water losses due to evaporation can be considered as (L/kWh) [8].
- (v)
- Improved water quality. A lack of sunlight is known to favour the reduction of algae growth [13].
The interest in the hybridisation of PHS and FPV plants is demonstrated by the large number of studies in the literature. Some of the most recent work on this topic is listed below.
Olkkonen et al. [14] presented a techno-economic study on the optimal dimensioning of a grid-connected hydro-FPV hybrid system in a PHS plant. This study focused on a single PHS plant. The study proposed in our paper covered all existing PHS plants in Spain, With different climatological conditions, different configurations of upper reservoirs, etc. In other words, it is a generalised study, not a particular study of a single PHS plant. Along the same lines, a study on the optimal operational strategy for FPV and PHS plants in the future Iberian electricity market was presented in [15]. This study also focused on a single PHS plant located in Portugal and does not present assessment indicators. Therefore, conclusions can only be drawn for certain climatic conditions. In contrast, the work presented here covers different locations with very different climatic conditions and uses several assessment indicators.
Mamatha and Kulkarni [16] presented a comprehensive analysis of the potential of FPV plants at Indian hydropower plants, as there were concerns the electricity was generating CO2 emission savings and water savings. Gonzalez et al. [17] analysed the potential for electricity generation, water savings through evaporation and extra electricity generation due to the water saved, with the installation of FPV plants at 146 hydroelectric reservoirs in Africa. The climatic conditions in Spain and India or Africa are very different, so the conclusions of the work of Mamatha et al. [16] and Gonzalez et al. [17] cannot be directly applied in Spain. A customised study is needed for upper reservoirs in Spain. This is the objective of our study.
Shan et al. [18] presented a complementary relationship between small hydro plants and PV systems managed by the California Independent System Operator (CAISO). In this paper, they did not use assessment indicators to study the potential of small hydro plants.
Kakoulaki et al. [19] assessed the potential electricity production by FPV plants, evaporation, water losses, and water savings at 337 hydropower reservoirs in the European Union. This study has not taken into account the assigned grid connection capacity of the corresponding PHS plant. Therefore, the choice of the power of the FPV plant is not perfectly justified. For the same reason, the analysis of the parameters influencing the joint operation of an FPV plant and a PHS plant under future electricity market conditions was presented in [20]. It does not adequately justify the power of the FPV plant either.
By the end of 2022, Spain had 3331 (MW) of installed capacity through PHS plants [21]. According to the Spanish government’s planning as reflected in Spain’s National Energy and Climate Plan (NECP) [22], the objective is to reach 6831 (MW) by 2030, which means adding about 3500 (MW) more PHS plants over the next decade. Therefore, the study presented here is both current and forward-looking. The present study examined the potential of installing FPV plants at twenty-five PHS plants.
The main contributions of this work are as follows:
- (i)
- To present a comprehensive study of the potential of integrating FPV plants in the upper reservoirs of all active PHS plants in Spain.
- (ii)
- To define assessment indicators for the possible operating modes of both plants, such as the solar potential, electrical efficiency, assigned grid connection capacity of a PHS plant, water volume in the upper reservoir and water surface in the upper reservoir.
- (iii)
- To analyse the energy storage capacity of a PHS plant based on the power of an FPV plant.
In summary, the aim of this work is to facilitate decision-making on the suitability of installing an FPV plant in a given PHS plant, the appropriate size for such an FPV plant, and the mode of operation of both plants.
This paper is structured as follows: Section 2 provides the location of all active PHS plants in Spain. Section 3 describes the design of an FPV plant. Section 4 presents the assessment indicators, such as solar potential, electrical efficiency, assigned grid connection capacity of a PHS plant, water volume in the upper reservoir and water surface in the upper reservoir. The results are presented in Section 5. Finally, Section 6 summarises the main contributions and conclusions of this paper.
2. Location of PHS Plants in Spain
The electricity production of an FPV plant is strongly dependent on location [23], meaning it is first necessary to determine the location of the corresponding PHS plants.
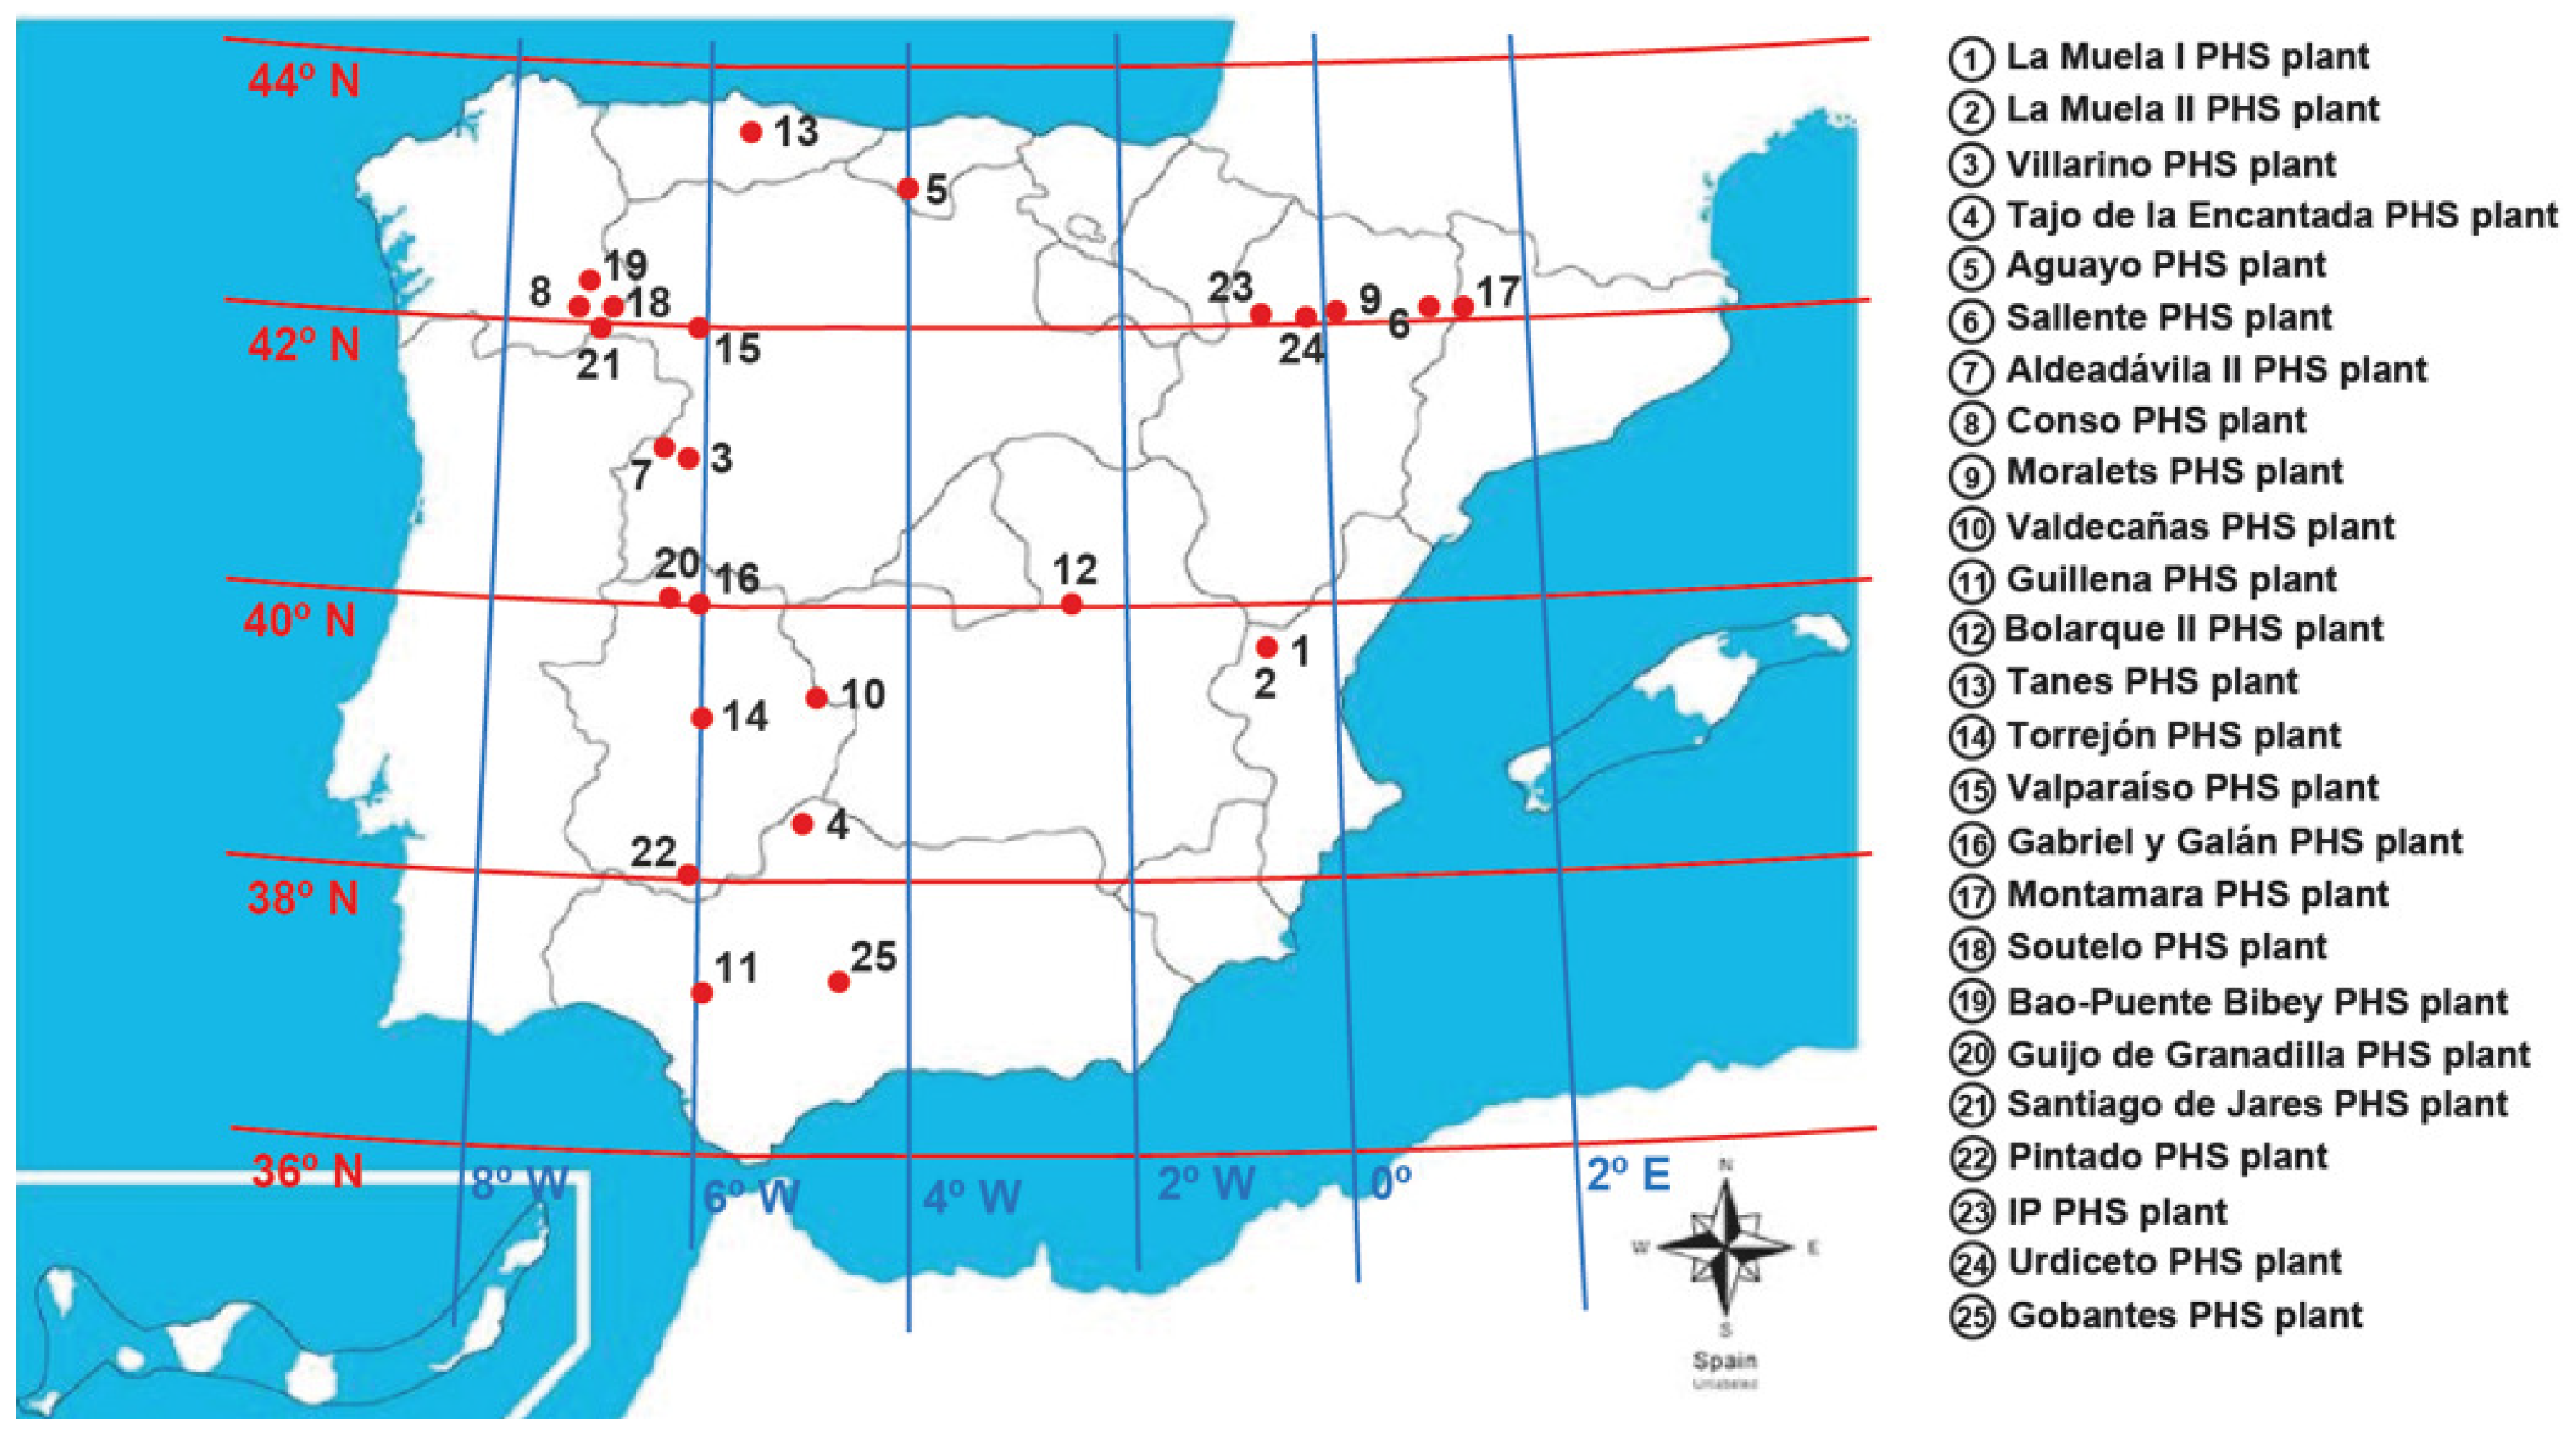
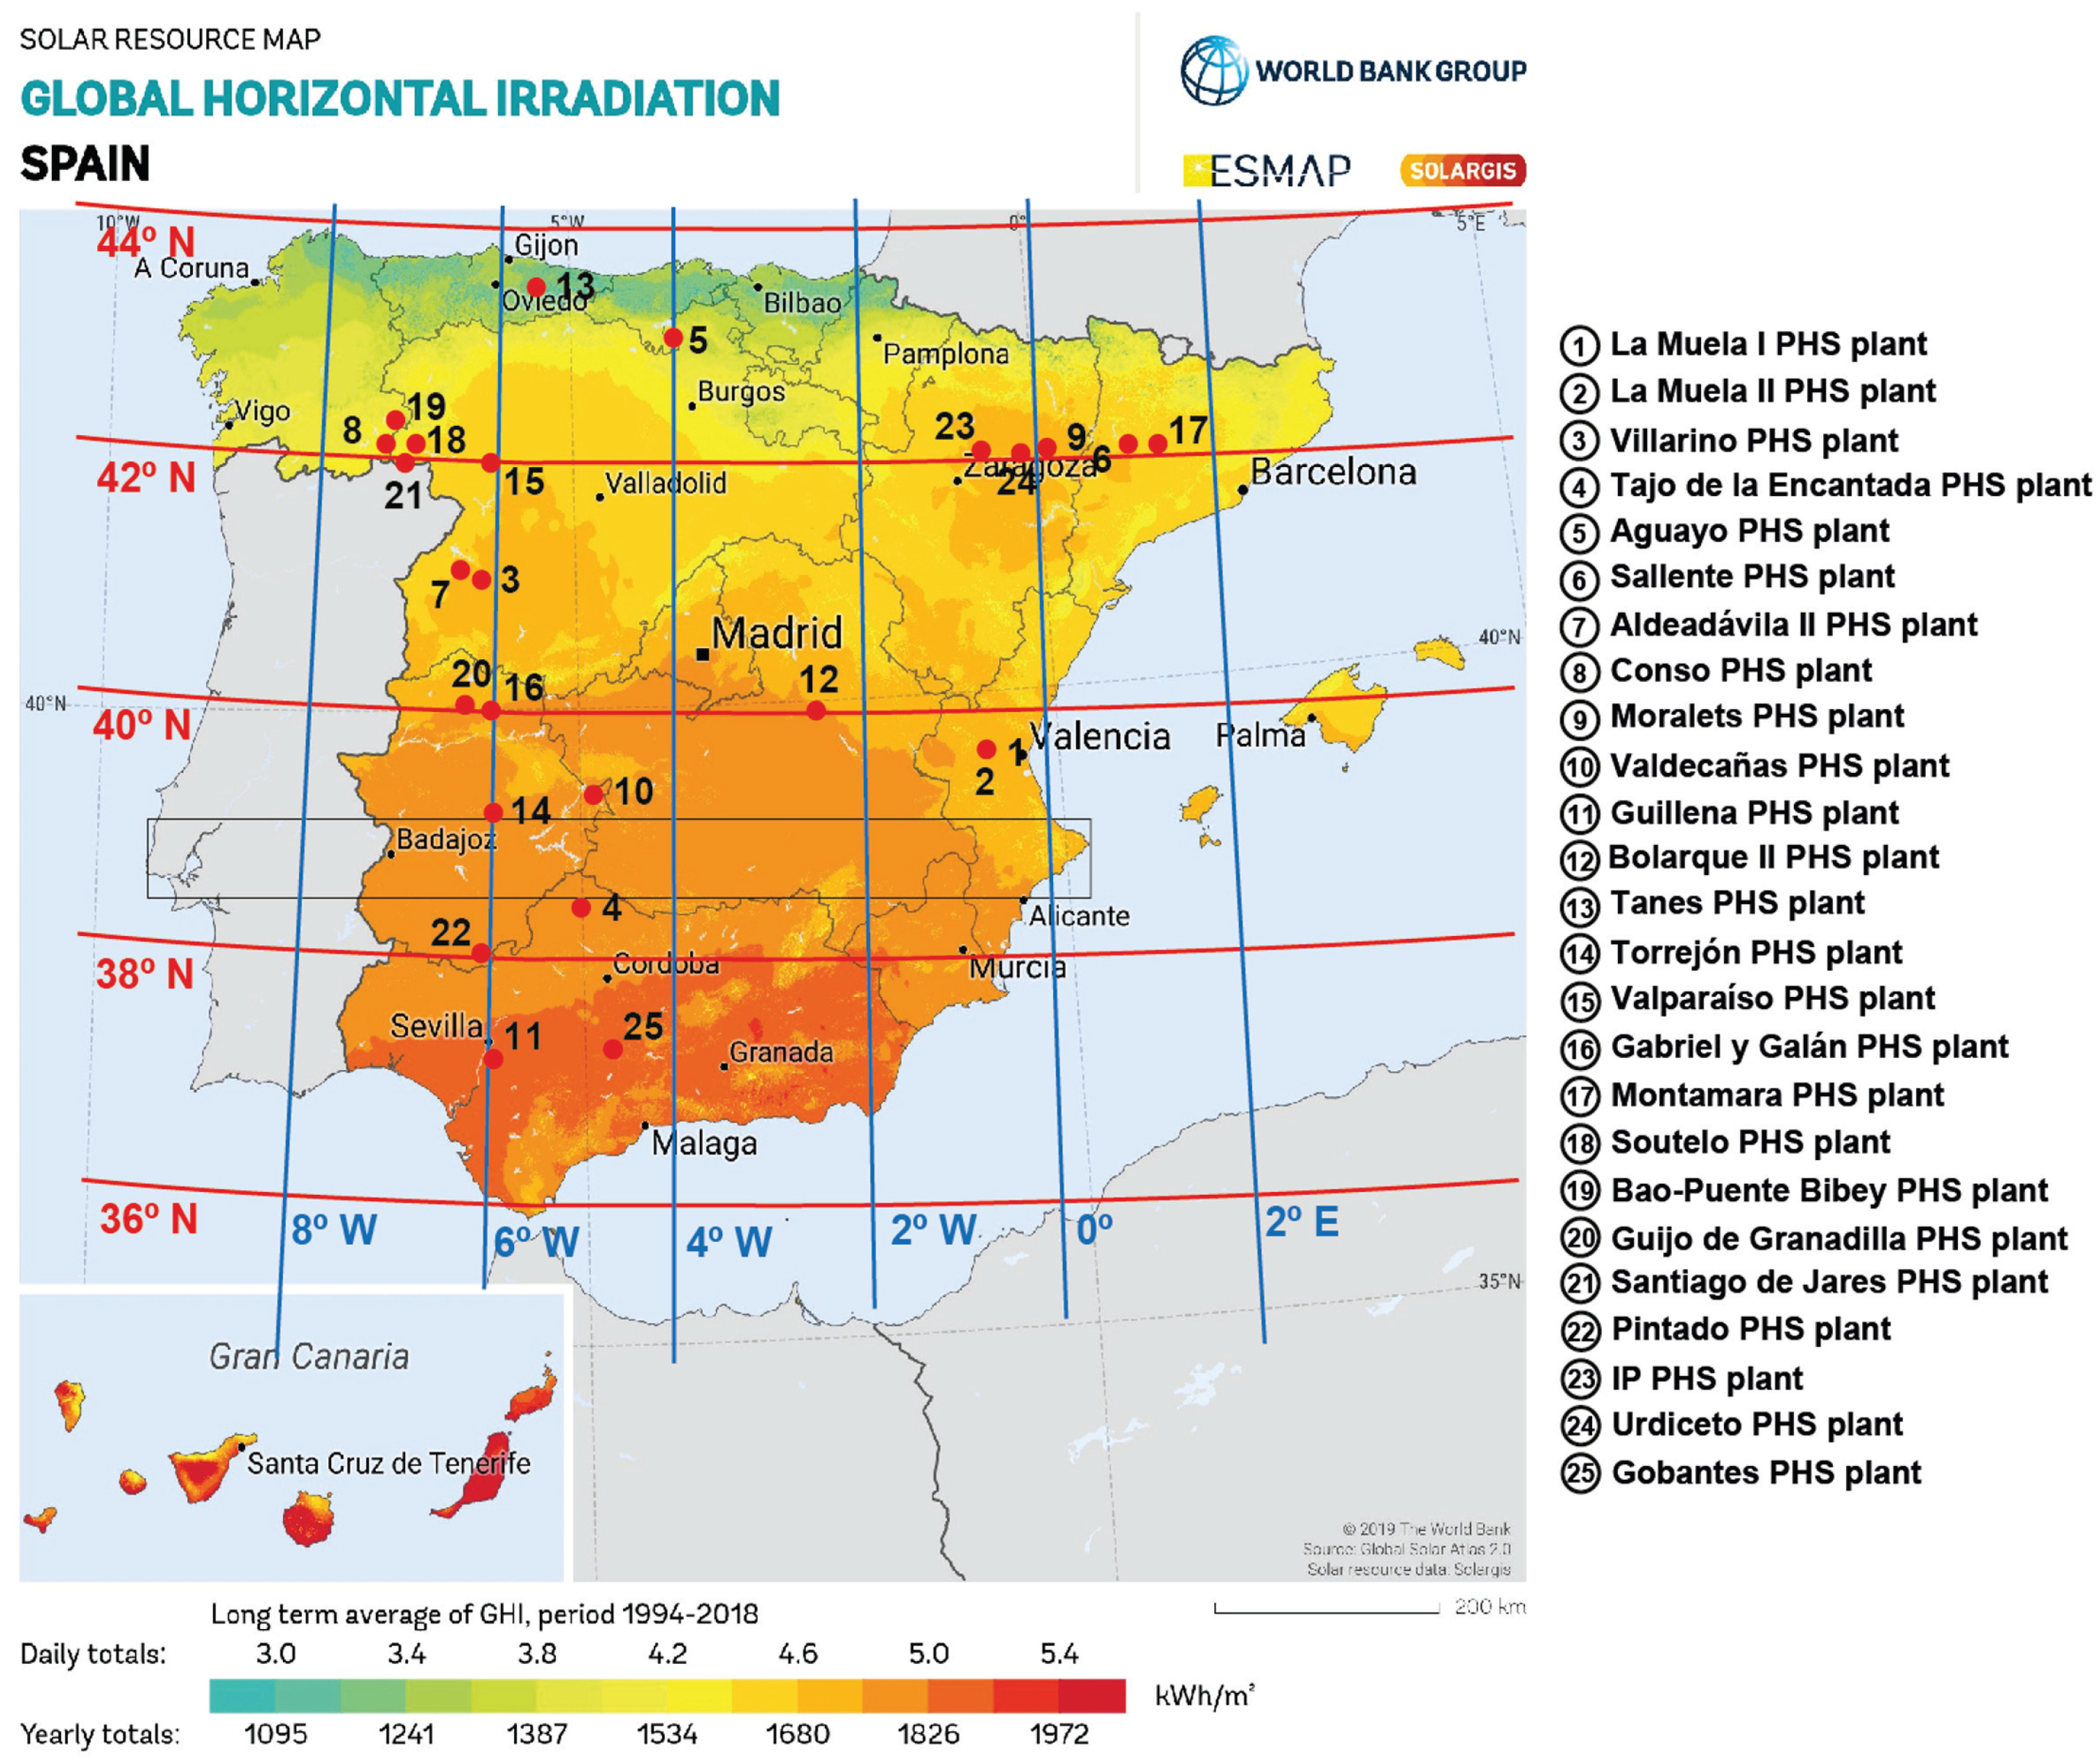
According to a report by International Hydropower and Dam Construction [24], there are 25 active PHS plants in Spain. This research focuses on analysing 25 active PHS plants in Spain. The study is based on a compilation of data provided by the electricity companies [4,25,26]. The data collected include: the name of each PHS plant, the name of the upper reservoirs, the latitudes, the longitudes, and the altitudes. Table 1 lists the locations of the PHS plants in Spain. A map of these locations is provided in Figure 2.

Table 1.
Location of pumped hydropower storage plants in Spain.

Figure 2.
Map showing the locations of pumped hydropower upper reservoirs in Spain.
In a PHS plant with a high-capacity upper reservoir, similar work [27,28] has considered that the effective head can be taken to be constant over the operating range, so the fixed-head PHS plant model can be used.
3. FPV Plant Design
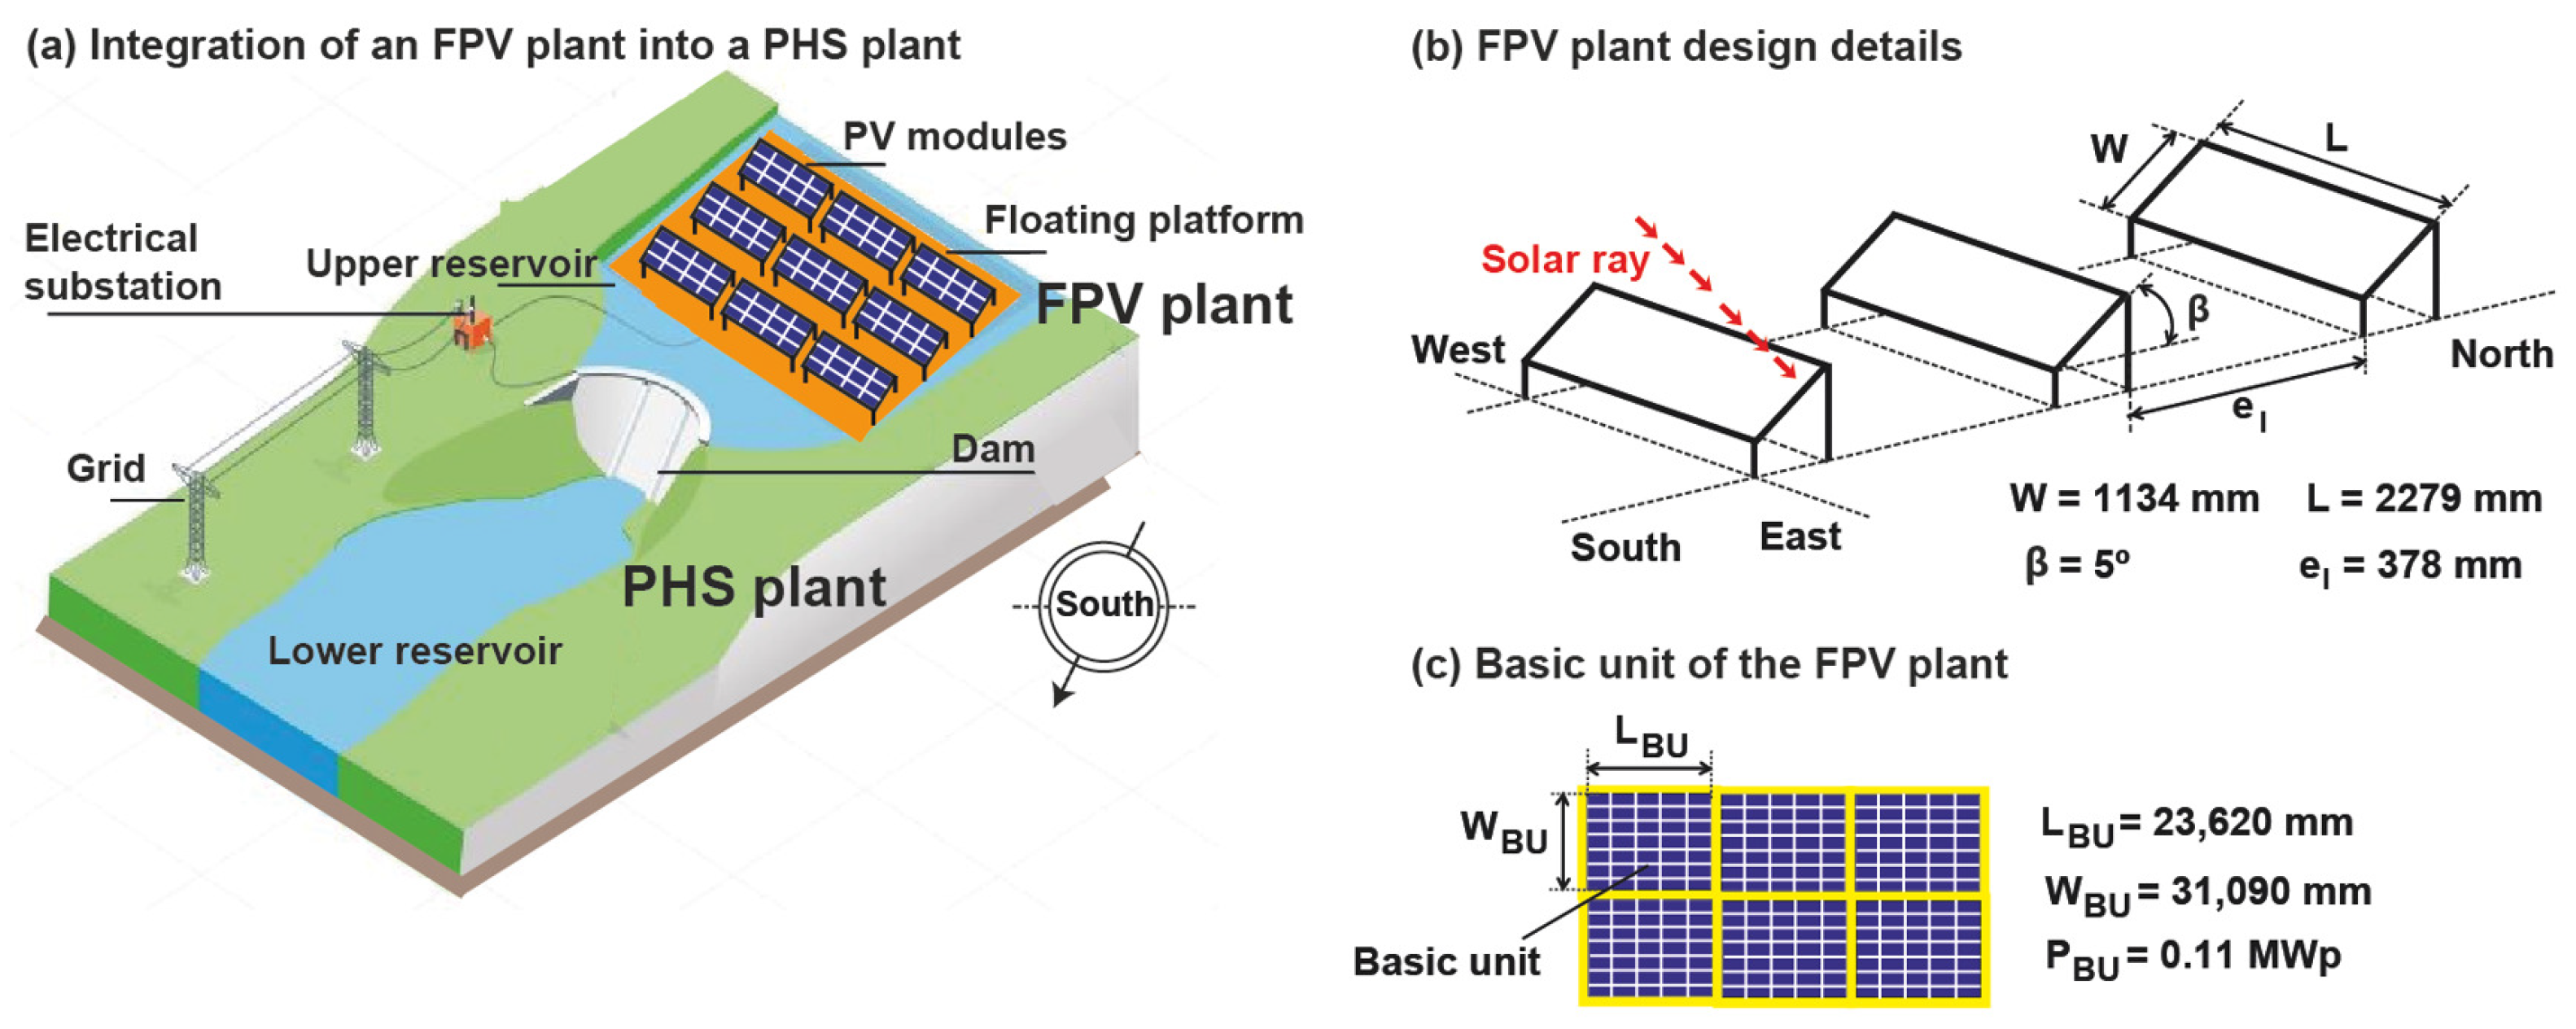
Using the data for a given PHS plant in Table 2, an FPV plant can be designed for installation in the upper reservoir of the PHS plant (see Figure 3a). The design of an FPV plant depends on several factors, such as: (i) the shape of the available area, (ii) the floating platform, (iii) the type of PV module, (iv) the tilt angle of the PV modules, (v) the orientation of the PV modules, (vi) the mounting system of the PV modules, (vii) the transversal and longitudinal installation distance, (viii) the albedo, and (ix) the weather conditions. These are essential aspects that are affected by the particular characteristics of an FPV plant. Each of these points will be discussed below:
Table 2.
Results obtained with the PVSyst software for the Gabriel y Galán PHS plant.
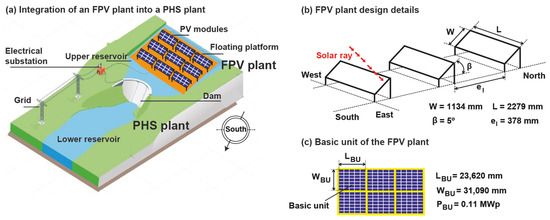
Figure 3.
Details of an FPV plant design.
- (i)
- The shape of the available area. FPV plant design is strongly influenced by the constructional shape of the floating platform. Irregular shaping of the available surface area is not possible with this type of plant, unlike with ground-mounted PV power plants. The design of an FPV plant more closely resembles the regularly shaped available surface [29]. Therefore, a rectangular shape is the norm for an FPV plant; although a combination of rectangular shapes can also be used [30,31]. Additionally, algorithms can help optimise the available surface area [32,33]. This study uses the optimisation algorithm presented by [33]. The shape and dimensions of the floating platform used in the design define the shape of the FPV plant.
- (ii)
- The floating platform. The floating platforms used to support PV modules in FPV plants can be designed in several different ways, which can be classified as follows [31]: (a) floating platforms equipped with floats covering the entire surface below the module, (b) floating platforms equipped with tubular flotation systems where PV modules are anchored, (c) top channel mounting systems, and (f) flexible floating platforms. System (a) was used in this study. There are several manufacturers of this type of floating platform: [34,35,36]. A flotation platform with the following dimensions was used in this design: (mm) [34]. A connecting floating body is also required as a support point during the construction and maintenance of the FPV system.
- (iii)
- The type of PV module. The PV module chosen is the NEOSUN NS-550M-144-M8, a monocrystalline module with 144 cells () from NEOSUN ENERGY [37]. The characteristics of the module are: power 550 (Wp); dimensions: 2279 (mm) (see Figure 3b), and surface area: (m2).
- (iv)
- The tilt angle of the PV modules. The choice of the tilt angle of the PV modules is directly related to the stability of the modules. Therefore, the criterion of maximising the incident solar irradiance on the PV modules used in ground-mounted PV plants does not apply to this type of plant [20]. Factors such as wind loads, waves and water currents limit the tilt angle of a PV module. Therefore, commercial floating platforms allow the following standard values for the tilt angle: 5 (°) [34,35], 12 (°) [35], and 15 (°) [36]. The FPV plant design features floating platforms that can withstand wind loads of 180 (km/h) with a tilt angle of 5 (°) [34]. Failure to use the optimum tilt angle would result in energy losses of between and for the locations of the PHS plants in Spain [38].
- (v)
- The orientation of the PV modules. As the PHS plants are located in the northern hemisphere, the optimal orientation is 0 (°) [39].
- (vi)
- The mounting system of the PV modules. Although PV module mounting systems used in ground-mounted PV plants can be of a fixed or variable tilt angle, only fixed tilt angle mounting systems were used due to the fact that module stability is the predominant criterion in the FPV plant design. Furthermore, among all possible configurations used in ground-mounted PV plants [32]: , , , , only the configuration was used in the design of the FPV plants in this study (see Figure 3b).
- (vii)
- The transversal and longitudinal installation distance. The transverse and longitudinal installation distances are imposed by the floating platform [34] used in the plant design. These distances in the chosen model are [34]: the transverse installation distance— (mm) and a longitudinal installation distance— (mm) (see Figure 3b).
- (viii)
- The albedo. Albedo is a parameter that affects the reflected component of the solar irradiance incident on the PV module. Albedo ranges from [6,40,41] to [6] for water bodies. A value of was taken into account with this design.
- (ix)
- The weather conditions. Incident solar irradiance data over a horizontal surface is essential for estimating the electricity production of an FPV plant. As it is unlikely that a meteorological station will be available at the upper reservoir to record the components of the global solar irradiance over a horizontal surface, models must be used to estimate them. Software that provides the necessary solar irradiance data to estimate the electricity production of an FPV plant is available on the market, e.g., Meteonorm [42], PVGIS [43], Solcast [44], etc. The latitude and altitude of the location under study are the input for such software. Meteonorm software version 8.0 was chosen for use in this study.
Taking into account some of the above factors, a basic unit comprised of PV modules (for a total of 200 PV modules) was chosen (see Figure 3c). The basic unit has a nearly square shape with the dimensions (m) ( (m2)), and a power of (MWp). Each basic unit is surrounded by floating connection bodies with the dimensions (mm) [34]. Each FPV plant consists of a certain number of basic units depending on the characteristics of the PHS plant.
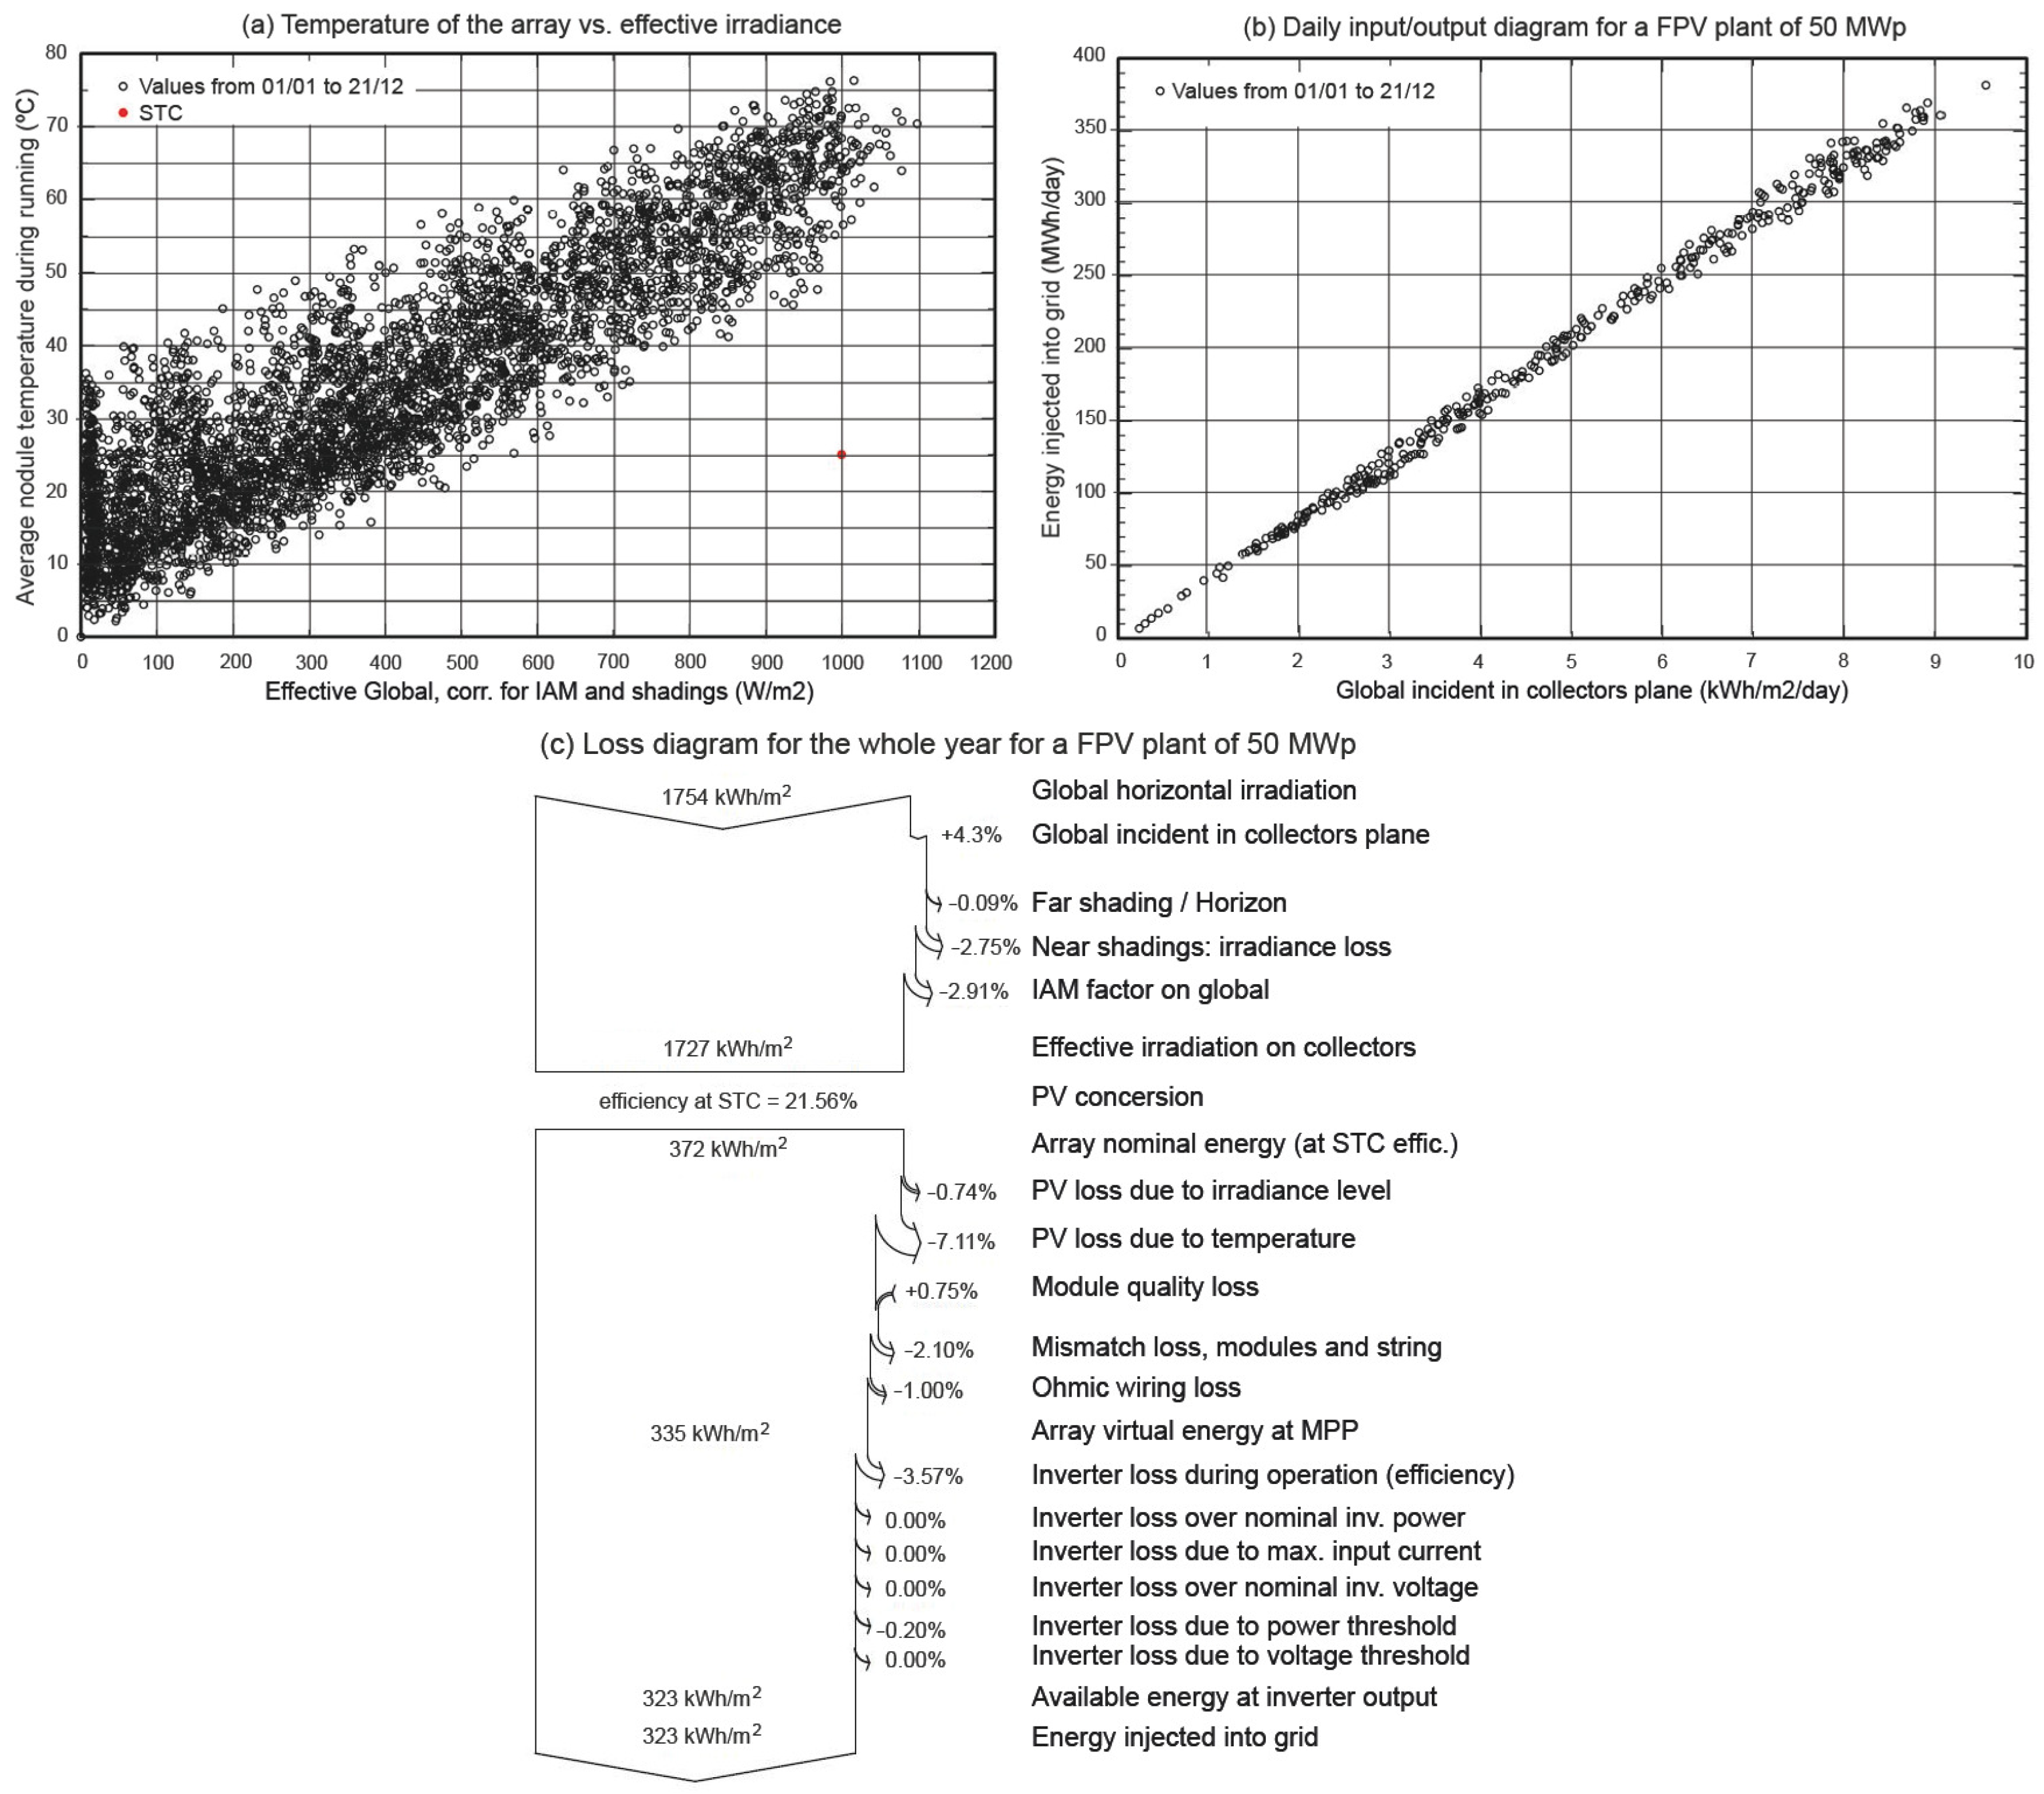
Once the FPV plant was designed, the PVSyst software version 7.2 [45] was used to calculate the electrical power generated by the plant. The PVSyst software is was used in studies similar to the one presented here [16,46,47]. Meteorological data such as solar irradiance, ambient temperature, etc., were obtained from the Meteonorm software [42] for each upper reservoir location. The Meteonorm software version 8.0 is integrated into the PVsyst software version 7.2 [45].
In this paper, the PVsyst software is used for the simulation. All results have been generated by the simulation process for each of the locations under study. The simulation obtained with the PVsyst software considered: PV temperature loss, module quality loss, mismatch loss, modules and strings, ohmic loss of the cabling, inverter loss during operation, far shading and near shading. Figure 4 shows several illustrations provided by the PVsyst software version 7.2 for the Gabriel y Galán PHS plant.

Figure 4.
Illustrations provided by PVsyst software for the Gabriel y Galán PHS plant.
Table 2 shows the main results obtained with the PVSyst software for the Gabriel y Galán PHS plant.
4. Assessment Indicators
A series of assessment indicators needs to be established in order to assess the potential of floating photovoltaic plants on pumped storage reservoirs in Spain.
The electrical energy production of an FPV plant depends on several factors, such as the solar potential, electrical efficiency, tilt angle of the PV modules, orientation of the PV modules and size of the FPV plant. These factors further depend on other parameters. For example, the electrical efficiency depends on the technology used to manufacture the PV module, ambient temperature and solar irradiance incident on the module. The choice of the size of the FPV plant also depends on several parameters, such as the assigned grid connection capacity of the corresponding PHS plant, volume of water in the upper reservoir, water surface in the upper reservoir and operating time of the PHS plant.
Due to the large number of parameters involved in the generation of electrical energy through an FPV plant, limiting the scope of the parameters was believed to be essential considering that the optimal orientation of the PV modules was used in the plant design and that the tilt angle of the PV modules is appropriate for this type of plant. Therefore, the selected assessment indicators are as follows: the solar potential, electrical efficiency, and size of the FPV plant (the assigned grid connection capacity, volume of water in the upper reservoir and water surface in the upper reservoir).
The solar potential criterion is a criterion frequently used to discard PV plant locations by power generation companies, as it is related to the years of amortisation of the PV plant and the LCOE (Levelised Cost of Electrical Energy). The electrical efficiency criterion is directly related to the power generation of the plant, and therefore to the years of amortisation of the PV plant and to the LCOE. The criterion related to the increase in the assigned grid connection capacity is one of the most influential in the decision making of power generation companies [4,25,26]. Obviously, the criterion of the water surface in the upper reservoir also limits the size of the FPV plant. The criterion for the volume of water in the upper reservoir is directly related to the pumping mode of the PHS plant and the operating head of the PHS plant. These criteria can be ordered from most to least relevant, as follows: (i) solar potential, (ii) water surface in the upper reservoir, (iii) assigned grid connection capacity, (iv) volume of water in the upper reservoir and (v) electrical efficiency. Each of these assessment indicators will be discussed below.
4.1. Solar Potential
This criterion is very important, as it can exclude PHS plants where the solar potential is not suitable for citing FPV plants. As electricity production is directly related to incident solar irradiance, most PV plant projects consider solar irradiance as one of the most important selection criteria. Estimating the minimum solar irradiance for a PV plant to be economically viable is by no means easy.
The global horizontal irradiation (GHI), defined as the total amount of solar irradiance received on a horizontal surface, is often considered the ideal criterion for PV plant projects [48,49], as it is the sum of the beam solar irradiation on a horizontal surface and the diffuse solar irradiation on a horizontal horizontal surface. Another important aspect of the choice of the GHI as a criterion is its availability. Applications such as Meteonorm [42], PVGIS [43] and SOLARGIS [50] provide these values anywhere in the world. Figure 5 shows a solar map of the global horizontal irradiation for Spain, where the PHS plants are located [50].

Figure 5.
Global irradiance map for the horizontal surface in Spain where the PHS plants are located. This map is published by the World Bank Group, funded by FSMAP, and prepared by Solargis. For more information and terms of use, please visit: http://globalsolaratlas.info, accessed on 7 January 2024.
Table 3 provides a list of the annual average global horizontal irradiations proposed by various authors to ensure the economic viability of PV systems.
Table 3.
Annual average global horizontal irradiation.
The most conservative criterion was chosen for this study:
The global horizontal irradiance ratio () will be used to analyse the deviation with Criterion 1. This relationship is defined as:
where the subscript ∗ represents the location of the PHS plant under study, and the subscript Criterion 1 represents the value of the global horizontal irradiance chosen as a criterion to ensure the economic viability of the FPV plant. Notice that a value of greater than 1 implies that Criterion 1 is fulfilled.
4.2. Electrical Efficiency
The electrical efficiency of a PV module represents the module’s efficiency in converting incident solar irradiance into electrical energy. This efficiency depends mainly on three parameters: the incident solar irradiance, ambient temperature and type of manufacturing technology of the PV module.
The electrical efficiency of a PV module is provided by the manufacturer, but for a certain operating point, the so-called reference operating point (), and is characterised by an incident solar irradiance of (W/m2) and an operating temperature of the PV module of (°C) (Standard Test Condition (STC)).
The electrical efficiency of the PV module can be expressed by Equation (3) under other conditions of temperature () and incident solar irradiance () than the reference conditions [54]:
where is the electrical efficiency in the operating point, is the electrical efficiency of the reference operating point, and is the temperature coefficient (1/°C). The is one of the datum shown in the PV module datasheet.
According to Equation (3), the electrical efficiency decreases if the operating temperature of a PV module exceeds 25 (°C). Therefore, the electrical efficiency can be determined if the operating temperature is found with Equation (3). There are many models to determine the [55], whose value depends on the ambient temperature, the incident solar irradiance and the wind speed [56]. Mattei et al. [57] presented a model that provides satisfactory results. Mattei’s model is as follows:
where is the ambient temperature (°C), is the normal operating cell temperature (°C), and is the solar irradiance (W/m2). The is determined under the following conditions: (W/m2), (°C), and 1 (m/s) wind speed at the PV module level.
Mattei’s model was based on ground-mounted PV plants. However, due to the environmental conditions of FPV plants, the electrical efficiency theoretically increases in value [5,6,40,58]. This increase can range from to [40], [5], [6], and [58].
In this study, [5] was chosen as the increase over Equation (3). The criteria chosen are as follows:
The electrical efficiency ratio () is used to analyse the deviation with Criterion 2. This relationship is defined as:
where is the electrical efficiency in the operating point and is the electrical efficiency of the reference operating point. Notice that a value of greater than 1 implies that Criterion 2 is fulfilled.
4.3. The Size of the FPV Plant
The size of an FPV plant can be determined on the basis of several technical and economic factors. As the electricity market conditions influence the size of the FPV plant [20], the possible modes of operation of both plants have to be defined first. In [15], the possible operating modes of both plants under electricity market conditions are defined as: (i) independent operation of the PHS and FPV plants, (ii) joint operation of the PHS and FPV plants, and (iii) energy storage operation of the PHS and FPV plants. In mode (i), the two plants sell electricity independently but are limited by the assigned grid connection power. In mode (ii), the two plants sell electricity jointly but are limited by the allocated grid connection power. In mode (iii), the two plants store energy together, and are obviously not limited by the assigned grid connection power. Figure 6 shows a diagram of the three modes of operation analysed.
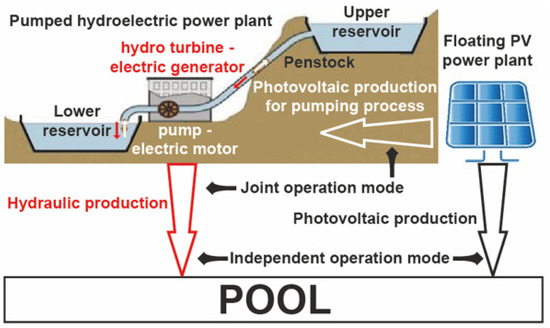
Figure 6.
Operating modes of a PHS plant and an FPV plant [15].
The number of operating hours of the PHS plant depends on several criteria such as the availability of water and the hours of the peak electricity selling price. For example, Figure 6 shows two examples of this criterion.
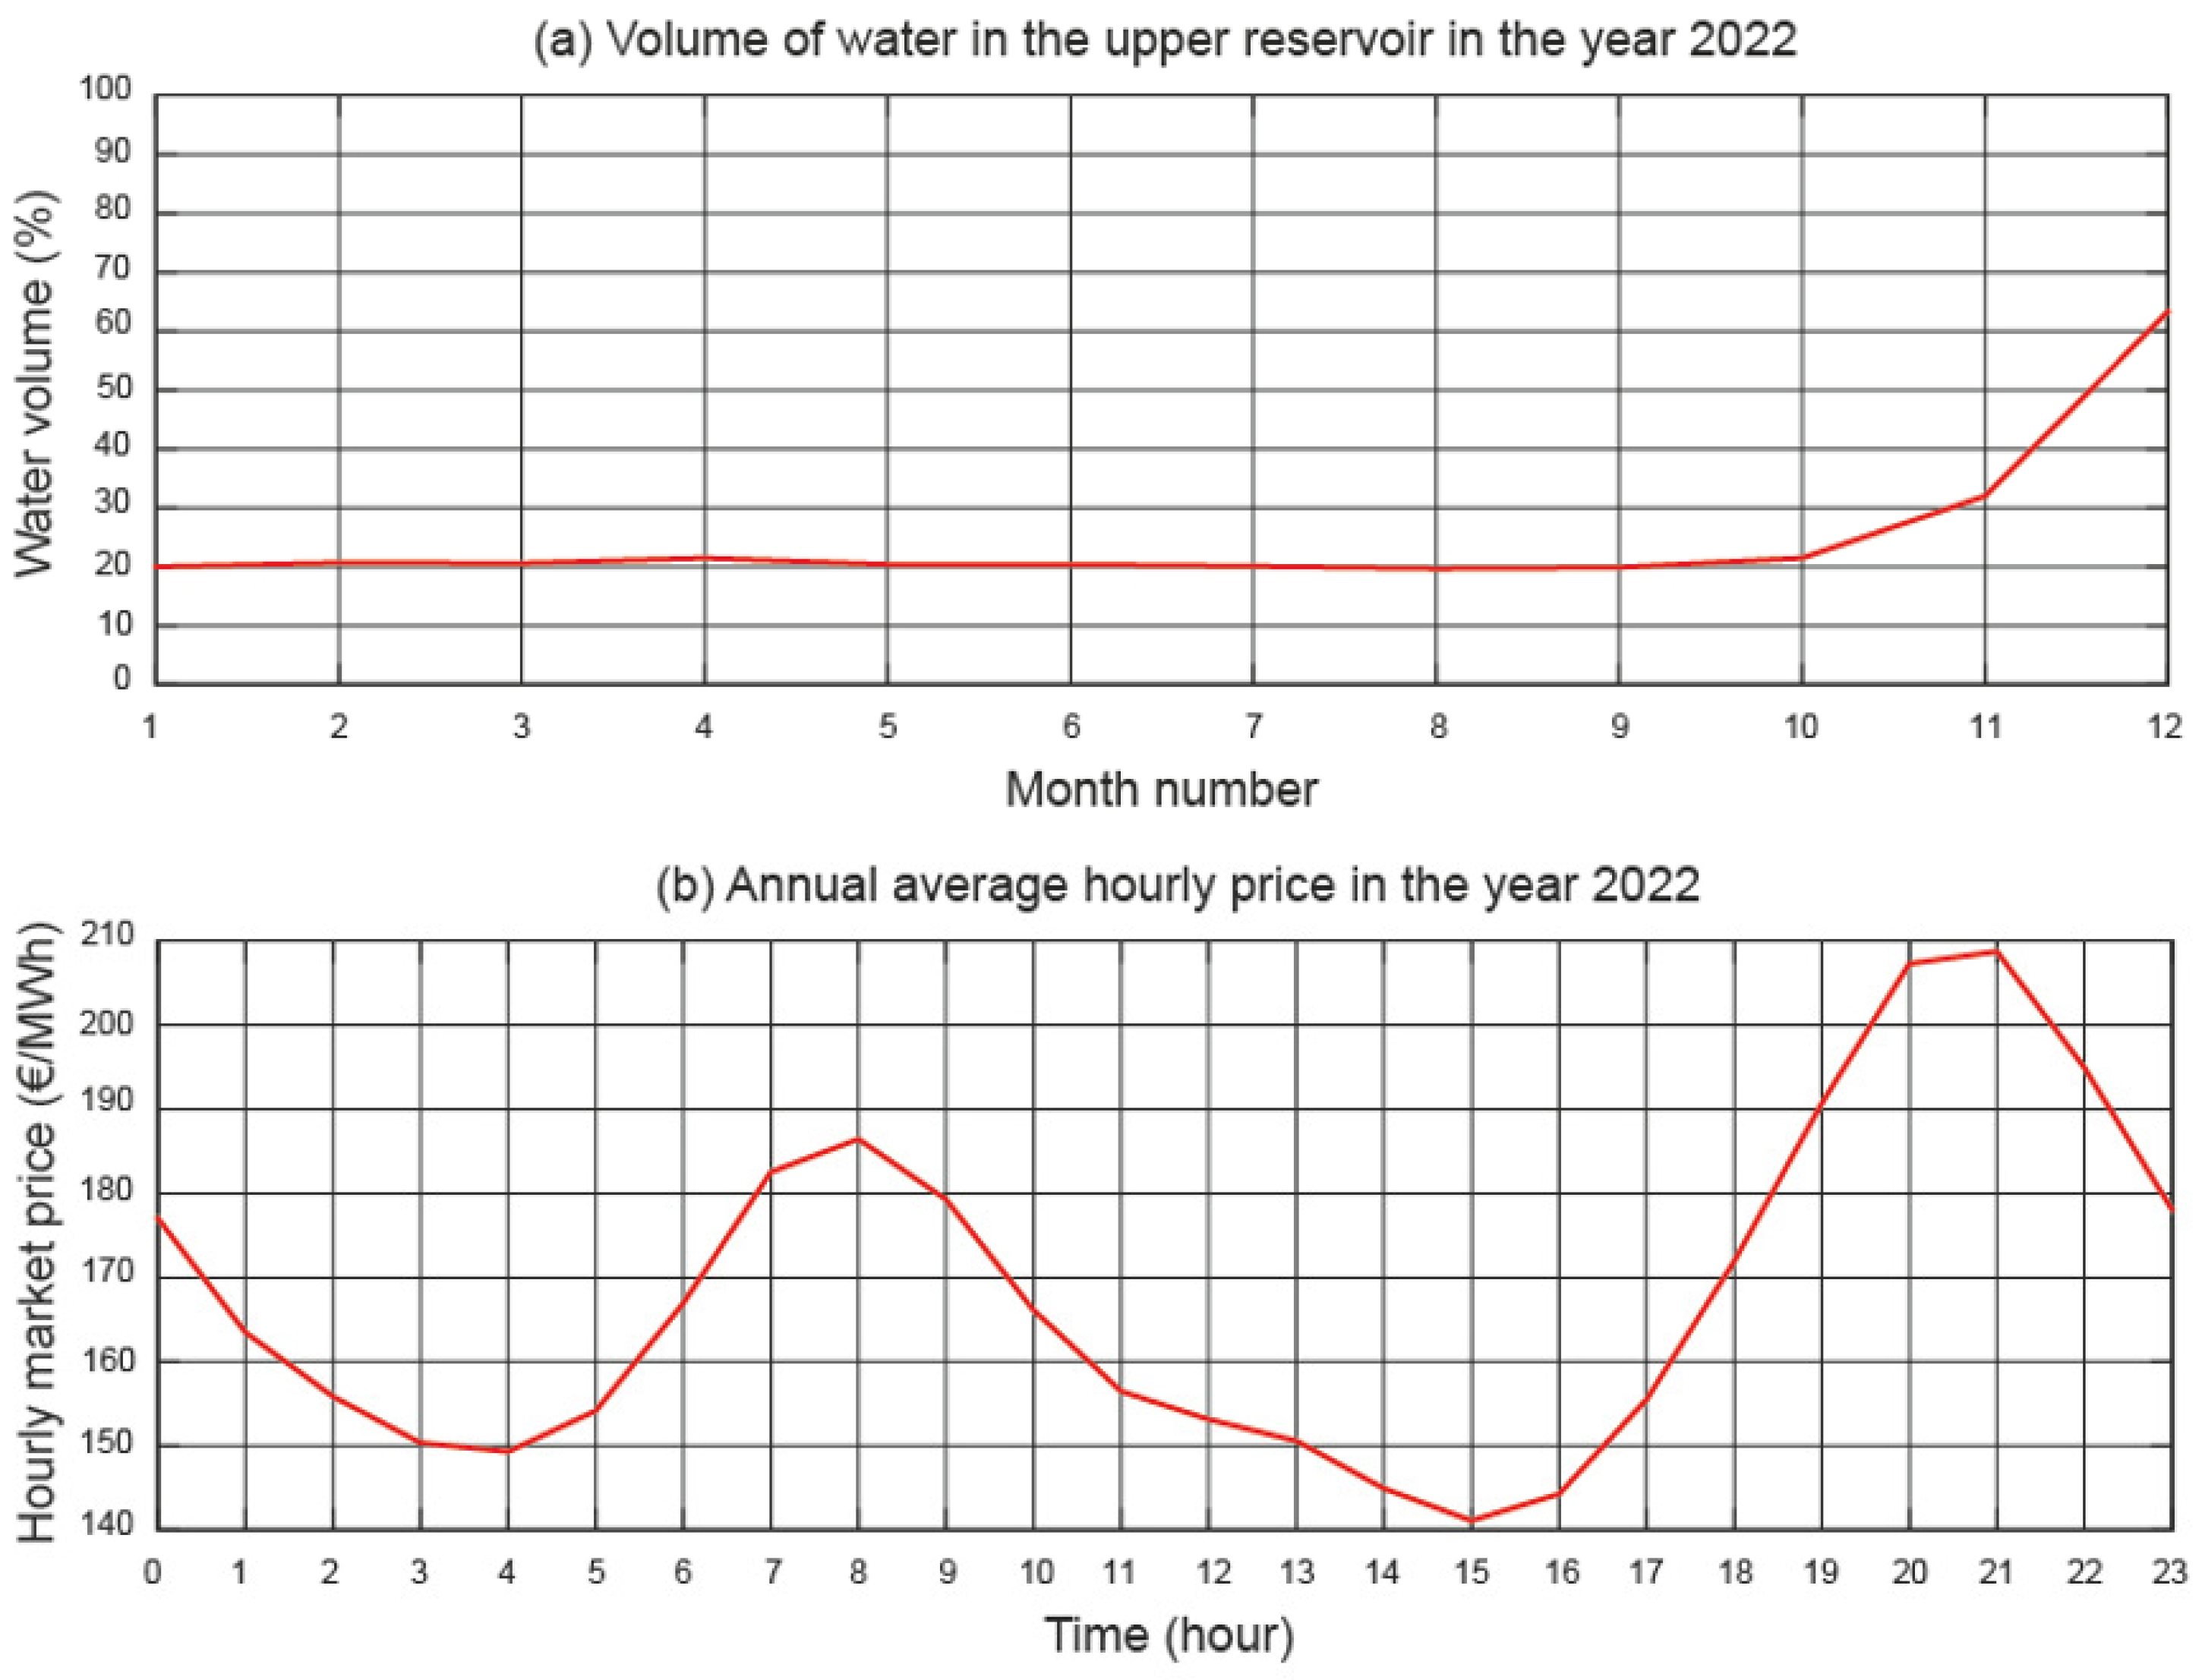
The water resources in the upper reservoir are needed for human consumption and agriculture, and therefore take precedence over the use of water for power generation. An ecological flow to satisfy the human consumption of water and agriculture requires a minimum level of water from the upper reservoir. Low rainfall results in low water levels in the upper reservoirs of PHS plants, which means the plant is idle for long periods of time. The year 2022 was particularly dry, and the trend is for continued low rainfall over time. Figure 7a shows the water volume of the upper reservoir of a PHS power plant on the Iberian Peninsula (Alto Rabagão) during the year 2022 [59]. This figure shows that the upper reservoir level was approximately for almost all months of the year and therefore the PHS plant was not operational [20].
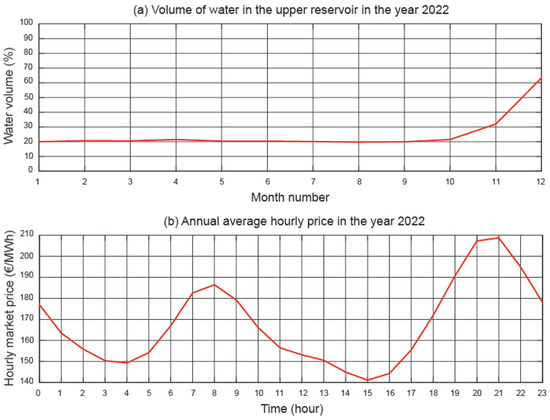
Figure 7.
Operating time of the PHS plant.
The annual average hourly price is shown in Figure 7b. This example refers to the Iberian marginal market for the year 2022. The four hours with the highest prices and therefore the most suitable times to sell electricity are from 19:00 to 22:00. The FPV plant is obviously idle during these hours. In contrast, the most suitable times for the pumping process are the hours between 13:00 and 16:00. It should be noted that the hours with the lowest electricity selling prices are when the FPV plant generates the most electricity. The operating time of the PHS plants for this study was considered to be during the four hours with the highest prices.
Here are some key criteria that influence the choice of the size of an FPV plant: the assigned grid connection capacity of the corresponding PHS plant, the volume of water in the upper reservoir, and the water surface in the upper reservoir.
4.3.1. Assigned Grid Connection Capacity of the Corresponding PHS Plant
The assigned grid connection capacity of a PHS plant is the right to use a certain connection line up to a certain capacity for the transmission of electrical energy from the PHS plant. Therefore, PHS plants have an assigned grid connection capacity which cannot be exceeded. Therefore, the power generated of the FPV plant is related to the assigned grid connection capacity of the PHS plant. Modes of operation (i) and (ii) are limited by this value. The power generated by a hydropower plant can be determined by the equation [60]:
where is the power output of the synchronous generator (W), is the hydraulic power (W), is the hydro turbine efficiency (%), is the electric generator efficiency (%). The output of a PHS plant is defined by its design . The hydraulic power can be determined by the equation [60]:
where is the hydraulic power (W), is the density of water (kg/m3), g is the acceleration due to gravity (m/s2), is available head (m), and is the turbined flow rate (m3/s). The and the are design parameters, so it may happen that these values are not available during the entire plant operating time.
Equation (9) shows the criteria for defining the size of an FPV plant as a function of the assigned grid connection capacity of a PHS plant:
where is the power of the FPV plant (W), and is the assigned grid connection capacity of the corresponding PHS plant (W).
To meet Criterion 3, a certain area of water body is required. The area required ratio () was used to assess this criterion. It is defined as the number of times the area of the upper reservoir is needed to install the corresponding PHS plant power. This relationship is defined as
where is the surface area of the FPV plant (m2) and is the surface area of the upper reservoir. Notice that a value of less than 1 implies that Criterion 3 is fulfilled.
4.3.2. Volume of Water in the Upper Reservoir
The size of an FPV plant can also be selected to supply the electrical power needed to raise the reservoir water level above a certain level by using the PHS plant pumping mode of operation. Therefore, the volume of water in the upper reservoir also limits the size of the FPV plant.
The PHS plant pumping mode of operation is related to the mode of operation (iii). The pumping power of a PHS plant is usually lower than the power plant power output. The elevating power can be determined by the equation [60]:
where is the elevating power (W), is the density of water (kg/m3), g is the acceleration due to gravity (m/s2), is the elevating head (m), and is the pumped flow rate (m3/s). Therefore, the electrical power absorbed in the pumping process is:
where is the electrical power absorbed in the pumping process (W), is the elevating power (W), is the electric motor efficiency (%), and is the pump efficiency (%).
The equation to calculate the potential energy stored in the upper reservoir is:
where is the potential energy stored (Ws), is the density of water (kg/m3), V is the volume of water (m3), g is the acceleration due to gravity (m/s2), and is the available head (m). The volume of water associated with this potential energy is:
The volume of water in the upper reservoir is . Based on the possible volume of water to be pumped, the size of the plant required to supply the electrical power for pumping this volume of water can be determined with the equation:
where is the power of the FPV plant (W), is the electric motor efficiency (%), is the pump efficiency (%), is the volume of water in the upper reservoir (m3), is the density of water (kg/m3), g is the acceleration due to gravity (m/s2), is elevating head (m), t and is the time during which the water is pumped (s).
Two assessment indicators will be discussed in this section: (i) the area needed to install the FPV plant to generate the energy required to be able to pump the water to be turbined every day, and (ii) the volume of water that can be pumped if the entire available area of the upper reservoir is used to install the FPV plant.
The first assessment indicator suggests pumping the water from the lower reservoir to the upper reservoir that was turbined the day before, using the electrical energy generated by the FPV plant. The area needed to install the FPV plant to obtain this electrical energy will be determined. The pumping area ratio () was used to assess this criterion. It is defined as the number of times the area of the upper reservoir is needed to install the corresponding PHS plant power to generate the energy needed to pump the water to be turbined every day. This relationship is defined as:
where is the surface area of the plant (m2) to generate the energy needed to pump the water to be turbined every day, and is the surface area of the upper reservoir (m2).
The second assessment indicator answers the following: the volume of water that can be pumped per day with the available surface water body in the upper reservoir of the PHS plant, what volume of water can be pumped per day. To assess this criterion, the volume ratio of water pumped per day () was used. This relationship is defined as:
where is the volume of water pumped per day with the electrical energy generated by the FPV plant (m3), and is the volume of water in the upper reservoir (m3). Note that the higher the value of PVR, the better the performance of the FPV plant concerns this criterion.
4.3.3. Water Surface in the Upper Reservoir
The available surface area of the water body, whether such body is a pond, lake, reservoir, or any other water source, is a crucial factor. The size of the FPV plant should be compatible with the available space. A detailed study of the far shadows is needed in order to determine this available surface area.
where is the surface area of the FPV plant (m2) and is the surface area of the upper reservoir (m2).
A certain FPV plant power can be installed when the available water body surface in the upper reservoir is known. To assess this criterion, the achievable power ratio () was used. The is defined as the number of times the PHS plant power can be installed on the surface of the upper reservoir. This relationship is defined as:
where is the power of the FPV plant (W), and is the power of the PHS plant (W).
5. Results and Discussion
In this section, 25 PHS plants in Spain were examined to analyse the potential for implementing FPV plants in their upper reservoirs under various assessment indicators. These assessment indicators are: the global horizontal irradiance ratio, electrical efficiency ratio, area required ratio, pumping area ratio, volume ratio of water pumped per day, and achievable power ratio.
5.1. Analysis of Preliminary Data
The first step of the analysis consisted of collecting information on PHS plants installed in Spain. This information is as follows: (i) the turbine power, (ii) pumping power, (iii) head, (iv) flow rate, (v) upper reservoir capacity, and (vi) upper reservoir area. The following tools were used for such purposes: the electricity companies’ databases were used for points (i)–(v) [4,25,26], and Google Earth software version 7.3.6.9750 [61] was used for point (vi) to accurately measure the reservoir surface data. Table 4 shows the characteristics of each PHS plant under study. The combined area of the 25 hydropower upper reservoirs investigated amounts of 28,363.8 (ha).
Table 4.
Parameters of the pumped hydropower storage plants under study.
5.2. FPV Plant Design
In Section 3, a basic FPV plant unit was designed. Table 5 shows the annual average global horizontal irradiation (GHI), the annual average ambient temperature (), the annual average operating temperature of the PV module (), and the electricity production.
Table 5.
Meteorological values of the locations under study and electricity production.
5.3. Solar Potential
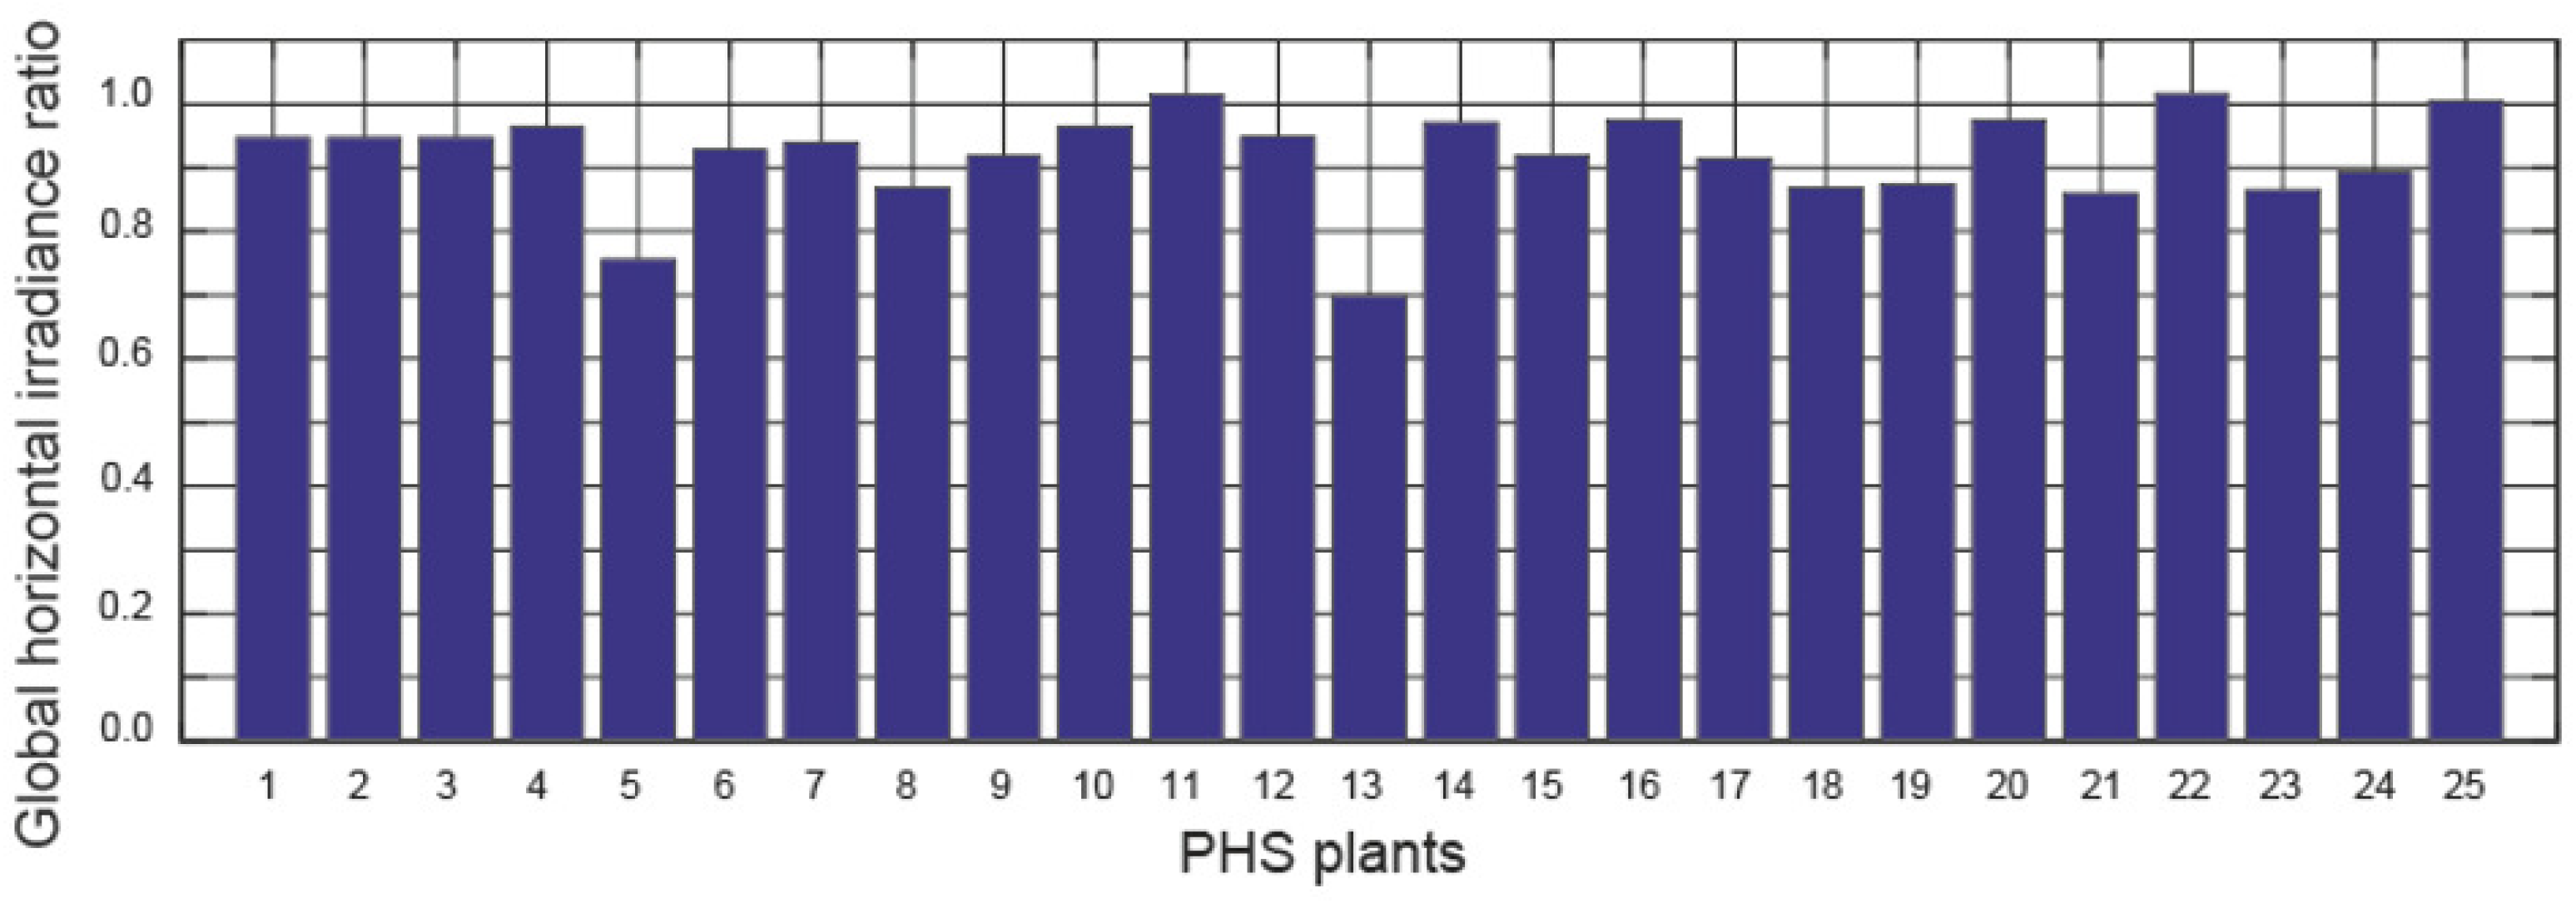
The global horizontal irradiance ratio () is used to analyse the deviation with Criterion 1. Figure 8 shows the global horizontal irradiance ratio for each PHS plant location.
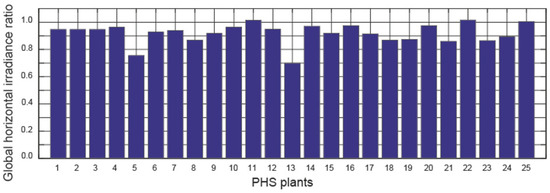
Figure 8.
Global horizontal irradiance ratio.
The following conclusions can be drawn from Figure 8:
- (i)
- The following hydropower plants meet this criterion: Guillena, Pintado and Gobantes.
- (ii)
- The following hydropower plants are between and of this criterion: La Muela I, La Muela II, Villarino, Tajo de la Encantada, Sallente, Aldeadávila II, Moralets, Valdecañas, Bolarque II, Torrejón, Valparaíso, Gabriel y Galán, Montamara, Guijo de Granadilla and Urdiceto.
- (iii)
- The following hydropower plants are between and of this criterion: Conso, Soutelo, Bao-Puente Bibey, Santiago de Jares and IPt.
- (iv)
- The Aguayo PHS plant is between and of this criterion.
- (v)
- Finally, the Tanes PHS plant is below of this criterion.
It can be considered that the Tanes PHS plant and the Aguayo PHS plant are not recommended for the implementation of an FPV plant in their upper reservoir.
5.4. Electrical Efficiency
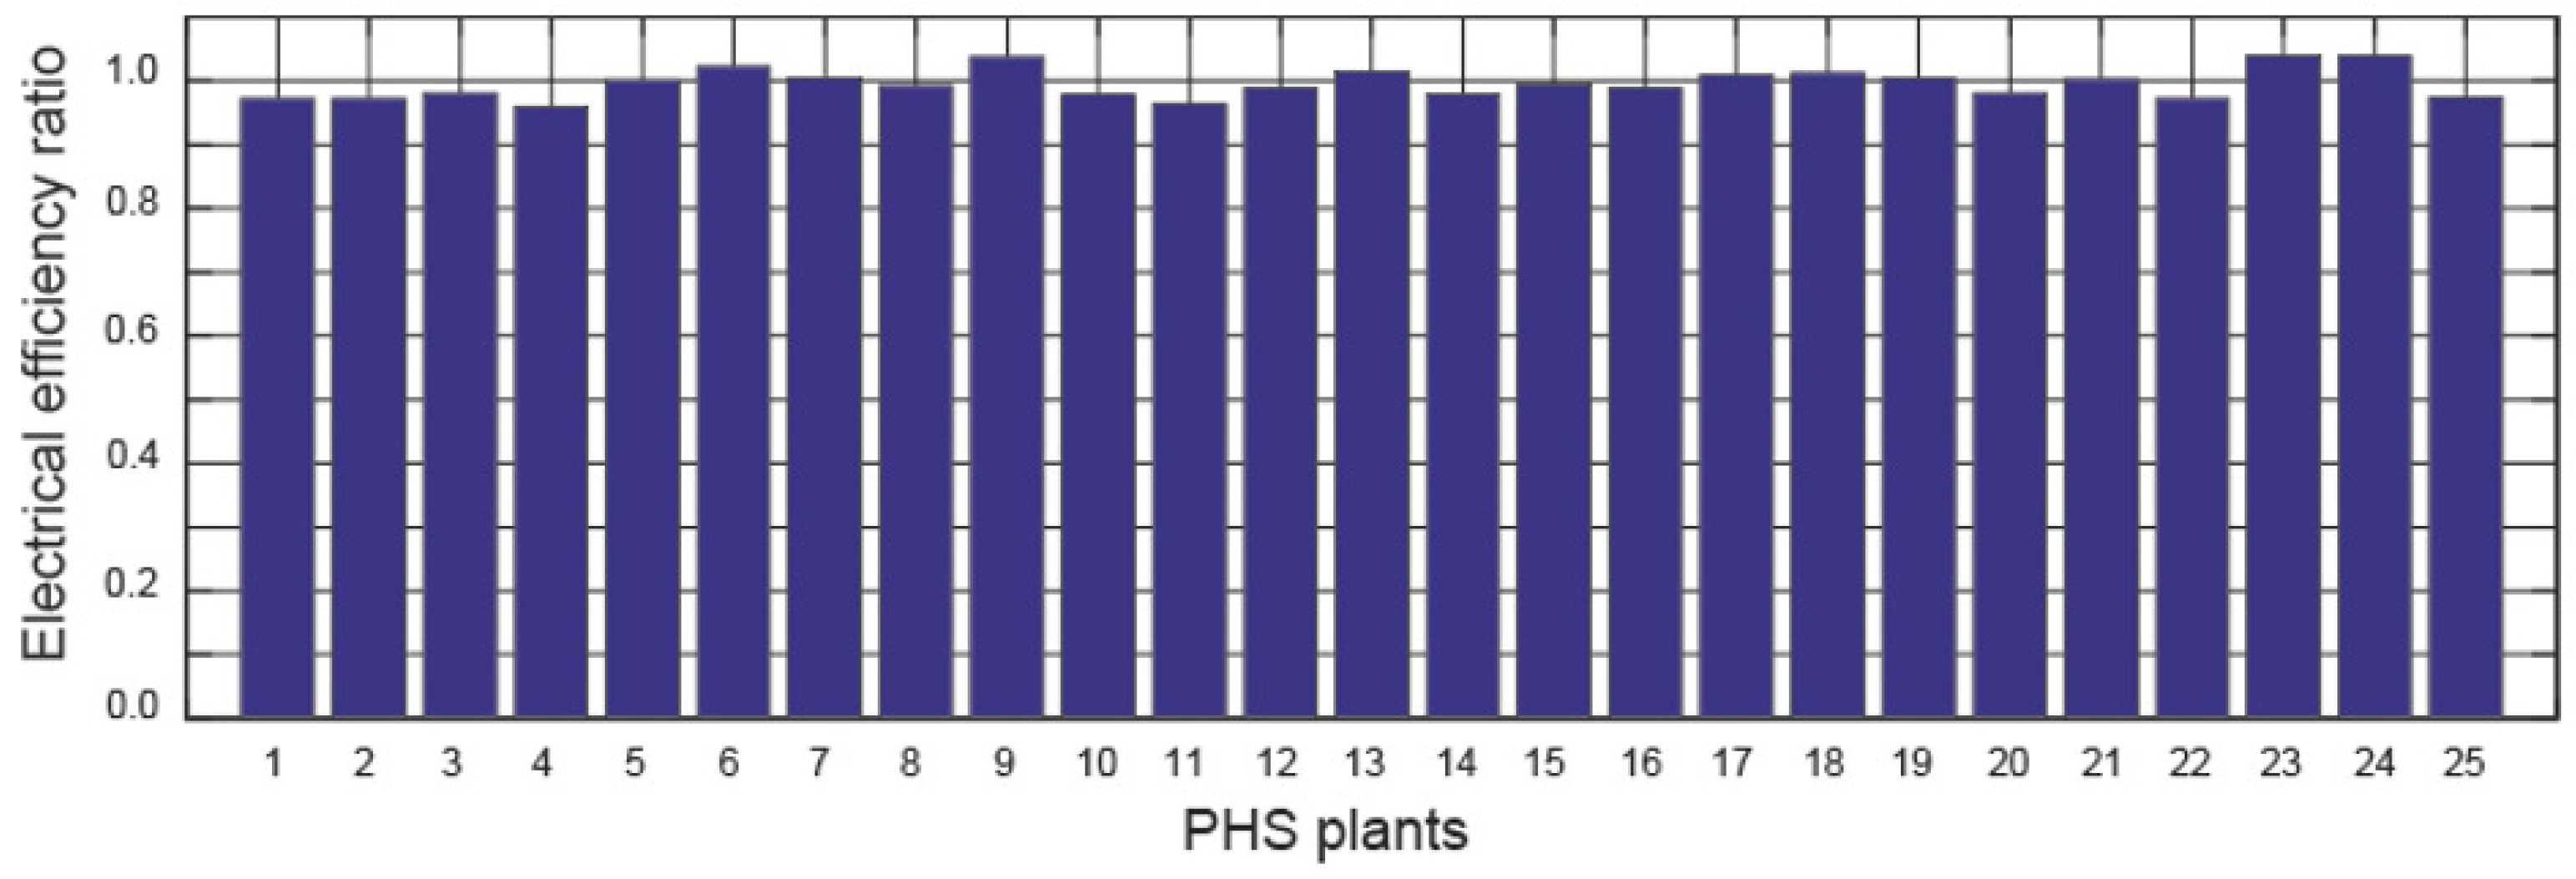
The electrical efficiency ratio () is used to analyse the deviation with Criterion 2. Figure 9 shows the electrical efficiency ratio for each FPV plant.
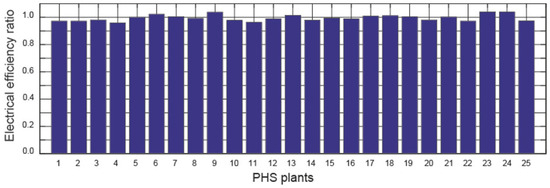
Figure 9.
The electrical efficiency ratio of the PHS plants under study.
The following conclusions can be drawn from Figure 9:
- (i)
- The following hydropower plants meet this criterion: Aguayo, Sallente, Aldeadávila II, Moralets PHS, Tanes, Montamara, Soutelo, Bao-Puente Bibey, Santiago de Jares, IP and Urdiceto.
- (ii)
- The following hydropower plants are between and of this criterion: La Muela I, La Muela II, Villarino, Tajo de la Encantada, Conso, Valdecañas, Guillena, Bolarque II, Torrejón, Valparaíso, Gabriel y Galán, Guijo de Granadilla, Pintado and Gobantes.
All the PHS plants can be considered suitable for the implementation of an FPV plant in their upper reservoir.
5.5. Assigned Grid Connection Capacity of a PHS Plant
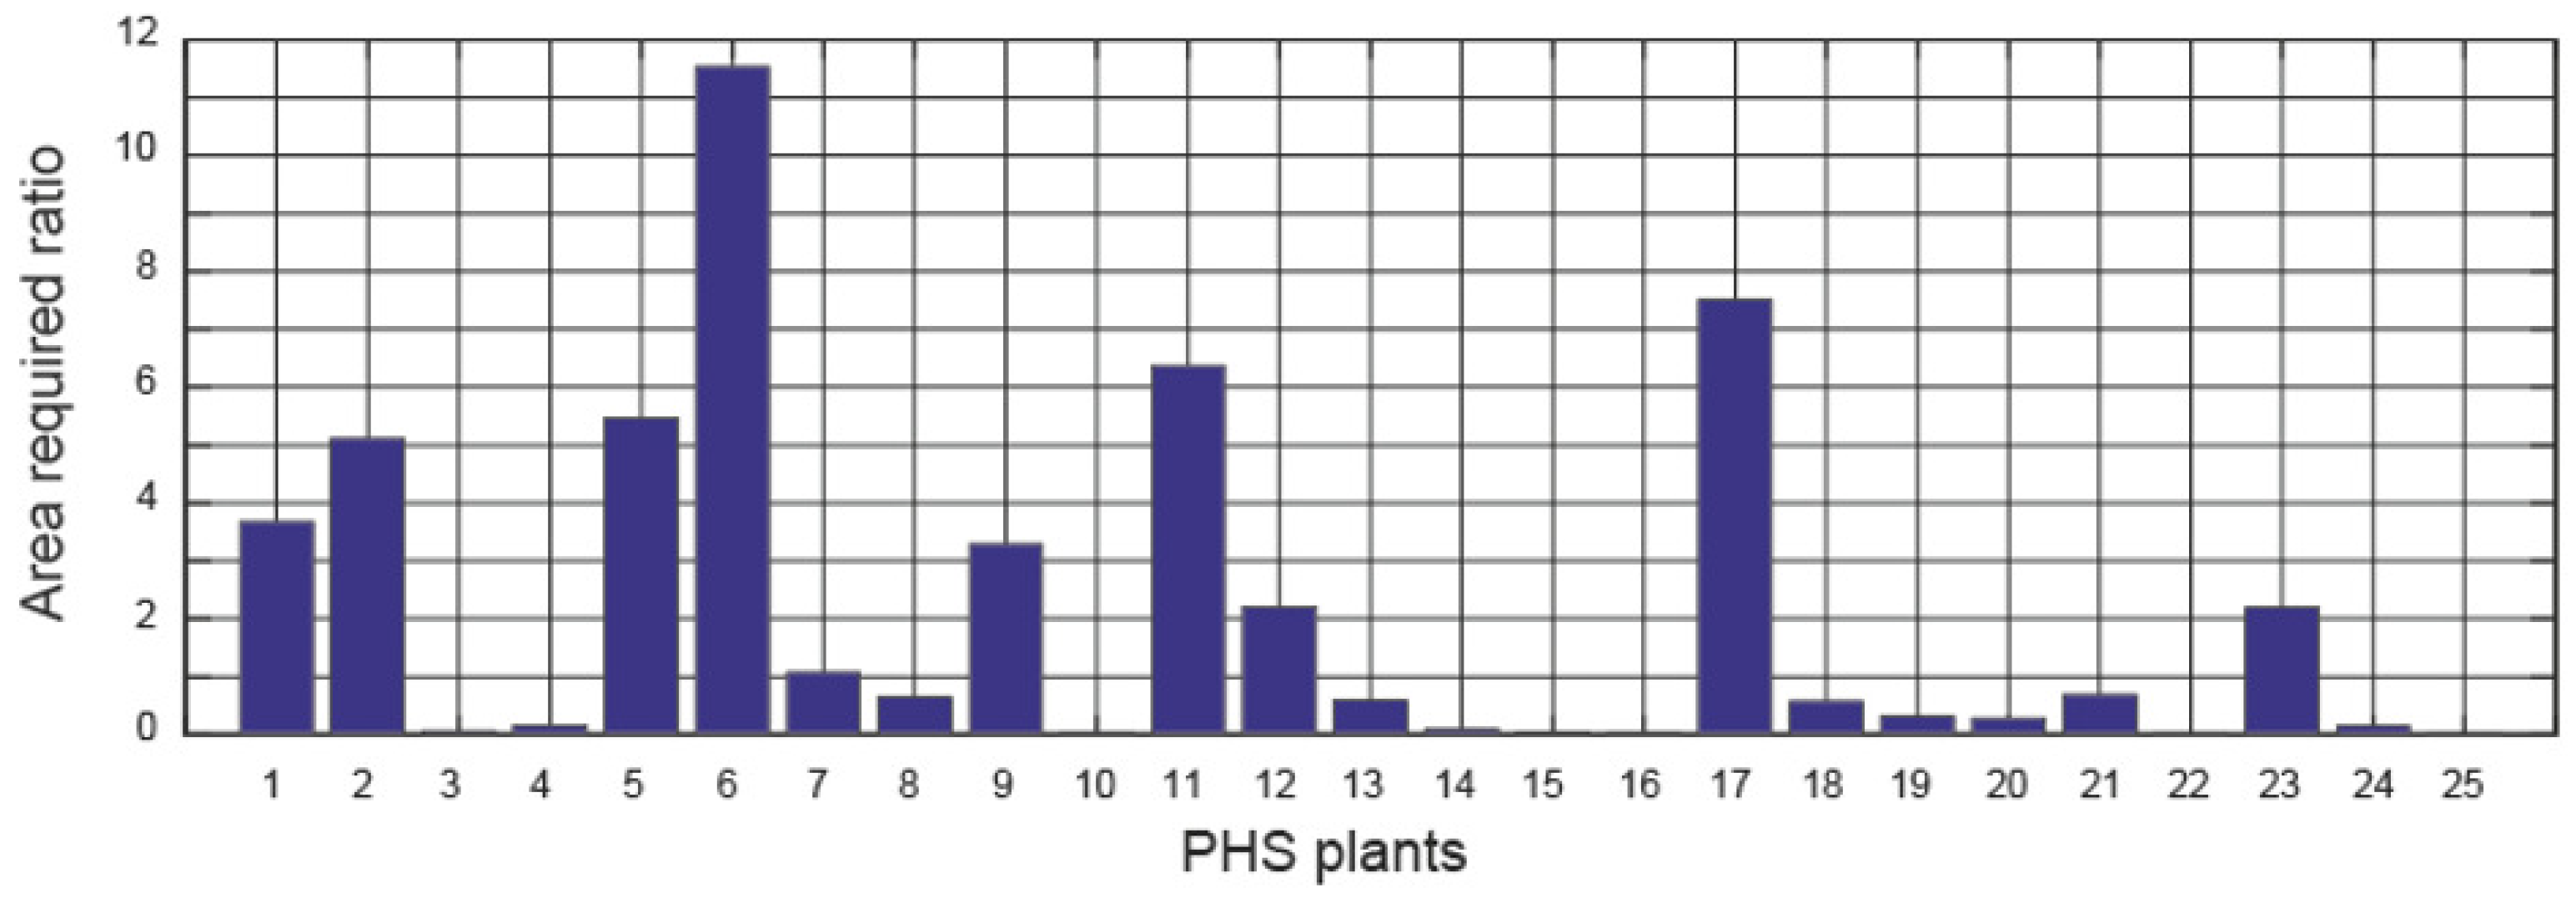
In order to meet Criterion 3, a certain surface area of water body is required. The area requirement ratio () was used to assess this criterion. Figure 10 shows the area requirement ratio for each FPV plant.

Figure 10.
Area requirement ratio of the PHS plants under study.
The following conclusions can be drawn from Figure 10:
- (i)
- The following hydropower plants meet this criterion: Villarino, Tajo de la Encantada, Conso, Valdecañas, Tanes, Torrejón, Valparaíso, Gabriel y Galán, Montamara, Soutelo, Bao-Puente Bibey, Guijo de Granadilla, Santiago de Jares, Pintado, Urdiceto, and Gobantes.
- (ii)
- The following hydropower plants do not meet this criterion: La Muela I, La Muela II, Aguayo, Sallente, Aldeadávila II, Moralets, Guillena, Bolarque II, Montamara and the IP.
Point 8 of this section indicates how this criterion influences the suitability of a PHS plant for the implementation of an FPV plant.
5.6. Volume of Water in the Upper Reservoir
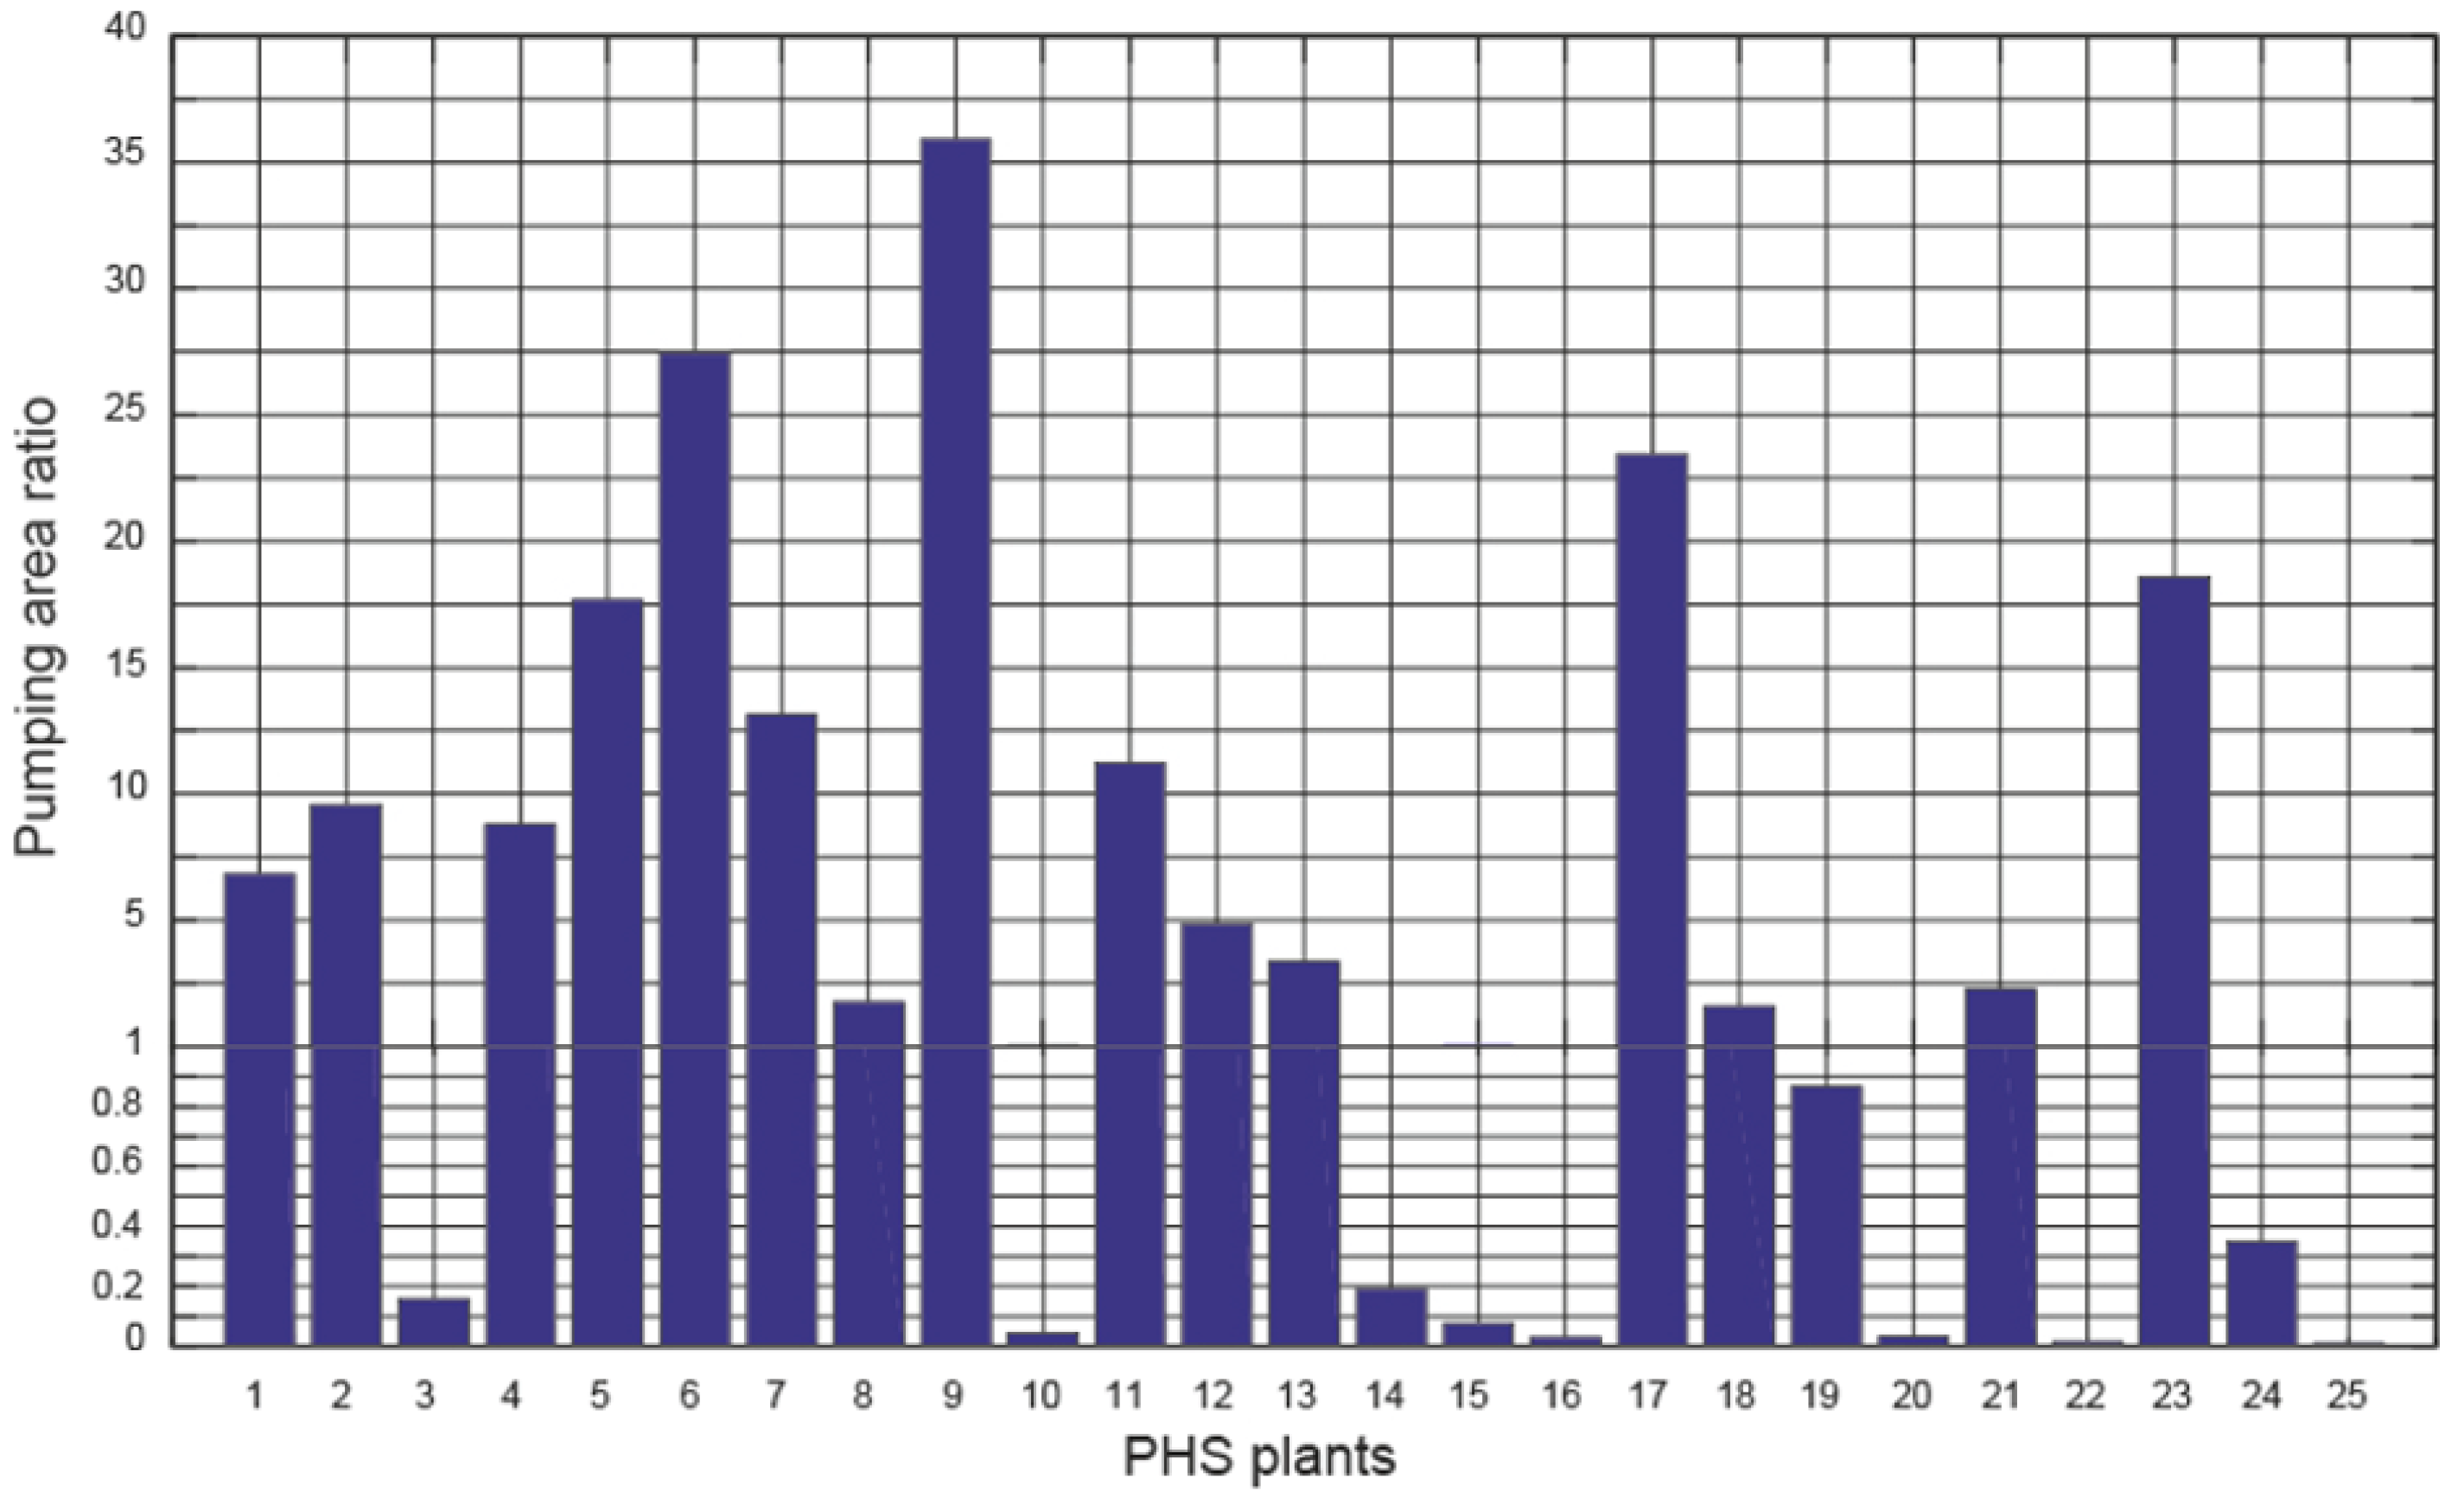
The surface area of the upper reservoir that is necessary for the FPV power plant to generate the energy needed to pump the water turbined each day must be determined. For this purpose, the pumping area ratio () is used. Figure 11 shows the pumping area ratio for each FPV plant.

Figure 11.
The pumping area ratio of the PHS plants under study.
The following conclusions can be drawn from Figure 11:
- (i)
- The following hydropower plants meet this criterion: Villarino, Valdecañas, Torrejón, Valparaíso, Gabriel y Galán, Guijo de Granadilla, Pintado and Gobantes.
- (ii)
- The following hydropower plants do not meet this criterion: La Muela I, La Muela II, Tajo de la Encantada, Aguayo, Sallente, Aldeadávila II, Conso, Moralets, Guillena, Bolarque II, Tanes, Montamara, Soutelo, Bao-Puente Bibey, Santiago de Jares, IP and Urdiceto.
Point 8 of this section indicates how this criterion influences the suitability of a PHS plant for the implementation of an FPV plant.
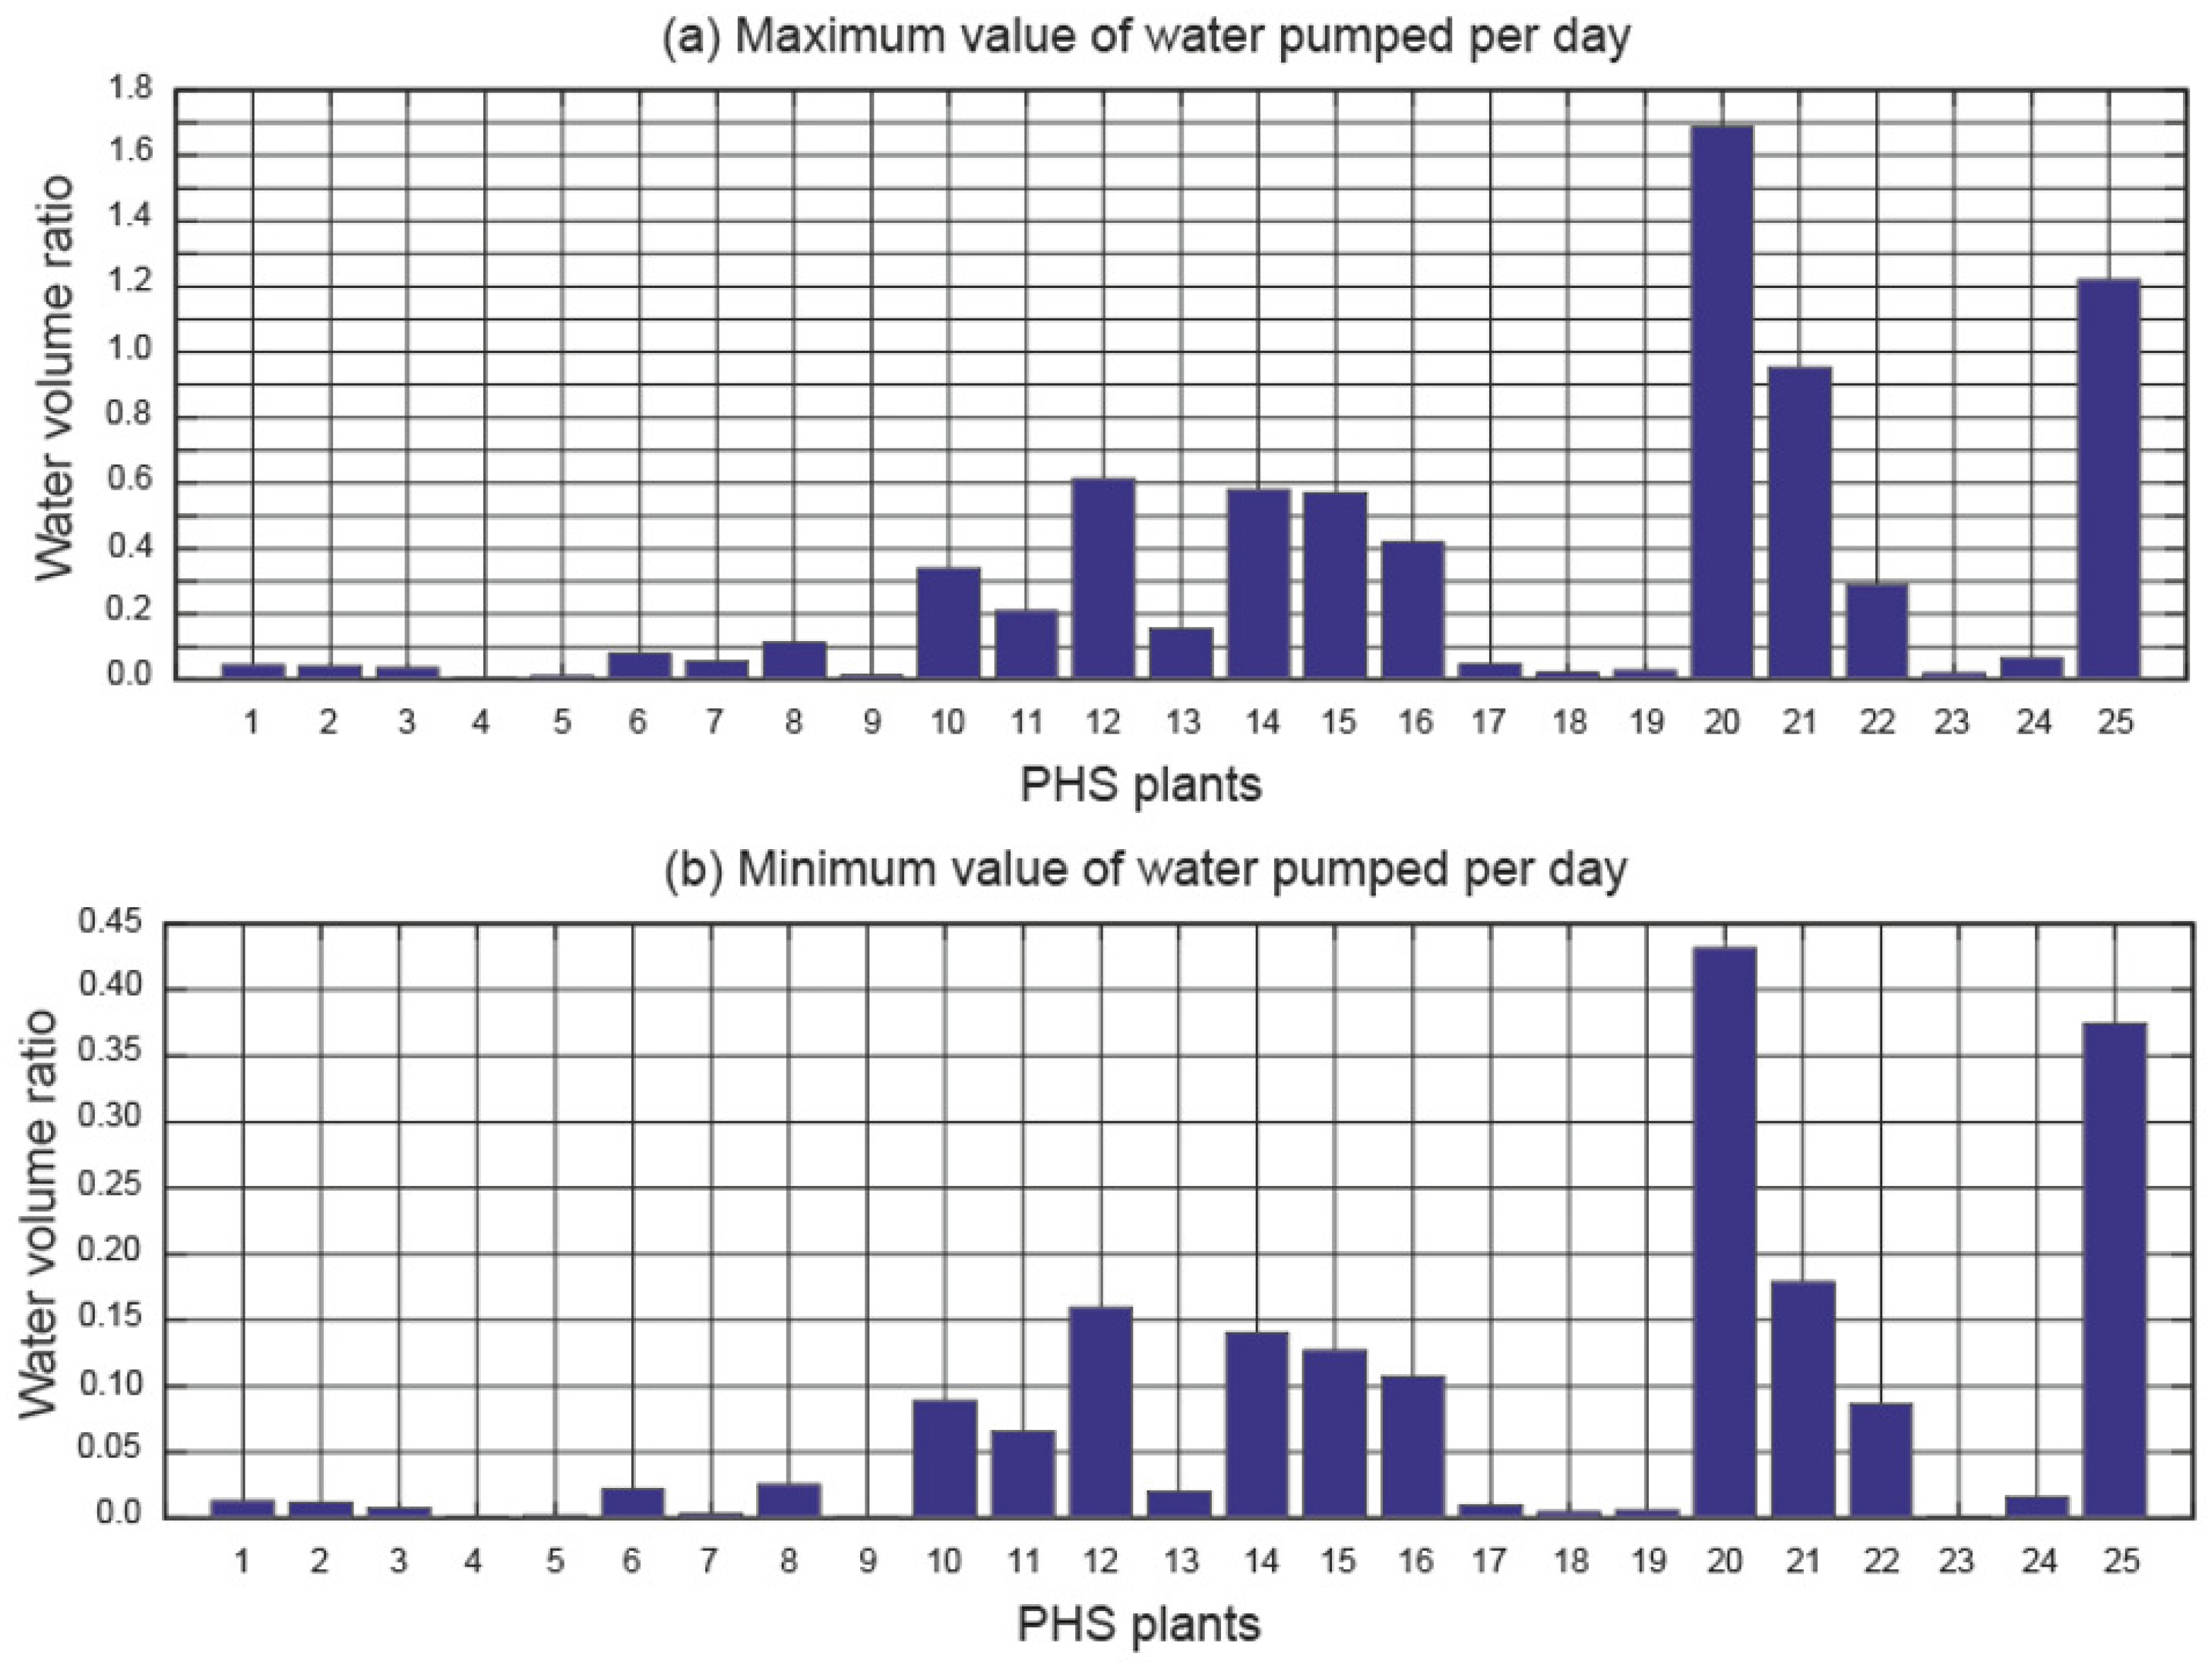
Also of interest is knowing the capacity of an FPV plant to generate the electricity to be used for pumping water into the upper reservoir each day. To evaluate this criterion, the ratio of volume of water pumped per day () was used. The maximum value and the minimum daily value were analysed in this study. Figure 12 shows the volume ratio of water pumped per day.
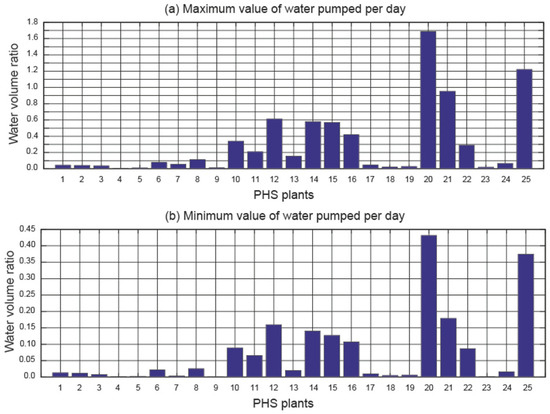
Figure 12.
Ratio of volume of water pumped per day at the PHS plants under study.
The following conclusions can be drawn from Figure 12:
- (i)
- With the minimum value of energy generated per day, the capacity of the upper reservoir cannot in any case be pumped in one day.
- (ii)
- With the maximum value of energy generated per day, the capacity of the upper reservoir can be pumped in one day only at the Guijo de Granadilla PHS plant and the Gobantes PHS plant.
Point 8 of this section indicates how this criterion influences the suitability of a PHS plant for the implementation of an FPV plant.
5.7. Water Surface in the Upper Reservoir
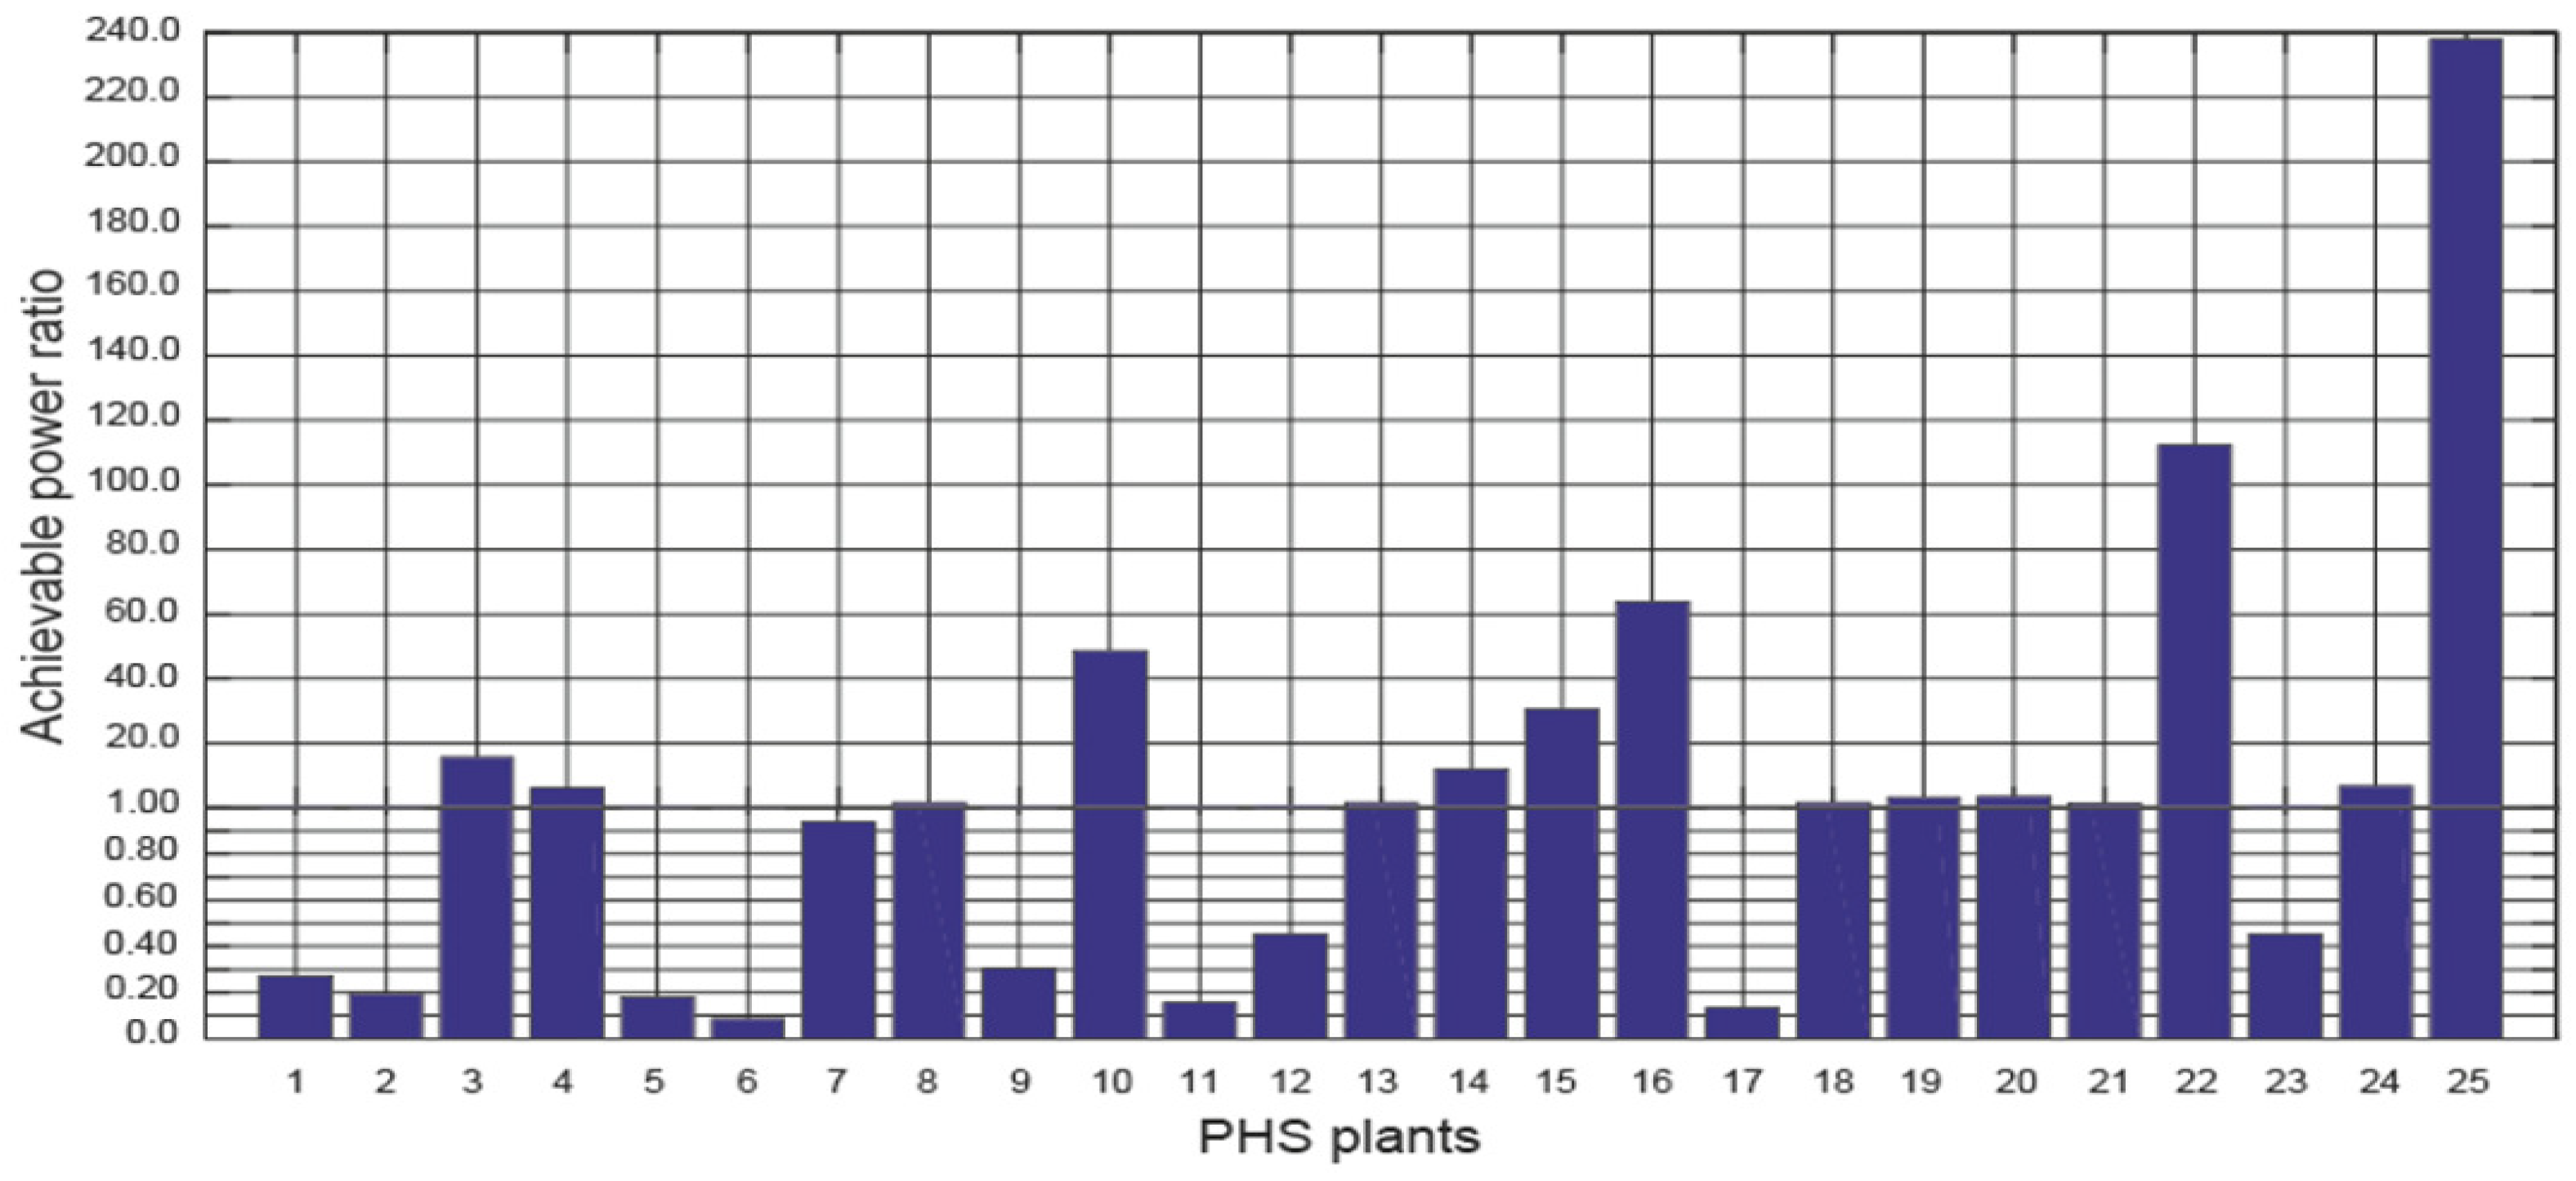
Assessing the achievable power of an FPV plant as a function of the available surface area was evaluated with the achievable power ratio (). Figure 13 shows the achievable power ratio.
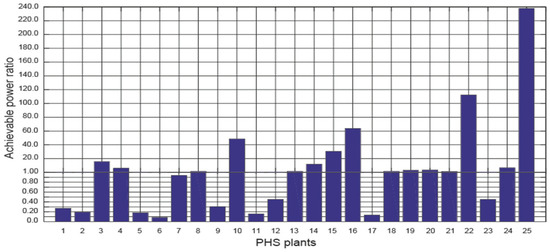
Figure 13.
Achievable power ratio of the PHS plants under study.
The following conclusions can be drawn from Figure 13:
- (i)
- The following hydropower plants meet this criterion: Villarino, Tajo de la Encantada, Conso, Valdecañas, Tanes, Torrejón, Valparaíso, Gabriel y Galán, Soutelo, Bao-Puente Bibey, Guijo de Granadilla, Santiago de Jares, Pintado, Urdiceto and Gobantes.
- (ii)
- The following hydropower plants do not meet this criterion: La Muela I, La Muela II, Aguayo, Sallente, Aldeadávila II, Moralets, Guillena, Bolarque II, Montamara and IP.
Point 8 of this section indicates how this criterion influences the suitability of a PHS plant for the implementation of an FPV plant.
5.8. Suitability of PHS Plants for the Implementation of FPV Plants
Table 6 shows the list of PHS plants and the criteria they meet according to the following categories: Positive Impact (PI), Negative Impact (NI) and Neutral Impact (NeI).
Table 6.
Summary of the criteria met by the plants under study.
In order to decide whether to recommend the implementation of an FPV plant in the upper reservoir of a particular PHS plant, the following conclusions derived from Table 4 have to be taken into account:
- (i)
- The global horizontal irradiance ratio () ensures the economic viability of an FPV plant and is therefore an elimination criterion. Therefore, the implementation of an FPV plant at the following hydropower plants is not advised: the Aguayo PHS plant and the Tanes PHS plant.
- (ii)
- The compliance with the electrical efficiency ratio () is flexible. All hydropower plants meet this criterion.
- (iii)
- The area required ratio () is very important when it comes to operating PHS and FPV plants independently and maximising the assigned grid connection capacity. Therefore, if the assigned grid connection capacity is to be maximised, the following hydropower plants are not suitable for the implementation of an FPV plant: La Muela I, La Muela II, Aguayo, Sallente, Aldeadávila II, Moralets, Guillena, Bolarque II, Montamara and IP.
- (iv)
- The pumping area ratio () is important if the chosen mode of operation is for the two plants to store energy together. Under these conditions, the following hydropower plants are not suitable for the implementation of an FPV plant: La Muela I, La Muela II, Tajo de la Encantada, Aguayo, Sallente, Aldeadávila II, Conso, Moralets, Guillena, Bolarque II, Tanes, Montamara, Soutelo, Bao-Puente Bibey, Santiago de Jares, IP and Urdiceto. The ratio of the volume of water pumped per day () is not met by any of the hydropower plants under study.
- (v)
- The achievable power ratio () is an informative criterion for the possibility of expanding an FPV plant. The following hydropower plants do not meet this criterion: La Muela I, La Muela II, Aguayo, Sallente, Aldeadávila II, Moralets, Guillena, Bolarque II, Montamara and IP.
There are only eight hydropower plants that meet conditions (i), (iii) and (iv): Villarino, Torrejón, Valparaíso, Gabriel y Galán, Guijo de Granadilla, Pintado and the Gobantes.
6. Conclusions
The Spanish government’s objective, as reflected in Spain’s National Energy and Climate Plan (NECP), is to double the current capacity of pumped hydropower storage (PHS) plants by 2030. Therefore, the study presented here is both current and forward-looking. This paper examines the technical potential of implementing floating photovoltaic (FPV) plants at all the PHS plants in Spain, i.e., 25 PHS plants were analysed. Several assessment indicators (the global horizontal irradiance ratio, electrical efficiency ratio, area required ratio, pumping area ratio, volume ratio of water pumped per day and achievable power ratio) were analysed for each PHS plant. The results show the suitability or non-suitability of implementing an FPV plant at the Spanish PHS plants. In summary, the following conclusions can be drawn:
- (i)
- The criterion of incident solar irradiation at a given location is the most important, as it excludes the PHS plant. The installation of an FPV plant at the Aguayo PHS and the Tanes PHS hydropower plants is discouraged, as the global horizontal irradiance ratio is very low.
- (ii)
- Maximising the use of the assigned grid connection capacity is one of the objectives the electrical companies seek when installing FPV plants at existing PHS plants. Therefore, this criterion is also fundamental. The following hydropower plants are not advisable for the implementation of an FPV plant based on this criterion: La Muela I, La Muela II, Aguayo, Sallente, Aldeadávila II, Moralets, Guillena, Bolarque II, Montamara and the IP.
- (iii)
- If the objective is to store energy, the implementation of an FPV plant in the PHS plants listed below is not recommended: La Muela I, La Muela II, Tajo de la Encantada, Aguayo, Sallente, Aldeadávila II, Conso, Moralets, Guillena, Bolarque II, Tanes, Montamara, Soutelo, Bao-Puente Bibey, Santiago de Jares, IP and the Urdiceto.
- (iv)
- If the objective is to expand an FPV plant already installed at a PHS plant, the following hydropower plants do not meet this criterion: La Muela I, La Muela II, Aguayo, Sallente, Aldeadávila II, Moralets, Guillena, Bolarque II, Montamara and the IP.
- (v)
- Although this is not a fundamental criterion, all the hydropower plants analysed meet the criterion of the electricity efficiency ratio.
There are only 8 hydropower plants that meet conditions (i), (ii) and (iii): Villarino, Torrejón, Valparaíso, Gabriel y Galán, Guijo de Granadilla, Pintado and the Gobantes. As future work, we plan to study in depth the orographic conditions of the upper reservoirs of the PHS plants, in order to obtain other elements for evaluating the suitability of a PHS plant for hybridisation with FPV systems.
Author Contributions
Conceptualization, A.B., C.R.-F. and L.B.; Methodology, A.B. and L.B.; Software, C.R.-F. and J.A.-B.; Validation, A.B., C.R.-F., J.A.-B. and L.B.; Investigation, C.R.-F. and J.A.-B.; Data curation, C.R.-F.; Writing—original draft, A.B.; Writing—review and editing, A.B. and J.A.-B. All authors have read and agreed to the published version of the manuscript.
Funding
This research received no external funding.
Data Availability Statement
The data presented in this study are available on request from the corresponding author. The data are not publicly available due to the data protection policy of the companies ENDESA, IBERDROLA and EDP.
Acknowledgments
We wish to thank ENDESA [25], IBERDROLA [4], and EDP [26] for its contribution to this paper.
Conflicts of Interest
Author Javier Aparicio-Bermejo was employed by the company Business Development Iberia Northwest Area, Enel Green Power. The remaining authors declare that the research was conducted in the absence of any commercial or financial relationships that could be construed as a potential conflict of interest.
Nomenclature
| Area of the plant (m2) | |
| Achievable power ratio | |
| Area required ratio | |
| Area of the upper reservoir (m2) | |
| Electrical efficiency ratio | |
| Potential energy stored (Ws) | |
| Global horizontal irradiation (kWh/m2) | |
| Global horizontal irradiation ratio | |
| g | Acceleration due to gravity (m/s2) |
| Available head (m) | |
| Elevating head (m) | |
| Total irradiance on a tilted surface (W/m2) | |
| Normal operating cell temperature (°C) | |
| Pumping area ratio | |
| Volume ratio of water pumped per day | |
| Power of the plant (W) | |
| Assigned grid connection capacity of a plant (W) | |
| Power input of the electric motor (W) | |
| Elevating power (W) | |
| Power output of the electric generator (W) | |
| Hydraulic power (W) | |
| Turbined flow rate (m3/s) | |
| Pumped flow rate (m3/s) | |
| Ambient temperature (°C) | |
| cell temperature (°C) | |
| Reference temperature (°C) | |
| Water pumped per day with the electrical energy generated by the plant (m3) | |
| Volume of water in the upper reservoir (m3) | |
| Tilt angle of photovoltaic module (°) | |
| Temperature coefficient (1/°C) | |
| Azimuth angle of photovoltaic module (°) | |
| PV module efficiency (%) | |
| Electric generator efficiency (%) | |
| Electric motor efficiency (%) | |
| Pump efficiency (%) | |
| module efficiency at the reference temperature (%) | |
| Hydro turbine efficiency (%) | |
| Density of water (kg/m3) |
References
- United Nations. Theme Report on Energy Transition. 2021. Available online: https://www.un.org/sites/un2.un.org/files/2021-twg_2-062321.pdf (accessed on 10 December 2023).
- Trapani, K.; Redón Santafé, M. A review of floating photovoltaic installations: 2007–2013. Prog. Photovolt. Res. Appl. 2015, 23, 524–532. [Google Scholar] [CrossRef]
- World Bank Group. Where Sun Meets Water: Floating Solar Market Report. 2018. Available online: https://www.worldbank.org/en/topic/energy/publication/where-sun-meets-water (accessed on 10 December 2023).
- IBERDROLA. Available online: https://www.iberdrola.com/innovation/floating-photovoltaic (accessed on 10 December 2023).
- El Hammoumi, A.; Chalh, V.; Allouhi, A.; Motahhir, S.; El Ghzizal, A.; Derouich, A. Design and construction of a test bench to investigate the potential of floating PV systems. J. Clean. Prod. 2021, 278, 123917. [Google Scholar] [CrossRef]
- Liu, H.; Krishna, V.; Lun Leung, J.; Reindl, T.; Zhao, L. Field experience and performance analysis of floating PV technologies in the tropics. Prog. Photovolt. Res. Appl. 2018, 26, 957–967. [Google Scholar] [CrossRef]
- Farfan, J.; Breyer, C. Combining floating solar photovoltaic power plants and hydropower reservoirs: A virtual battery of great global potential. Energy Proccedia 2018, 155, 403–411. [Google Scholar] [CrossRef]
- Agrawal, K.K.; Jha, S.K.; Mittal, R.K.; Vashishtha, S. Assessment of floating solar PV (FSPV) potential and water conservation: Case study on Rajghat Dam in Uttar Pradesh, India. Energy Sustain. 2022, 66, 287–295. [Google Scholar] [CrossRef]
- IEA. Hydroelectricity. International Energy Agency. 2022. Available online: https://www.iea.org/reports/hydroelectricity (accessed on 10 December 2023).
- EMBER. Available online: https://ember-climate.org/data-catalogue/yearly-electricity-data/ (accessed on 10 December 2023).
- Farrar, L.W.; Bahaj, A.S.; James, P.; Anwar, A.; Amdar, N. Floating solar PV to reduce water evaporation in water stressed regions and powering water pumping: Case study Jordan. Energy Convers. Manag. 2022, 260, 115598. [Google Scholar] [CrossRef]
- Melvin, G.K.X. Experimental Study of the Effect of Floating Solar Panels on Reducing Evaporation in Singapore Reservoirs. 2015. Available online: https://cpb-us-w2.wpmucdn.com/blog.nus.edu.sg/dist/b/4438/files/2015/04/FYP-Final-report-14ijhop.pdf (accessed on 10 December 2023).
- Sanseverino, I.; Conduto, D.; Pozzoli, L.; Dobricic, S.; Lettieri, T. Algal Bloom and Its Economic Impact, European Commission, Joint Research Centre. 2016. Available online: https://op.europa.eu/en/publication-detail/-/publication/4d384d1b-1804-11e6-ba9a-01aa75ed71a1/language-en (accessed on 30 June 2023).
- Olkkonen, V.; Haaskjold, K.; Sommer Klyve, Ø.; Skartlien, R. Techno-economic feasibility of hybrid hydro-FPV systems in Sub-Saharan Africa under different market conditions. Renew. Energy 2023, 215, 118981. [Google Scholar] [CrossRef]
- Barbón, A.; Gutiérrez, A.; Bayón, L.; Bayón-Cueli, C.; Aparicio-Bermejo, J. Economic analysis of a pumped hydroelectric storage-integrated floating PV system in the day-ahead Iberian electricity market. Energies 2023, 16, 1705. [Google Scholar] [CrossRef]
- Mamatha, G.; Kulkarni, P.S. Assessment of floating solar photovoltaic potential in India’s existing hydropower reservoirs. Energy Sustain. Dev. 2022, 69, 64–76. [Google Scholar] [CrossRef]
- Gonzalez Sanchez, R.; Kougias, I.; Moner-Girona, M.; Fahl, F.; Jäger-Waldau, A. Assessment of floating solar photovoltaics potential in existing hydropower reservoirs in Africa. Renew. Energy 2021, 169, 687–699. [Google Scholar] [CrossRef]
- Shan, R.; Sasthav, C.; Wang, X.; Lima, L.M.M. Complementary relationship between small-hydropower and increasing penetration of solar photovoltaics: Evidence from CAISO. Renew. Energy 2020, 155, 1139–1146. [Google Scholar] [CrossRef]
- Kakoulaki, G.; Gonzalez Sanchez, R.; Gracia Amillo, A.; Szabo, S.; De Felice, M.; Farinosi, F.; De Felice, L.; Bisselink, B.; Seliger, R.; Kougias, I.; et al. Benefits of pairing floating solar photovoltaics with hydropower reservoirs in Europe. Renew. Sustain. Energy Rev. 2023, 171, 112989. [Google Scholar] [CrossRef]
- Barbón, A.; Aparicio-Bermejo, J.; Bayón, L.; Georgious, R. Floating photovoltaic systems coupled with pumped hydroplants under day-ahead electricity market conditions: Parametric analysis. Electronics 2023, 12, 2250. [Google Scholar] [CrossRef]
- REE. Available online: https://www.sistemaelectrico-ree.es/en/spanish-electricity-system/generation/installed-capacity (accessed on 10 December 2023).
- MITECO. Available online: https://www.miteco.gob.es/en/prensa/pniec.html (accessed on 10 December 2023).
- Barbón, A.; Fortuny Ayuso, P.; Bayón, L.; Silva, C.A. A comparative study between racking systems for photovoltaic power systems. Renew. Energy 2021, 180, 424–437. [Google Scholar] [CrossRef]
- Water Power Magazine. Available online: https://www.waterpowermagazine.com/search/?q%5B%5D=Pumping (accessed on 10 December 2023).
- ENDESA. Available online: https://www.endesa.com/en/the-e-face/renewable-energies/floating-solar-plants (accessed on 10 December 2023).
- EDP. Available online: https://www.edp.com/en/floating-solar-pannels (accessed on 10 December 2023).
- Aihara, R.; Yokoyama, A.; Nomiyama, F.; Kosugi, N. Optimal operation scheduling of pumped storage hydro power plant in power system with a large penetration of photovoltaic generation using genetic algorithm. In Proceedings of the IEEE Trondheim PowerTech, Trondheim, Norway, 19–23 June 2011. [Google Scholar]
- Bayón, L.; Grau, J.M.; Ruiz, M.M.; Suárez, P.M. Mathematical modelling of the combined optimization of a pumped-storage hydro-plant and a wind park. Math. Comput. Model. 2013, 57, 2024–2028. [Google Scholar] [CrossRef]
- Bayón-Cueli, C.; Barbón, A.; Fernández-Conde, A.; Bayón, L. Optimal distribution of PV modules on roofs with limited space. In Proceedings of the 2021 IEEE International Conference on Environmental and Electrical Engineering (EEEIC2021), Bari, Italy, 7–10 September 2021; pp. 50–55. [Google Scholar]
- Osborne, M. Sungrow Targets Teading Role in Supply of Floating Solar Systems to Booming Market. Available online: https://www.pv-tech.org/sungrow-targets-leading-role-in-supply-of-floating-solar-systems-to-booming/ (accessed on 10 December 2023).
- Sahu, A.; Yadav, N.; Sudhakar, K. Floating photovoltaic power plant: A review. Renew. Sustain. Energy Rev. 2016, 66, 815–824. [Google Scholar] [CrossRef]
- Barbón, A.; Bayón-Cueli, C.; Bayón, L.; Carreira-Fontao, V. A methodology for an optimal design of ground-mounted photovoltaic power plants. Appl. Energy 2022, 314, 118881. [Google Scholar] [CrossRef]
- Barbón, A.; Ghodbane, M.; Bayón, L.; Said, Z. A general algorithm for the optimization of photovoltaic modules layout on irregular rooftop shapes. J. Clean. Prod. 2022, 365, 132774. [Google Scholar] [CrossRef]
- ISIFLOATING. Available online: https://www.isifloating.com/en/solar-flotante-isifloating-by-isigenere-english/ (accessed on 10 December 2023).
- CIEL. Available online: https://ciel-et-terre.net/solutions/products/ (accessed on 10 December 2023).
- IINTECH. Available online: https://intechcleanenergy.com/floating-panels.php (accessed on 10 December 2023).
- ENFSOLAR. Available online: https://es.enfsolar.com/pv/panel-datasheet/crystalline/50794 (accessed on 10 December 2023).
- Barbón, A.; Bayón-Cueli, C.; Bayón, L.; Rodríguez-Suanzes, C. Analysis of the tilt and azimuth angles of photovoltaic systems in non-ideal positions for urban applications. Appl. Energy 2022, 305, 117802. [Google Scholar] [CrossRef]
- Duffie, J.A.; Beckman, W.A. Solar Engineering of Thermal Processes, 4th ed.; John Wiley & Sons: New York, NY, USA, 2013. [Google Scholar]
- Oliveira-Pinto, S.; Stokkermans, J. Assessment of the potential of different floating solar technologies–Overview and analysis of different case studies. Energy Convers. Manag. 2020, 211, 112747. [Google Scholar] [CrossRef]
- Ghigo, A.; Faraggiana, E.; Sirigu, M.; Mattiazzo, G.; Bracco, G. Design and analysis of a floating photovoltaic system for offshore installation: The case study of Lampedusa. Energies 2022, 15, 8804. [Google Scholar] [CrossRef]
- METEONORM. Available online: https://meteonorm.com/en/ (accessed on 10 December 2023).
- Joint Research Centre (JRC). PVGIS. 2022. Available online: http://re.jrc.ec.europa.eu/pvg_tools/\protect\@normalcr\relaxen/tools.html#PVP (accessed on 10 December 2023).
- SOLCAST. Available online: https://solcast.com/ (accessed on 10 December 2023).
- PVsyst. Available online: https://www.pvsyst.com/ (accessed on 10 December 2023).
- Sacid Endiz, M.; Emre Coşgun, A. Assessing the potential of solar power generation in Turkey: A PESTLE analysis and comparative study of promising regions using PVsyst software. Solar Energy 2023, 266, 112153. [Google Scholar] [CrossRef]
- Huda, A.; Kurniawan, I.; Fahmi Purba, K.; Ichwani, R.; Aryansyah; Fionasari, R. Techno-economic assessment of residential and farm-based photovoltaic systems. Renew. Energy 2023, 222, 119886. [Google Scholar] [CrossRef]
- Rios, R.; Duarte, S. Selection of ideal sites for the development of large-scale solar photovoltaic projects through Analytical Hierarchical Process—Geographic information systems (AHP-GIS) in Peru. Renew. Sustain. Energy Rev. 2021, 149, 111310. [Google Scholar] [CrossRef]
- Giamalaki, M.; Tsoutsos, T. Sustainable siting of solar power installations in Mediterranean using a GIS/AHP approach. Renew. Energy 2019, 141, 64–75. [Google Scholar] [CrossRef]
- SOLARGIS. Available online: https://solargis.com/maps-and-gis-data/download/world (accessed on 10 December 2023).
- Aly, A.; Solvang Jensen, S.; Branth Pedersen, A. Solar power potential of Tanzania: Identifying CSP and PV hot spots through a GIS multicriteria decision making analysis. Renew. Energy 2017, 113, 159–175. [Google Scholar] [CrossRef]
- Alami Merrouni, A.; Elwali Elalaoui, F.; Mezrhab, A.; Mezrhab, A.; Ghennioui, A. Large scale PV sites selection by combining GIS and Analytical Hierarchy Process. Case study: Eastern Morocco. Renew. Energy 2018, 119, 863–873. [Google Scholar] [CrossRef]
- Yushchenko, A.; de Bono, A.; Chatenoux, B.; Kumar Patel, M.; Ray, N. GIS-based assessment of photovoltaic (PV) and concentrated solar power (CSP) generation potential in West Africa. Renew. Sustain. Energy Rev. 2018, 81, 2088–2103. [Google Scholar] [CrossRef]
- Evans, D.L. Simplified method for predicting photovoltaic array output. Solar Energy 1981, 27, 555–560. [Google Scholar] [CrossRef]
- Dutra Silva, D.; Marson, V.; Rodrigues de Souza, R.; Diehl de Oliveira, J.; Campos Silva, J.B.; Cardoso, E.M. A new predictive model for a photovoltaic module’s surface temperature. Energy Rep. 2022, 8, 15206–15220. [Google Scholar] [CrossRef]
- Lawrence Kamuyu, W.C.; Rok Lim, J.; Sub Won, C.; Keun Ahn, H. Prediction model of photovoltaic module temperature for power performance of floating PVs. Energies 2018, 11, 447. [Google Scholar] [CrossRef]
- Mattei, M.; Notton, G.; Cristofari, C.; Muselli, M.; Poggi, P. Calculation of the polycrystalline PV module temperature using a simple method of energy balance. Renew. Energy 2006, 31, 553–567. [Google Scholar] [CrossRef]
- Choi, Y.K. A study on power generation analysis of floating PV system considering environmental impact. Int. J. Softw. Eng. Appl. 2014, 8, 75–84. [Google Scholar] [CrossRef]
- SNIRH. Available online: https://snirh.apambiente.pt/index.php?idMain=1&idItem=1.3\protect\@normalcr\relax&sbaciaid=&szonas=&salbufeirasimbolo=03J/03A&n_mesBOLETIM=01&n_anoH= (accessed on 10 December 2023).
- Bhattacharjee, S.; Nayak, P.K. PV-pumped energy storage option for convalescing performance of hydroelectric station under declining precipitation trend. Renew. Energy 2019, 135, 288–302. [Google Scholar] [CrossRef]
- GOOGLE EARTH. Available online: https://www.google.es/intl/es/earth/index.html (accessed on 10 December 2023).

Disclaimer/Publisher’s Note: The statements, opinions and data contained in all publications are solely those of the individual author(s) and contributor(s) and not of MDPI and/or the editor(s). MDPI and/or the editor(s) disclaim responsibility for any injury to people or property resulting from any ideas, methods, instructions or products referred to in the content. |
© 2024 by the authors. Licensee MDPI, Basel, Switzerland. This article is an open access article distributed under the terms and conditions of the Creative Commons Attribution (CC BY) license (https://creativecommons.org/licenses/by/4.0/).