Abstract
In order to satisfy the requirements of modern online security assessment of power systems with continuously increasing complexity in terms of structure and scale, it is desirable to develop a power system dynamic security region (DSR) analysis. However, data-driven methods suffer from expensive model training costs and overfitting when determining DSR boundaries with high-dimensional grid features. Given this problem, a distributed feature selection method based on grid partition and fuzzy-rough sets is proposed in this paper. The method first employs the Louvain algorithm to partition the power grid and divide the original feature set so that high-dimensional features can be allocated to multiple computational units for distributed screening. At this point, the connections between features of different computational units are minimized to a relatively low level, thereby avoiding large errors in the distributed results. Then, an incremental search algorithm based on the fuzzy-rough set theory (FRST) is used for feature selection at each computational unit, which can effectively take into account the intrinsic connections between features. Finally, the results of all computational units are integrated in the coordination unit to complete the overall feature selection. The experimental results based on the IEEE-39 bus system show that the proposed method can help simplify the power system DSR analysis with high-dimensional features by screening the critical features. And compared with other commonly used filter methods, it has higher screening accuracy and lower time costs.
1. Introduction
The past decade has witnessed an increasing deployment of renewable energy resources and grid interconnection, which results in an extremely complex dynamic behavior of power systems [1]. The traditional security and stability analysis method (i.e., the point-wise method) involves numerous simulations under pre-selected faults to judge whether a power system is secure/insecure or stable/unstable, which is difficult to meet the requirements of modern online security assessment of power systems [2,3]. For the sake of quickly and intuitively obtaining a holistic evaluation of the current operating state of power systems with information such as security margins and optimized control directions, Wu et al. introduced the concept of security region (SR) [4].
The concept of SR addresses problems from the perspective of regions and describes a region in which a power system can operate securely as a whole. Based on the difference between static stability analysis and transient stability analysis, an SR can be classified into a steady-state security region (SSSR) or a dynamic security region (DSR) accordingly [5]. A conventional DSR is defined as a set of operating points in the pre-fault power injection space that can guarantee the transient stability of power systems. Previous research has proved its topological characteristics of internal connectivity, no void, compact boundaries, and no knot, which can be approximated by hyperplanes [6]. These characteristics have laid the foundation for the practical application of conventional DSRs, resulting in two kinds of boundary determination methods represented by direct and data-driven methods.
Direct methods search for a critical injected power of power systems for a given fault based on the transient energy function (TEF) [7,8,9], extended equal area criterion (EEAC) [10,11], etc., and then employ a sensitivity analysis to solve the analytical expression of DSR boundaries. Although these methods are fast and clear in physical interpretation, they cannot be applied to electronic power systems because of the limitations of TEF and EEAC (e.g., non-scalability and conservatism) [12]. In contrast, data-driven methods can effectively compensate for the deficiency in this aspect, which obtains an approximate hyperplane of the DSR boundaries on a large number of samples by fitting [13,14] or classification [15,16] techniques. Although the process of generating samples brings extra time costs, it can be computed offline first and then matched online in practice. Therefore, these methods have become mainstream methods for determining DSR boundaries in engineering [17].
For actual grid dispatching, it is not enough to only consider the power injection of each node in a power system, but also the power transmissions of certain branches or critical sections [18]. This makes the data-driven methods suffer from expensive model training costs and overfitting when dealing with massive grid operation features. Therefore, it is necessary to screen for critical features in advance [19].
The essence of feature selection problems is to find a minimal subset of features for the system under consideration that maintains or improves the decision-making ability of data. Currently, the corresponding solution methods in power systems can be mainly classified into the filter, wrapper, and embedded methods according to whether they are related to the data-driven model of the subject. The wrapper methods construct an objective function based on the decision-making accuracy of the data-driven model in the test set, and iteratively search for an optimal subset of features with an intelligent optimization algorithm [20,21,22,23]. The embedded methods embed feature selection into the process of training the data-driven model [19,24,25]. Although both of these methods are effective in screening for critical features in data, they have the disadvantages of slow feature selection efficiency and easy overfitting of the model, respectively. Therefore, they are unsuitable for a power system DSR analysis with high-dimensional features [26]. In contrast, the filter methods are much simpler and more efficient. They only rely on the information attached to features to evaluate the screened feature subset and are independent of the data-driven model [27,28,29,30,31,32]. However, most of the existing filter methods, such as Relief [33], Fisher Score [34], and Mutual Information [35], ignore the intrinsic connection between features, which leads to redundant feature selection results. In addition, there are also studies such as [36] that combine the filter and wrapper methods to screen features in two steps, but this might lead to further slowdowns in selection.
To effectively and efficiently screen for critical features in a power system DSR analysis, a better filter feature selection method needs to be developed that can address the above shortcomings. The fuzzy-rough set theory (FRST) provides us with an attractive idea [37]. It uses discernable sample pairs of features to describe the implicit information in data, which helps to take into account the intrinsic connection between features during feature selection. Furthermore, inspired by [38], it is desirable to allocate high-dimensional features to multiple computational units (assuming that computer resources are divided into computational units and coordination units) for distributed screening. This can further improve the overall efficiency of the method. Considering that grid features within the same electrical partition usually have a much stronger connection to each other, while grid features between different electrical partitions are relatively less connected, adopting a grid partition-based method to divide features will be more in line with engineering practice than the Pearson correlation coefficient-based method in [38].
In summary, a distributed feature selection method based on grid partition and fuzzy-rough sets is proposed, which consists of two parts: partitioning the power grid and dividing the original feature set by the Louvain algorithm, and realizing feature selection based on the FRST. The main contributions in this paper are summarized as follows:
- (1)
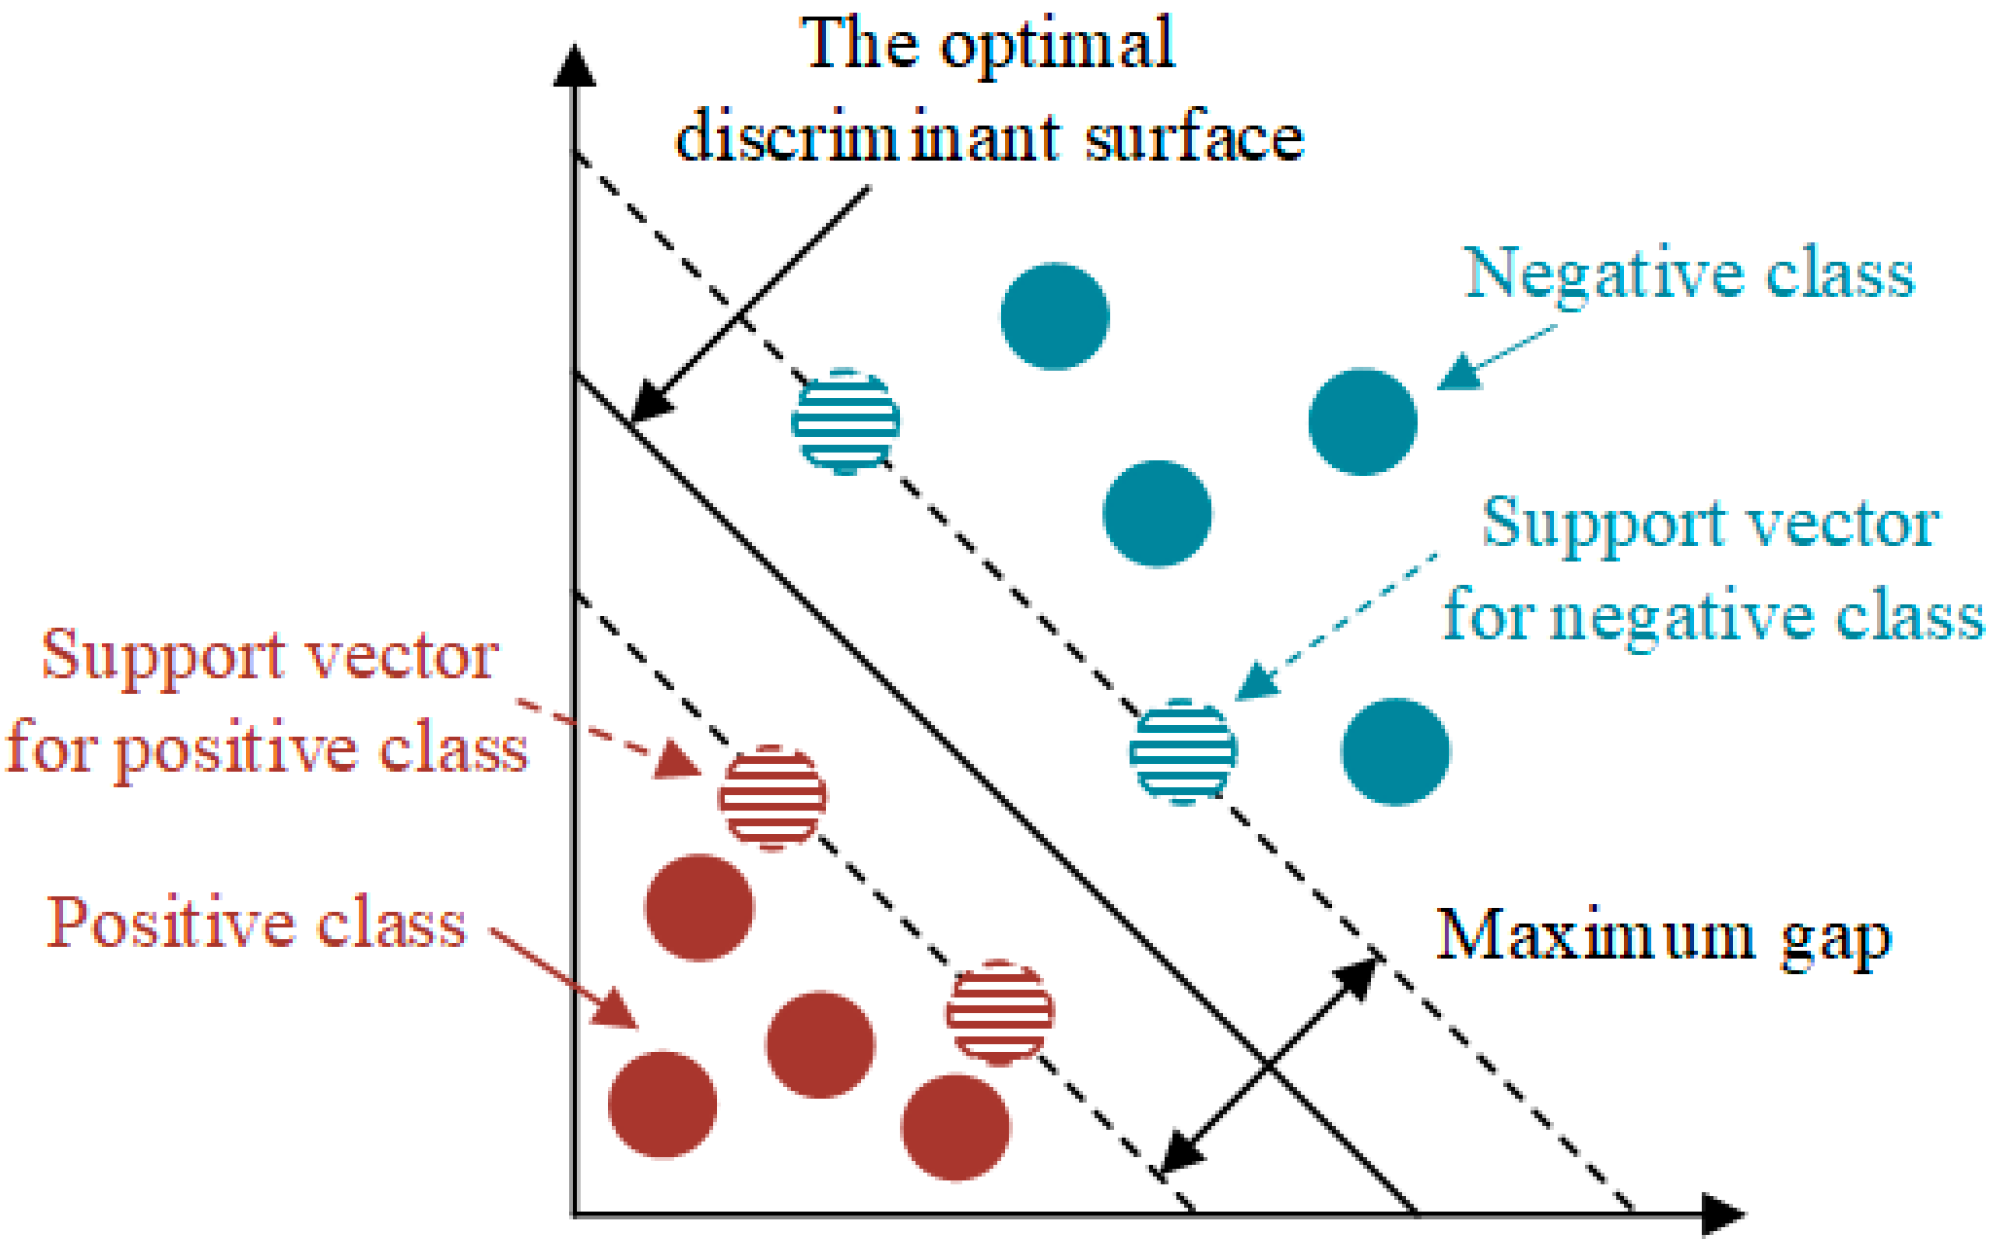
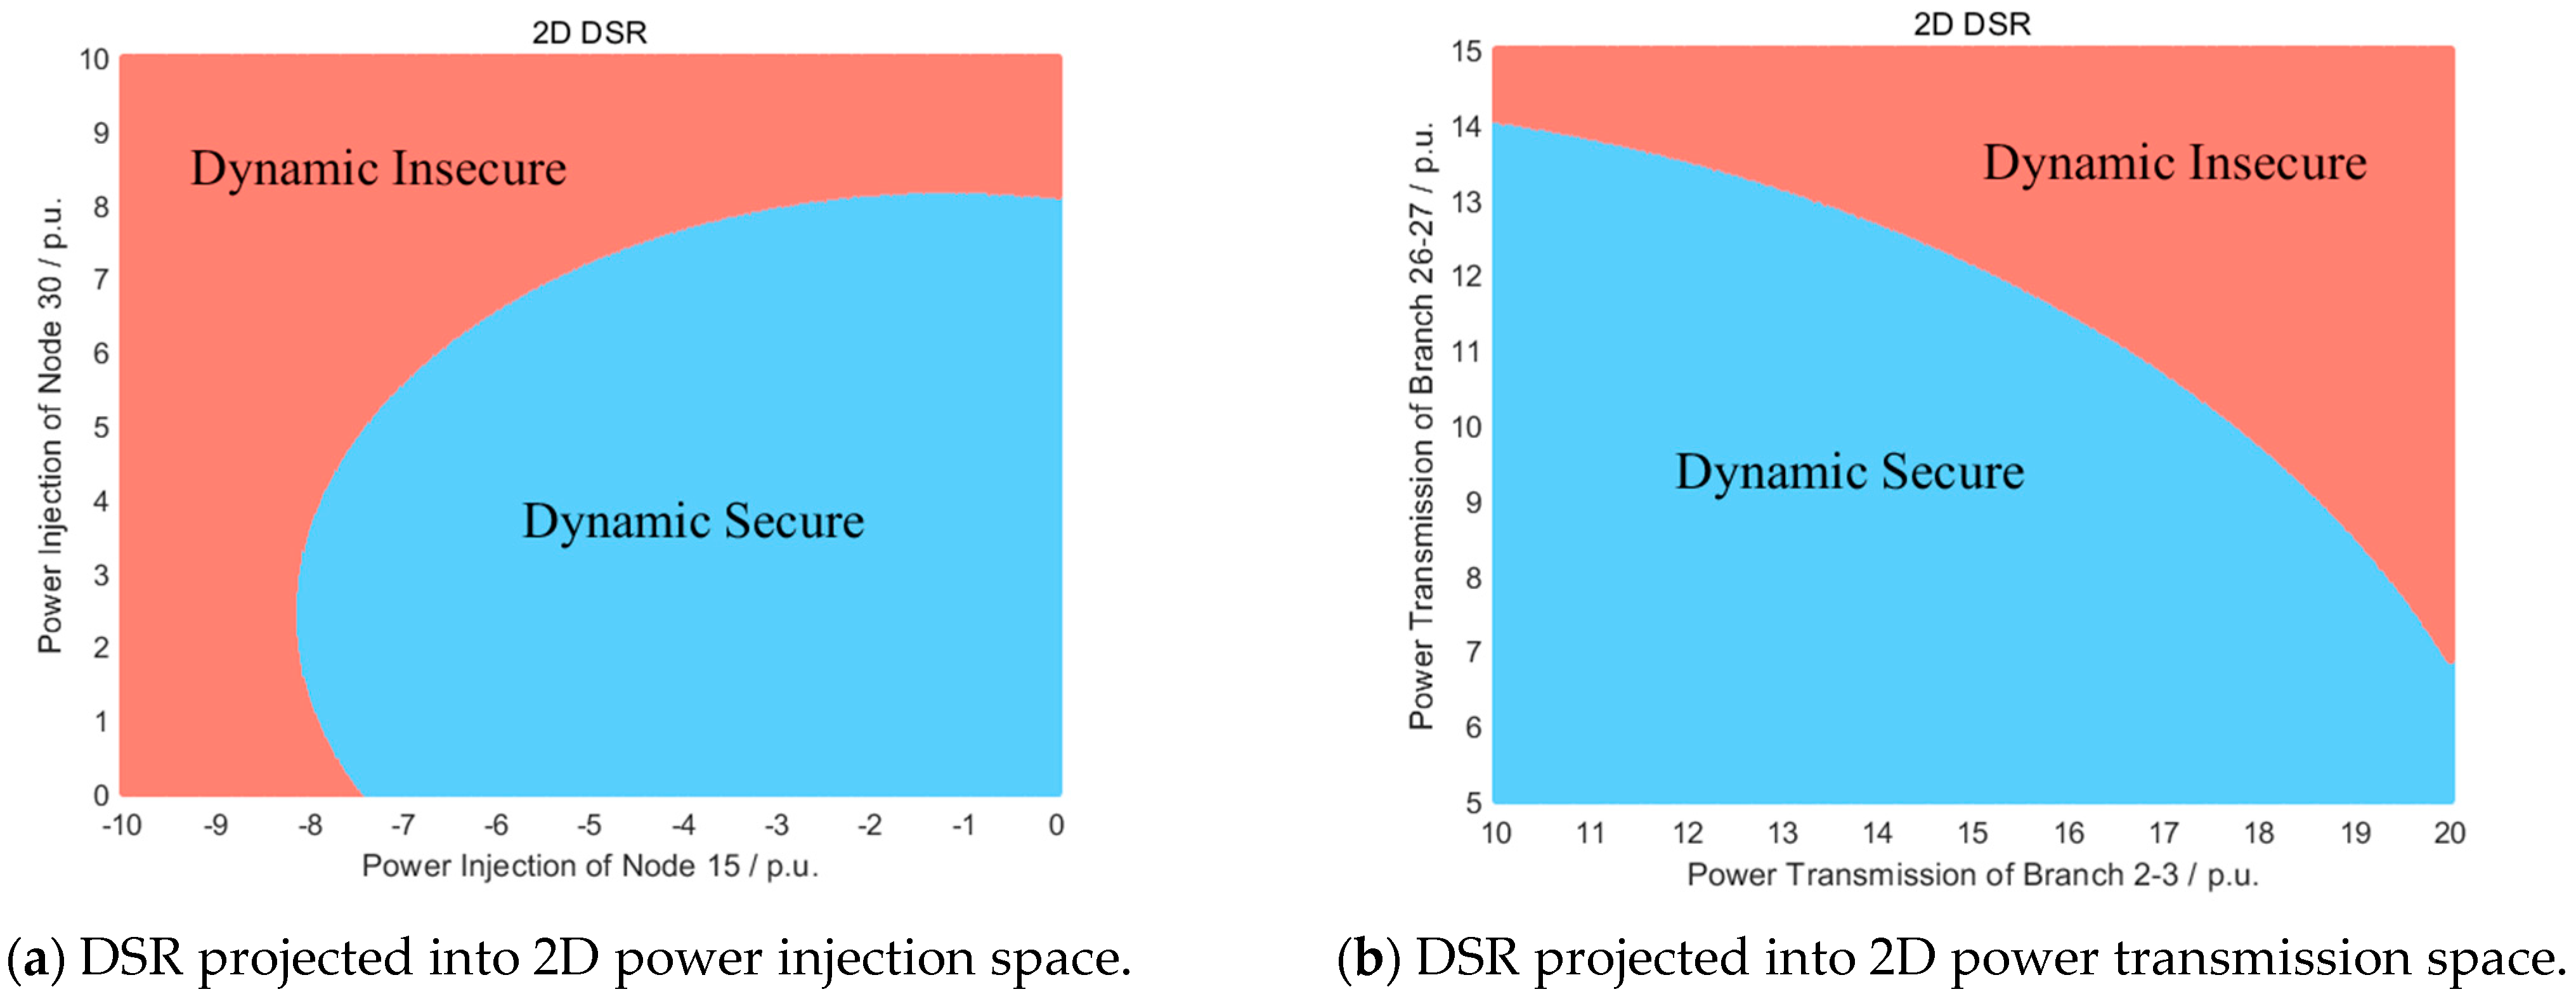
- Considering the need for actual grid dispatching, extend the definition of DSR in power systems from the power injection space to the Cartesian product of the power injection space and power transmission space (referred to as the power space). Meanwhile, considering the changes in topological characteristics brought about by the extension, introduce a support vector machine (SVM) with a Gaussian kernel function to approximate the boundaries of the extended DSR.
- (2)
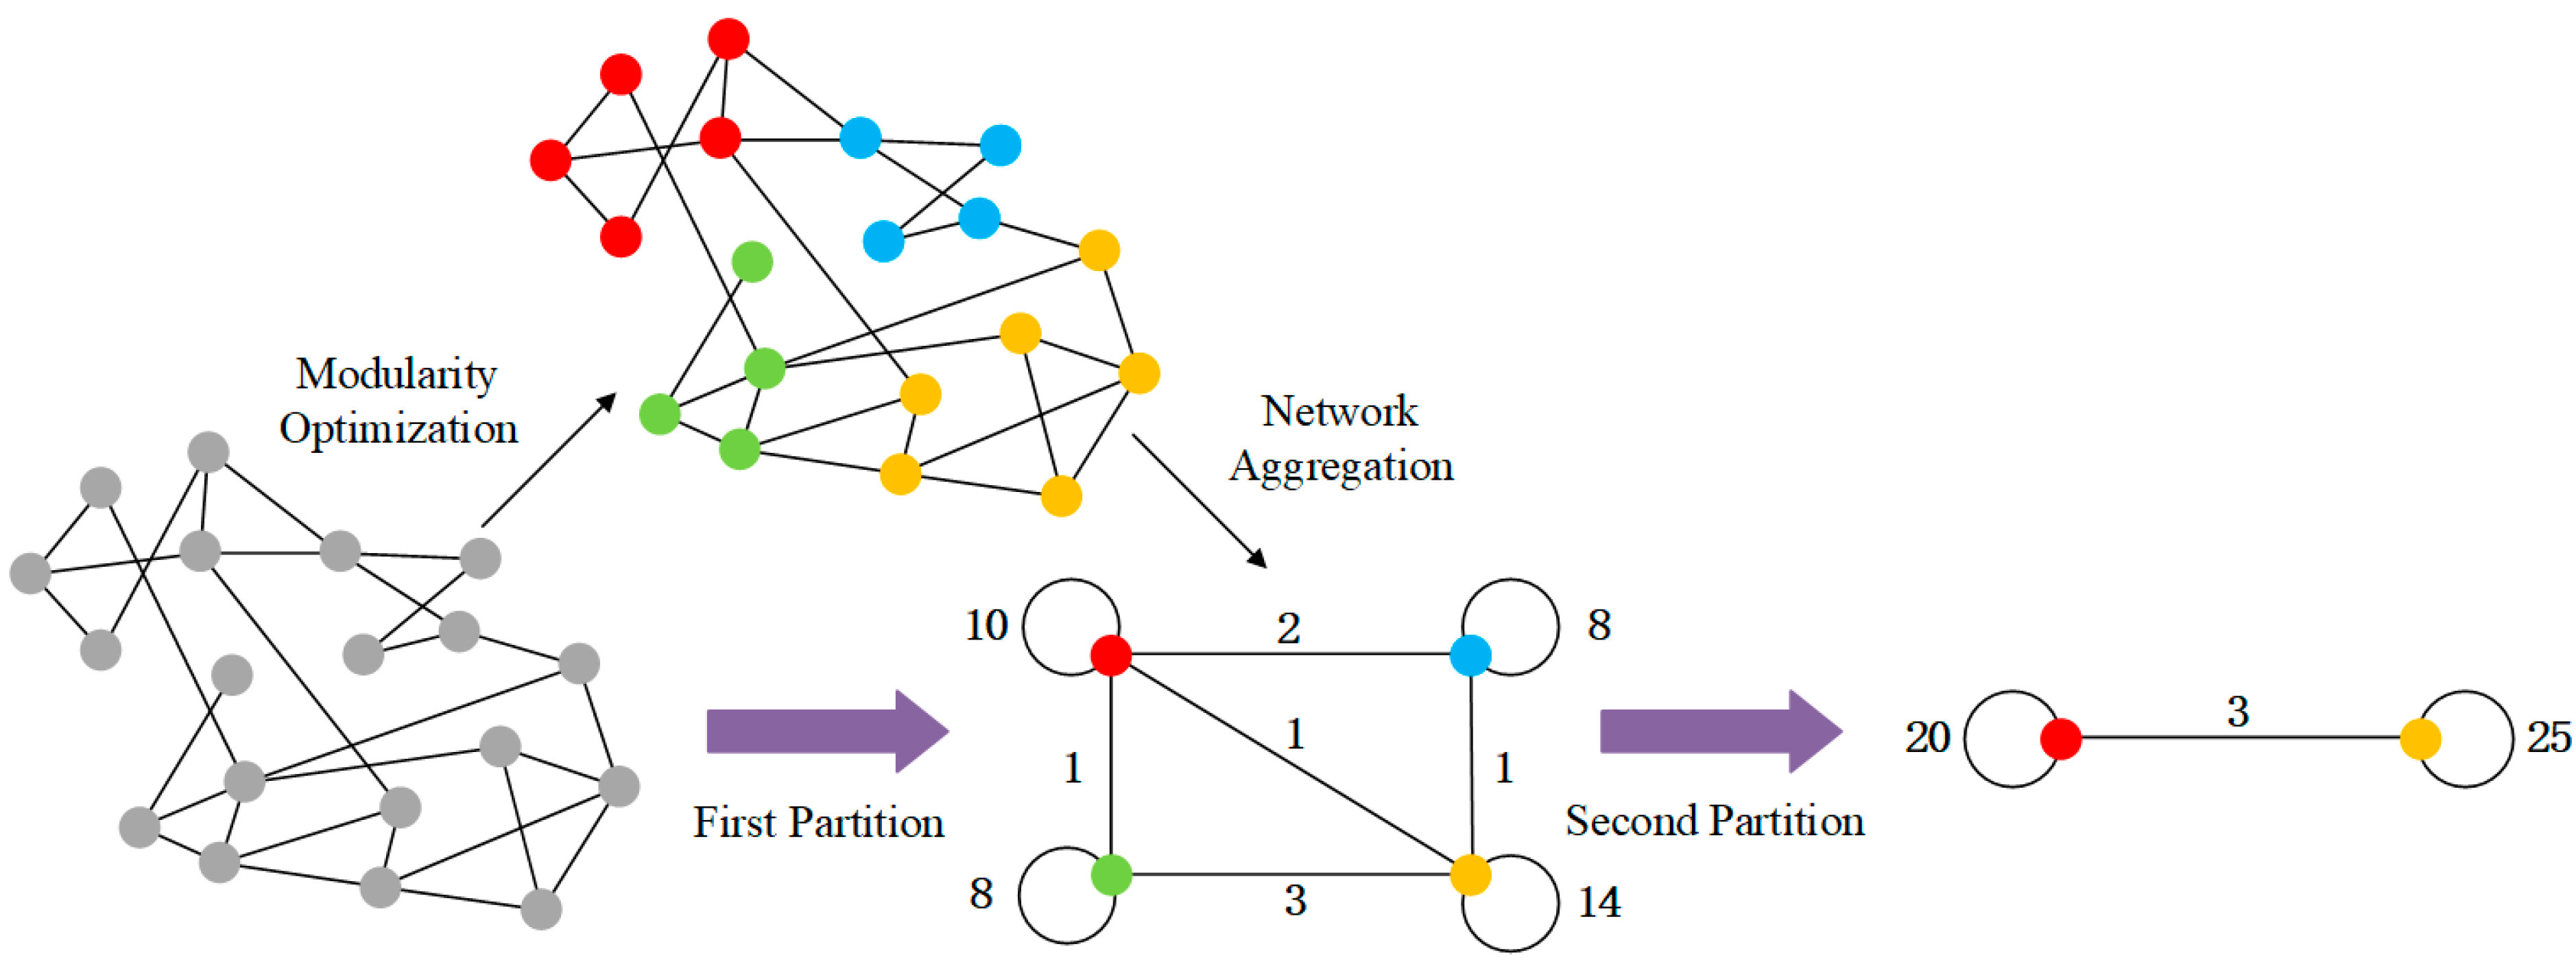
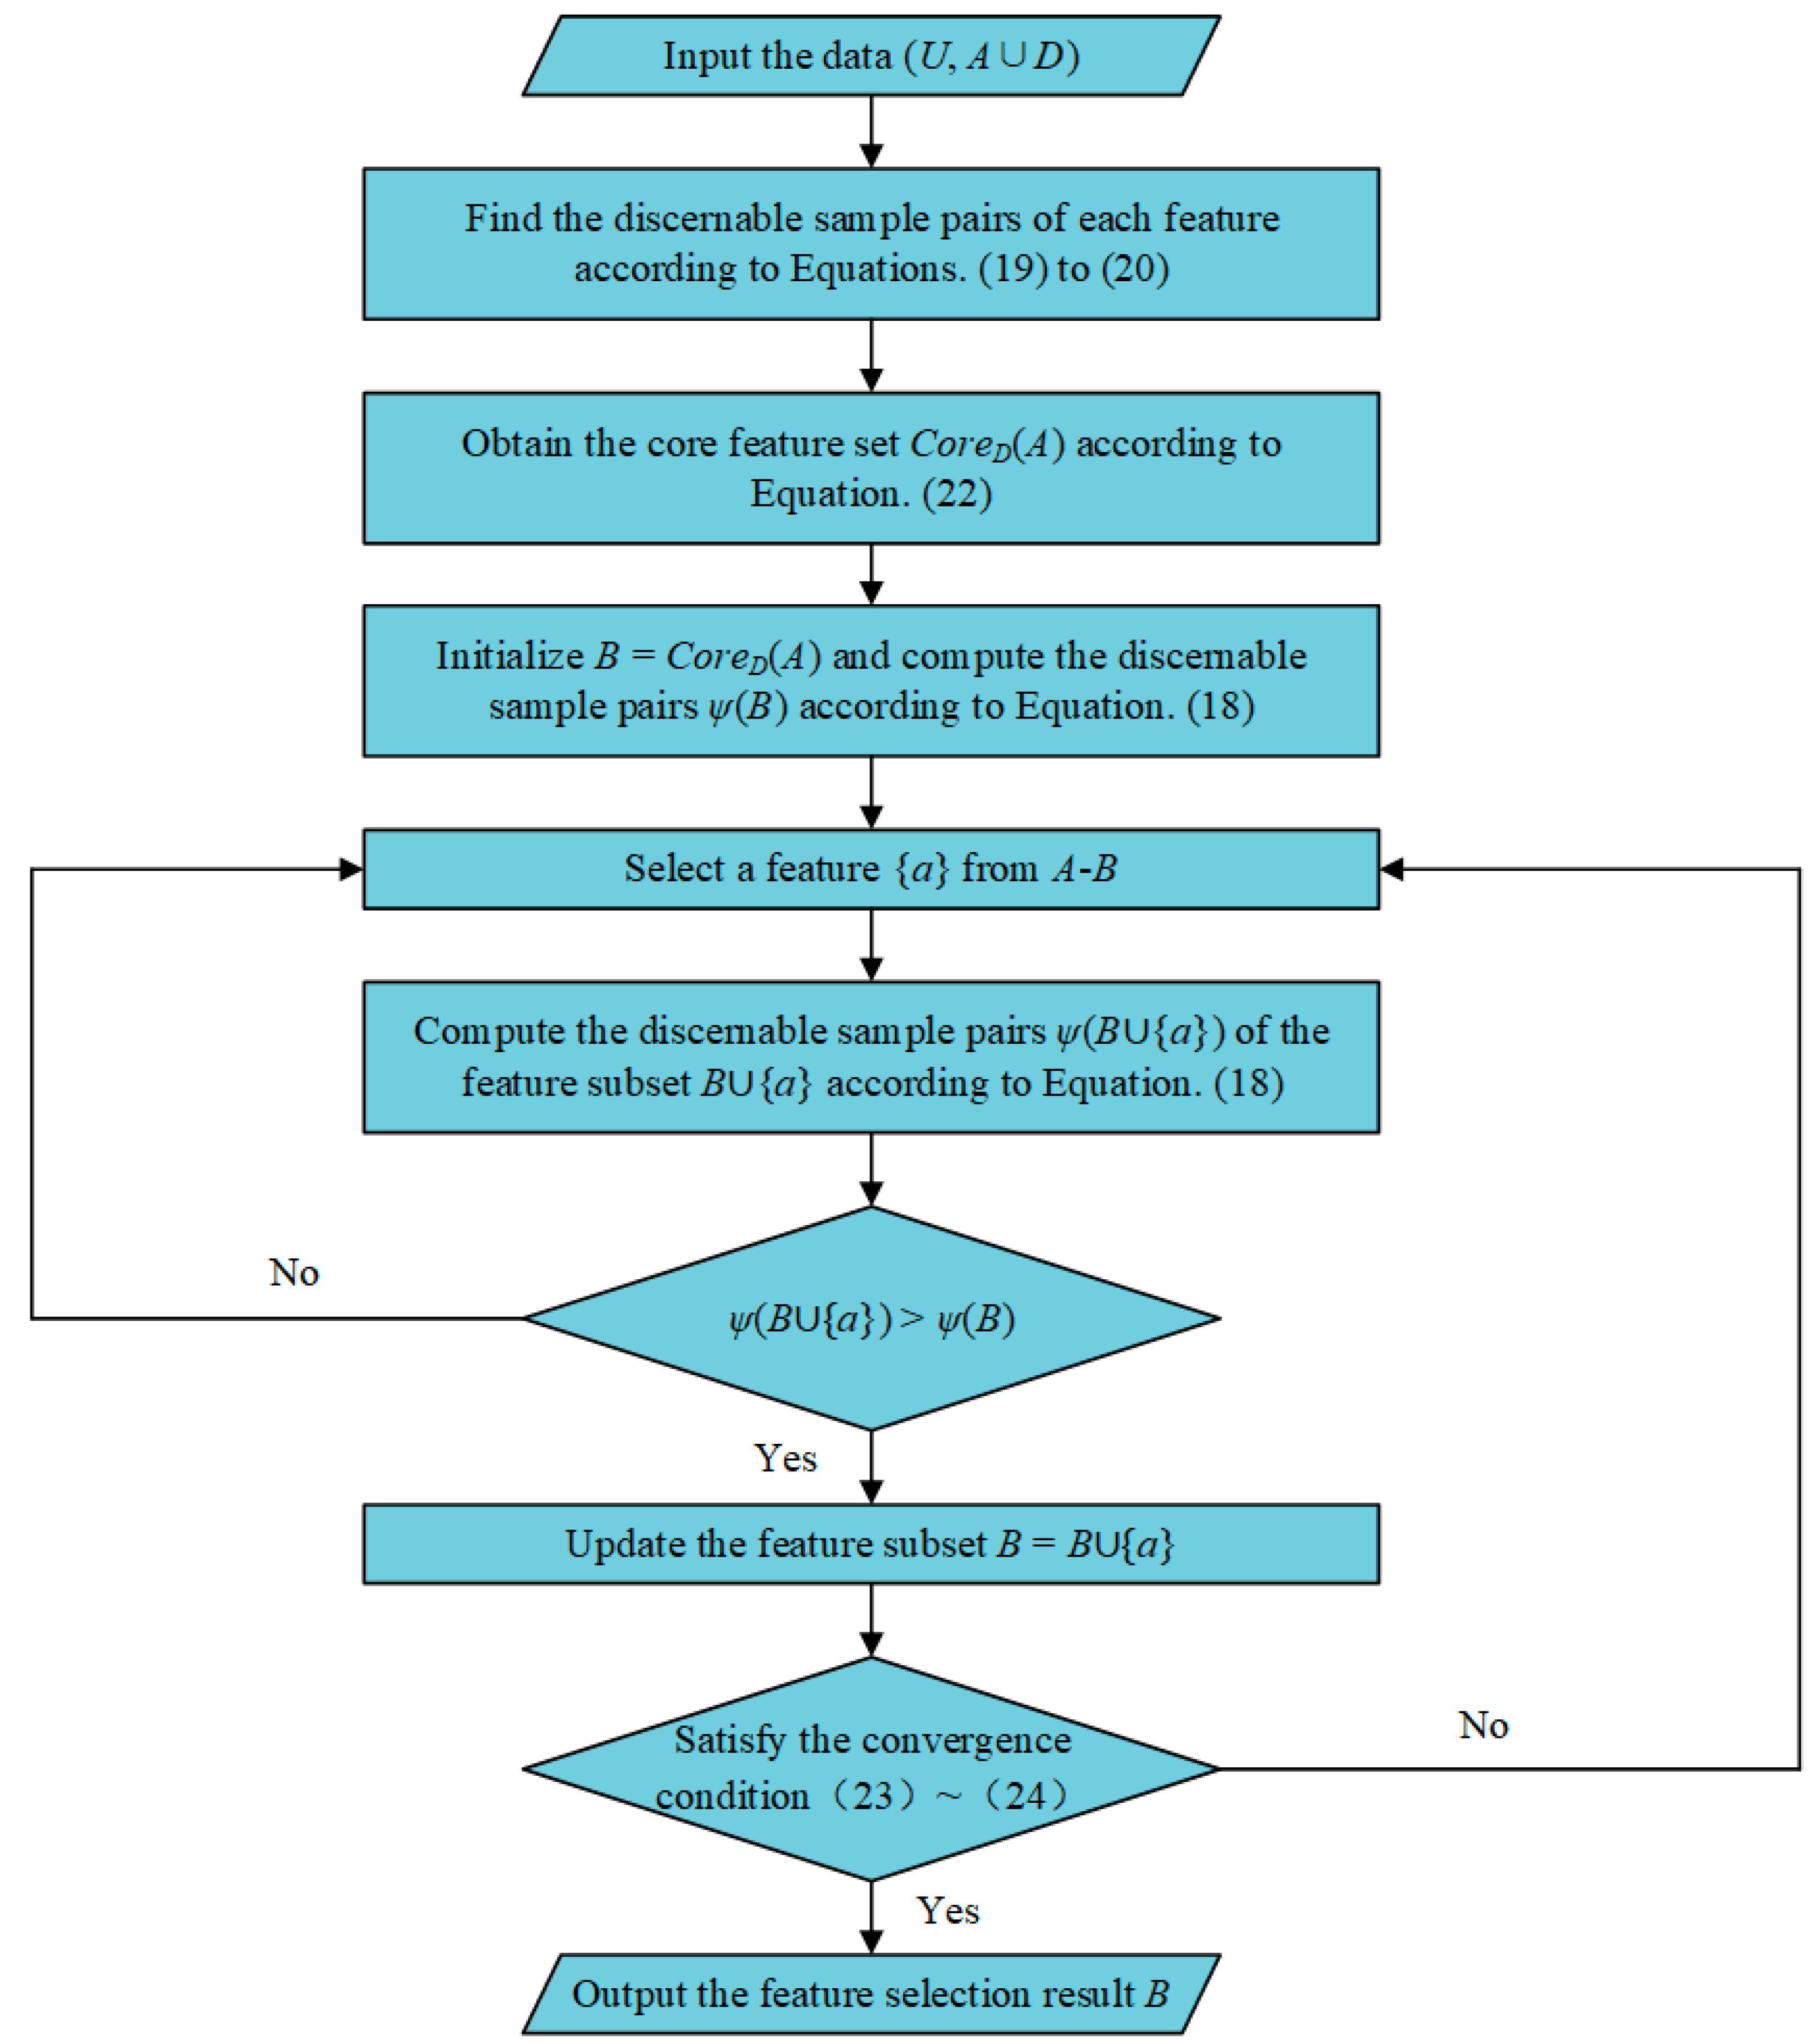
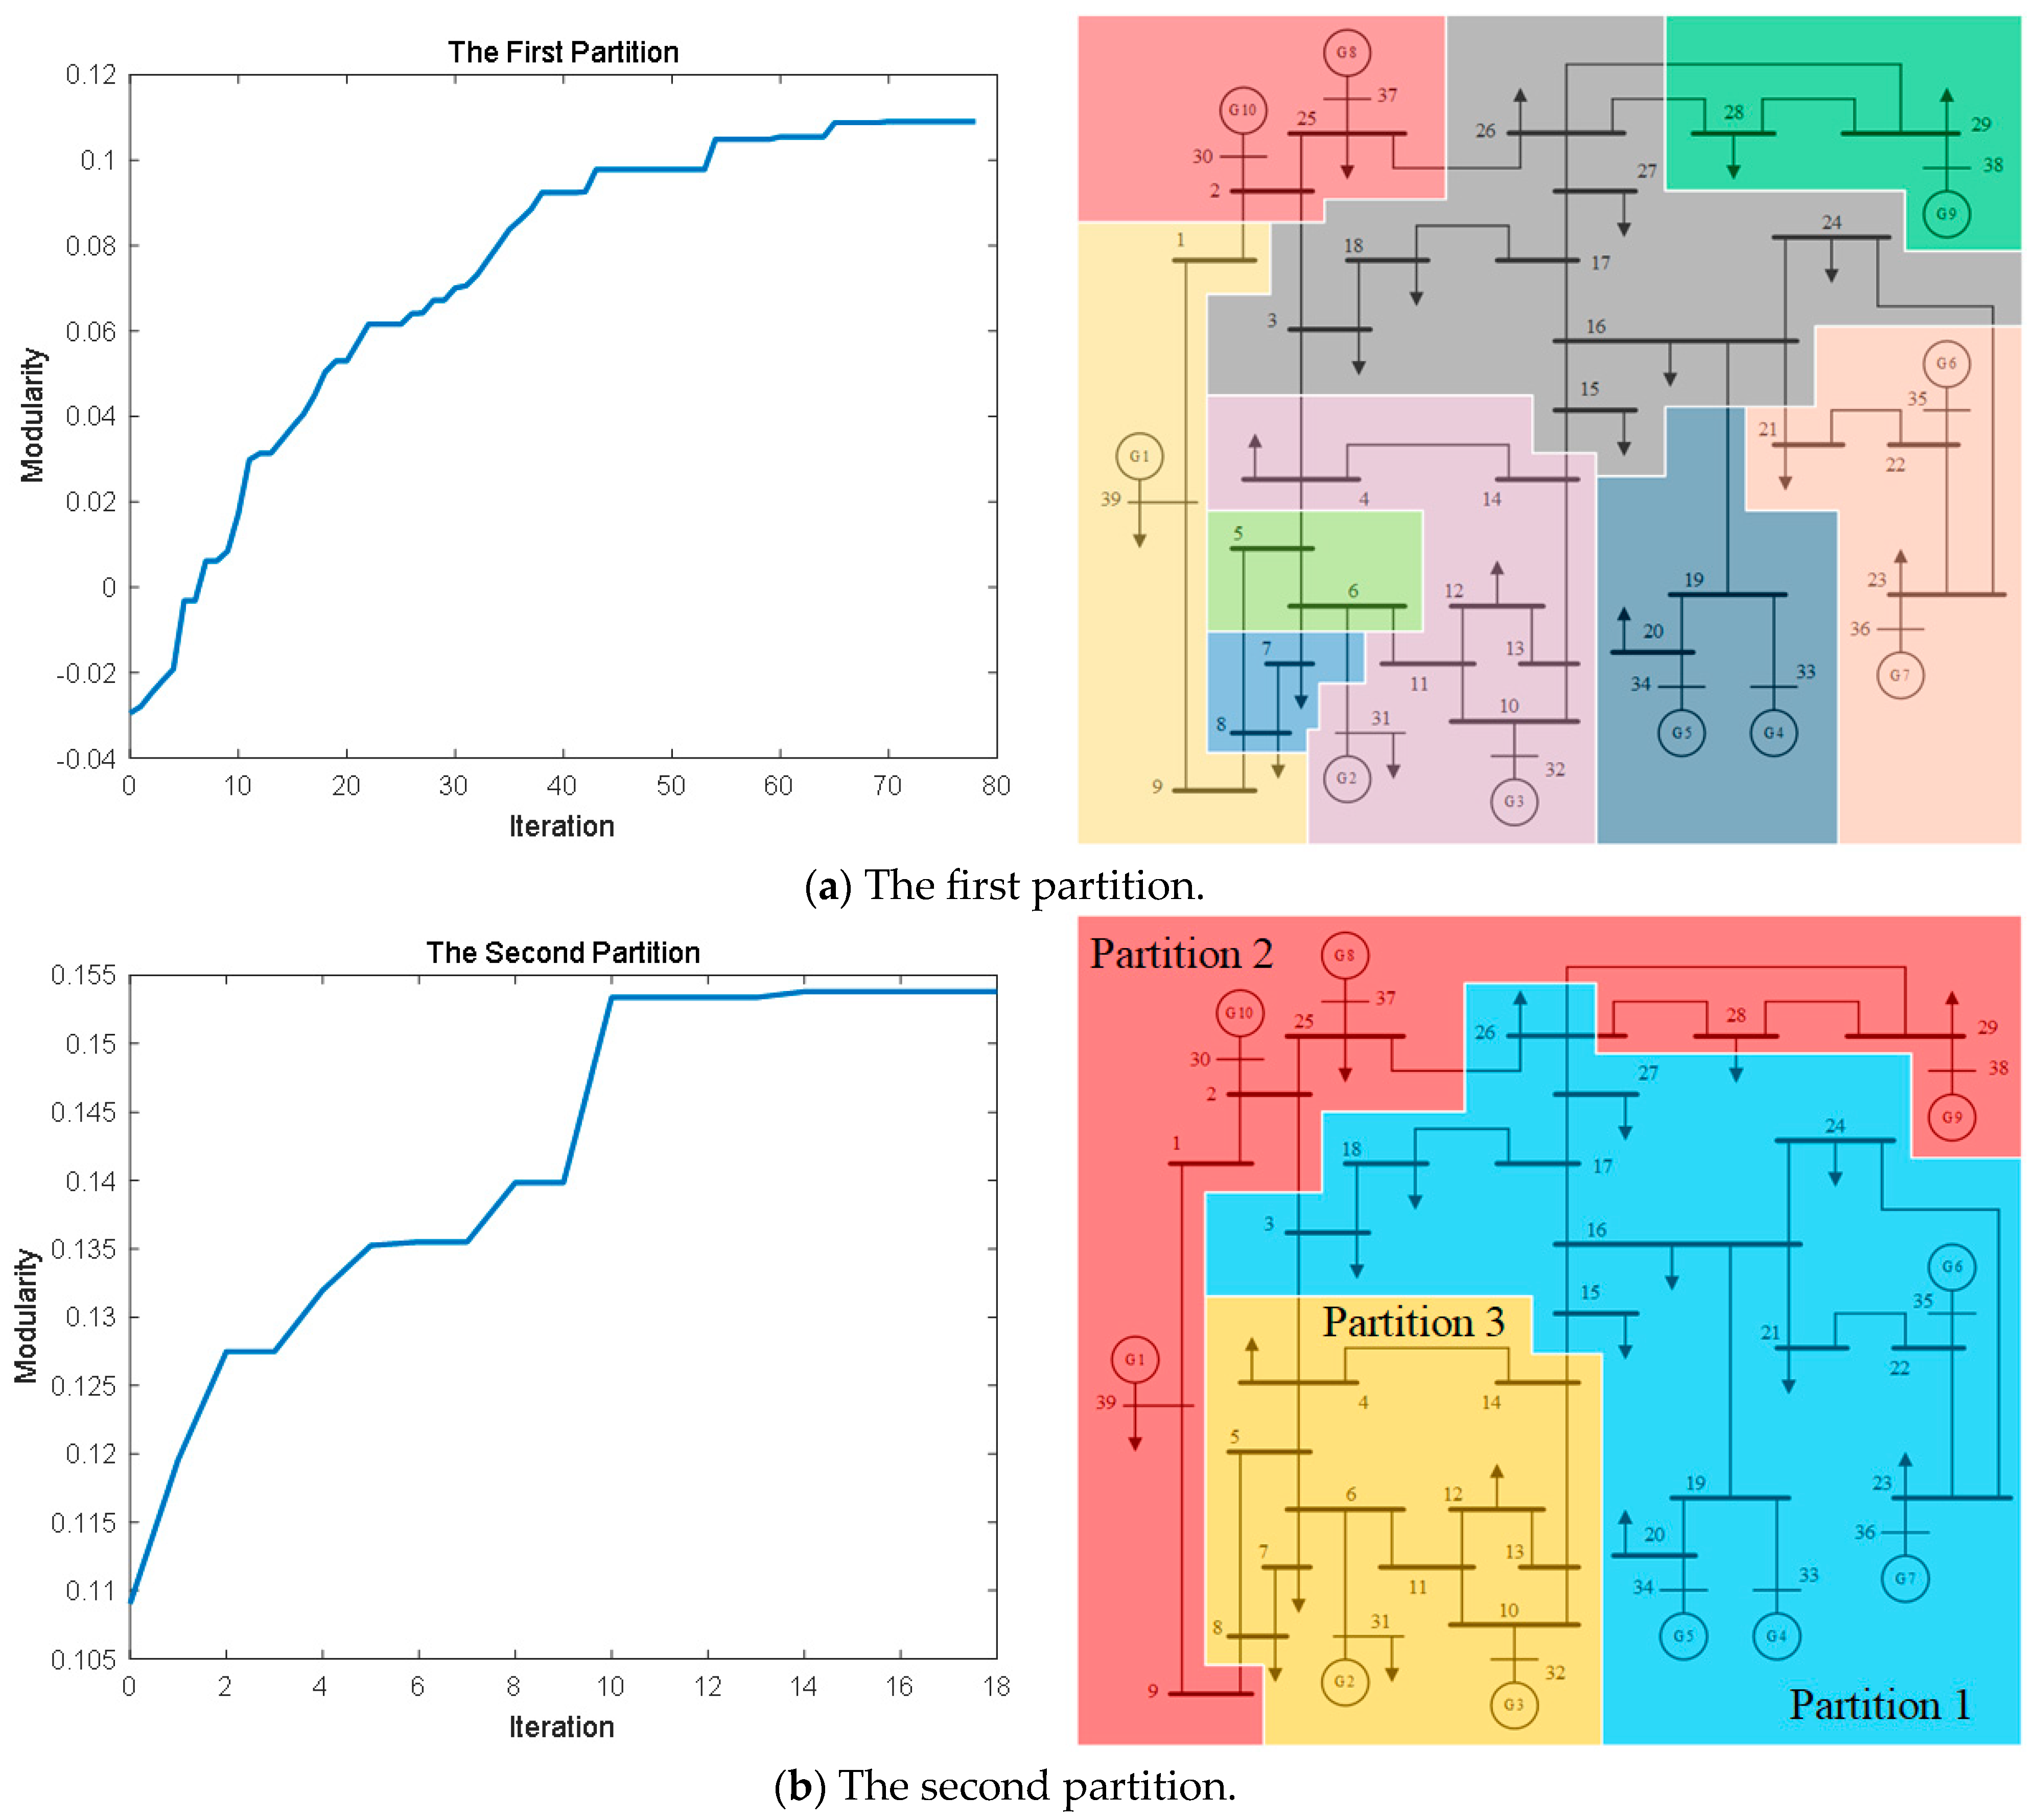
- Propose a distributed feature selection method based on grid partition and fuzzy-rough sets that can be applied to a power system DSR analysis with high-dimensional features. On the one hand, electrical partition by the Louvain algorithm can allocate the original feature set to multiple computational units for screening, while the connection between different feature subsets is minimized to a relatively low level, thereby avoiding large errors in the distributed results. On the other hand, feature selection based on the FRST is not only efficient but can also effectively take into account the intrinsic connections between features and, thus, improve the screening accuracy.
The remainder of this paper is organized as follows: Section 2 extends the definition of DSR for power systems and introduces the SVM method for approximating the extended DSR boundaries. Section 3 proposes a distributed feature selection method for screening critical DSR features. A case analysis was carried out and the experimental results are presented to substantiate the proposed method in Section 4. Finally, Section 5 draws the conclusion.
2. Power System Dynamic Security Region
2.1. Extension of Dynamic Security Region
In actual dispatching work, grid dispatchers are often concerned about the power transmissions of certain branches or critical sections, in addition to the power injection of each node in the power system. A conventional DSR is defined in the power injection space, which cannot help dispatchers identify potential problems on the branches quickly. Hence, to perform online real-time security monitoring, assessment, and control more scientifically and efficiently, this paper first extends the definition of DSR to the power space, which can be formulated as follows:
where denotes the DSR of the power system; is a given fault; and are the pre-fault and post-fault system topology, respectively; represents the system state at the instant of fault clearing ; represents the region of attraction (ROA) of the equilibrium point determined by the power vector ; and is the set of all that satisfies the constraints of the power flow equations, the upper and lower limits of node-injected power, and the upper and lower limits of branch-transmitted power.
where is the power flow equation, and and are the limit vectors of the power vector .
As can be seen, the extended DSR determines a set of all points in the pre-fault power space that can ensure the transient stability of the power system after a given fault has occurred. In an engineering application, grid dispatchers need to determine the corresponding extended DSR for each fault in the pre-selected fault set. It has been shown that for a given fault type, fault duration, and system topology before and after the fault, this set is uniquely determined, and it has the topological characteristics of internal connectivity, no void, compact boundaries, and no knot.
The mapping relationship between DSR and ROA is shown in Figure 1.
Figure 1.
The mapping relationship between DSR and ROA. and are the points inside and outside the DSR, respectively; and are the equilibrium points of the corresponding ROA after a given fault has occurred; and and are the system states at the instant of fault clearing.
2.2. Approximate Boundaries of Extended Dynamic Security Region
The essence of a power system DSR analysis is to determine its boundaries. For a conventional DSR defined in the power injection space, the boundaries can be easily approximated by one or a few hyperplanes [6]. However, after the extension, they might be curved because of the internal electrical connection between the node-injected power and branch-transmitted power. Given this property, in this paper, we introduce an SVM with a Gaussian kernel function to approximate the boundaries of the extended DSR.
SVM is an effective tool for two-group classification problems [39], and its basic principle is shown in Figure 2. It uses a convex optimization technique to find the optimal discriminant surface based on the linear discriminant function as follows:
where and are the normal vector and displacement term of the hyperplane, respectively; represents the sample data; and is a mapping function that maps the non-linearly classifiable input to a very high-dimension feature space so that they can become linearly classifiable.
Figure 2.
The basic principle of SVM.
Under an ideal condition (where the post-mapping sample data are completely linearly classifiable), the optimal values of and can be obtained by solving the following optimization problem:
where is the actual class of sample , and is the number of sample data.
However, there are often some outliers, resulting in the post-mapping sample data not being completely linearly classifiable because of the existence of system noise and measurement errors in practice. At this time, for the sake of classification accuracy, the optimization objective and constraints in Equation (4) can be modified by introducing relaxation variables:
where is a relaxation variable, and is a penalty parameter that implies the importance of the outliers. It should be noted that increasing can improve the classification performance of the discriminant surface on the training samples, but it also brings the risk of overfitting and additional training time costs.
When we solve the above optimization problem by the Lagrange function and Karush–Kuhn–Tucker (KKT) Conditions [40], it will involve the operation which is very difficult to solve since the dimension of is too high and even infinite. An effective approach is to construct a kernel function:
where Equation (7) is the Gaussian kernel function employed in this paper, and is the width, which is trained as a hyperparameter together with the penalty parameter .
Once we obtain the discriminant surface, it is possible to classify the new data according to the following decision rule: if , it is taken as a positive class; and if , it is taken as a negative class.
3. Distributed Feature Selection for Dynamic Security Region
To avoid expensive model training costs caused by a large number of grid features when approximating the boundaries of the extended DSR by SVM, as well as the decrease in decision-making ability caused by wrong feature selection results, this paper proposes a distributed feature selection method based on grid partition and fuzzy-rough sets. The framework is shown in Figure 3.
Figure 3.
The framework of the proposed method.
First, for a given fault and system topology, grid dispatchers perform the Latin hypercubic sampling simulation on a power simulation software, such as BPA (version 5.0) or DSP (version 2.3.11), to construct sample data suitable for the DSR analysis. Each sample should contain information such as active and reactive power injections of nodes, active and reactive power transmissions of branches, and whether the system can return to a stable state after the fault.
At the same time, the power system is abstracted into an undirected weighted network, where the weights of the edges between the nodes are measured by the inverse of the electrical distance. The smaller the electrical distance, the stronger the electrical connection between the nodes, and the larger the corresponding weights of the edges. The Louvain algorithm is employed to partition the above network in a bottom-up manner, and the corresponding grid-partition result is selected based on the available computational resources (i.e., the number of computational units).
The electrical distance can be computed as follows:
where denotes the electrical distance between node and node , and , , and are the elements of the corresponding position in the node impedance matrix.
Then, the constructed sample data are divided based on the grid-partition result. The connection between features belonging to different partitions is minimized to a relatively low level so that they can be distributively screened based on the FRST without causing a large impact on the screening accuracy. It should be noted that allocating the above screening process to different computational units can effectively reduce the overall time costs of the proposed method.
Concerning the allocation of features to different computational units, we can first assign a partition to each computational unit. Then, the node-injected power and branch-transmitted power corresponding to the nodes and branches contained in the partition are the features that the computational unit responsible for screening.
Finally, the feature selection results of all computational units are integrated in the coordination unit to complete the overall feature selection of the power system.
3.1. Louvain Algorithm
Considering the excessive computation of centralized feature selection when dealing with high-dimensional grid features, it is desirable to allocate the original feature set to multiple computational units for distributed screening. When dividing the feature set, we must ensure a maximum connection of features within the same partition and a minimum connection of features between different partitions. This helps reduce the difference between distributed and centralized feature selection results. Therefore, this paper uses the Louvain algorithm to partition the grid electrically.
The Louvain algorithm is a heuristic partition method based on modularity optimization proposed by Blondel et al. [41], which can quickly and accurately find modular partitions in a large-scale network. The higher the modularity, the tighter the connections between nodes within a partition and the sparser the connections between nodes in different partitions. The specific partition process is shown in Figure 4.
Figure 4.
The basic principle of the Louvain algorithm. The same-colored circles in the figure represent the same partition.
The algorithm can be divided into two phases in each iteration: modularity optimization and network aggregation. The modularity optimization phase first assigns a different partition to each node of the network and then tries to separate each node from its current partition and reassign it to the partition to which a neighboring node belongs. If the gain of modularity is positive, the corresponding node assignment result is retained; otherwise, the node stays in the original partition. This first phase stops when a local maximum of modularity is attained, i.e., when no node reassignment can improve the modularity.
Based on the partition result in the first phase, the second phase aggregates the nodes within the same partitions to obtain a new network. The weights of the edges between new nodes are given by the sum of the weights of the edges between partitions, and the weights of the self-loops of new nodes are given by the sum of the weights of the edges inside the corresponding partitions. Once the network aggregation phase is completed, it is then possible to reapply the first phase of the algorithm to the resulting undirected weighted network and to iterate until the modularity of the network is unchanged.
The modularity and the gain of modularity can be computed as follows:
where denotes the modularity of the network under the current partition result; is a set that includes all the current partitions; denotes the gain of modularity resulting from reassigning node to partition ; and are the sum of the weights of the edges inside partition and the sum of the weights of the edges connected to the nodes in partition , respectively; is the sum of the weights of all edges in the network; and and represent the sum of the weights of the edges from node to other nodes in partition and the sum of the weights of the edges attached to node , respectively.
3.2. Fuzzy-Rough Set Theory
The traditional rough set theory (RST) is an effective tool for dealing with uncertain and incomplete data. It is capable of removing redundant and irrelevant features from the data while keeping the decision-making ability of the data intact [42]. However, since this theory is developed based on the indistinguishable relation, which is an equivalent relation, it is necessary to discretize data when applying them to power systems with real-valued features [43,44,45]. This may cause serious information loss and affect the result of feature selection. Given this problem, Dubois et al. [46] extended the RST to the FRST with the incorporation of the fuzzy theory.
In the FRST, the structure of data can be written as a decision table , where is a nonempty set that includes all the samples; is a set of real-valued features that describe the samples; and is the decision attribute.
Instead of the indistinguishable relation in the RST, the FRST uses a fuzzy similarity relation (FSR) to assess the similarity between samples:
where and are the FSR between sample and sample on feature subset as well as feature , respectively, and is the feature value of sample .
Suppose there are different decision classes in the data, then can be divided into different sets accordingly. The fuzzy upper and lower approximation of sample on feature subset and decision class are defined as follows:
where . Then, the fuzzy positive region of sample on feature subset is defined as follows:
The fuzzy positive region is an important measure in the FRST regarding whether there is a change in the decision-making ability of the data before and after feature selection. When the feature subset satisfies the following conditions, it can be considered as a feature selection result of :
It should be noted that the feature subset that satisfies the above conditions is not unique. The number of features may fluctuate widely from case to case. For the sake of minimizing the number of screened features, this paper employs an incremental search method based on discernable sample pairs. The specific flowchart is shown in Figure 5. It should be noted that although the sequence of selecting different features from the set has an impact on the results, i.e., there is no guarantee that the subset of features obtained by this method is optimal, it can guarantee a relatively optimal result.
Figure 5.
Incremental search method based on discernable sample pairs.
Discernable sample pairs are the key to take into account the intrinsic connections between features and measure whether the added features can improve the decision-making ability of the selected feature set, which can be computed as follows:
where and denote the discernable sample pairs of feature subset and feature , respectively, and and are the decision classes of sample and sample , respectively.
Suppose is used to represent all possible feature selection results of the data , then the definition and the computational formula of the core feature set are, respectively, as follows:
The convergence condition of the method is as follows:
4. Examples
To demonstrate the effectiveness and efficiency of the proposed distributed feature selection method, we selected the IEEE 39-bus system [47] for application in this paper. This system consists of 10 generators, 39 nodes, and 46 branches. In the DSR analysis, 54 power injections of nodes and 184 power transmissions of branches need to be considered. The schematic of the IEEE 39-bus system is shown in Figure 6.
Figure 6.
The schematic of the IEEE 39-bus system. The numbers in the figure represent the node numbers.
For a better distribution of the constructed sample data throughout the feature space, we first performed stratified random sampling in the range of 75% to 125% of the original load and power generation level by the Latin hypercubic sampling method. The power flow calculation and transient stability calculation of each sample were carried out using the simulation software DSP of the China Southern Power Grid Electric Power Research Institute (CSG EPRI). In particular, the generator on node 31 was taken as the swing machine in the power flow calculation. A three-phase short circuit with a duration of five waveforms was set to occur at the end of branches 14–15 in the transient stability calculation. Finally, we obtained 435 stabilization sample data and 565 destabilization sample data.
At the same time, we computed the weight matrix of the nodes according to Equation (8) and partitioned the system electrically by the Louvain algorithm, as mentioned in Section 3.1. After partitioning twice, the algorithm converged. The modularity change curve and grid-partition result for each partition are shown in Figure 7.
Figure 7.
The modularity change curve and grid-partition result for each partition, where (a) is the first partition, and (b) is the second partition. The different colors in the figure represent different partitions.
As can be seen, the IEEE-39 bus system can be effectively decomposed into multiple modular partitions with the Louvain algorithm. When the grid-partition result is like Figure 7b, the overall modularity of the system is maximized at 0.1538.
Then, we divided the constructed sample data based on the above grid-partition results and the available computational resources (this example assumes that there are three computational units for convenience of analysis) so that the high-dimensional features were allocated to the respective partitions to which they belonged for distributed screening. The number of features in each partition is shown in Table 1.
Table 1.
The number of features in each partition.
In the next step, centralized feature selection and distributed feature selection were carried out based on the FRST, as mentioned in Section 3.2. Meanwhile, to show the impact of the DSR analysis before and after the feature selection, the SVM method mentioned in Section 2.2 was used to determine the DSR boundaries of the IEEE-39 bus system. When training the SVM model, we randomly selected 700 samples as the training samples and the remaining 300 samples as the test samples; we set the logarithm of the penalty parameter in Equation (5) and the width in Equation (7) to change in the range in a step of 0.1, and we employed 5-fold cross-validation to select the value that made the model most accurate. The experimental results are described below.
Figure 8 shows the projection results of the DSR constructed on the original feature set for the 2D power injection space and the 2D branch transmission space. From the results presented in Table 2, it can be seen that the decision-making accuracy (i.e., DSR analysis accuracy) based on the screened feature set exceeds the decision-making accuracy based on the original feature set by 1.34%, both for centralized and distributed feature selections. In addition, compared to the centralized method, the screened feature set obtained by the distributed method has one more power transmission of the branches, but the time consumed is 3.0636 s less, and the performance is improved by 84.16%. It should be noted that decision-making accuracy is an important measure of whether a screened feature set is good or bad. It is related to whether the grid dispatchers can accurately identify the security and stability of the power system after a given fault has occurred. Therefore, decision-making accuracy based on screened feature sets should be the primary criterion to follow when comparing the performance between different feature selection methods. Then, we compared the time cost to show their scalability (ability to be applied to large-scale systems). Furthermore, the centralized method theoretically obtains more accurate results than the distributed method, but this should be expressed as fewer screened-out features, as shown in this paper. Therefore, it is reasonable that the decision-making accuracies of the screened feature sets obtained by the centralized and distributed methods are the same, as shown in Table 2.
Figure 8.
The DSR in a 2D projected space, where (a) is the result of the projection to the active injected power space of load node 15 and generator node 30, and (b) is the result of the projection to the active transmitted power space of sections 2−3 and 26−27.
Table 2.
Comparison of DSR analysis accuracy before and after feature selection.
Decision-making accuracy can be computed as follows:
where denotes the number of test samples, and denotes the number of samples with correct decisions in the test samples.
This study also selected several other typical filter feature selection methods for a comparative analysis, including the Relief, Fisher Score, and Mutual Information methods. It should be noted that these filter methods only provide an evaluation index of each feature, so we needed to select a certain number (58 just like during the centralized feature selection) of top-ranked features as the results. The specific results are shown in Table 3.
Table 3.
Comparison of the proposed method and other commonly used filter methods.
As can be seen, although the Relief and Fisher Score methods have lower time costs, one can observe the superiority of the proposed method in terms of decision-making accuracy based on their screened feature sets, which is higher than other methods by 1%, 3%, and 5.64%. The Mutual Information method gives the worst results, not only in terms of the highest time costs but also the lowest decision-making accuracy of 87%. In particular, its extremely high time costs stem from computing the mutual information between features and the decision attribute made by the nearest neighbor technique.
In summary, the proposed distributed feature selection method based on grid partition and fuzzy-rough sets has the following advantages: (1) It can help simplify the power system DSR analysis with high-dimensional features while screening for critical features, and it demonstrates good practicality. (2) Compared to other commonly used filter methods, it gains the highest screening accuracy with acceptable time costs. Furthermore, it should be noted that the more computational resources available, the more groups the high-dimensional features can be divided into based on the grid-partition results of the Louvain algorithm, and the more efficient the feature selection becomes.
5. Conclusions
This paper proposes a distributed feature selection method based on grid partition and fuzzy-rough sets for power system DSR analyses. The method consists of two main parts: partitioning the power grid and dividing the original feature set by the Louvain algorithm, and realizing feature selection based on the FRST. On the one hand, the Louvain algorithm can quickly and accurately find modular partitions in a large-scale grid so that the connection of the features between different partitions is minimized to a relatively low level. At this point, the high-dimensional features can be allocated to multiple computational units for distributed screening without causing a large impact on screening accuracy. On the other hand, compared to other filter methods, the feature selection method based on the FRST can effectively consider the intrinsic connections between features and avoid the redundancy of results. The experiment results show the effectiveness and efficiency of the proposed method. Our future research will focus on exploring a better method to approximate the DSR boundaries and implementing it in real-world engineering applications with the proposed feature selection method.
Author Contributions
Conceptualization, Y.T. and Z.D.; methodology, Y.T.; software, Y.T.; validation, Z.D. and Y.T.; formal analysis, Y.T.; investigation, W.Z. and B.C.; resources, Z.D.; data curation, Y.T.; writing—original draft preparation, Y.T.; writing—review and editing, W.Z. and B.C.; visualization, Y.T. and Z.D.; supervision, Z.D.; project administration, Y.T.; funding acquisition, Z.D. All authors have read and agreed to the published version of the manuscript.
Funding
This research was funded by the National Natural Science Foundation of China, grant number U22B6007.
Data Availability Statement
Acknowledgments
The authors would like to express our sincere gratitude to the anonymous referees for providing valuable suggestions and comments that have significantly contributed to the improvement of our manuscript.
Conflicts of Interest
The authors declare no conflicts of interest.
Abbreviations
| Abbreviations/Nomenclatures | |
| SR | Security Region |
| SSSR | Steady-state Security Region |
| DSR | Dynamic Security Region |
| ROA | Region of Attraction |
| TEF | Transient Energy Function |
| EEAC | Extended Equal Area Criterion |
| RST | Rough Set Theory |
| FRST | Fuzzy-rough Set Theory |
| FSR | Fuzzy Similarity Relation |
| SVM | Support Vector Machine |
| KKT | Karush–Kuhn–Tucker Conditions |
| Variables | |
| The DSR of the power system | |
| The fault to be studied | |
| The power vector to be studied or the class of sample | |
| The lower limit vectors of | |
| The upper limit vectors of | |
| The system state or the sample data | |
| The system state at the instant of fault clearing | |
| The equilibrium point in the state space | |
| The ROA of the power system | |
| The set of that satisfies the constraints | |
| The normal vector of the hyperplane | |
| The mapping function | |
| The displacement term of the hyperplane | |
| The number of sample data | |
| The relaxation variable | |
| The penalty parameter | |
| The kernel function | |
| The width parameter in | |
| The electrical distance between node and node | |
| The elements of the corresponding position in the node impedance matrix | |
| The modularity of the network | |
| The gain of modularity | |
| The sum of the weights of the edges inside partition | |
| The sum of the weights of the edges connected to the nodes in partition | |
| The sum of the weights of all edges in the network | |
| The sum of the weights of the edges from node to other nodes in partition | |
| The sum of the weights of the edges attached to node | |
| The FSR between sample and sample on feature subset | |
| The FSR between sample and sample on feature | |
| The fuzzy upper approximation of sample on feature subset and decision class | |
| The fuzzy lower approximation of sample on feature subset and decision class | |
| Determine whether belongs to decision class | |
| The fuzzy positive region of sample on feature subset | |
| The discernable sample pairs of feature subset | |
| The discernable sample pairs of feature | |
| The decision classes of sample | |
| All possible feature selection results of the data | |
| The core feature set | |
| The decision-making accuracy | |
| The number of test samples | |
| The number of samples with correct decisions in the test samples | |
References
- Xiong, L.; Liu, X.; Liu, Y.; Zhuo, F. Modeling and stability issues of voltage-source converter-dominated power systems: A review. CSEE J. Power Energy Syst. 2020, 8, 1530–1549. [Google Scholar] [CrossRef]
- Bergen, A.R. Power Systems Analysis; Pearson Education India: Bengaluru, India, 2009. [Google Scholar]
- Kundur, P. Power system stability. In Power System Stability and Control; CRC Press: Boca Raton, FL, USA, 2007; Volume 10, ISBN 978-1-4398-8320-4. [Google Scholar]
- Yu, Y.X. Review of study on methodology of security regions of power system. J. Tianjin Univ. 2008, 41, 635–646. [Google Scholar]
- Yu, Y.; Liu, Y.; Qin, C.; Yang, T. Theory and method of power system integrated security region irrelevant to operation states: An introduction. Engineering 2020, 6, 754–777. [Google Scholar] [CrossRef]
- Yu, Y.; Zeng, Y.; Feng, F. Differential topological characteristics of the DSR on injection space of electrical power system. Sci. China Ser. E Technol. Sci. 2002, 45, 576–584. [Google Scholar] [CrossRef]
- Zeng, Y.; Yu, Y. A practical direct method for determining dynamic security regions of electrical power systems. In Proceedings of the International Conference on Power System Technology, Kunming, China, 13–17 October 2002; Volume 2, pp. 1270–1274. [Google Scholar] [CrossRef]
- Xia, S.; Chen, S.; Guo, Z.; Xu, Y. The application of energy sensitivity for practical dynamic security region calculation. In Proceedings of the 2012 Asia-Pacific Power and Energy Engineering Conference, Shanghai, China, 27–29 March 2012; pp. 1–4. [Google Scholar] [CrossRef]
- Zeng, Y.; Yang, Y.; Qin, C.; Chang, J.; Zhang, J.; Tu, J. A Method for Building Practical Dynamic Security Region Based on Phase-plane Trajectory. Proc. CSEE 2018, 38, 1905–1912. [Google Scholar] [CrossRef]
- Xu, J.; Chen, Y.; Fan, Y. Dynamic Security Regions of Electric Power System Based on Extended Equal-area Criterion. Proc. CSEE 2007, 27, 20–26. [Google Scholar] [CrossRef]
- Liu, H.D.; Li, Q.; Feng, W.; Gao, X.H.; Chang, A.; Li, T. A Rapid Method to Calculate the Hyper-Plane of DSR Based on EEAC. Adv. Mater. Res. 2013, 694, 2993–2996. [Google Scholar] [CrossRef]
- Wang, H.; Li, Z. A review of power system transient stability analysis and assessment. In Proceedings of the 2019 Prognostics and System Health Management Conference (PHM-Qingdao), Qingdao, China, 25–27 October 2019; pp. 1–6. [Google Scholar] [CrossRef]
- Maihemuti, S.; Wang, W.; Wang, H.; Wu, J.; Zhang, X. Dynamic security and stability region under different renewable energy permeability in IENGS system. IEEE Access 2021, 9, 19800–19817. [Google Scholar] [CrossRef]
- Liu, Y.L.; Shi, X.J.; Xu, Y. A hybrid data-driven method for fast approximation of practical dynamic security region boundary of power systems. Int. J. Electr. Power Energy Syst. 2020, 117, 105658. [Google Scholar] [CrossRef]
- Ren, Z.; Hu, W.; Ma, K.; Zhang, Y.; Liu, W.; Xiong, J. Dynamic security region algorithm considering sample imbalance and misclassification cost. In Proceedings of the 2021 13th IEEE PES Asia Pacific Power & Energy Engineering Conference (APPEEC), Thiruvananthapuram, India, 21–23 November 2021; pp. 1–6. [Google Scholar] [CrossRef]
- Karunadsa, P.S.; Annakkage, U.D.; MacDonald, B.A. Dynamic security control using secure regions derived from a decision tree technique. In Proceedings of the 2000 Power Engineering Society Summer Meeting (Cat. No. 00CH37134), Seattle, WA, USA, 16–20 July 2000; Volume 3, pp. 1861–1865. [Google Scholar] [CrossRef]
- Zeng, Y.; Fan, J.C.; Yu, Y.X.; Lu, F.; Fang, Y.G. Practical dynamic security regions of bulk power systems. Autom. Electr. Power Syst. 2001, 25, 6–10. [Google Scholar]
- Qiu, L.; Zhao, J.; Jia, H.; Huang, H.; Li, P.; Li, Z. Studies on the section thermal limits based on security region. In Proceedings of the 2013 IEEE International Conference of IEEE Region 10 (TENCON 2013), Xi’an, China, 22–25 October 2013; pp. 1–4. [Google Scholar] [CrossRef]
- Liang, L.; Hu, W.; Zhang, Y.; Ma, K.; Gu, Y.; Tian, B.; Li, H. An algorithm with LightGBM+ SVM fusion model for the assessment of dynamic security region. In Proceedings of the 2021 International Conference on Power System and Energy Internet (PoSEI2021), Chengdu, China, 16–18 April 2021; Volume 256, p. 02022. [Google Scholar] [CrossRef]
- Zhiqiang, G.; Yuan, C.; Yongming, H. Power Systems Intrusion Detection Using Novel Wrapped Feature Selection Framework. In Proceedings of the 2020 7th International Conference on Information, Cybernetics, and Computational Social Systems (ICCSS), Guangzhou, China, 13–15 November 2020; pp. 446–450. [Google Scholar] [CrossRef]
- Cheng, W.; Zheng, L.; Wu, J. Conditional Mutual Information Based Interpretable Key Feature Selection Method for Power System Security Analysis. In Proceedings of the 2021 IEEE 5th Conference on Energy Internet and Energy System Integration (EI2), Taiyuan, China, 22–24 October 2021; pp. 2907–2911. [Google Scholar] [CrossRef]
- Gu, X.; Li, Y.; Jia, J. Feature selection for transient stability assessment based on kernelized fuzzy rough sets and memetic algorithm. Int. J. Electr. Power Energy Syst. 2015, 64, 664–670. [Google Scholar] [CrossRef]
- Chen, Z.; Han, X.; Zhang, H.; Zhao, J.; Mei, S. Feature Selection Method for Power System Transient Stability Status Prediction Considering Class Imbalanced Characteristic. In Proceedings of the 2018 2nd IEEE Conference on Energy Internet and Energy System Integration (EI2), Beijing, China, 20–22 October 2018. [Google Scholar] [CrossRef]
- Lee, C.; Shen, Y. Optimal Feature Selection for Power-Quality Disturbances Classification. IEEE Trans. Power Deliv. 2011, 26, 2342–2351. [Google Scholar] [CrossRef]
- Gao, H.; Cai, G.; Yang, D.; Lixin, W.; Hao, Y. Feature selection approach based on FCC-eAI in static voltage stability margin estimation. Electr. Power Autom. Equip. 2023, 43, 168–176. [Google Scholar] [CrossRef]
- Li, X.; Wang, Y.; Ruiz, R. A survey on sparse learning models for feature selection. IEEE Trans. Cybern. 2020, 52, 1642–1660. [Google Scholar] [CrossRef] [PubMed]
- Blum, A.L.; Langley, P. Selection of relevant features and examples in machine learning. Artif. Intell. 1997, 97, 245–271. [Google Scholar] [CrossRef]
- Wang, S.; Wang, K.; Zheng, L. Feature selection via analysis of relevance and redundancy. J. Beijing Inst. Technol. 2008, 17, 300–304. [Google Scholar]
- Nguyen, N.A.; Quyen, H.A.; Le, T.N.; Phan, T.T.B. An Improvement Forward Floating Search Algorithm for Feature Selection in Power System Transient Stability Classification; Springer International Publishing: Berlin/Heidelberg, Germany, 2016. [Google Scholar] [CrossRef]
- Tan, B.; Yang, J.; Zhou, T.; Xiao, Y.; Zhou, Q. A Novel Temporal Feature Selection for Time-Adaptive Transient Stability Assessment. In Proceedings of the 2019 IEEE PES Innovative Smart Grid Technologies Europe, Bucharest, Romania, 29 September–2 October 2019. [Google Scholar] [CrossRef]
- Zhang, Y.; Xu, T.; Ren, X. Key Feature Selection Method for Intelligent Assessment of Transient Power Angle Stability Based on Physical Mechanism and Improved Relief. In Proceedings of the 2022 Power System and Green Energy Conference (PSGEC), Shanghai, China, 24–26 August 2022; pp. 632–636. [Google Scholar] [CrossRef]
- Zhang, C.; Li, Y.; Yu, Z.; Tian, F. Feature selection of power system transient stability assessment based on random forest and recursive feature elimination. In Proceedings of the 2016 IEEE PES Asia-Pacific Power and Energy Engineering Conference (APPEEC), Xi’an, China, 25–28 October 2016. [Google Scholar] [CrossRef]
- Zhang, Y.; Xu, T.; Ren, X.; Bao, Y.; Wu, F.; Zhang, J. Comparison and improvement of key feature selection methods for intelligent assessment of transient power angle stability. In Proceedings of the 2022 IEEE 5th International Electrical and Energy Conference (CIEEC), Nangjing, China, 27–29 May 2022; pp. 1563–1568. [Google Scholar] [CrossRef]
- Li, P.; Dong, X.; Meng, Q.; Jiming, C. Transient stability assessment method for power system based on Fisher Score feature selection. Electr. Power Autom. Equip./Dianli Zidonghua Shebei 2023, 43, 117. [Google Scholar] [CrossRef]
- Vergara, J.R.; Estévez, P.A. A review of feature selection methods based on mutual information. Neural Comput. Appl. 2014, 24, 175–186. [Google Scholar] [CrossRef]
- Jiang, B.; Liu, Y.; Geng, H.; Wang, Y.; Zeng, H.; Ding, J. A Holistic Feature Selection Method for Enhanced Short-term Load Forecasting of Power System. IEEE Trans. Instrum. Meas. 2022, 72, 2500911. [Google Scholar] [CrossRef]
- Kong, L.; Qu, W.; Yu, J.; Zuo, H.; Chen, G.; Xiong, F.; Pan, S.; Lin, S.; Qiu, M. Distributed feature selection for big data using fuzzy rough sets. IEEE Trans. Fuzzy Syst. 2019, 28, 846–857. [Google Scholar] [CrossRef]
- Huang, T.; Sun, H.; Guo, Q. Online distributed security feature selection based on big data in power system operation. Autom. Electr. Power Syst. 2016, 40, 137–140. [Google Scholar] [CrossRef]
- Cortes, C.; Vapnik, V. Support-vector networks. Mach. Learn. 1995, 20, 273–297. [Google Scholar] [CrossRef]
- Kuhn, H.W.; Tucker, A.W. Nonlinear programming. In Proceedings of the Second Berkeley Symposium on Mathematical Statistics and Probability, Berkeley, CA, USA, 31 July–12 August 1950; University of California Press: Berkeley, CA, USA, 1951. [Google Scholar]
- Blondel, V.D.; Guillaume, J.-L.; Lambiotte, R.; Lefebvre, E. Fast unfolding of communities in large networks. J. Stat. Mech. Theory Exp. 2008, 2008, P10008. [Google Scholar] [CrossRef]
- Pawlak, Z. Rough sets and intelligent data analysis. Inf. Sci. 2002, 147, 1–12. [Google Scholar] [CrossRef]
- Gao, S.; Dong, L.; Liao, X.Z.; Gao, Y. Long-Term Wind Power Prediction Based on Rough Set. Appl. Mech. Mater. 2013, 329, 411–415. [Google Scholar] [CrossRef]
- Xiao, Z.; Ye, S.-J.; Zhong, B.; Sun, C.-X. BP neural network with rough set for short term load forecasting. Expert Syst. Appl. 2009, 36, 273–279. [Google Scholar] [CrossRef]
- Gan, S.C.; Zhou, A.H.; Guo, H.; Tang, L. Application of Variable Precision Rough Set in Power Transformer Fault Diagnosis. Appl. Mech. Mater. 2013, 373, 824–828. [Google Scholar] [CrossRef]
- Dubois, D.; Prade, H. Putting rough sets and fuzzy sets together. In Intelligent Decision Support: Handbook of Applications and Advances of the Rough Sets Theory; Springer: Dordrecht, The Netherlands, 1992; pp. 203–232. [Google Scholar] [CrossRef]
- Pai, A. Energy Function Analysis for Power System Stability; Springer Science & Business Media: Berlin/Heidelberg, Germany, 1989. [Google Scholar] [CrossRef]
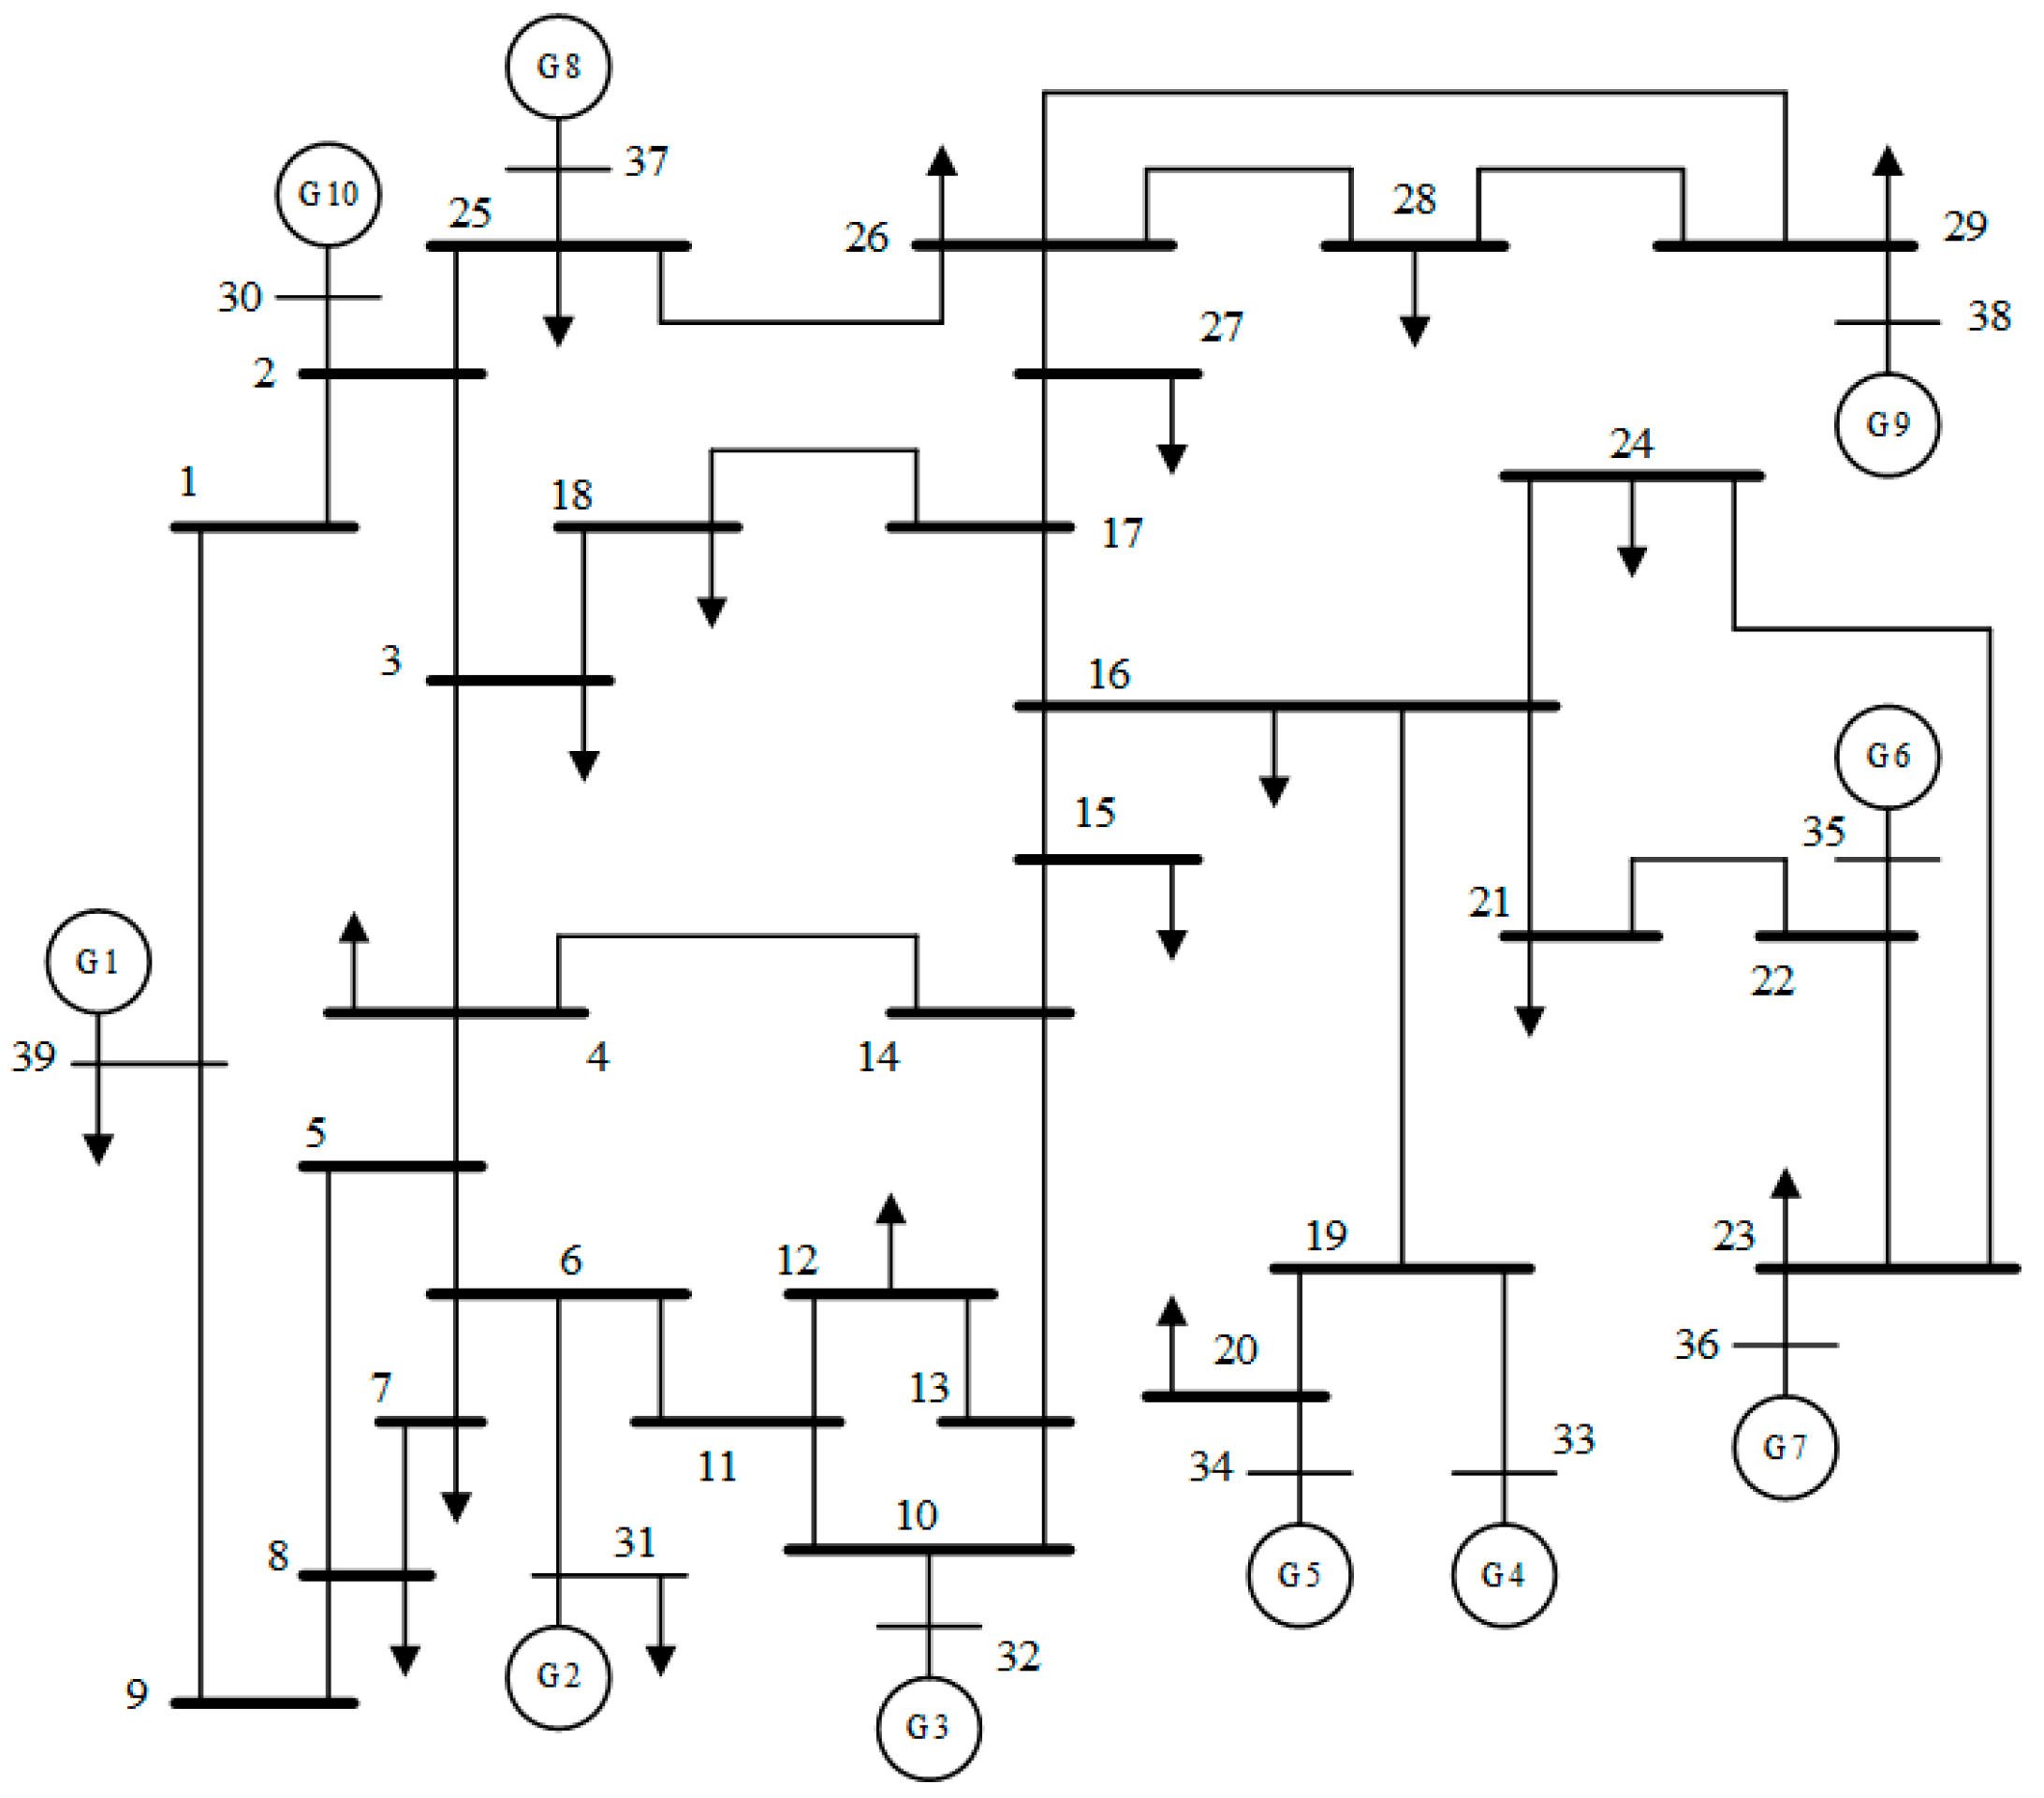
Disclaimer/Publisher’s Note: The statements, opinions and data contained in all publications are solely those of the individual author(s) and contributor(s) and not of MDPI and/or the editor(s). MDPI and/or the editor(s) disclaim responsibility for any injury to people or property resulting from any ideas, methods, instructions or products referred to in the content. |
© 2024 by the authors. Licensee MDPI, Basel, Switzerland. This article is an open access article distributed under the terms and conditions of the Creative Commons Attribution (CC BY) license (https://creativecommons.org/licenses/by/4.0/).