Article

Toward Energy Efficient Battery State of Charge Estimation on Embedded Platforms

by
Haris Turkmanović
*,
Ivan Popović
and
Vladimir Rajović
Department of Electronics and Digital Systems, School of Electrical Engineering, University of Belgrade, Bulevar kralja Aleksandra 73, 11120 Belgrade, Serbia
*
Author to whom correspondence should be addressed.
Electronics 2024, 13(21), 4256; https://doi.org/10.3390/electronics13214256
Submission received: 11 September 2024 / Revised: 14 October 2024 / Accepted: 28 October 2024 / Published: 30 October 2024
(This article belongs to the Special Issue Energy Storage, Analysis and Battery Usage)

Abstract

:
Recent studies have focused on accuracy as the key state of charge (SoC) estimation algorithms’ performance metrics, whereas just a few of them compare algorithms in terms of energy efficiency. Such a comparison is important when selecting an algorithm that should be implemented on a resource-constrained, low-power embedded system. In this paper, recursive model-based SoC estimation algorithms, such as the extended Kalman filter, have been identified as well-suited solutions for implementation on an embedded platform, providing a good compromise between estimation accuracy and computational complexity that is correlated to energy consumption. Assuming that a decrease in the estimation rate will result in a decrease in both accuracy and energy consumption of the estimator, a theoretical analysis has been conducted to establish how these two metrics depend on the estimation rate. To verify results obtained in theory, two extended Kalman filter-based SoC estimation algorithms of different complexities have been implemented and compared in terms of accuracy, quantified by root mean square error (RMSE), and energy consumption. The obtained results confirm that for a selected type of recursive model-based SoC estimation algorithm, it is possible to achieve an optimal algorithm estimation rate in the sense of satisfactory accuracy and acceptable energy consumption. The analysis and results presented in this paper establish a foundation for a future development of energy-efficient algorithms for SoC estimation in applications where the energy consumption of the estimation process is comparable to the energy consumption of the complete system.

1. Introduction

Estimating battery state parameters within battery-powered embedded systems is an indispensable task for proper system operation. One of the battery’s most important state parameters is the state of charge (SoC). It represents the ratio of the current remaining capacity to the maximum battery capacity [1,2]. Within a battery-powered system, the SoC value is used not only to provide real-time information about the remaining battery lifetime but also to prevent accelerated battery degradation due to overcharge and over-discharge.
Accurately estimating the SoC value is challenging due to the varying technical and environmental behavior of the battery, including the effects of aging, temperature fluctuations, and charge–discharge cycles [3,4,5]. The list of challenges is even longer when the SoC estimation needs to be implemented on energy and computationally constrained platforms such as battery-powered embedded systems.
Countless SoC estimation methods have been developed to enhance estimation accuracy [6,7,8,9,10,11,12,13,14,15,16,17,18]. Most research introducing novel SoC estimation methods primarily focuses on quantifying accuracy separately or together with computational time achieved on general-purpose machines. A few papers that discuss implementations on actual embedded platforms provide computational complexity analysis along with accuracy analysis [19,20,21,22] but without analysis of the SoC algorithm’s impact on total system energy consumption.
Enhancing the energy efficiency of battery-powered devices is a crucial issue [23], especially for battery-powered embedded systems with low operating currents and battery capacities, such as IoT sensor nodes [24], wireless sensor networks [25], battery-powered medical devices, and others. To increase energy efficiency, these systems typically operate in two modes: active mode, when data are being processed, and low power mode, when the system is inactive. Implementation of an SoC estimation algorithm, to be executed while the system is in active mode, requires the selection of an algorithm with low computational cost. Effective usage and implementation of such algorithms can reduce the duration of the active mode and extend the remaining useful lifetime of the battery. In the context of energy-constrained battery-powered embedded systems, selecting an SoC estimation algorithm may be easier if a comprehensive evaluation, considering both accuracy and energy consumption, is available. Therefore, an analysis that correlates these two important metrics for SoC estimation algorithms should enable easier selection of SoC estimation algorithms that have the potential to be implemented on battery-powered embedded systems.
In this paper, various SoC estimation methods have been reviewed to identify SoC estimation algorithms that may provide a good trade-off between computational cost and accuracy and which have the potential to be implemented as a pure software solution on an embedded platform. The extended Kalman filter (EKF) [5] has been identified as a well-suited choice. The recursive algorithms execute periodically with an estimation rate, acquiring voltage and current samples during each run cycle and processing these samples based on the estimator’s state history. Therefore, there is flexibility in selecting the estimation rate, as reducing the estimation rate may decrease the estimator’s accuracy, but if this decrease is acceptable, it leads to energy savings.
This study aims to quantify the portion of total system energy consumption consumed by an SoC estimation algorithm in the case of low-power embedded systems. It also investigates how variations in the estimation rate impact both the accuracy of SoC estimation and the overall system energy consumption, with the goal of identifying the optimal estimation rate for a recursive SoC estimation algorithm. Finally, it evaluates the trade-offs between selecting a more complex, energy-demanding, high-accuracy algorithm and a simpler, low-energy, lower-accuracy alternative.
This research first conducts a theoretical analysis, deriving dependencies of the SoC estimation error and energy consumption on the algorithm’s estimation rate for a case of an ideal recursive estimator. The estimation error has been quantified by root mean square error (RMSE), whereas we introduced relative algorithm consumption (RAC) to quantify energy consumption. The derived dependencies then serve as the primary research criteria during further analysis. Additionally, an optimization cost function is introduced to enable the numerical determination of the optimal sampling period in scenarios where the configuration of the battery-powered system (including consumption, algorithm duration, CPU clock speed, etc.) and discharge profiles are well known.
To demonstrate the application of the theoretical analysis in a real-world scenario, two EKF algorithms of varying complexities were implemented and evaluated based on their estimation accuracy and the duration of a single run cycle. One of the algorithms is from the category of the computationally simpler algorithms and employs a simple Rint battery model. The algorithm is less precise and has a relatively low energy consumption due to lower computational complexity. The second analyzed algorithm is the EKF, which employs a 2nd-order RC battery model and belongs to the category of complex computational algorithms. It exhibits a high estimation precision and a relatively high energy consumption due to higher computational complexity. The algorithms have been implemented on a PC to verify the functionality and accuracy of the algorithms. To obtain the duration of algorithms single run cycles, both algorithms have been implemented on a microcontroller-based embedded platform.
The paper contributes to the evaluation of algorithms for SoC estimation and the trade-off between invested energy and accuracy. The contributions could be summarized in the following way:
  • After a comprehensive review of the literature, the research gap in the area of energy consumption analysis of SoC estimation algorithms has been identified.
  • The impact of the estimation rate of recursive SoC estimation algorithms on total energy consumption and estimation accuracy of a battery-powered embedded system has been theoretically quantified.
  • Two extended Kalman filters of different complexities have been implemented on an embedded platform and compared in terms of algorithm accuracy and computational complexity.
  • The foundation for a future development of energy-efficient SoC estimation for battery powered embedded systems has been laid.
The rest of the paper is organized as follows: In Section 2, the SoC estimation algorithms are reviewed in terms of energy consumption. Theoretical considerations as well as the discussion on the fundamental concepts important for the trade-off between accuracy and energy consumption analysis are given in Section 3. Section 4 describes the experimental setup and the experimental procedures. The extracted values of the estimation model parameters are presented in Section 5. The results obtained are presented in Section 6. Concluding remarks and directions for future work are presented in Section 7.

2. Related Works

Numerous methods for estimating a battery SoC have been developed. Understanding their overall performance, especially in terms of accuracy and computational complexity, is crucial for selecting the one that best meets specific system and battery requirements. The proper way to begin the selection process is to review the existing methods and classify them based on their common characteristics, application fields, advantages, disadvantages, and computational complexity [5].
Several research papers deal with the classification of SoC estimation algorithms based on different selection criteria. Compared to the other research papers that perform classification of SoC estimation algorithms [2,4], the paper [5] provides the most detailed classification of the existing SoC estimation methods, classifying them into six different categories: conventional methods, filter-based methods, observer-based methods, data-driven methods, hybrid methods, and other estimation methods.
Conventional methods are easy to implement and have an acceptable SoC estimation accuracy under certain conditions, therefore qualifying as a possible solution for implementation on embedded platforms [12,13,14]. However, most of these methods are not used for online battery SoC estimation because they require knowledge of the initial SoC values, involve significant experimental investments, and have low resilience to measurement noise [1]. Data-driven methods are too complex in terms of computational complexity, and that disqualifies them from being implemented on modest computational platforms such as embedded systems [15,16,17]. Hybrid methods are primarily developed to increase SoC estimation accuracy for specific applications, without analyzing their execution performances. Model-based methods seem the best solution, with a potential to provide the best trade-off between SoC estimation accuracy and algorithm complexity [6,7,8,9,10,11,18,26,27,28,29] and are the most suitable choice for online SoC estimation with respect to the high estimation accuracy and reasonable computing effort [30]. Consequently, the model-based methods appear to be a good choice for implementation on resource-constrained embedded platforms.
The implementation process of model-based SoC estimation methods includes two main steps: (1) battery modeling and extraction of parameters; (2) selection and implementation of an observer estimation algorithm [31,32]. Selection of a battery model is the first and crucial step, as the computational performance and accuracy of SoC estimation heavily depend on the model selected [33]. The battery model refers to physical aspects of a battery, such as electrical, thermal, aging, and a combination of these [34]. Based on [4,35], battery models can be classified into three types, two of which are extensively used within estimation algorithms: physics-based electrochemical models [36,37,38], and electrical equivalent circuit models [39,40]. Electrochemical models have high accuracy because they describe reactions inside batteries based on chemical/electrochemical kinetics and transport equations [30]. Thus, they are built upon partial differential equations that are difficult to solve with online estimation methods [35,41]. Some of the most used physics-based electrochemical models are the pseudo-two-dimensional model [41] and single particle model [42]. Electrical equivalent circuit models depict the dynamic characteristics of batteries by utilizing a combination of electrical elements, such as voltage sources, resistors, and capacitors, to describe a battery’s behavior. The parameters used within this model depend on a battery’s aging status and its operating conditions, thus resulting in a gradual degradation of SoC estimation accuracy over time [30]. However, compared to the other models, the electrical equivalent circuit models have the potential to provide the best trade-off between model complexity and accuracy and have been widely used within different estimation algorithms [31,43]. Some of the electrical equivalent circuit models are the internal resistance model [44], the nth-order RC model [45], and the partnership for a new generation of vehicles (PNGV) model [46]. Compared to the other models of this type, the 2nd- and 1st-order RC models are extensively employed because they offer the most balanced compromise between complexity and precision for different discharge profiles.
After selecting a battery model, it is required to perform model parameter identification by either online or offline identification methods [47,48]. The online parameter identification methods [49,50] include determination of parameter values during SoC algorithm execution, whereas the offline parameter identification methods use experimental data to determine values of model parameters before the model is deployed within an observer estimation algorithm. Because the battery’s technical characteristics and environmental factors change during operation, online methods for identification of parameters provide better corrections of SoC estimation during operation but lead to a complex implementation and a higher SoC computational time. On the other hand, under certain conditions, offline estimation methods provide reasonable accuracy and at the same time reduce the SoC estimation complexity.
Numerous model-based algorithms can be used to estimate the SoC value. Among them, the algorithms from the Kalman filter family are widely used, because of their simplicity, in combination with various electrical models [51]. Because a battery is modeled as a nonlinear system, a non-linear Kalman filter must be used to estimate the SoC value [31]. Extended Kalman filter (EKF) requires less computing power compared to the other non-linear Kalman filters or filter-based estimation techniques in general [52,53,54]. However, in most practical implementations, the adaptive extended Kalman filter (AEKF) is utilized instead of the EKF. The AEKF operates similarly to the EKF, but it adjusts the measurement and noise matrices during estimation to enhance robustness to noise, which is very important in real applications.
Many research papers present EKF and AEKF implementations that utilize electrical battery models. The paper [55] proposes an online model-based SoC estimation method that utilizes an AEKF. The 1st-order RC network is used as the equivalent circuit, and model parameters are estimated online using the recursive least square (RLS) method with multiple forgetting factors. The accuracy of the proposed method was tested within a simulation environment, indicating a maximum absolute error less than 0.015%. The EKF presented in the paper [56] provides strong robustness to the uncertainty of the model and the initial value of the noise covariance matrix. The battery model used is the 2nd-order RC model, and the parameters are extracted offline. Battery current and voltage are measured by a custom measurement system based on an STM32 microcontroller. The algorithm presented in [57] can estimate SoC and state of health (SoH) simultaneously. An AEKF uses the 1st-order RC battery electrical model, with online parameter identification based on the RLS method. The reported estimation accuracy is about 2%.
The paper [58] proposes a hybrid approach to achieve a better trade-off between accuracy and computational complexity. The proposed approach combines a low computational cost ampere-hour integral SoC estimation method and an AEKF of high accuracy. It is demonstrated that accuracy is almost the same compared to the case when only an AEKF is utilized while computational cost is reduced by almost 25%. The paper [21] compares two model-based algorithms for SoC estimation, unscented Kalman filter (UKF) and EKF, in the sense of computational time and accuracy, in the case of signals with different noise levels. Both algorithms utilize the 1st-order RC network and are implemented on the Linux-based embedded platform, Raspberry Pi. It is demonstrated that the UKF requires more computational time in comparison to the EKF, at the same time providing high accuracy and robustness to noise. The work in [22] utilizes the 1st-order RC model and implements EKF on an FPGA platform to achieve a real-time SoC computation. It introduces computational techniques, so matrix multiplication time is up to 4 times reduced compared to the conventional matrix multiplications. This is a rare case where results of computational time on a real platform are provided. The paper [59] presents an EKF based on the 1st-order RC electrical model. The battery model parameters are extracted offline, using the RLS method. The EKF is first analyzed in MATLAB/Simulink (https://www.mathworks.com/) and then implemented on a PIC18F4550 microcontroller. A similar implementation on the Arduino embedded platform is performed within research in [19]. Paper [20] introduces dual EKF, which enables a high robustness to the noise of the current sensor and incorrect filter initialization. The algorithm simultaneously estimates battery state and the 2nd-order RC model parameters. This filter is implemented on the Linux-based embedded platform NXP KL25Z128. Besides the SoC and model parameter estimation, the algorithm estimates the SoH and system state of power. It is demonstrated that the achieved estimation error does not exceed 5%.
Table 1 provides a summary of the mentioned research papers, employing SoC estimation algorithms based on EKF or AEKF algorithms coupled with battery electrical models. For each entry in Table 1, the battery model used, the parameter identification method, and the type of estimation algorithm. Additionally, each paper is categorized based on the type of analysis conducted: (A) for accuracy analysis, (C) for computational complexity analysis, and (E) for algorithm energy consumption analysis.
Reviewing the papers that utilize battery state of charge (SoC) estimation methods based on recursive model-based algorithms reveals that all of them conduct accuracy analysis. However, only a few of them evaluate computational complexity, even those implementing algorithms on embedded platforms. None of the analyzed papers includes an analysis of the algorithms’ energy consumption. In our paper, we conduct a detailed theoretical analysis of recursive model-based SoC estimation algorithms to establish a systematic approach for evaluating their energy consumption. We apply this analysis to two actual implementations based on the EKF to validate the theoretical results. The theoretical analysis and results that demonstrate the potential of such an analysis in real battery-powered applications are presented in the further text.

3. Theoretical Considerations and Metrics

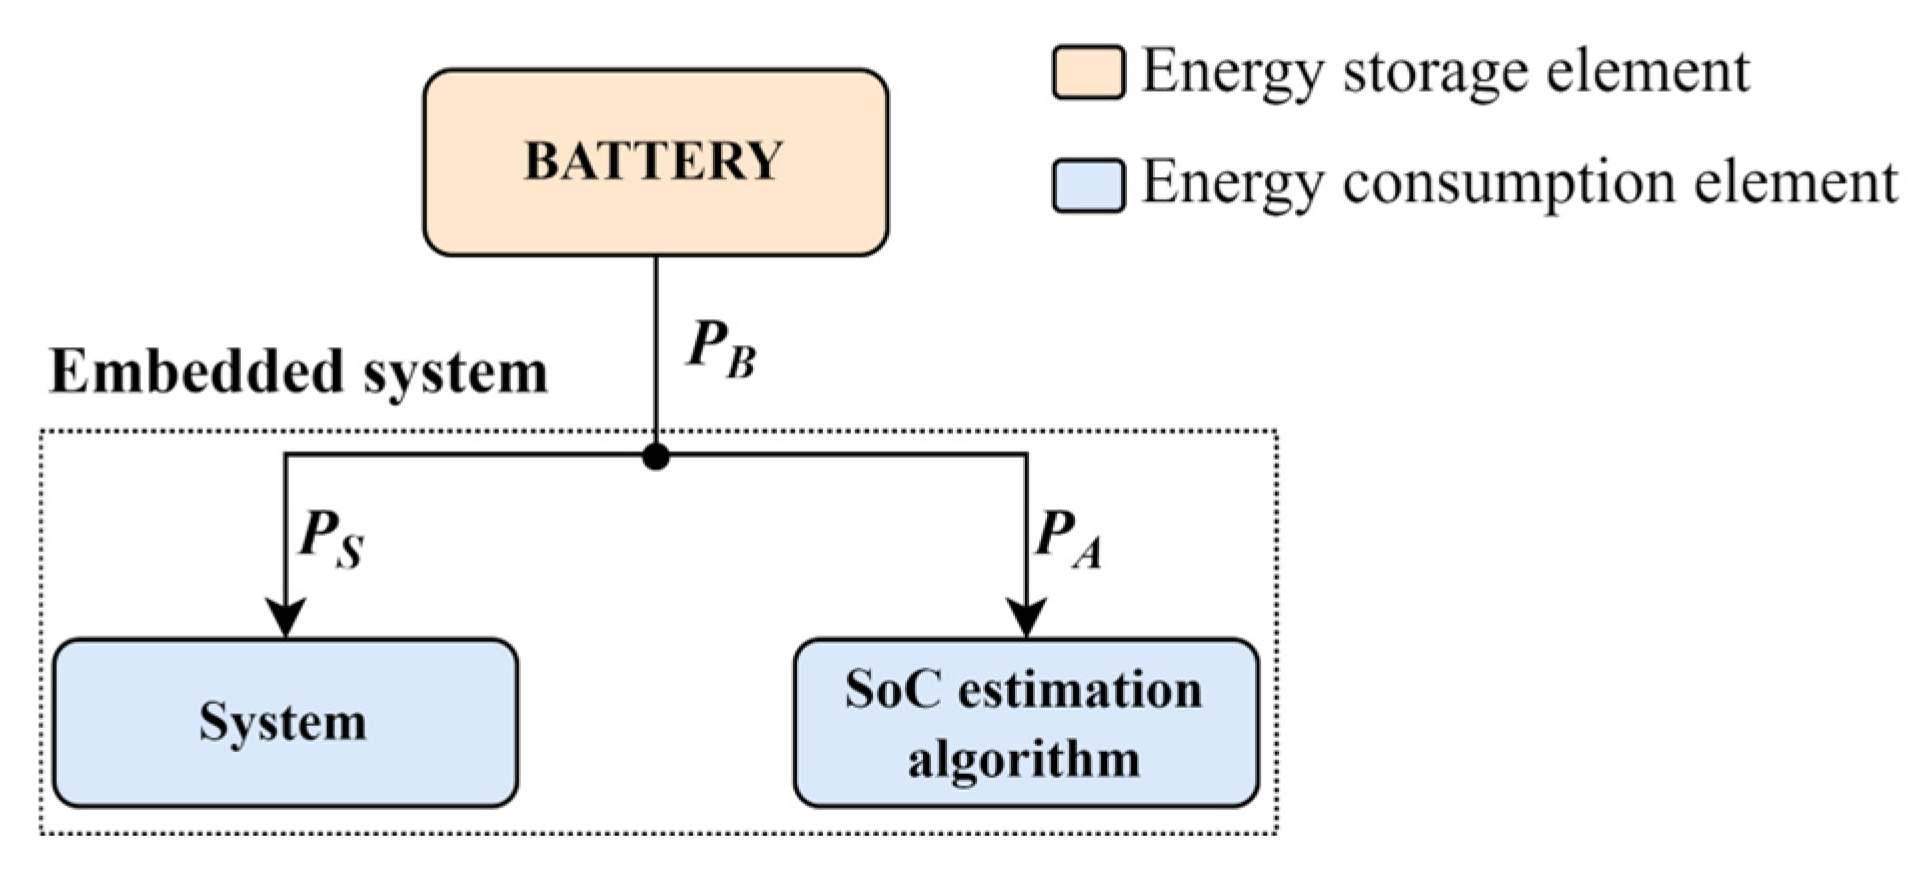
In the case of a battery-powered embedded system with integrated battery SoC estimation, it is possible to separate the instantaneous power of the SoC estimation algorithm P A ( t )   deom the instantaneous power of the rest of the system P S ( t ) . The total instantaneous battery output power P B ( t ) is then the sum of the two powers, as presented in Figure 1.
PB(t) = PS(t) + PA(t)
The value of instantaneous power without the SoC estimation, P A ( t ) , depends on the consumption of various hardware and software components that are part of the system and not directly involved in the SoC estimation. These components may be various hardware elements, such as sensors and actuators, and the software that implements the complete system logic (without the SoC estimation) on a CPU based embedded platform. The instantaneous power of an SoC estimation algorithm, P A ( t ) , is determined by the power consumption of hardware and software components that are part of the SoC estimation algorithm. The hardware components may be shunt resistors for current sensing, operational or instrumentational amplifiers, AD converters, etc. In a general case, the SoC estimation algorithm logic may be implemented in the form of a separate integrated circuit, a dedicated hardware block within a programmable logic device, or as a software only solution implemented on a CPU.
The accuracy and energy consumption of a recursive model-based SoC estimation algorithm are heavily impacted by the estimation period. This section presents a theoretical analysis aimed at numerically quantifying how the estimation rate affects both estimation accuracy and energy consumption. The goal is to derive a general optimization metric that can be used to fine-tune the estimation rate, balancing accuracy and energy efficiency. The first subsection establishes a set of equations that will serve as key metrics for the analysis, while the second introduces the extended Kalman filter, used to validate the theoretical findings.

3.1. Analysis of Estimation Period Influence on an SoC Algorithm Estimation Accuracy and Energy Consumption

In this subsection, a relation that quantifies the impact of different estimation periods on the estimation accuracy and energy consumption of an SoC algorithm is derived. The analysis is divided into three parts. The first part examines how the estimation period affects the accuracy of SoC estimation, whereas the second part analyzes the energy consumption of the algorithm. The third part introduces the optimization criteria that can be used to determine the optimal estimation period.

3.1.1. Estimation Algorithm Accuracy as a Function of Estimation Period

Different metrics are used for assessing the accuracy of state of charge (SoC) estimation algorithms. Common metrics include, among others, absolute maximum error (AME), mean absolute error (MAE), standard deviation (SD), and root mean square error (RMSE) [26]. For now, there is no consensus in the literature which of the metrics is the most appropriate. In this paper, the RMSE is used due to the possibility to make an elegant theoretical analysis and its moderate stringency. Some other metrics might be more useful for a specific application, but the focus of this paper is to show that it is possible to achieve a trade-off between accuracy and energy consumption, and RMSE is used as an exemplary metric. The methodology presented may be used for arbitrary metrics.
If the difference between the estimated and true SoC values at the ith estimation instant is represented as e[i], and there is a total of N estimation instants during a full battery discharge, then the RMSE is expressed by the following equation:
R M S E = i = 1 N e [ i ] 2 N
To express RMSE as a function of the estimation period T , it is essential to first establish ground truth or reference SoC values that will be used as nominally accurate values for calculations of RMSE for various estimation periods. For this purpose, the SoC values obtained with the Coulomb counter algorithm ( S o C C C ) running at the minimum (base) estimation period T B available on the system are used. When S o C T represents the SoC values obtained with a recursive model-based SoC estimation algorithm at a selected estimation period T ( T B ), then the corresponding RMSE is defined by the following equation:
R M S E ( T ) = i = 1 N ( S o C T i S o C C C i ) 2 N
In the general case, the RMSE (3) encapsulates two errors: the error due to the utilized model and the error occurring because of the increase in the estimation period. To separate these errors and provide for theoretical analysis of influence of the estimation period on estimation accuracy, the SoC values obtained with the recursive model-based estimation algorithm ( S o C B ) running at minimal estimation period T B are used. The three different used SoC values ( S o C C C , S o C T , and S o C B ), with corresponding differences e B = S o C B S O C C C , e T = S o C T S O C B , and e = S o C T S O C C C , are illustrated in Figure 2.
Based on Figure 2, it is possible to define two different RMSEs:
-
R M S E B , quantifying the quality of estimator when executing at a minimum sampling period; this error is due to the model used not being absolutely accurate. The error arises from the difference between S o C B and S o C C C , e B , and can be expressed by the relation
R M S E ( T ) = i = 1 N ( S o C T i S o C C C i ) 2 N
where
e B i = S o C B i S o C C C i
-
R M S E T , representing the error between the estimator running at a minimum estimation period T B and the estimator running at an arbitrary estimation period T > T B . The error arises from the difference between S o C T and S o C B , e T , and can be expressed by the relation
R M S E T = i = 1 N e T [ i ] 2 N
where
e T i = S o C T i S o C B i
From Figure 2, total instantaneous error of an estimator running at an arbitrary estimation period T > T B is e i = S o C T i S o C C C i = e T i + e B i . The total RMSE, as defined by (3), may be expressed as function of (4) and (6)
R M S E T = i = 1 N e B i 2 N + i = 1 N e T i 2 N + 2 i = 1 N e T i e B i N
Assuming that e T i and e B [ i ] are uncorrelated, the total RMSE can be expressed as a function of R M S E B and R M S E T , by the equation
R M S E T = R M S E B 2 + R M S E T 2
The Equation (9) combines two errors and enable analysis of influence of the estimation period on estimation accuracy separately from the analysis of the model-based accuracy.
While the value of R M S E B can be determined by measurement only, it is possible to analyse R M S E T theoretically. For the sake of the analysis, the assumption is that the values of S o C B are obtained with an ideal recursive model-based estimator whose R M S E B equals 0. If such an estimator executes with minimal estimation period T B on a battery powered embedded system whose battery capacity is C and whose average battery load current is I B , the number of estimators run cycles N B , during a full battery discharge interval T D is given by
N B = T D T B = C I B T B
and the sequence of the estimated SoC values S o C B [ i ] is
S o C B i = 1 I B T B C i 100 % ; i 0 , N B
If the estimator executes with estimation period T T B , there are N estimator run cycles during a full battery discharge interval
N = T D T = C I B T
and the corresponding estimated SoC values S o C T [ i ]   are
S o C T i = 1 I B T C i 100 % ; i 0 , N .
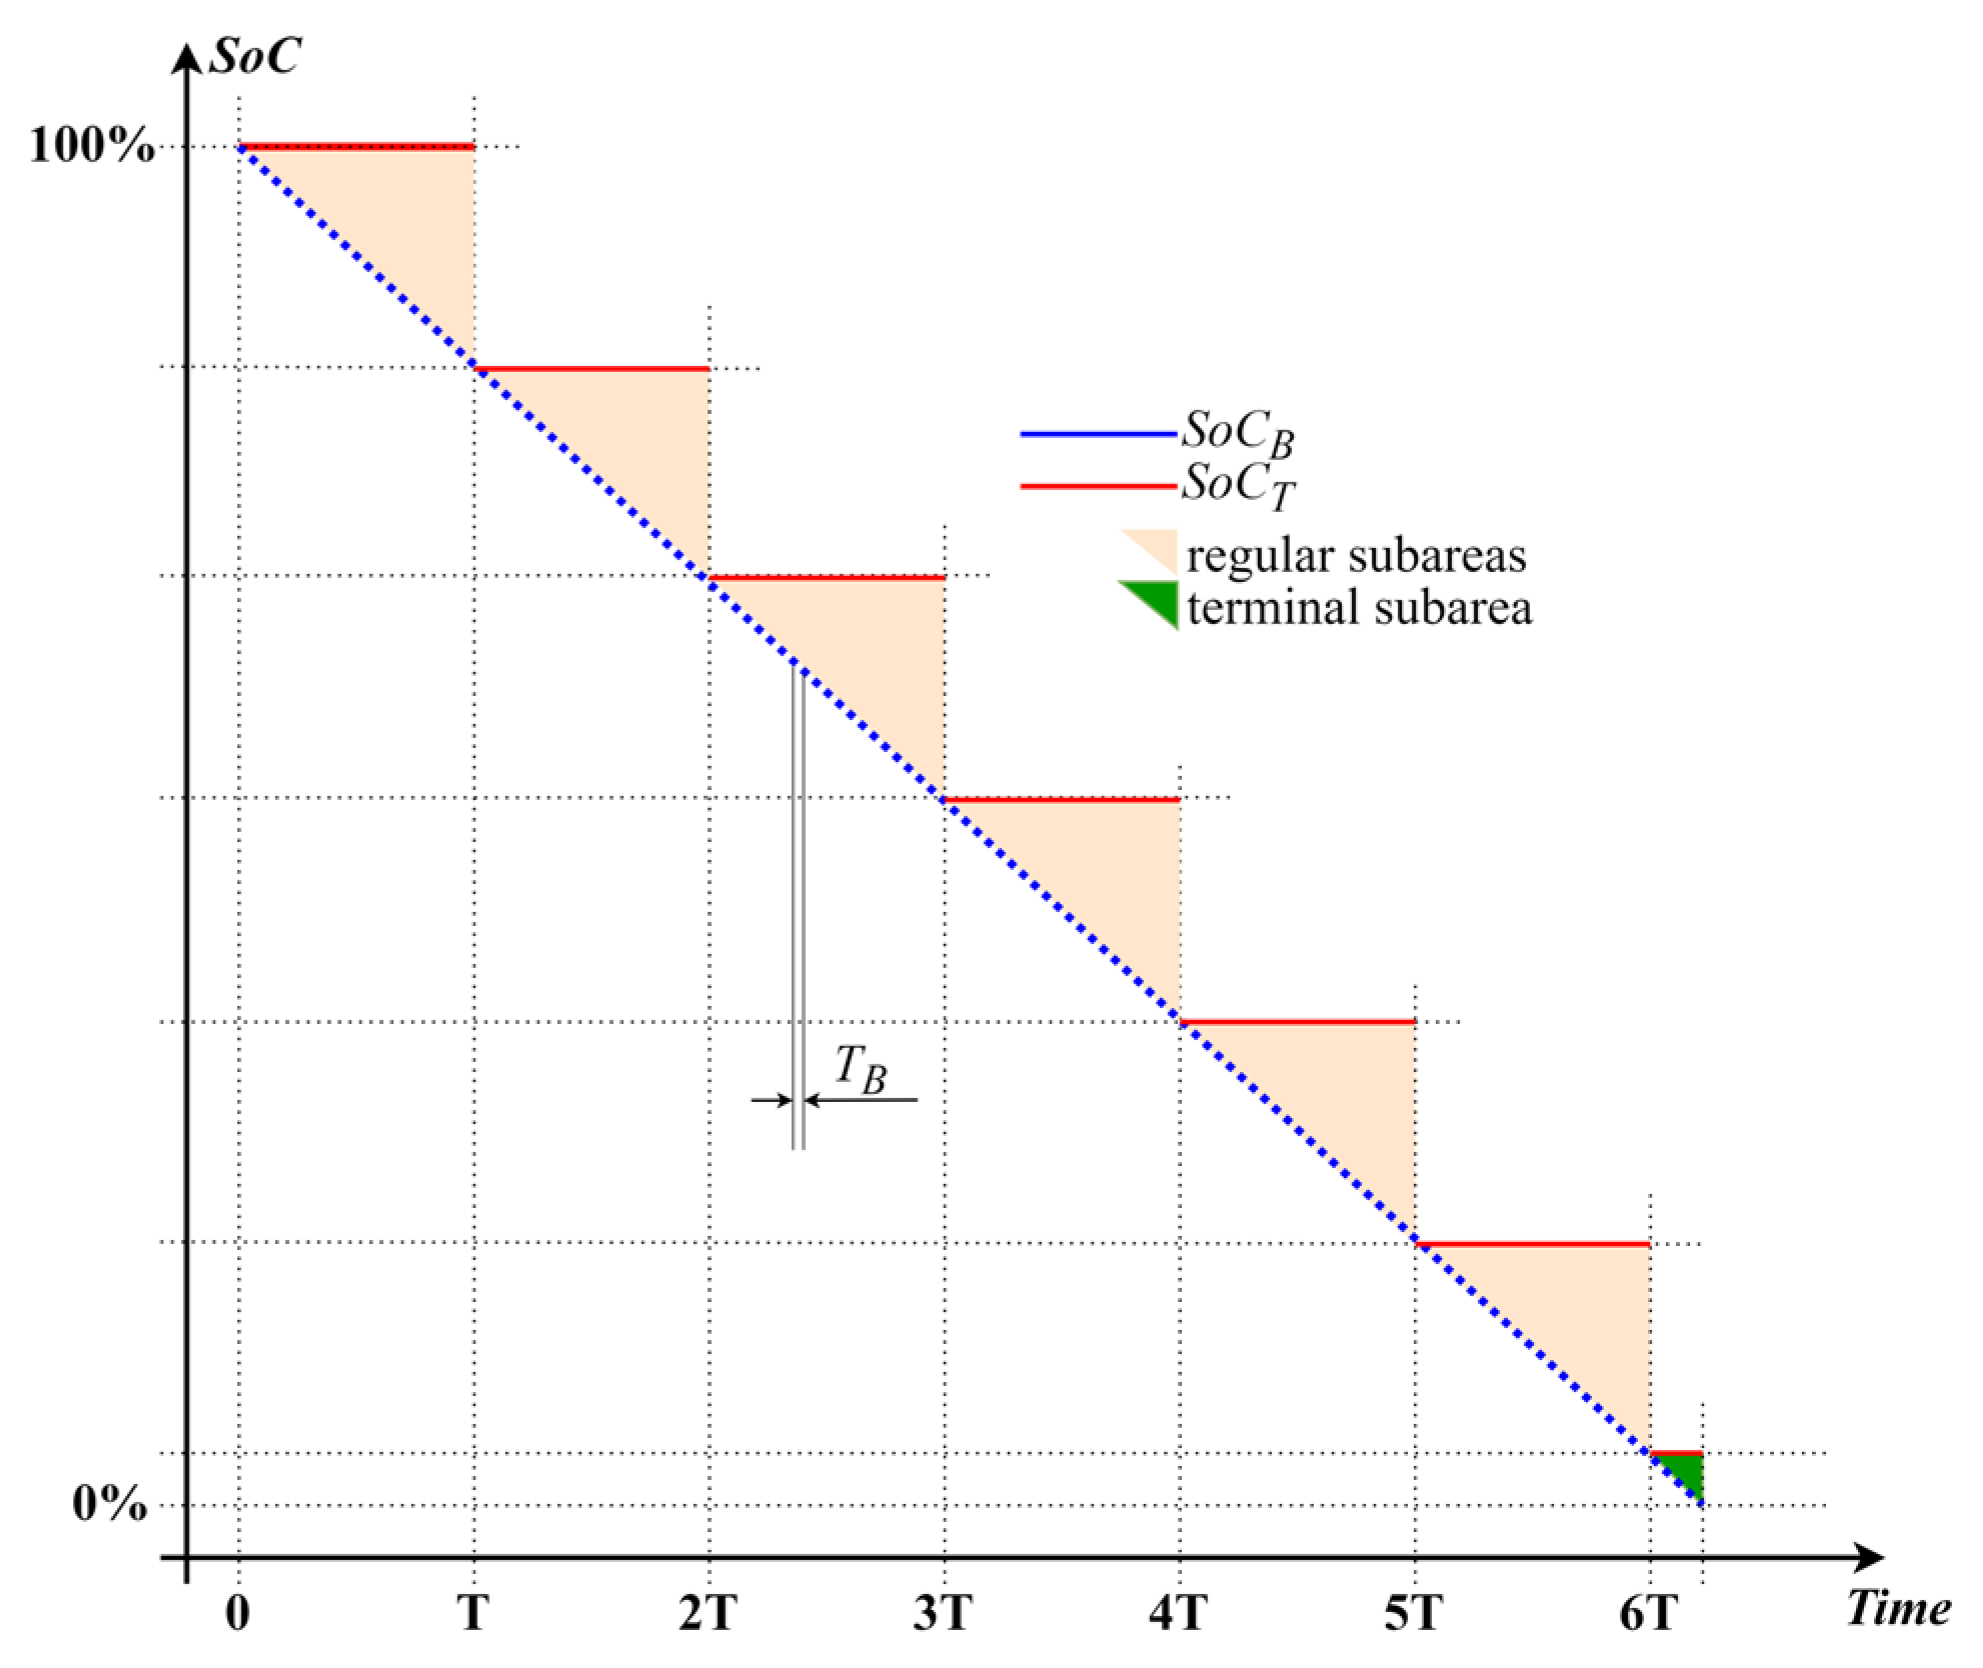
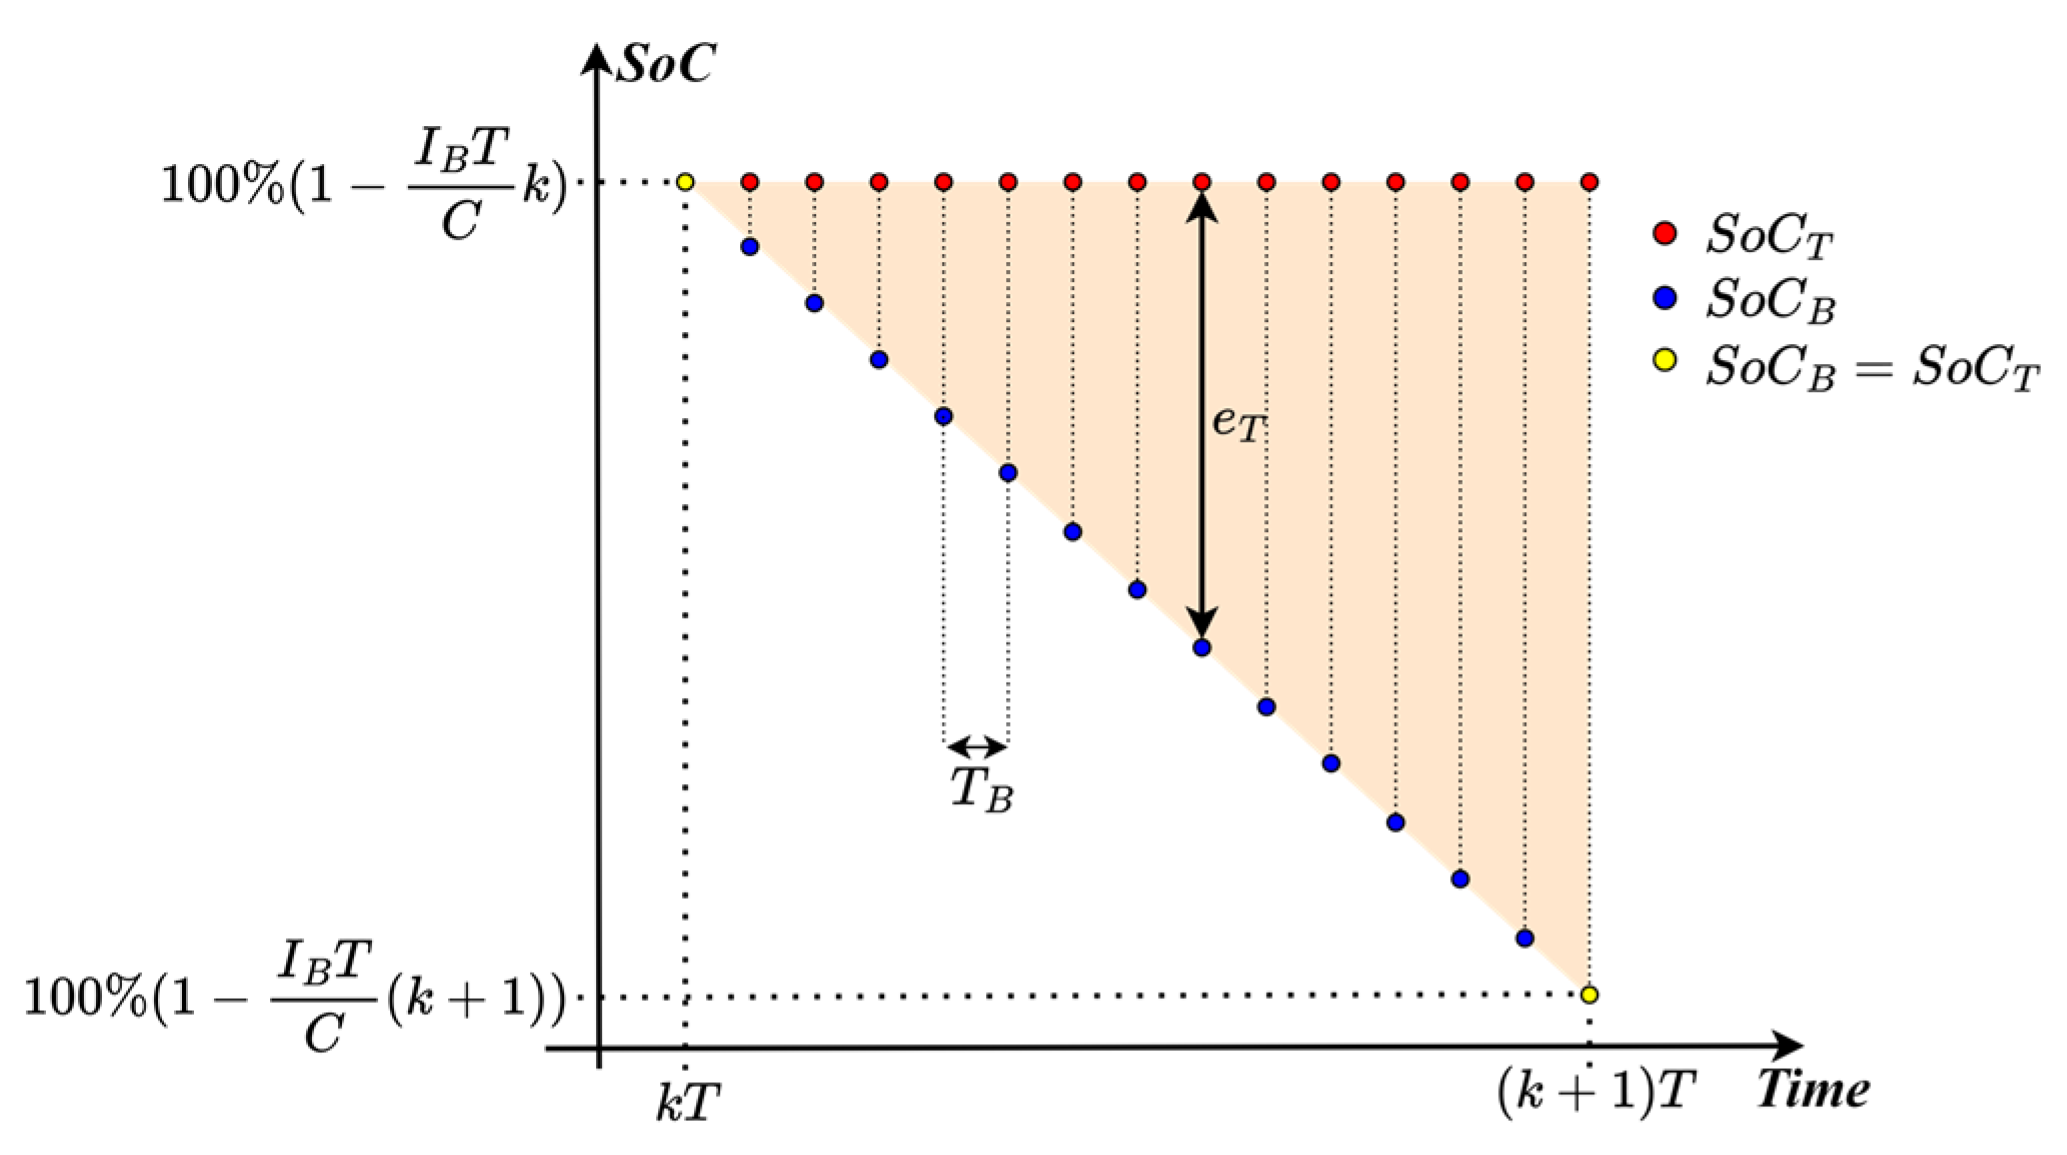
The two SoC sequences are illustrated in Figure 3, for one full battery discharge interval, and N = 6 . As mentioned above, the estimator is presumed to be ideal when executing at the minimum estimation period.
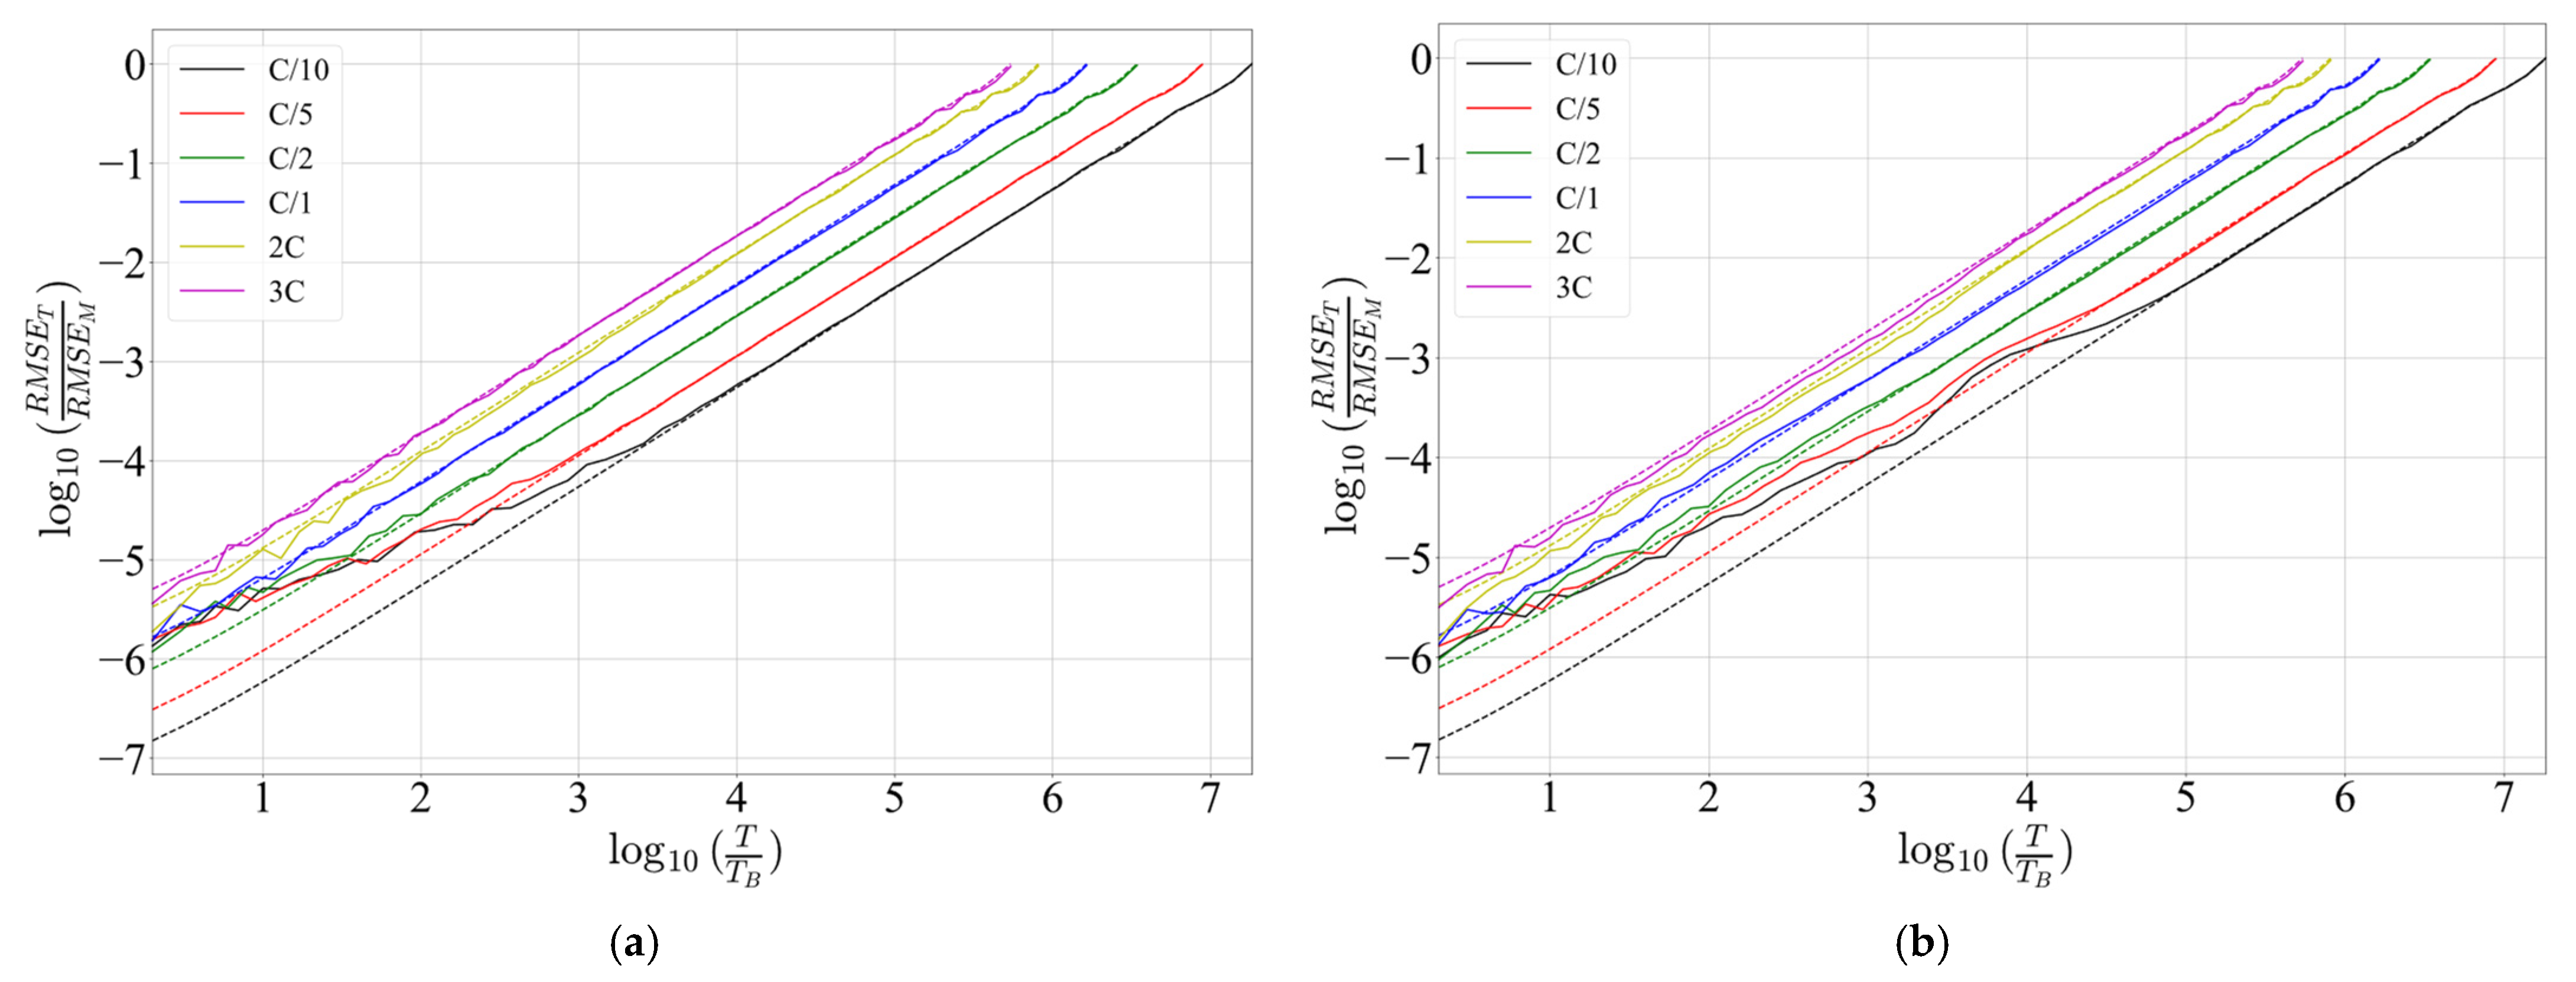
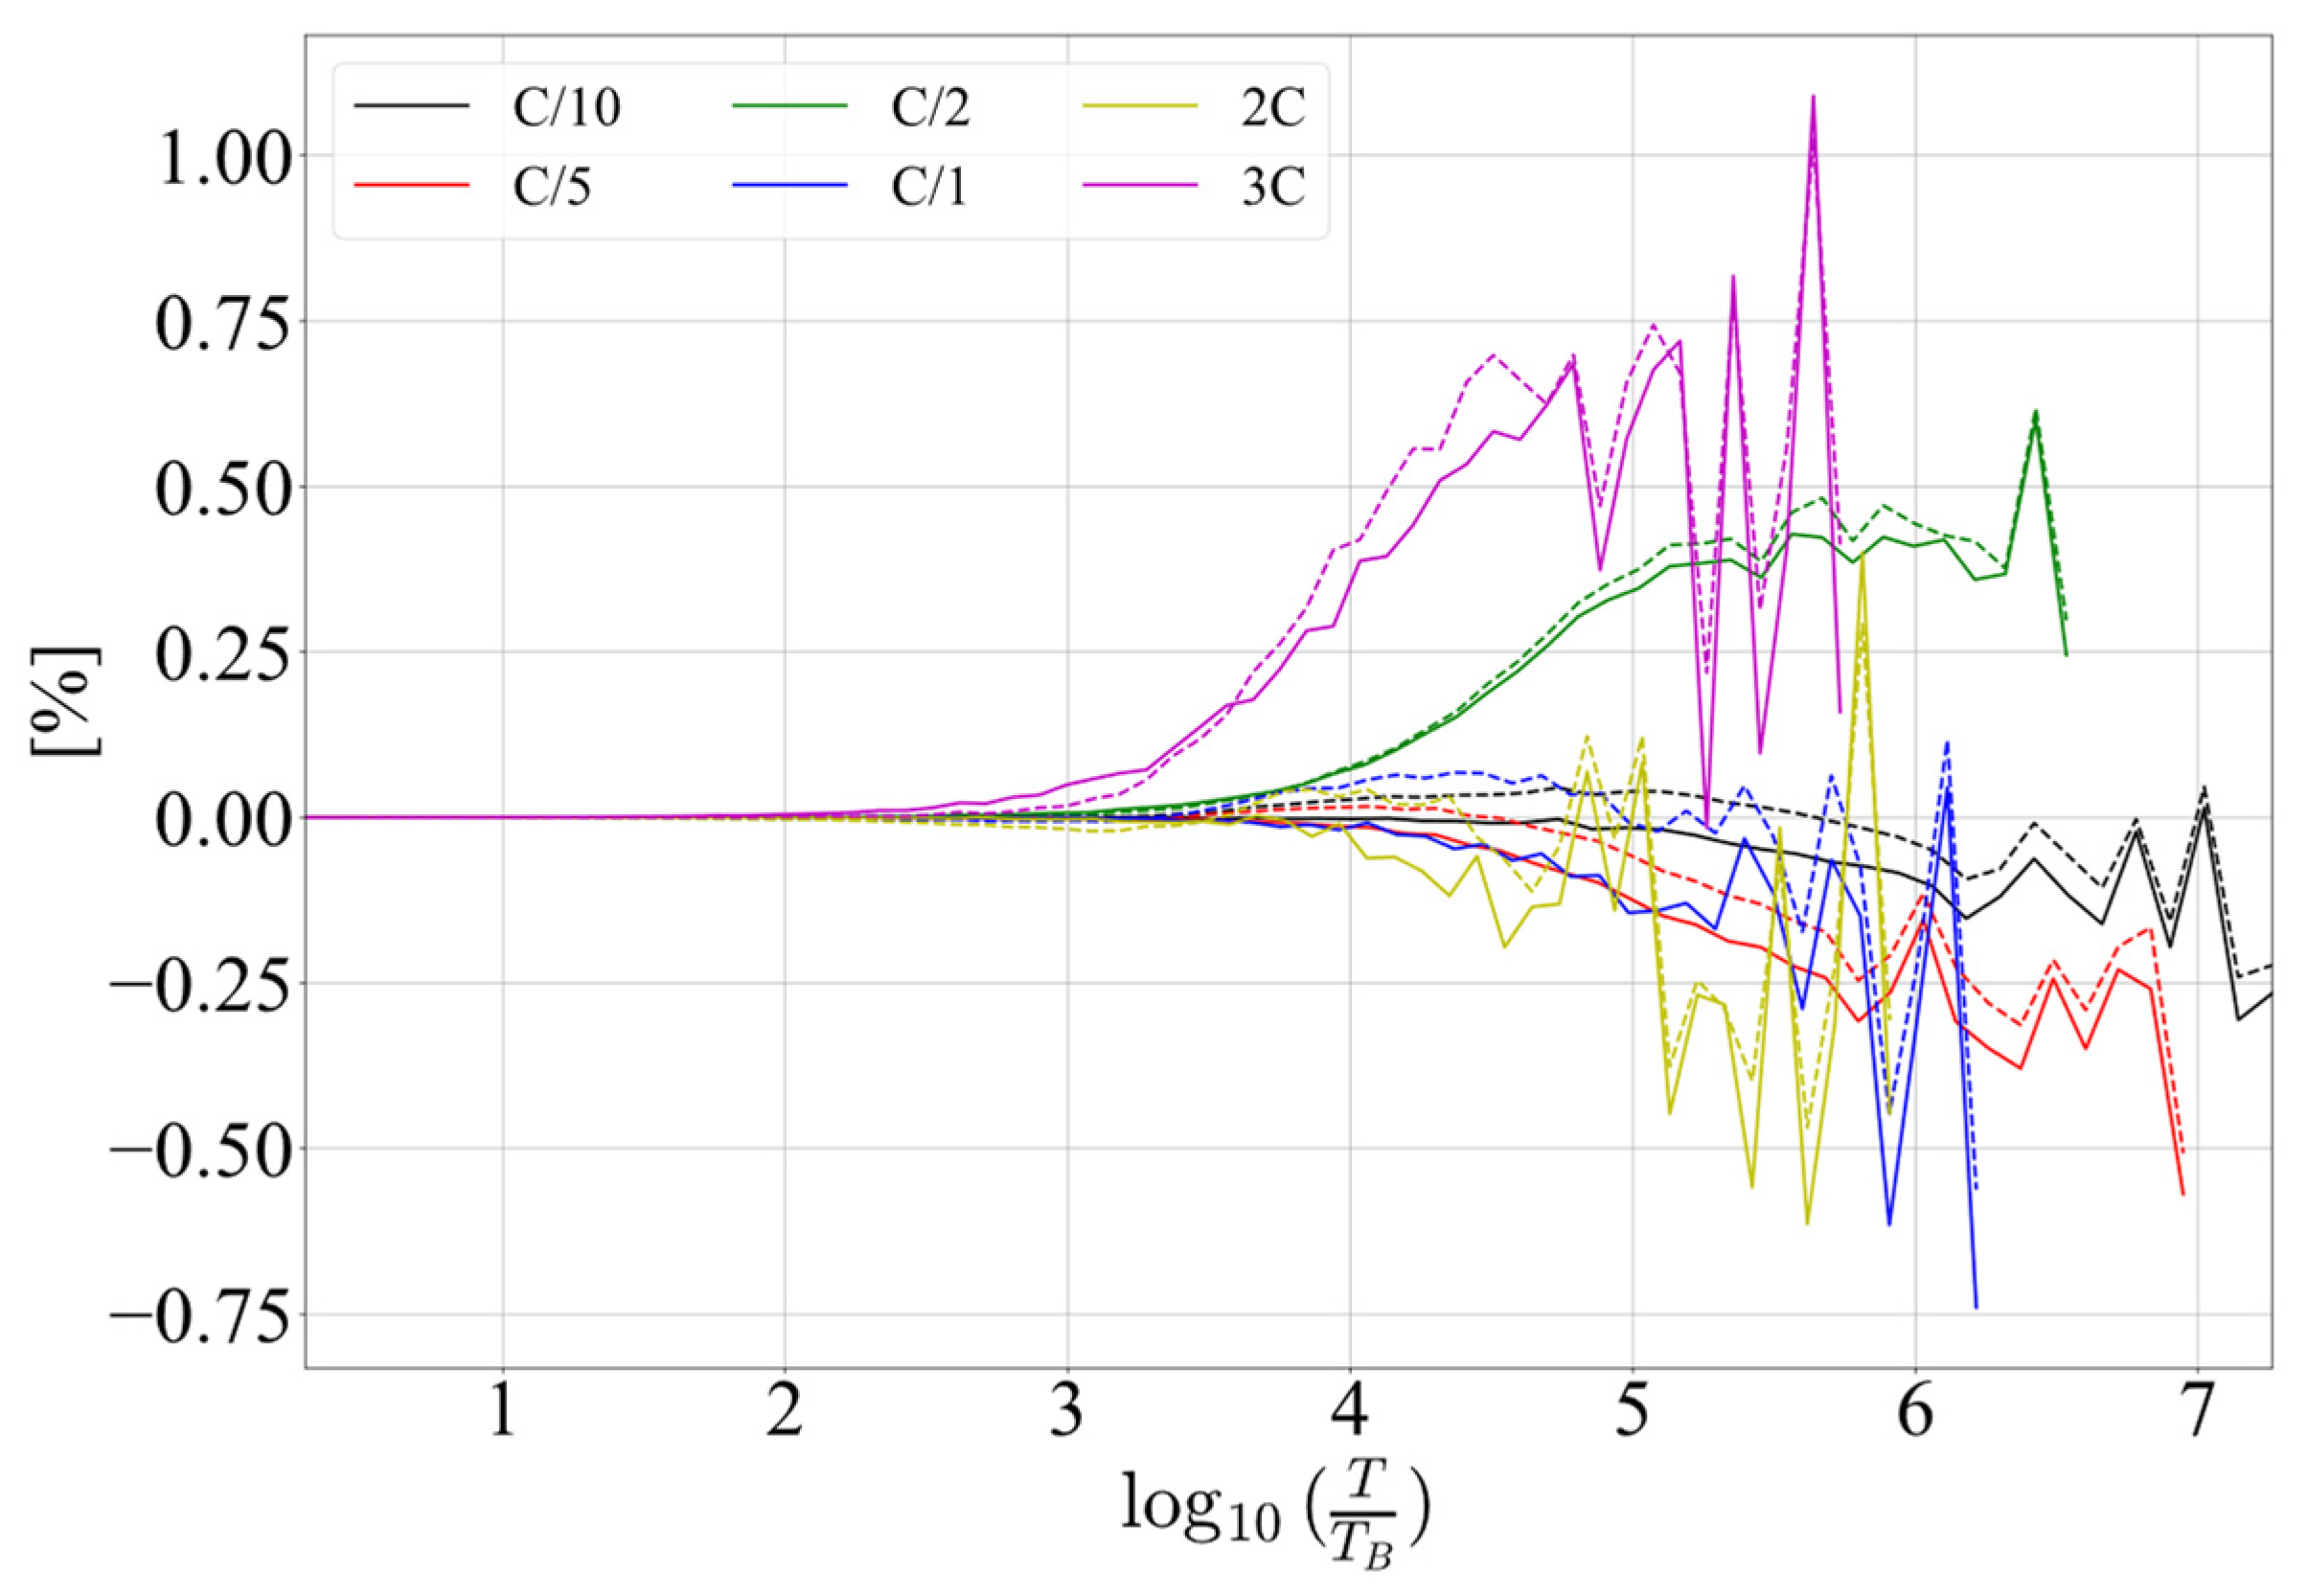
As seen in the figure and inferring from (11) and (13), S o C T i represents a decimated, by factor T / T B , version of S o C B i . The area between S o C B i and S o C T i corresponds to the deviation of the decimated estimator to the original and consists of N identical regular subareas (shown in ochre) and a truncated terminal subarea (shown in green).
A detailed view of a kth regular subarea is shown in Figure 4. The blue dots represent ideally estimated SoC values ( S o C B i ) whereas red dots represent decimated ideally estimated SoC values ( S o C T i ).
There is a total of M = T / T B samples (always an integer since T is a multiple of T B ) of S o C B [ i ] in the regular subinterval, and a total of M T = N B N M samples in the terminal subinterval. It is possible to derive an equation quantifying error of the decimated estimator compared to the ideal
e T i = I B T C M i = I B T B C i , i 0 ,   M 1
The squared error sum over a regular kth discharge subinterval S E S R , and the squared error sum over the truncated terminal subinterval S E S T can be expressed as
S E S R = i = 0 M 1 e T 2 i = I B T B C 2 i = 0 M 1 i 2 = I B T B C 2 ( M 1 ) M ( 2 M 1 ) 6 ,
S E S R = i = 0 M T 1 e T 2 i = I B T B C 2 i = 0 M T 1 i 2 = I B T B C 2 ( M T 1 ) M T ( 2 M T 1 ) 6
Now, R M S E T   (6) can be expressed as a function of M
R M S E T = N × S E S R + S E S T N B = I B T B C N ( M 1 ) M ( 2 M 1 ) + M T 1 M T 2 M T 1 6 N B
In the case when T D is a multiple of T (and consequently T B ), then M T = N B N M = T D T B T D T T T B = 0 , and Equation (17) simplifies to
R M S E T = I B T B C ( M 1 ) ( 2 M 1 ) 6
Equations (17) and (18) are suitable for a numerical analysis of influence of the estimation period T on RMSE (3). For such an analysis, it is useful to determine the range of values of the estimation period wherein the analysis makes sense. The estimation period cannot be smaller than the base estimation period T B . Regarding the maximum possible estimation period, it is determined from the duration of full battery discharge for a given battery load I B —when two executions of the estimation algorithm are performed over the entire period, at the beginning and at the end of the period. In that case N = 1 and the maximum estimation period T M is
T M = C I B
When estimating at the maximum estimation period, R M S E T (18) reaches its maximum value, obtained after substitution of (19) in (18) and application of the assumption C T B I B 1
R M S E T M   1 3 = 0.58
From now on, Equations (17) and (18) will be used as the SoC estimation accuracy metrics.

3.1.2. Estimation Algorithm Consumption as a Function of Estimation Period

A recursive SoC estimation algorithm periodically executes within the software of a microprocessor. If the estimation period is T , the duration of execution of a single run cycle of the algorithm lasts a portion of the period D   ( 0 < D T ) . During the execution, the current consumption of the algorithm may be represented by a current I A e x . The current originates from the microprocessor consumption due to the additional duration of its activity, as well as the consumption of peripheries used only for the estimation (AD converter(s) and accompanying circuitry). When the algorithm is not executing, its current consumption is zero. The above is illustrated in Figure 5.
The relative battery consumption ( R A C ) may be expressed as a portion of battery capacity consumed for its SoC estimation during a full discharge interval
R A C T = I A · T · N C
where I A is average current of the SoC estimation algorithm, T is the estimation period, and N is the number of the estimator run cycles during a full battery discharge interval (12).
For the algorithm current consumption as shown in Figure 5, the average algorithm consumption I A is
I A =   I A e x D T
Since the battery load current I B consists of current consumption of the SOC estimation algorithm I A and the current consumption of the rest of the system I S , the number of the algorithm run cycles during a full battery discharge interval N (12) may be written as
  N = C ( I A + I S ) T
After substitution of (22) and (23) in (21), and simplifying x x , there is
R A C T =   I A I A + I S =   I A e x I A e x + I S T D
It has been mentioned earlier that the minimum estimation period is determined by T B . The minimum estimation period cannot be lower than the algorithm run cycle duration D , but it could be further restricted by system characteristics, for example, the conversion time of the AD converter.
From (24) implies that, when the average current consumption of the rest of the system I S is negligible when compared to the algorithm execution consumption I A e x , R A C becomes close to R A C T M = 1.

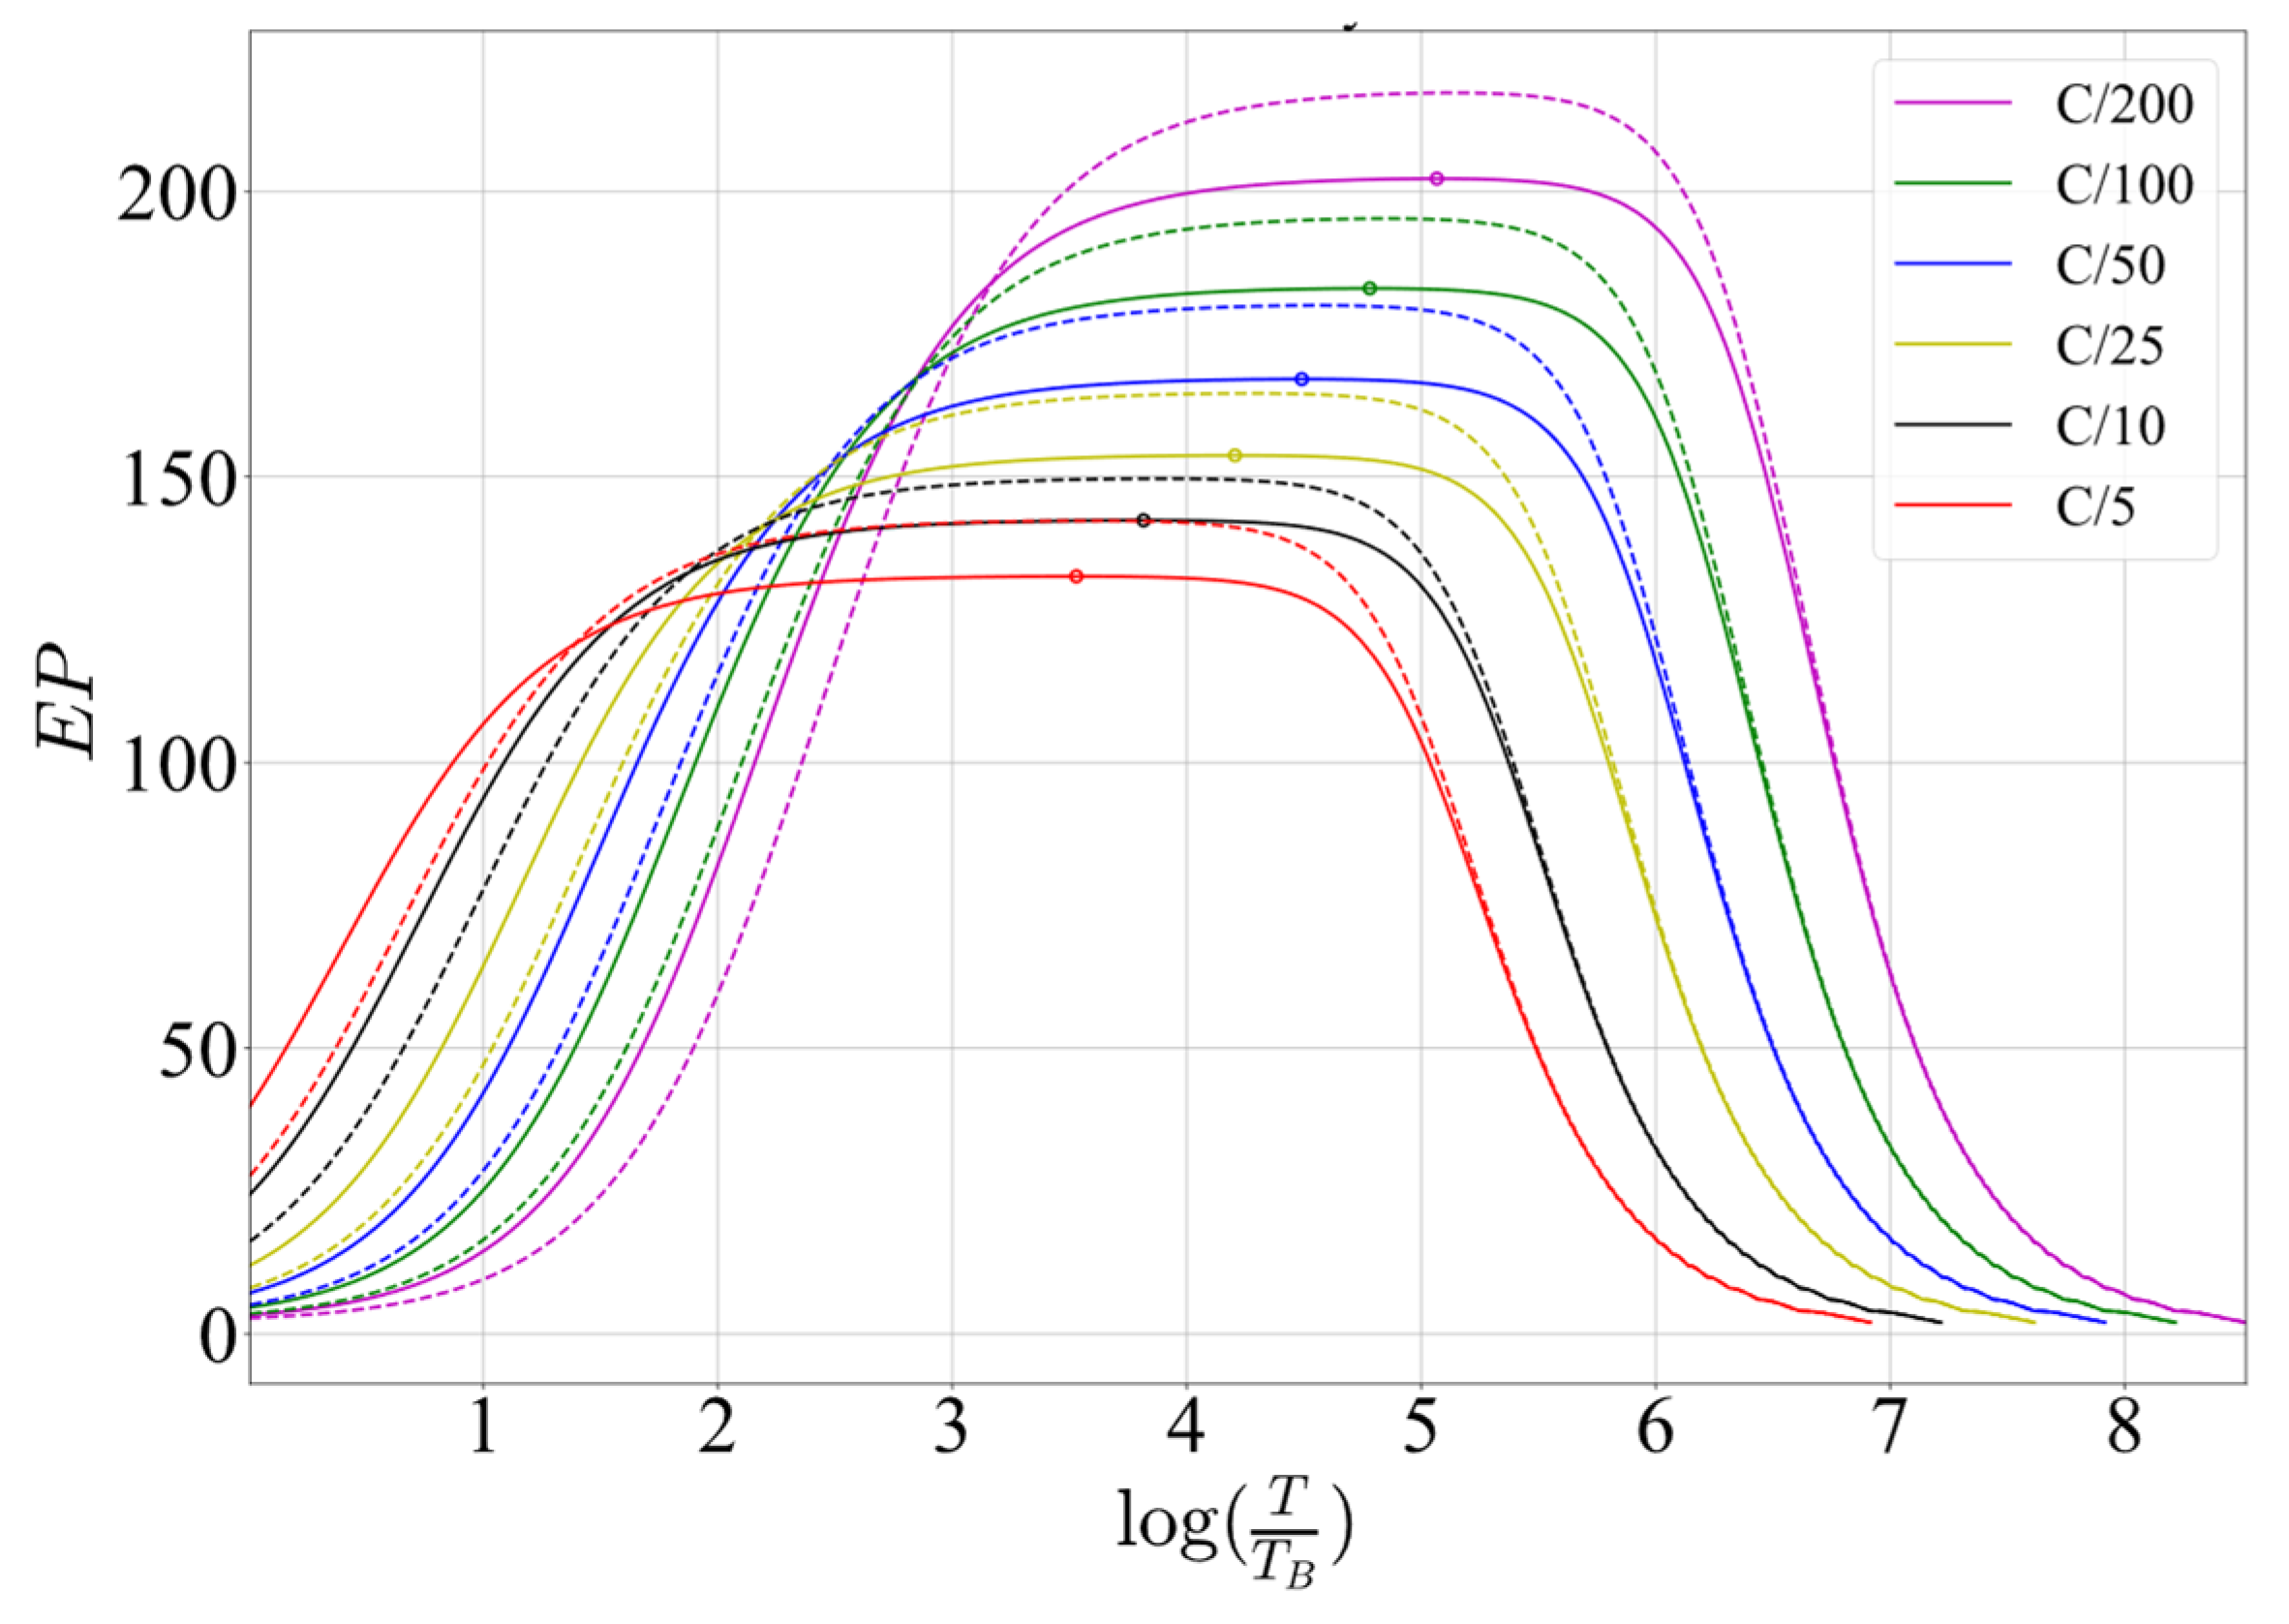
3.1.3. Estimation Algorithm Performance as a Function of Estimation Period

As shown above, R M S E ( T ) increases as the estimation period increases. At the same time, R A C decreases. Thus, it should be attainable to identify a value of estimation period T 0 when these two metrics are balanced, that is, there are acceptable both error and current consumption. To combine two different quantities, those should be normalized with respect to maximum values:
R A C T ~ = R A C T R A C T M ,   R M S E T ~ = R M S E ( T ) 1 3 + R M S E B 2
This is a multi-objective optimization method, which could in general be tackled by various optimization strategies. Since it cannot be told which objective is more important, and due to its relative simplicity, the weighted sum method has been chosen. Then, the analytic form of the estimator performance metrics E P could be defined as
E P T = 1 k E R A C T ~ + k R R M S E T ~
where k E and k R are weights for energy consumption and accuracy respectively, dependant on their relative importance, both in the range 0 ,   1 and under the limitation k E + k R = 1 . The optimal value T 0 is obtained as the value of estimation period when the estimator performance has a maximum.
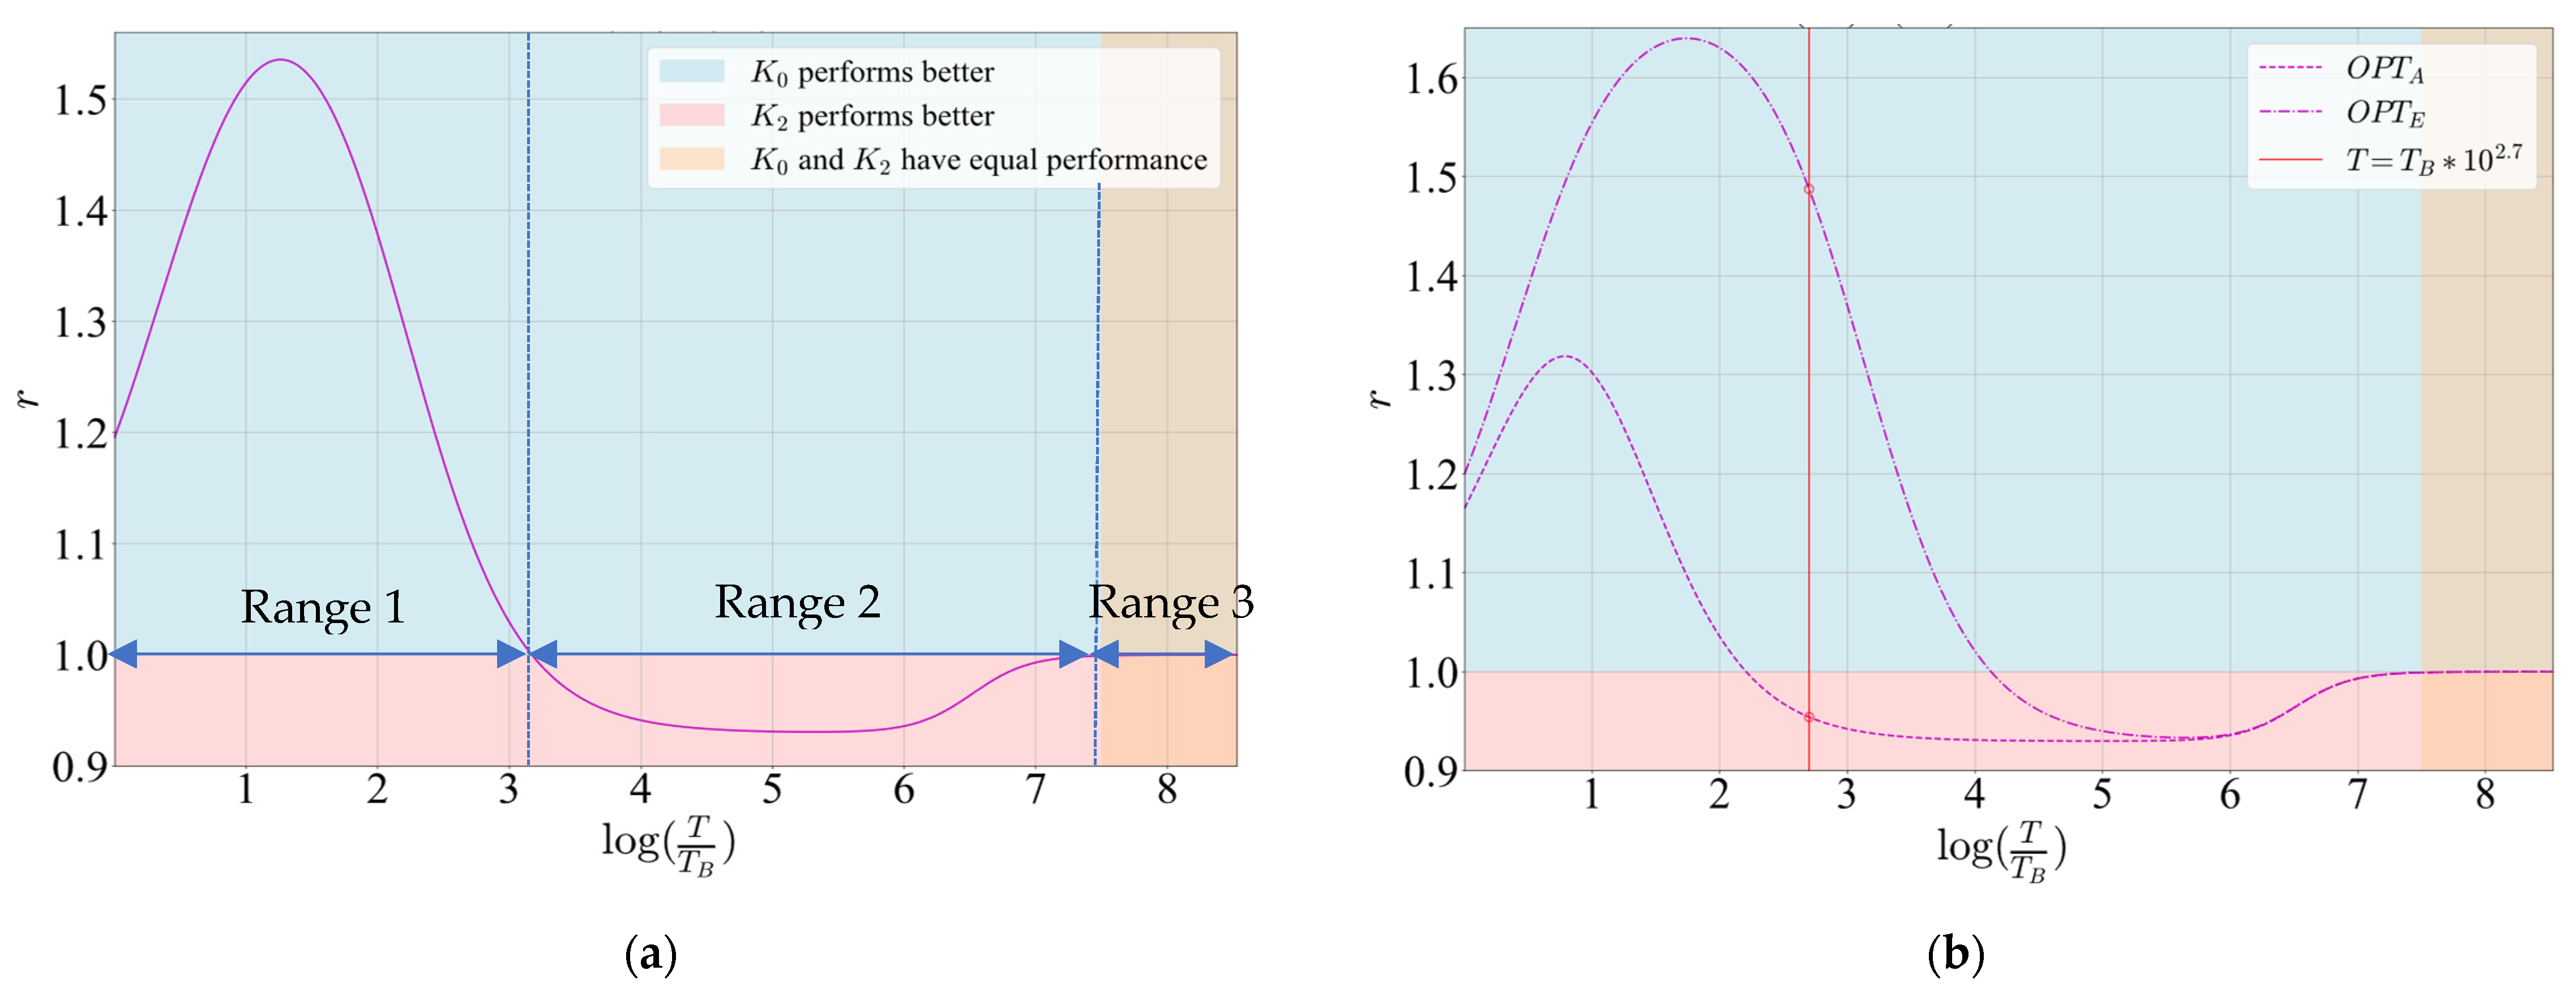
Obtained estimator performance Equation (26) can also be used to compare the two algorithms A1 and A2 in terms of achieved performance for a selected estimation period T S and a given discharge rate. This parameter is named estimators’ performance ratio (r), and it is defined as:
r = E P A 1 ( T S ) E P A 2 ( T S )
If r is greater than 1, then A1 achieves better performance for the selected estimation period; otherwise, A2 provides better performance. However, it should be noted that the two performances might not have a maximum value for the same value of estimation period.

3.2. Computational Complexity of Extended Kalman Filters

To apply the theoretical analysis and showcase its potential for selecting the right algorithm based on well-defined energy requirements, this research focused on selecting two representative algorithms with differing computational complexity while keeping other features, such as initial estimation capability, constant. It was also important to select algorithms that could be implemented purely in software on resource- and energy-constrained platforms. On the basis of a literature review, model-based methods for SoC estimation were chosen, as they offer the best trade-off between accuracy and complexity [60]. The extended Kalman filter (EKF) was selected for its lower computational requirements compared to other nonlinear filters. However, in many practical cases, the adaptive extended Kalman filter (AEKF) is preferred due to its improved noise filtering, even though it requires slightly more computational power [20]. This can reduce the need for additional hardware and software required when implementing the algorithm on low-cost embedded platforms with noisy current and voltage readings. Although the AEKF is often favored in practical applications due to its enhanced noise filtering, it operates on almost the same fundamental principles as the standard EKF. The primary difference is that AEKF continuously adapts its noise matrices during runtime, adding slight complexity and requiring more computational power. Given that the AEKF offers improvements over the EKF, which are not relevant for this research but also increase demand for resources, it was chosen to proceed with the EKF in this research. On the basis of implementations in [19,20,21,22,59], it is demonstrated that the EKF provides sufficient accuracy for online SoC estimation while maintaining low computational complexity, making it suitable for implementation on embedded platforms.
EKF algorithm state equations in discrete time domain as well as utilized battery models, and their parameters are described in Appendix A. In a general case, all the battery model parameters are temperature dependent. Because the focus in this research is to analyse EKF algorithm from a computational complexity perspective, from now on in this research, the temperature effects will be neglected, and all the experiments will be conducted at the same ambient temperature.
The EKF is a recursive algorithm that executes periodically, where two procedures are conducted at each execution: predict and update. Table 2 outlines the steps performed in each algorithm iteration.
The steps presented in Table 2 include various matrix operations like addition (A), subtraction (S), multiplication (M), division (D), inversion (I), and transposition (T). To obtain algorithms of different complexities, two EKF algorithms that utilize two battery models are analyzed. Utilized battery models determine the computational complexity of the algorithm by the order of the matrices involved in the calculations. One of the algorithms is from the category of the computationally simpler algorithms and employs a simple Rint battery model. The algorithm is less precise and has a relatively low energy consumption due to lower computational complexity. The second analyzed algorithm is the EKF, which employs a 2nd-order RC battery model and belongs to the category of complex computational algorithms. It exhibits a high estimation precision and a relatively high energy consumption due to higher computational complexity. Table 3 presents the number of matrix operations within each step as well as the total number of basic mathematical operations such as addition (a), subtraction (s), multiplication (m), and division (d).
As seen in Table 3, the number of matrix operations remains consistent regardless of the model used. However, since the matrix order depends on the utilized model, so does the total number of basic operations. When the EKF is implemented on embedded platforms, the duration of computation depends on both the number and types of the fundamental operations. For instance, execution time of multiplication is significantly longer than in a case of subtraction or addition. In the case of a simple Rint model, all matrices are of the 1st order, meaning that all the matrix operations are performed as scalar operations, thus significantly reducing the computational time. In opposition, the 2nd-order model involves matrices of the 3rd order, so the number of basic mathematical operations and computational time are increased. In an ideal case, the execution time of an SoC algorithm based on the EKF equals the duration of all the basic operations performed in each step. In addition, the ratio of two different model-based EKF cycle run execution times depends on the ratio of the numbers of operations within algorithms. As seen in Table 3, the EKF algorithm based on the 2nd-order RC model contains about 8 times more operations than the EKF algorithm based on the simple Rint model. Therefore, it is expected that the EKF based on the 2nd-order RC model executes at least 8 times longer and consumes 8 times more energy than the EKF based on the simple Rint model. However, accuracy improvements achieved with the EKF based on a 2nd-order RC model may not be proportional.

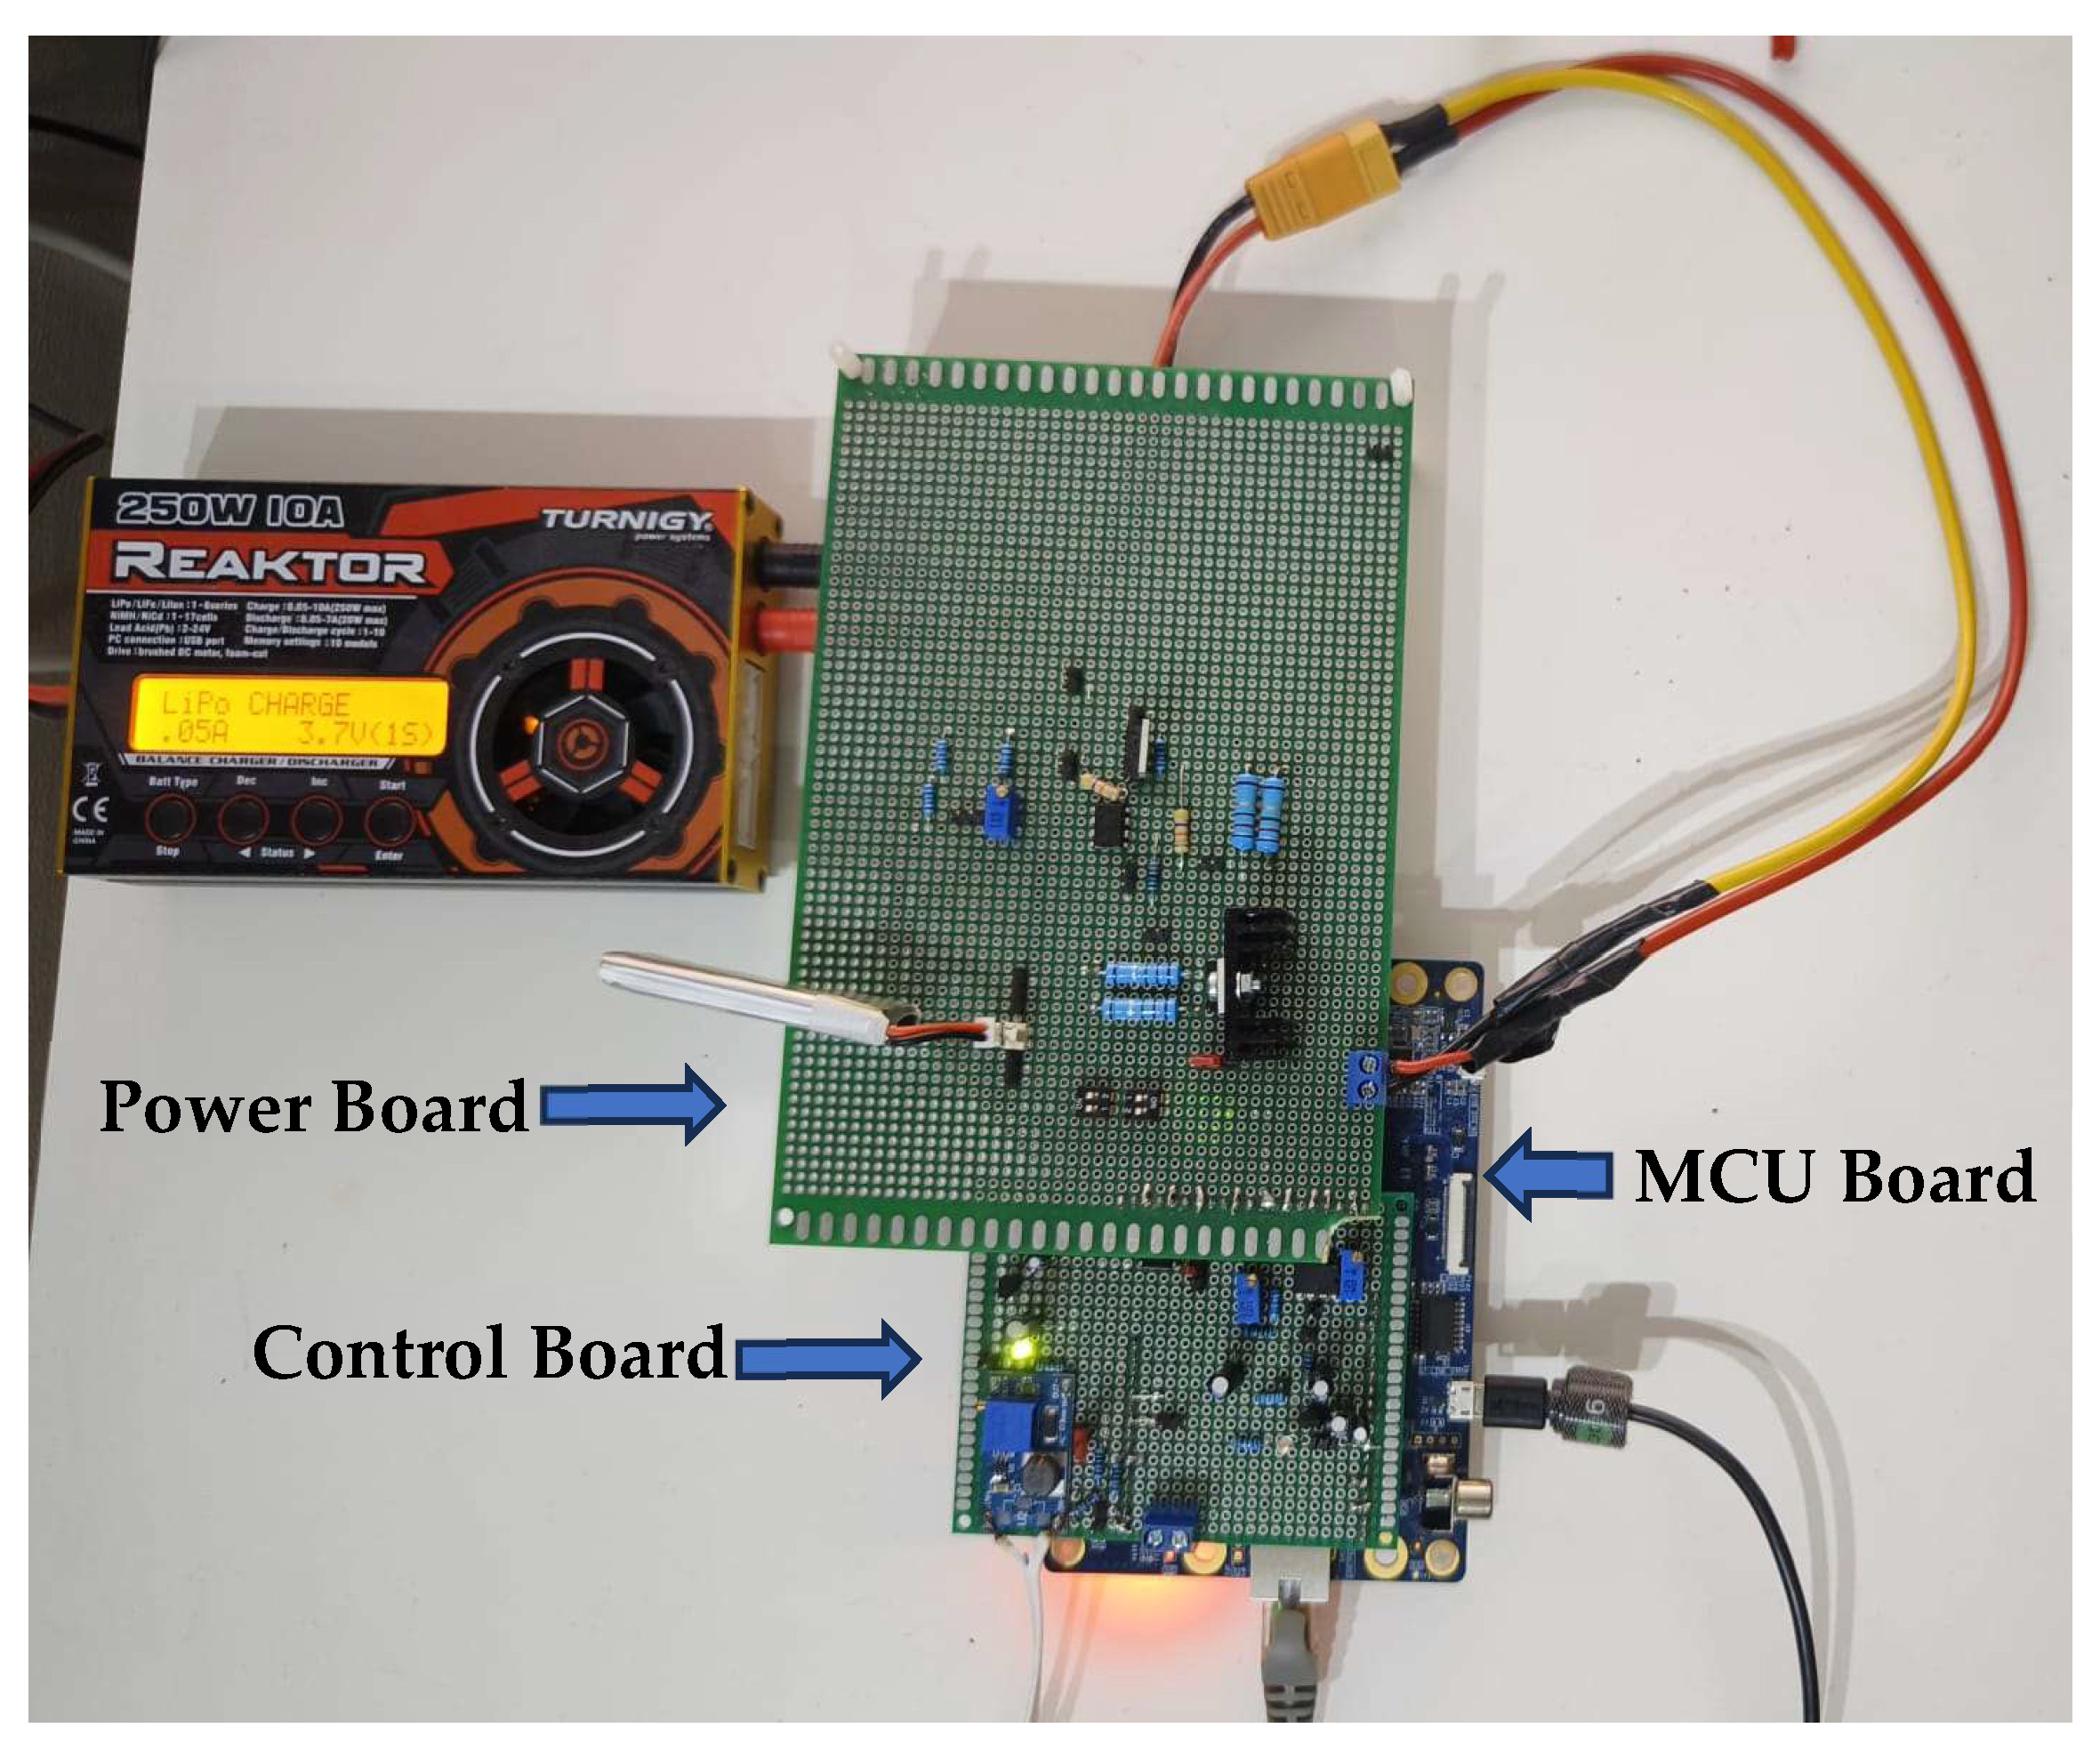
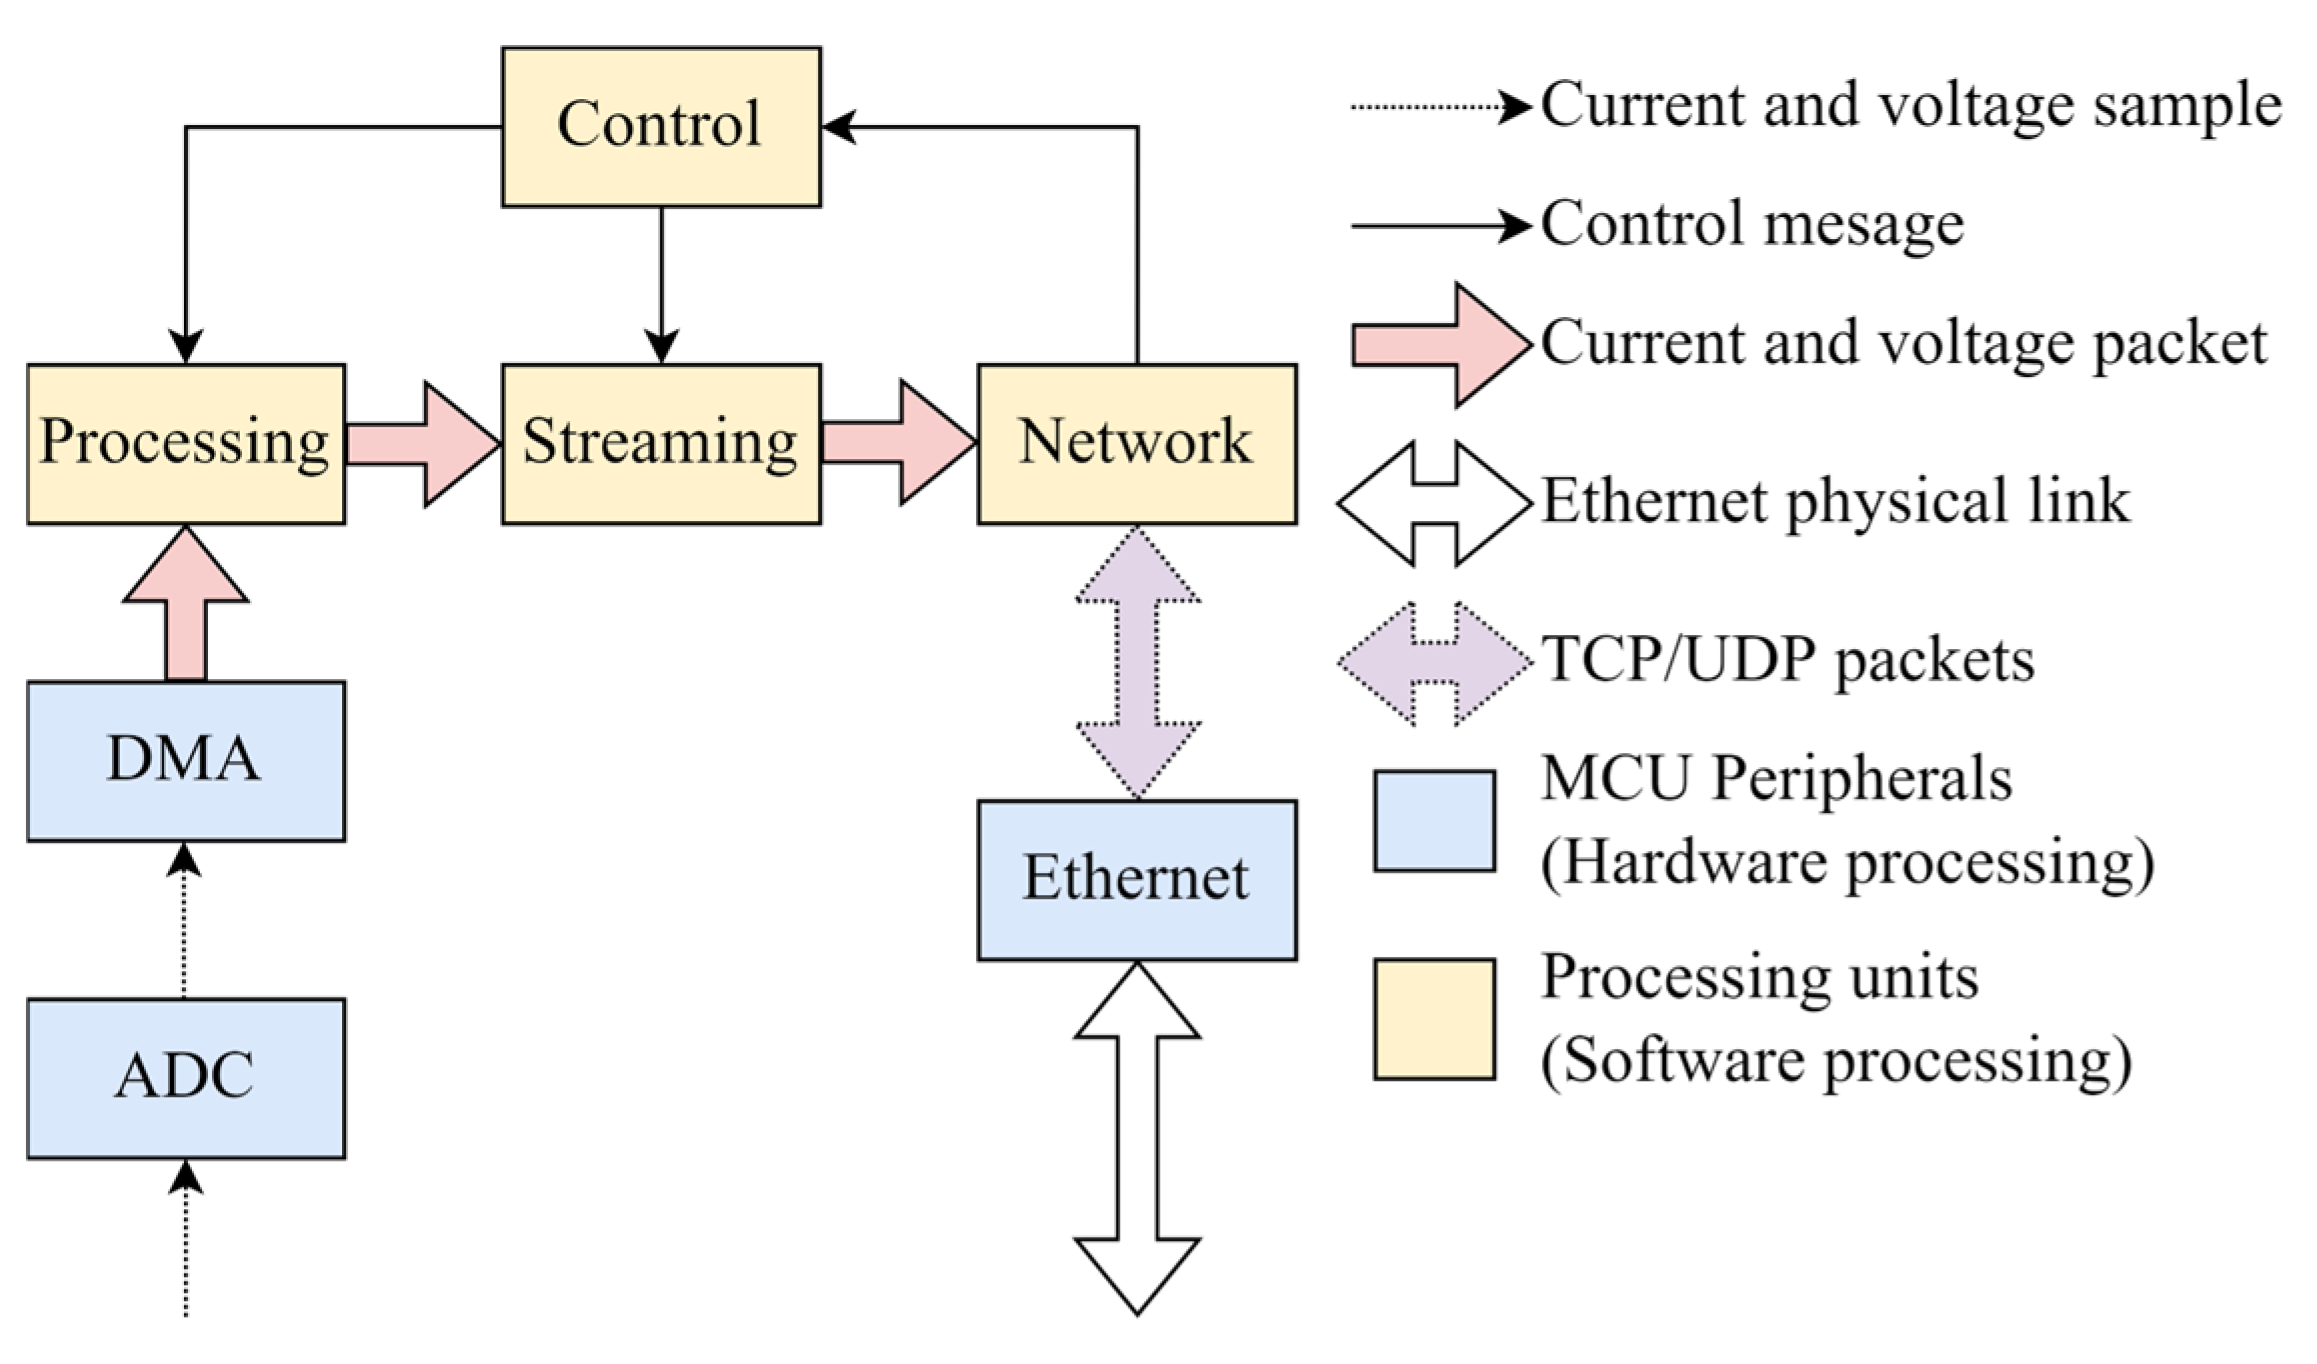
4. Experimental Setup

The equations derived in the previous section describe the relationship between algorithm estimation accuracy and energy consumption as a function of the estimation period. The values of the parameters introduced within these equations must be experimentally determined before the optimization of estimation period is performed. To identify these parameters and validate the theoretical results in a real-world scenario, a series of measurement procedures were carried out. A low-cost microcontroller-based system, named the battery evaluation system (BES), was developed to simplify this process. Within Appendix A are described hardware and software implementation details of BES, while this subsection outlines the experimental procedures for extracting battery parameters and assessing the impact of the estimation period on the accuracy and energy consumption of the EKF algorithm.
A single-cell Tattu LiPo battery with a capacity of 500 mAh and a maximum discharge rate of 45C has been used. The values of the battery’s voltage and current are sampled with the AD converter integrated inside the BES and streamed to a PC, where they are logged and processed offline within a corresponding Python script.
The BES is used to generate battery load currents of different amplitudes that mimic a system consumption profile. To obtain the values of voltage and current during a full battery discharge interval, the following procedure is conducted:
(1)
Battery is fully charged until it reaches its full charge voltage of 4.25 V
(2)
Battery rests for 2 h
(3)
Battery is fully discharged with a selected current, until its terminal voltage reaches a terminal value of 3.2 V
(4)
Battery rests for 4 h
Steps 1–4 are repeated for different discharge rates: C/5 (100 mA), C/2 (250 mA), C (500 mA), 2C (1 A), and 3C (1.5 A). During the discharge process, the values of battery voltage and current are obtained with the minimum (base) sampling period ( T B ) available on the BES, which is 2.176 ms.
After the data acquisition process is completed, post-processing is performed offline by means of custom Python scripts. To analyze the influence of different estimation periods on R M S E ( T ) (9) and R A C T (21), a data decimation technique is performed so variable estimation periods are obtained from the analyzed dataset.
Two types of EKF algorithms, of different computational complexities, are implemented:
(1)
Kalman 0 (K0)—Kalman algorithm that utilizes simple Rint model.
(2)
Kalman 2 (K2)—Kalman algorithm that utilizes the 2nd-order RC model.
The Python scripts were used for analysis of the algorithms’ accuracy, whereas C implementations of both algorithms were run on a STM32H7 microcontroller to obtain the algorithms’ run cycle execution time.
The microcontroller hardware configuration is detailed in Table 4. The EKF implementations were designed as pure bare-metal solutions, operating on a minimum hardware configuration. All peripherals were disabled, code execution is performed from Flash memory, and the cache memory was deactivated.
For all the tests, the estimation period varied from the minimum estimation period available on the BES, (2.176 ms), to the maximum estimation period defined by (19). At the maximum estimation period, there are only two EKF run cycles during a full discharge interval: one at the beginning and one at the end of the interval. Table 5 shows the minimum and maximum estimation periods for the different discharge rates.
The values of S o C B and S o C C C , as defined in Section 3.1.1 are obtained from values of battery voltage and current at the minimum estimation period.   R A C T , as defined in (24), is calculated from EKF cycle run execution time measured on embedded platform D , the used battery capacity of 500 mAh, and consumption of the embedded platform I A e x .
The normalized values R M S E ( T ) ~ and R A C T ~ are used to find the optimal estimation period for the selected algorithms by application of the estimator performance function (26). Three different optimization criteria were considered for further analysis:
(1)
OPT: Algorithm accuracy and energy consumption are equally important, so k E = k R = 0.5 ;
(2)
OPTA: The algorithm accuracy is more important than energy consumption, so k R = 0.9 and k E = 0.1 ;
(3)
OPTE: The algorithm accuracy is less important than energy consumption, so k R = 0.1 and k E = 0.9 .

5. Estimated Value of the Model Parameters

The extraction of the values of battery parameters was performed first in the experiment. As a result, obtained are the open circuit voltage (OCV) as a function of SoC [61] and values of resistors and capacitors [51,53,54,55,56]. All the parameter extractions were performed offline, using dedicated Python scripts that implement polynomial and exponential fitting techniques.
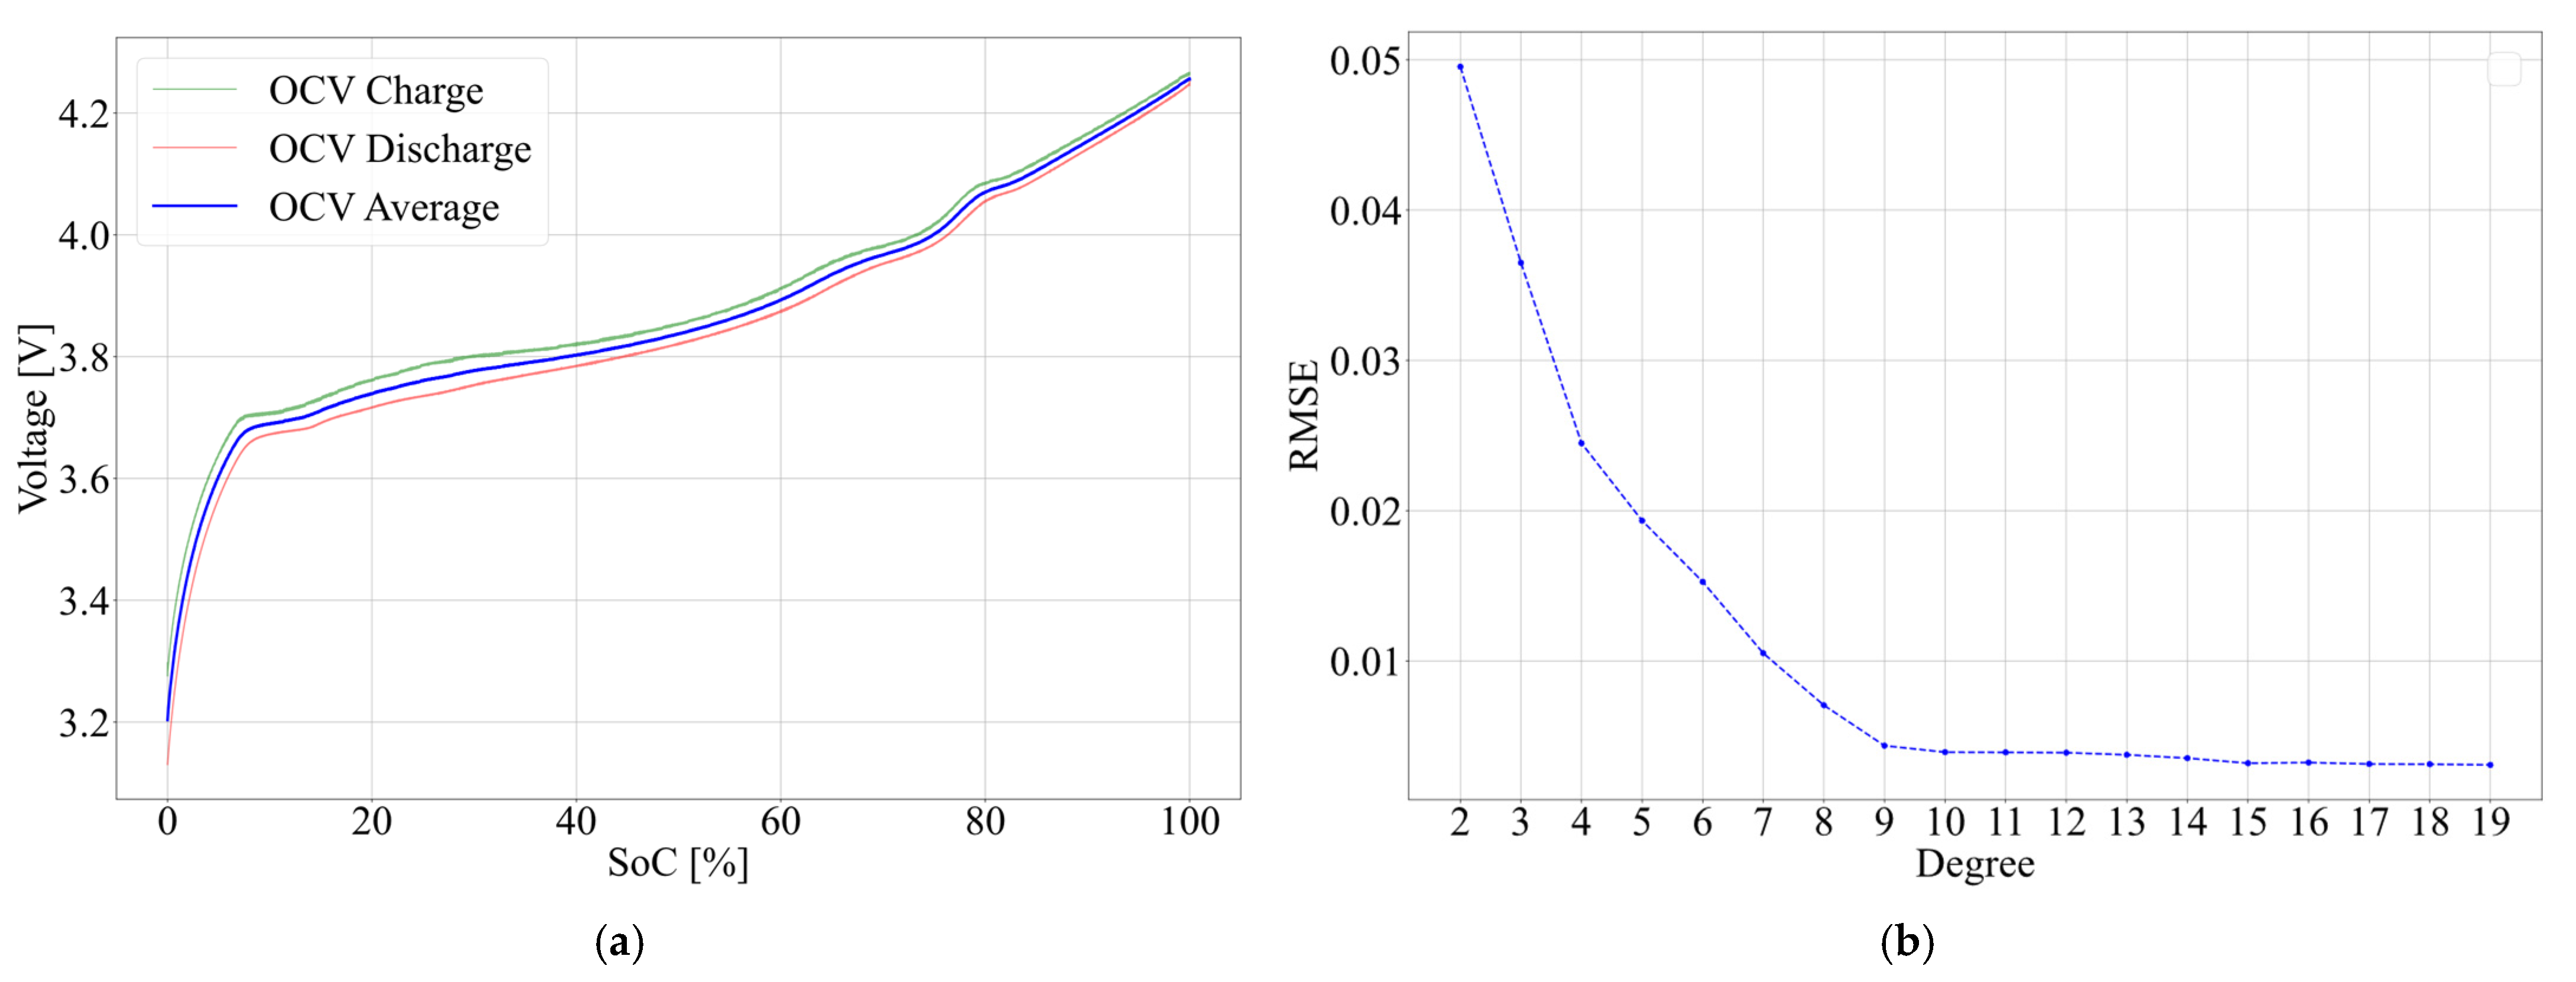
Figure 6a represents the OCV obtained by averaging battery terminal voltage during charge (green) and discharge (red) for a charge/discharge rate of C/10.
After the OCV function has been obtained, polynomial functions of different orders are tried to find the best numerical approximation. Figure 6b illustrates RMSE for different orders of polynomials in the range from 2 through 19. It is noticeable from the figure that RMSE changes a little from the 9th order of polynomial. Since the increase of the polynomial order yields a negligible increase of accuracy yet increases the computational complexity, the polynomial of the 9th order has been used in the subsequent work. The coefficients of the polynomial are given in Table 6.
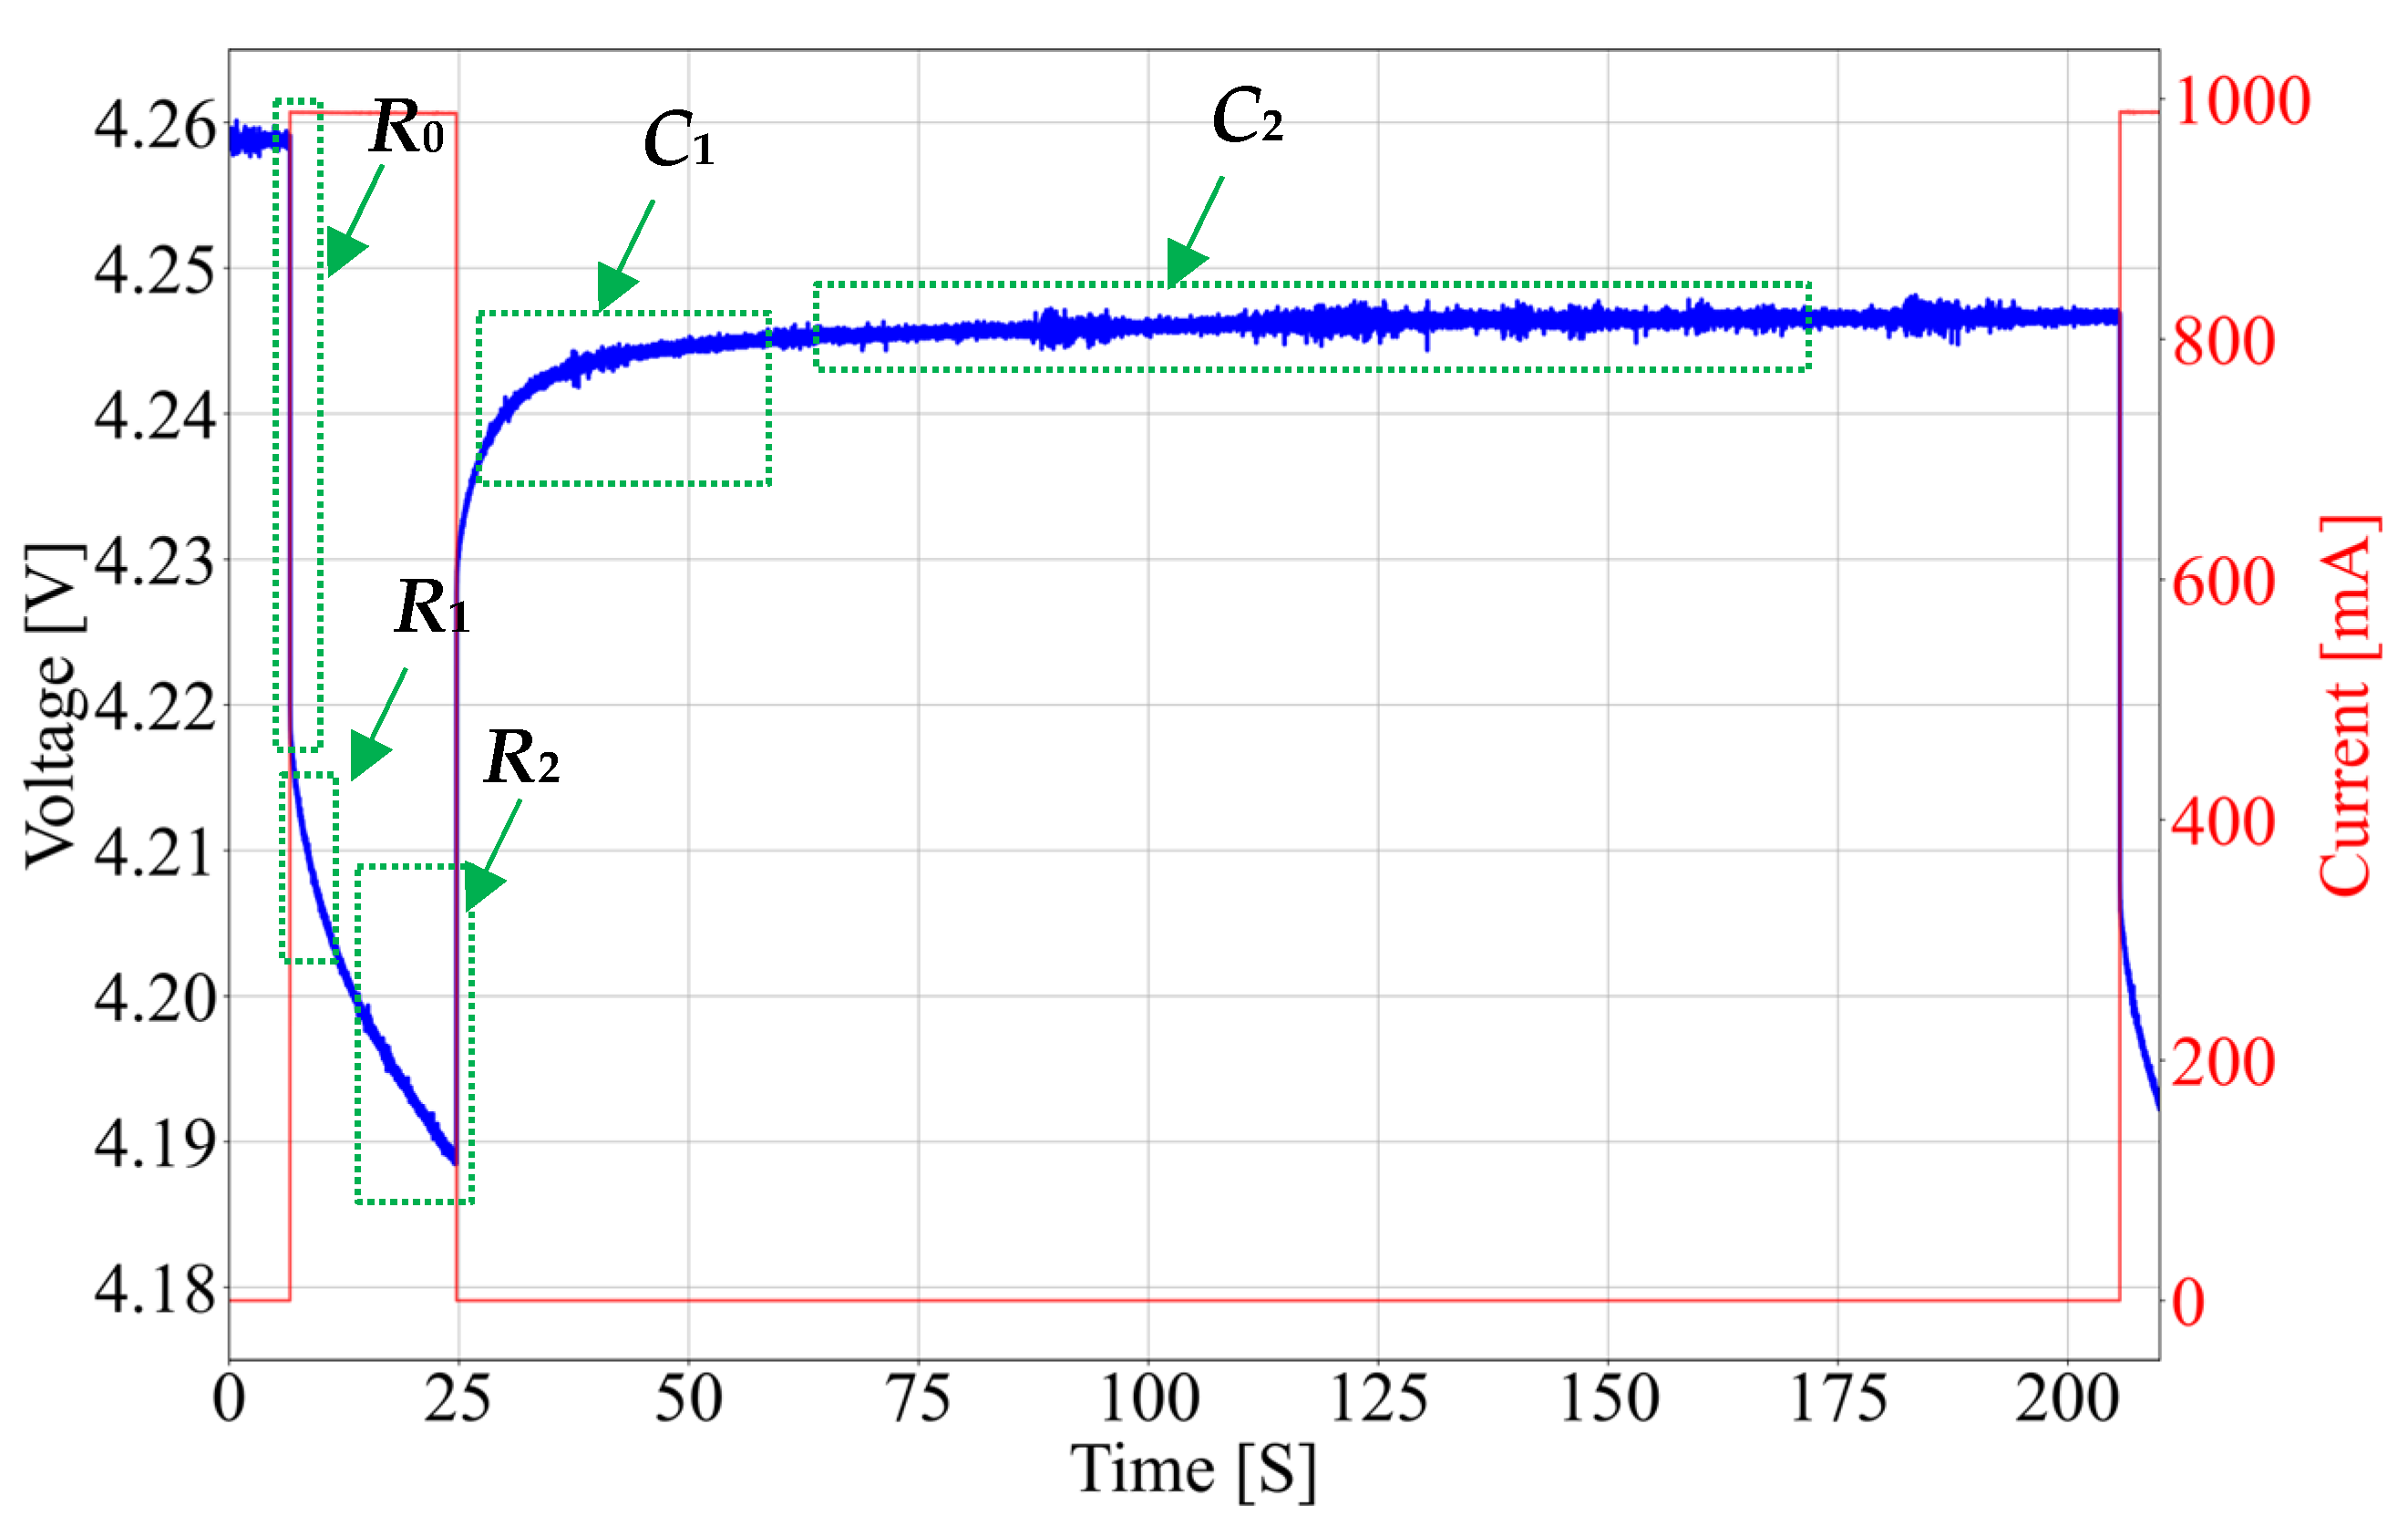
To extract R and C values for both the simple Rint and the 2nd-order RC battery model, the battery is discharged with the dynamic current load profile shown in Figure 7. Parts of the battery terminal voltage waveform used to extract corresponding parameters are also shown in the figure.
The applied discharge profile produces periodical current pulses over the full discharge interval. To obtain the parameters with a resolution of 1% SoC, the current pulse length equals 18s, and the pulse amplitude equals 1 A (2C). The pause between discharge pulses should be at least 10 times longer than impulse length so the battery has enough time to relax.
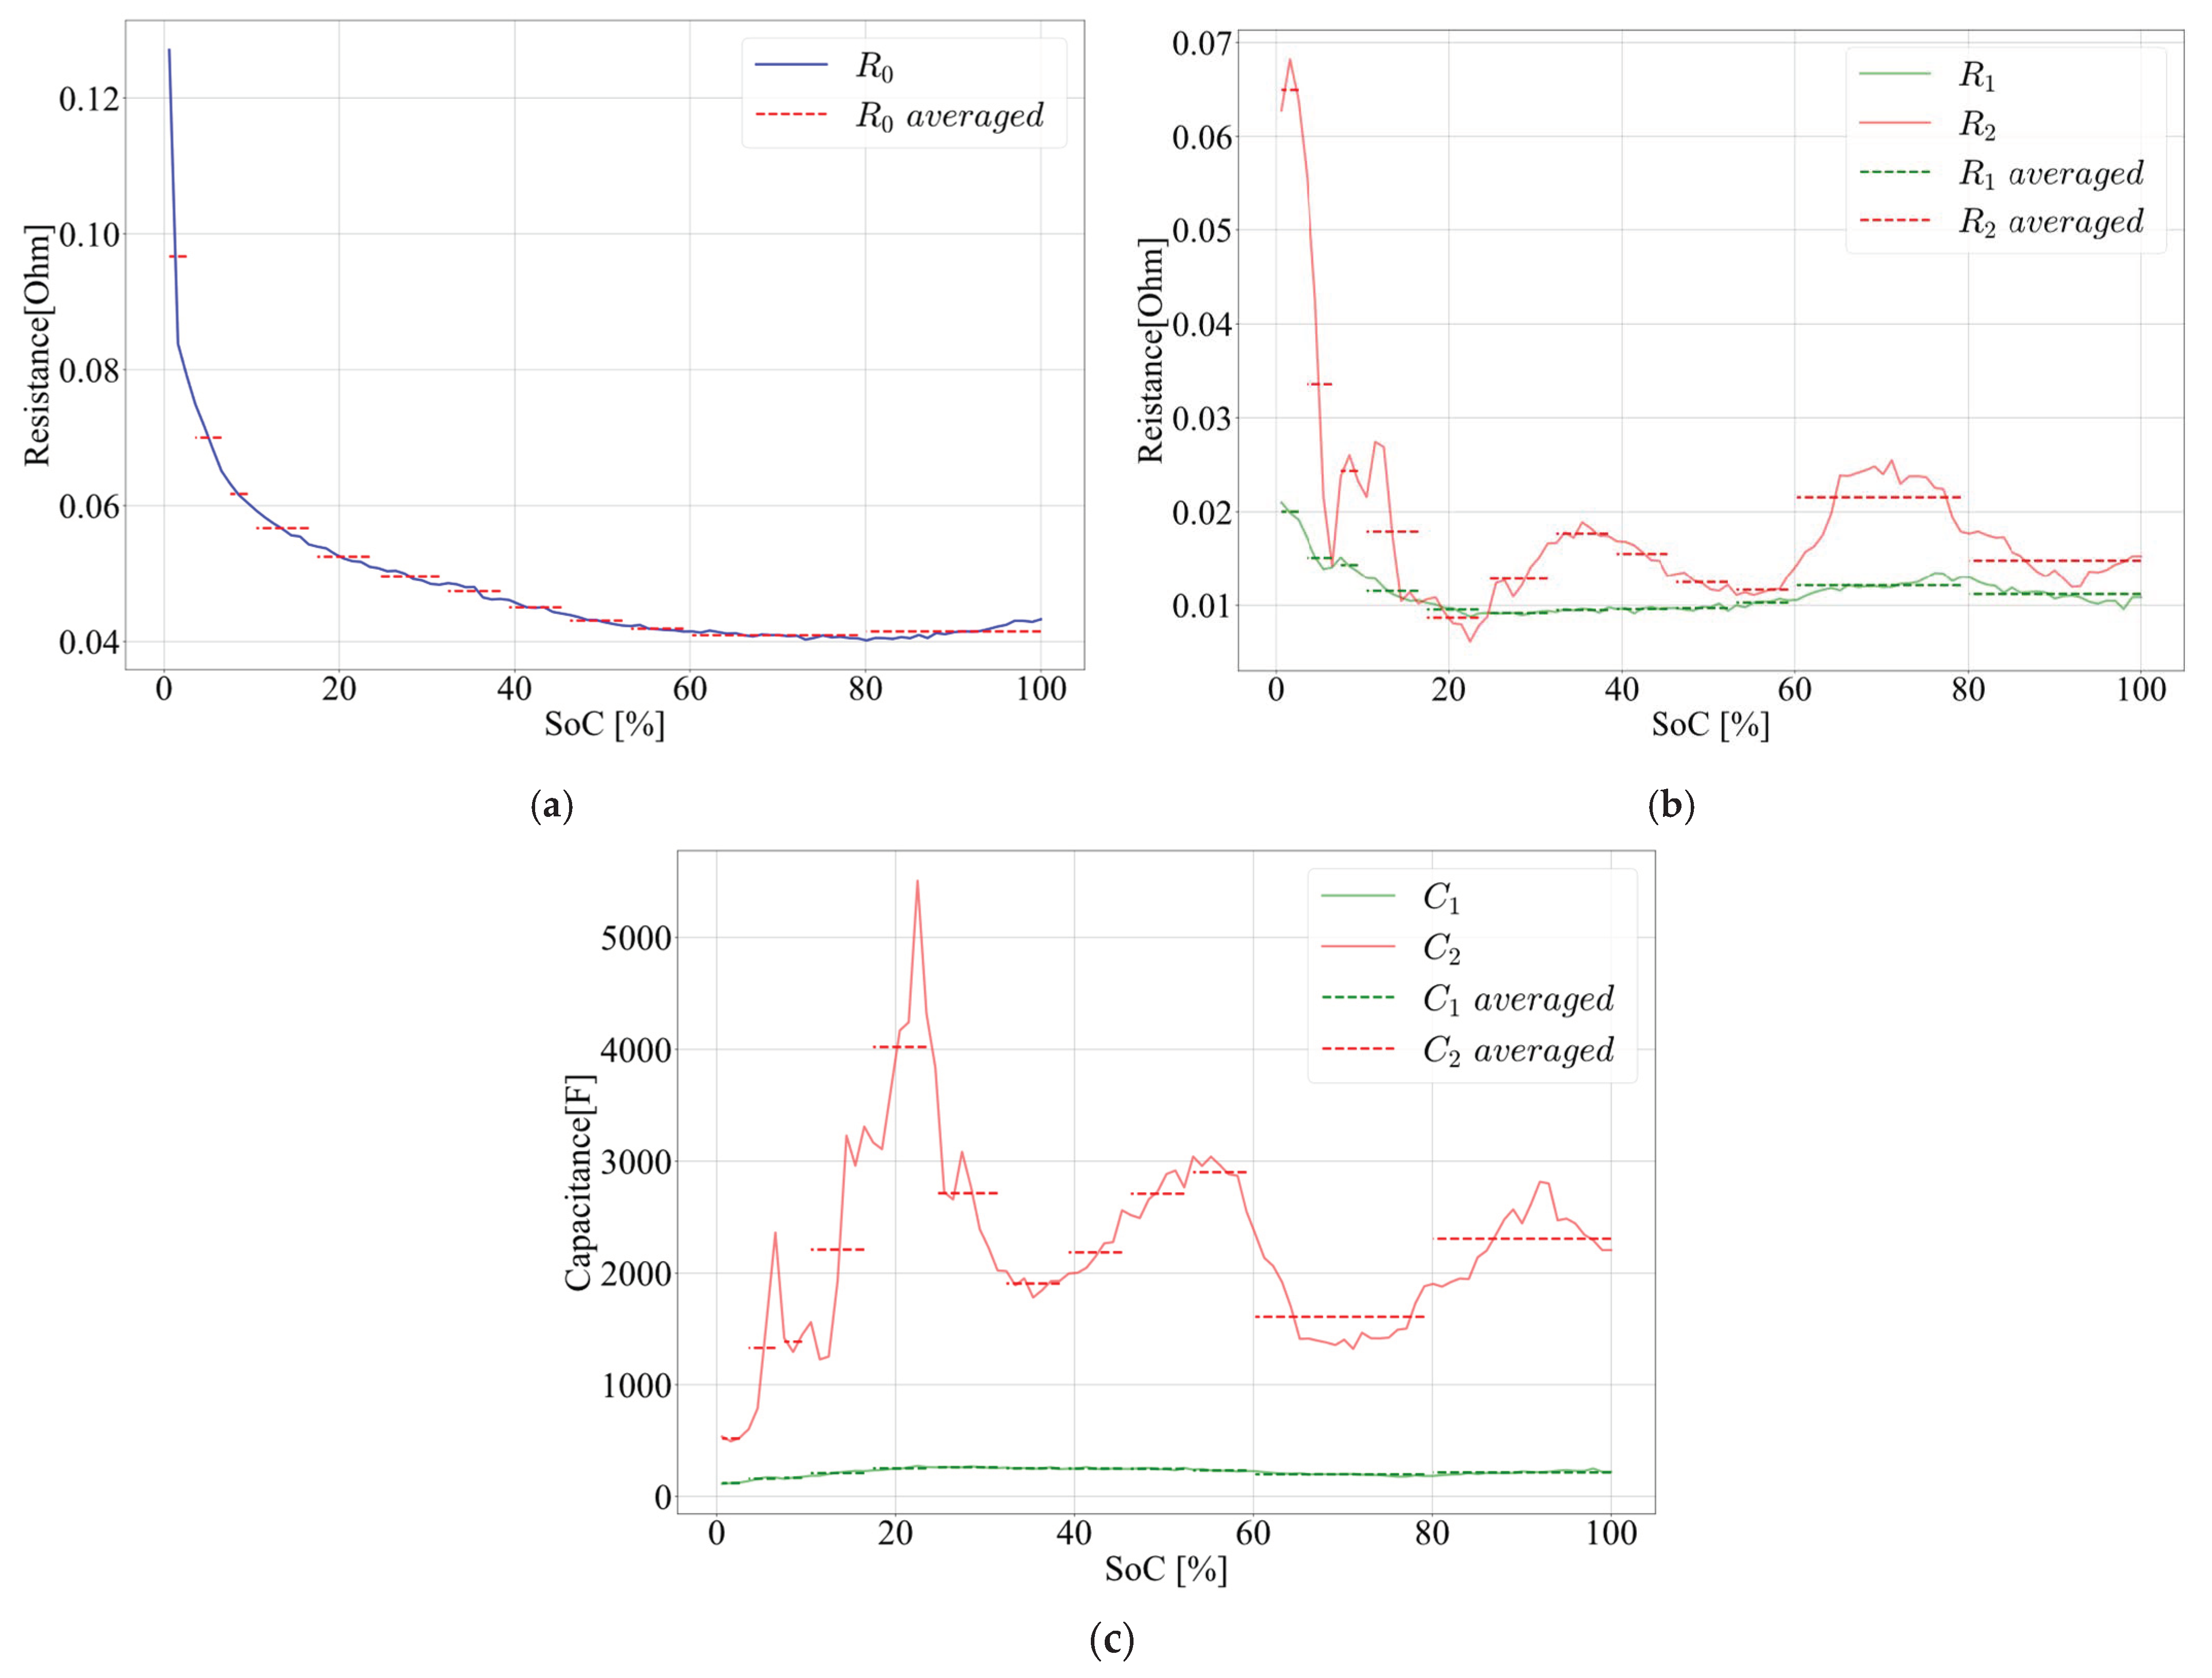
When determining the values of model parameters, instead of using a single average value for the entire SoC range, the method [18] improves the accuracy of SoC estimation algorithms by using averaged values across several smaller SoC ranges. Rint as a function of SoC, for the simple Rint model, is given in Figure 8. The dashed red lines represent Rint averaged over SoC ranges, chosen to follow Rint changes and improve SoC estimation accuracy. The averaged values are presented in Table 7.
Averaging values across smaller SoC ranges improves algorithm accuracy, with the best results achieved using the smallest possible intervals. Maximum accuracy is obtained when the number of intervals matches the number of Rint calculation points. However, smaller intervals increase resource, including storage and computational time, usage. Therefore, it is important to balance accuracy and resource consumption. In this research, regions were chosen to enhance accuracy in the range 10–100% of SoC, as a battery is mostly used when SoC is within this range. The region limits for estimation for the Rint model, presented in Table 8, are also used as limits for 2nd-order RC model parameters. The 2nd-order RC model parameters as a function of SoC are given in Figure 9. The dashed lines present averaged parameters over SoC ranges, the same as in the case of the simple Rint model. The averaged values are presented in Table 8.

6. Results

In this section, R M S E ( T ) (9) obtained by the experiment has been checked against theoretical expectations in the first subsection. The selected algorithms’ performance analysis has been performed in the second subsection. A use case has been provided in the third subsection.

6.1. Estimation Accuracy

Experimentally obtained values of R M S E B for different discharge rates that mimic consumption of a system and two estimation algorithms are presented in Table 9, along with the relative yield of Kalman 2.
For the selected discharge rates, the values of R M S E B for Kalman 2 are lower than the values for Kalman 0, as expected since Kalman 2 incorporates a more complex battery model. As discharge rate decreases, the Kalman 2 gets better, yielding from 15% to 7% R M S E B improvement over Kalman 0.
Values of R M S E T both calculated from (17) and normalized by R M S E M (19), as well as experimentally obtained, for Kalman 0 and Kalman 2, are presented in Figure 10 in log–log scale.
The values of R M S E T closely match for higher estimation periods for both EKFs. At lower estimation periods, there is a difference between theory and the experiment, increasing as discharge rate decreases. The difference occurs because the theory assumes a perfect estimator, which is not the case. Moreover, the difference of R M S E T for Kalman 2 is noticeable within a wider range of estimation periods when compared to Kalman 0. Consequently, R M S E T (18) may not be applicable to small estimation periods. However, for both EKF methods, even within the range where R M S E T ’s mismatch, the values of R M S E T are at least 10 times smaller than the corresponding R M S E B values shown in Table 9. Therefore, when considering the total R M S E ( T ) (9), crucial for calculating the energy performance curve (26), the deviation of R M S E T from theory, as well as R M S E T value in general, is negligible compared to R M S E B in the region of relatively low estimation periods. Additionally, within the region of small estimation periods, R A C values are higher, and they contribute more to the energy performance curve (26).
Figure 11 shows the differences between the total RMSE, R M S E ( T ) defined by (9), where experimentally obtained values of R M S E B given in Table 10 are used, and the experimentally obtained values for the total RMSE.
It can be seen in the figure that, for the selected range of discharge rates, the difference between theory and the experiment is about 1% for the highest discharge rate. However, for lower discharge rates, this difference is under 0.25%.

6.2. Performance

To perform energy consumption analysis for an actual microcontroller-based system, both EKF algorithms are implemented in software and quantified in terms of time required to perform a single cycle run. The results achieved on the STM32H723 MCU configured as shown in Table 4, for the EKF algorithms based on Rint and the 2nd-order battery RC model, are presented in Table 10.
From the data presented in Table 11, Kalman 0 implementation is about 30% faster than the Kalman 2 implementation. The information presented inside the table, combined with the microcontroller properties presented in Table 4, is sufficient to determine the algorithm’s energy consumption when EKF is running as the sole software component on the microcontroller. Therefore, one can conclude that Kalman 2 consumes 30% more energy when compared to Kalman 0.
Once the execution times of the EKF algorithms are obtained, R A C (24) can be determined for both EKFs and the discharge profiles listed in Table 10. The performance curves (26) for two estimators can be compared when combining R A C and R M S E ( T ) obtained theoretically and experimentally. Figure 12 presents these theoretical and experimental performance curves, E P T and E P M respectively, for the OPT, criterion where k E = k R = 0.5 , for both Kalman 0 and Kalman 2.
The optimal sampling period T 0 for a chosen discharge rate and estimation algorithm can be determined from Figure 12. In the figure, the circles on the E P M curves represent the estimation periods for which E P T has a maximum. It is evident that the maximums, obtained the experiment, agree with the theoretical expectations. Based on Figure 12, it can be inferred that it is feasible to use the theoretical analysis presented in the Section 3 to predict the estimator performance for any discharge rate if the prior information about corresponding R M S E B   is known.

6.3. Use Case

At lower discharge rates, comparable to the consumption of an SoC algorithm, the value of relative algorithm consumption R A C T is higher. In this case, selection of the optimal estimation period for the SoC algorithm results in greater energy savings compared to higher discharge rates. While performance analysis at low discharge rates is important, conducting such analysis experimentally is impractical. Although sophisticated hardware can address the technical challenges of measuring low currents, logging and analyzing voltage and current samples require significant computational and storage resources. Therefore, in such a case, a theoretical analysis can be used for determination of the optimal SoC algorithm estimation period.
To demonstrate the potential of the presented analysis, two possible real-world system design scenarios are analyzed:
  • optimal estimation period should be identified in order to minimize energy consumption and estimation accuracy error.
  • optimal estimation algorithm should be selected for a selected estimation period and selected optimization criterion.
Both design scenarios consider two EKF implementations, Kalman 2 and Kalman 0, as SoC estimation algorithms that should be implemented as software solutions on battery-powered systems based on the STM32H723 microcontroller. These algorithms have already been implemented on this microcontroller, and the obtained single-run execution times are presented in Table 10. Also, both algorithms have been evaluated with BES under discharge rates of C/5 and C/10, and the obtained RMSEB values are presented in Table 9. The analyzed system operates under discrete static low discharge profiles (C/5, C/10, C/25, C/50, C/100, and C/200), which are comparable to microcontroller consumption defined in Table 4.
For the first design scenario, relative algorithm consumption R A C T is calculated from (24) substituting the values presented in Table 4 and Table 10. To enable calculation of R M S E ( T ) , the following assumptions are introduced:
-
RMSEB is reduced by approximately 0.07% when discharge rate halves as can be concluded from Table 9.
-
RMSEB of Kalman 2 is about 7% better than RMSEB of Kalman 0, as noted earlier.
The estimator performance curves for discharge rates of C/5, C/10, C/25, C/50, C/100, and C/200, for Kalman 0 and Kalman 2, and the optimization criterion OPT, are presented in Figure 13. Table 11 lists the optimal period, and RMSE and RAC for base and optimal estimation periods for both implemented estimators and discharge rates.
Based on the values of R A C T 0 and R A C T B from Table 11, it can be noticed that for the discharge rate of C/200 and EKF based on the simple Rint model, the selection of the optimal estimation period leads to a reduction in the algorithm energy consumption of approximately 71%. In the case of the battery used in the experiment, this reduction amounts to about 355 mAh of capacity, which can be used by other system activities or simply extend the system operation time. The energy reduction is accompanied by a negligible increase in the SoC estimation error, since at the optimal estimation period R M S E B originating from the estimator imperfectness is much higher than R M S E T 0 originating from the increase of the estimation period.
For 2. design scenario, the two estimators are compared in terms of performance using the performance ratio (27). Figure 14a depicts the dependence of the ratio on estimation period for the optimization criterion OPT, Kalman 0 and Kalman 2, and the discharge rate of C/200. On this figure, three ranges of estimation periods are clearly identifiable. In range 1, Kalman 0 performs better, in range 2, Kalman 2 performs better, and in range 3, the estimators’ performance is equal. Based on this notion, if the estimation period of an estimator is pre-set, the estimator that performs better can be selected for actual implementation. It is of course possible to employ different optimization criteria and get respective performance ratios. Figure 14b illustrates estimator performance ratios for the same system for OPTA and OPTE optimization criteria. The figure clearly shows that for a selected estimation period, the estimators have different performances for different optimization criteria. For example, if T = T B × 10 2.7 = 1   s , Kalman 2 provides better performance under the OPTA criterion, which prioritizes accuracy over consumption. On the other hand, when consumption is the priority, as per the OPTE criterion, Kalman 0 achieves better overall performance.

7. Conclusions

Selecting an SoC algorithm for battery-powered microcontroller-based embedded platforms is challenging due to the lack of information in the literature regarding algorithm energy consumption. This paper conducts a detailed theoretical analysis to lay the foundation for quantifying the energy consumption of recursive model-based SoC algorithms, which are suitable for implementation on resource-constrained embedded platforms. Consequently, a set of equations was derived, and the estimation period was identified as a configurable parameter that can be adjusted to reduce the algorithms’ energy consumption. To link accuracy and energy consumption, the paper proposes an estimator performance equation as a function of the estimation rate, enabling the selection of the optimal estimation rate. Results obtained within this paper demonstrate that there is an acceptable deviation between values obtained with derived equations and values obtained by experiments. Therefore, the theoretical approach may provide acceptable results and reduce experimentation time.
Two types of extended Kalman filters, utilizing models of different complexities, are implemented to evaluate their relative computational complexity per single run cycle on a real embedded platform. It has been obtained that the EKF based on the 2nd-order RC model is 30% slower compared to the EKF based on the simple Rint model in the case of implementation on an STM32H7-based microcontroller. These results are used to demonstrate the potential that the equation derived in this work has in selecting optimal estimation periods and designing low-consumption SoC algorithms for resource-constrained embedded platforms. It has been shown that choosing the optimal sampling period can significantly reduce energy consumption with a slight degradation of SoC estimation accuracy for systems where total system currents are comparable to the current of the microcontroller running the algorithm. For systems with current discharge rates ranging from C/5 to C/200, energy reduction can reach up to 71%. Besides selecting the optimal estimation period, the derived set of equations can also be used to determine which algorithm performs better for the selected estimation period.
It has been demonstrated that, for different SoC algorithms, there are different optimal estimation periods for a selected optimization criterium. This paper establishes a foundation for future work, which may involve the use of different quantifications of accuracy, different optimization strategies, and the development of an algorithm that alternates between different estimators and/or adapts estimation periods based on consumption dynamics. Also, the experimental verification of the results could be extended to other battery load profiles.

Author Contributions

Conceptualization, H.T. and I.P.; methodology, H.T. and V.R.; software, H.T.; validation, H.T., V.R. and I.P.; formal analysis, I.P. and V.R.; investigation, H.T.; resources, H.T.; data curation, H.T.; writing—original draft preparation, H.T.; writing—review and editing, V.R.; visualization, H.T.; supervision, I.P. and V.R.; project administration, I.P.; funding acquisition, V.R. All authors have read and agreed to the published version of the manuscript.

Funding

This work is funded by the Austrian Federal Ministry of Climate Action, Environment, Energy, Mobility, Innovation and Technology, the Austrian Federal Ministry of Digital and Economic Affairs, and implemented by Austria wirtschaftsservice (aws) and the Austrian Research Promotion Agency (FFG) in the frame of the Important Project of Common European Interest (IPCEI) on Microelectronics and Communication Technologies.

Data Availability Statement

Data are contained within the article.

Acknowledgments

This work was financially supported by the Ministry of Science, Technological Development and Innovation of the Republic of Serbia under contract number: 451-03-65/2024-03/200103.

Conflicts of Interest

The authors declare no conflicts of interest.

Appendix A

EKF algorithm state equations in discrete time domain are:
x k = A x k 1 + B u k 1 + ω [ k 1 ]
y k = C x k + D u k + v [ k ]
where k represents the ordinal number of the sample point, x is state variable, u is control input, y is measurement, whereas ω and υ represent system and measurement zero mean Gaussian white noise with covariance matrices Q and R, respectively. When Equations (A1) and (A2) are applied for SoC estimation, u[k] and y[k] represent battery current and terminal voltage at the sample point k, respectively. The size of state variables, as well as of the matrices A, B, C, and D, depend on the employed battery electrical model.
A battery model is important to accurately represent the electrical behavior of the battery. Nevertheless, it is important to find an appropriate balance between model complexity and accuracy so that the algorithm can be implemented on a computationally constrained embedded platform. To analyze the impact that a model has on accuracy and system energy consumption, this research utilizes two battery models: the Rint model, computationally simpler but less accurate, and the 2nd-order RC model, computationally complex but of higher accuracy. The two models are presented in Figure A1.
Figure A1. Battery electrical circuit models: (a) Rint model; (b) the 2nd-order RC model.
Electronics 13 04256 g0a1
The Rint model consists of a voltage generator representing the open circuit voltage (OCV) [48] and a series resistor representing the battery internal ohmic resistance. This model is simple, and it uses comparably less computational power. However, it does not provide sufficient accuracy in some applications.
The 2nd-order RC model adds two parallel RC networks in series to the internal ohmic resistance. This model represents an upgraded Thevenin model that employs a single RC network. The two RC networks are added to more accurately model the polarization effect of the battery. The first RC network (R1 and C1) simulates a fast battery process, whereas the second network (R2 and C2) simulates a slow battery process. Consequently, this model better describes the transient and steady-state characteristics of the processes inside a battery. Notwithstanding, although this model offers a higher accuracy, it requires more computational power.
The content of matrices A, B, C, and D for the two models is presented in Table A1.
Table A1. Kalman filter matrices.
MatricesModel
Rint2nd-Order Thevenin Model
A 1 1 0 0 0 e T s C 1 R 1 0 0 0 e T s C 2 R 2
B T S C N O M   T S C N O M R 1 ( 1 e T s C F A S T R F A S T ) R S L O W ( 1 e T s C S L O W R S L O W )
C d v O C S O C d S O C d v O C ( S O C ) d S O C 1 1
D R 0 R 0

Appendix B

For a proper evaluation of battery characteristics, an evaluation system that closely matches operating conditions is needed. A low-cost in-house solution has been developed for this purpose, called the battery evaluation system (BES). When compared to traditional equipment used for evaluating battery characteristics, which is often expensive, locked in hardware and software modifications, and unsuitable for analyzing in the domain of relatively low currents, the developed system enables great flexibility and serves as a robust solution for current and future experiments. The system provides for configurable voltage and current sampling rates, streaming over Ethernet, generation of arbitrary consumption profiles, Python scripts for extraction of battery parameters, a user-friendly graphical interface, and other useful features. The complete measurement system software libraries and hardware schematics are available as an open-source solution on the GitHub repository [62].
The BES block diagram is presented in Figure A2. The BES hardware consists of a power board, control board, and MCU board.
Figure A2. Battery evaluation system block diagram.
Electronics 13 04256 g0a2
The power board enables current measurement and generation of arbitrary consumption profiles. The present version of the board supports current measurement in the range of 5A. The control board integrates analog components in charge of monitoring and control of the power board. The functions of the board include scaling of the current sense and battery voltages, overvoltage and overcurrent detection, etc. The MCU board used is the official STM32H7-DISCO development board employing the STM32H747XIH6 microcontroller. The microcontroller is selected since it contains AD converters with up to 5 MSps configurable sampling rate. Moreover, this microcontroller includes an Ethernet peripheral capable of establishing a 100 Mbps communication link. Since the BES is implemented as a set of boards, it is possible to modularly change the boards and adapt the system for various experiments and analyses.
The hardware of the BES is presented in Figure A3.
Figure A3. The hardware of the battery evaluation system.
Electronics 13 04256 g0a3
The BES software (version 1.0) architecture is built based on general design guidelines described in [63], and it includes a firmware based on RTOS implemented on MCU, and C++ and Python-based software components implemented on a PC.
The microcontroller firmware is based on the FreeRTOS real-time operating system, which utilizes the LwIP software (https://savannah.nongnu.org/projects/lwip/, accessed on 10 September 2024) communication stack to enable TCP/IP communication. The main firmware blocks, as well as their connections, are illustrated in Figure A4.
Figure A4. The BES firmware blocks and interconnections.
Electronics 13 04256 g0a4
Battery voltage and current are sampled by the AD converter integrated within the microcontroller. The DMA controller, synchronized with the AD converter, combines multiple voltage and current samples into a single sample packet. This packet is processed by the processing software block, which encapsulates the sample packet with the corresponding header and forwards it to the streaming block. The streaming block performs packet enumeration and forwards the packet to the network block, which encapsulates the received packet within a UDP message and transfers it to a PC. The system can be remotely controlled by the PC using TCP control messages. The TCP messages are received by the network block, which forwards them to the control block. The control block parses the messages and performs the corresponding action based on the payload.
Software on the PC is used to configure hardware easily, but also to receive, log, and process voltage and current samples. For the sake of efficiency, these activities are implemented within two different parts: the graphical user interface (GUI) application and various Python scripts.
The GUI application is written in a C++-based Qt framework, and it enables the control of the microcontroller, as well as real-time reception and plotting of data samples. Because C++ is very efficient in the processing of raw data, the application can receive data with a minimum CPU utilization [64]. Also, this application provides for logging of data samples into a file, an important feature for further offline data analysis.
Due to the availability of diverse third-party libraries that enable easy data processing, the implementation of various battery-related data analysis algorithms was much simpler in Python when compared to the C++ Qt framework. When data are stored inside a file, it is analyzed by use of corresponding Python scripts. For example, one script implements an algorithm for the extraction of open circuit voltage battery parameters; another extracts values of resistors and capacitors in a model; whereas a third script incorporates the EKF filter algorithm.

References

  1. Kalawoun, J.; Biletska, K.; Suard, F.; Montaru, M. From a Novel Classification of the Battery State of Charge Estimators Toward a Conception of an Ideal One. J. Power Sources 2015, 279, 694–706. [Google Scholar] [CrossRef]
  2. Surendar, M.; Pradeepa, P. Future Challenges in State of Charge Estimation for Lithium-Ion Batteries. Int. J. Eng. Adv. Technol. 2020, 10, 215–223. [Google Scholar] [CrossRef]
  3. Hannan, M.; Lipu, M.; Hussain, A.; Mohamed, A. A Review of Lithium-Ion Battery State of Charge Estimation and Management System in Electric Vehicle Applications: Challenges and Recommendations. Renew. Sustain. Energy Rev. 2017, 78, 834–854. [Google Scholar] [CrossRef]
  4. Wang, Y.; Tian, J.; Sun, Z.; Wang, L.; Xu, R.; Li, M.; Chen, Z. A Comprehensive Review of Battery Modelling and State Estimation Approaches for Advanced Battery Management Systems. Renew. Sustain. Energy Rev. 2020, 131, 110015. [Google Scholar] [CrossRef]
  5. Yang, B.; Wang, J.; Cao, P.; Zhu, T.; Shu, H.; Chen, J.; Zhang, J.; Zhu, J. Classification, Summarization and Perspectives on State-of-Charge Estimation of Lithium-Ion Batteries Used in Electric Vehicles: A Critical Comprehensive Survey. J. Energy Storage 2021, 39, 102572. [Google Scholar] [CrossRef]
  6. Fu, Y.; Zhai, B.; Shi, Z.; Liang, J.; Peng, Z. State of Charge Estimation of Lithium-Ion Batteries Based on an Adaptive Iterative Extended Kalman Filter for AUVs. Sensors 2022, 22, 9277. [Google Scholar] [CrossRef]
  7. Hossain, M.; Haque, M.E.; Arif, M.T. Online Model Parameter and State of Charge Estimation of Li-Ion Battery Using Unscented Kalman Filter Considering Effects of Temperatures and C-Rates. IEEE Trans. Energy Convers. 2022, 37, 2498–2511. [Google Scholar] [CrossRef]
  8. Liu, X.; Fan, X.; Wang, L.; Wu, J. State of Charge Estimation for Power Battery Base on Improved Particle Filter. World Electr. Veh. J. 2023, 14, 8. [Google Scholar] [CrossRef]
  9. Liu, X.; Wang, L.; Wu, J. Online Identification of Power Battery Parameters for Electric Vehicles Using a Decoupling Multiple Forgetting Factors Recursive Least Squares Method. CSEE J. Power Energy Syst. 2020, 6, 735–742. [Google Scholar]
  10. He, W.; Williard, N.; Chen, C.; Pecht, M. State of Charge Estimation for Electric Vehicle Batteries Using Unscented Kalman Filtering. Microelectron. Reliab. 2013, 53, 840–847. [Google Scholar] [CrossRef]
  11. Xia, B.; Sun, Z.; Zhang, R.; Lao, Z. A Cubature Particle Filter Algorithm to Estimate the State of the Charge of Lithium-Ion Batteries Based on a Second-Order Equivalent Circuit Model. Energies 2017, 10, 457. [Google Scholar] [CrossRef]
  12. Movassagh, K.; Raihan, A.; Balasingam, B.; Pattipati, K. A Critical Look at Coulomb Counting Approach for State of Charge Estimation in Batteries. Energies 2021, 14, 4074. [Google Scholar] [CrossRef]
  13. Gismero, E.; Schaltz, E.; Stroe, D. Recursive State of Charge and State of Health Estimation Method for Lithium-Ion Batteries Based on Coulomb Counting and Open Circuit Voltage. Energies 2020, 13, 1811. [Google Scholar] [CrossRef]
  14. Wang, X.; Gong, R.; Yang, Z.; Kang, L. State of Charge Estimation of Lithium-Ion Batteries Based on Online OCV Curve Construction. Batteries 2024, 10, 208. [Google Scholar] [CrossRef]
  15. Saji, D.; Babu, P.S.; Ilango, K. SoC Estimation of Lithium-Ion Battery Using Combined Coulomb Counting and Fuzzy Logic Method. In Proceedings of the 2019 4th International Conference on Recent Trends on Electronics, Information, Communication & Technology (RTEICT), Bangalore, India, 17–18 May 2019. [Google Scholar]
  16. Shan, C.; Chin, C.S.; Mohan, V.; Zhang, C. Review of Various Machine Learning Approaches for Predicting Parameters of Lithium-Ion Batteries in Electric Vehicles. Batteries 2024, 10, 181. [Google Scholar] [CrossRef]
  17. Dao, V.Q.; Dinh, M.-C.; Kim, C.S.; Park, M.; Doh, C.-H.; Bae, J.H.; Lee, M.-K.; Liu, J.; Bai, Z. Design of an Effective State of Charge Estimation Method for a Lithium-Ion Battery Pack Using Extended Kalman Filter and Artificial Neural Network. Energies 2021, 14, 2634. [Google Scholar] [CrossRef]
  18. Yun, J.; Choi, Y.; Lee, J.; Choi, S.; Shin, C. State-of-Charge Estimation Method for Lithium-Ion Batteries Using Extended Kalman Filter with Adaptive Battery Parameters. IEEE Access 2023, 11, 90901–90915. [Google Scholar] [CrossRef]
  19. Kung, C.-C.; Luo, S.-X.; Liu, S.-H. Implementation of the State of Charge Estimation with Adaptive Extended Kalman Filter for Lithium-Ion Batteries by Arduino. In Proceedings of the International Conference on System Science and Engineering (ICSSE), New Taipei, Taiwan, 28–30 June 2018; pp. 1–6. [Google Scholar]
  20. Nejad, S.; Gladwin, D.T.; Stone, D.A. On-Chip Implementation of Extended Kalman Filter for Adaptive Battery States Monitoring. In Proceedings of the IECON 2016—42nd Annual Conference of the IEEE Industrial Electronics Society, Florence, Italy, 24–27 October 2016; pp. 5513–5518. [Google Scholar]
  21. Hong, S.; Kang, M.; Park, H.; Kim, J.; Baek, J. Real-Time State-of-Charge Estimation Using an Embedded Board for Li-Ion Batteries. Electronics 2010, 11, 2022. [Google Scholar] [CrossRef]
  22. Ma, Y.; Duan, P.; He, P.; Zhang, F.; Chen, H. FPGA Implementation of Extended Kalman Filter for SoC Estimation of Lithium-Ion Battery in Electric Vehicle. Asian J. Control 2019, 21, 2126–2136. [Google Scholar] [CrossRef]
  23. Guo, C.; Ci, S.; Zhou, Y.; Yang, Y. A Survey of Energy Consumption Measurement in Embedded Systems. IEEE Access 2021, 9, 60516–60530. [Google Scholar] [CrossRef]
  24. Callebaut, G.; Leenders, G.; Van Mulders, J.; Ottoy, G.; De Strycker, L.; Van der Perre, L. The Art of Designing Remote IoT Devices—Technologies and Strategies for a Long Battery Life. Sensors 2021, 21, 913. [Google Scholar] [CrossRef] [PubMed]
  25. Quintero, V.; Estevez, C.; Orchard, M. State-of-Charge Estimation to Improve Energy Conservation and Extend Battery Life of Wireless Sensor Network Nodes. In Proceedings of the 2017 Ninth International Conference on Ubiquitous and Future Networks (ICUFN), Milan, Italy, 4–7 July 2017; pp. 153–158. [Google Scholar]
  26. Ali, M.U.; Zafar, A.; Nengroo, S.H.; Hussain, S.; Junaid Alvi, M.; Kim, H.-J. Towards a Smarter Battery Management System for Electric Vehicle Applications: A Critical Review of Lithium-Ion Battery State of Charge Estimation. Energies 2019, 12, 446. [Google Scholar] [CrossRef]
  27. Ciortea, F.; Rusu, C.; Nemes, M.; Gatea, C. Extended Kalman Filter for State-of-Charge Estimation in Electric Vehicles Battery Packs. In Proceedings of the 2017 International Conference on Optimization of Electrical and Electronic Equipment (OPTIM) & 2017 Intl Aegean Conference on Electrical Machines and Power Electronics (ACEMP), Brasov, Romania, 25–27 May 2017; pp. 611–616. [Google Scholar]
  28. Tulsyan, Y.; Tsai, R.B.; Gopaluni, S.; Braatz, R.D. State-of-Charge Estimation in Lithium-Ion Batteries: A Particle Filter Approach. J. Power Sources 2016, 331, 208–223. [Google Scholar] [CrossRef]
  29. Zhu, F.; Fu, J. A Novel State-of-Health Estimation for Lithium-Ion Battery via Unscented Kalman Filter and Improved Unscented Particle Filter. IEEE Sens. J. 2021, 21, 25449–25456. [Google Scholar] [CrossRef]
  30. Bian, X.; Wei, Z.; He, J.; Yan, F.; Liu, L. A Two-Step Parameter Optimization Method for Low-Order Model-Based State-of-Charge Estimation. IEEE Trans. Transp. Electrif. 2021, 7, 399–409. [Google Scholar] [CrossRef]
  31. Shrivastava, P.; Soon, T.K.; Idris, M.Y.I.B.; Mekhilef, S. Overview of Model-Based Online State-of-Charge Estimation Using Kalman Filter Family for Lithium-Ion Batteries. Renew. Sustain. Energy Rev. 2019, 113, 109233. [Google Scholar] [CrossRef]
  32. Antonucci, V.; Artale, G.; Brunaccini, G.; Caravello, G.; Cataliotti, A.; Cosentino, V.; Di Cara, D.; Ferraro, M.; Guaiana, S.; Panzavecchia, N.; et al. Li-Ion Battery Modeling and State of Charge Estimation Method Including the Hysteresis Effect. Electronics 2019, 8, 1324. [Google Scholar] [CrossRef]
  33. Wang, T.; Chen, S.; Ren, H.; Zhao, Y. Model-Based Unscented Kalman Filter Observer Design for Lithium-Ion Battery State of Charge Estimation. Int. J. Energy Res. 2017, 42, 1603–1614. [Google Scholar] [CrossRef]
  34. Barcellona, S.; Piegari, L. Lithium-Ion Battery Models and Parameter Identification Techniques. Energies 2017, 10, 2007. [Google Scholar] [CrossRef]
  35. Zhang, C.; Li, K.; Pei, L.; Zhu, C. An Integrated Approach for Real-Time Model-Based State-of-Charge Estimation of Lithium-Ion Batteries. J. Power Sources 2015, 283, 24–36. [Google Scholar] [CrossRef]
  36. He, W.; Pecht, M.; Flynn, D.; Dinmohammadi, F. A Physics-Based Electrochemical Model for Lithium-Ion Battery State-of-Charge Estimation Solved by an Optimised Projection-Based Method and Moving-Window Filtering. Energies 2018, 11, 2120. [Google Scholar] [CrossRef]
  37. Madsen, K.; Perera, D.G. Toward Composing Efficient FPGA-Based Hardware Accelerators for Physics-Based Model Predictive Control Smart Sensor for HEV Battery Cell Management. IEEE Access 2023, 11, 106141–106171. [Google Scholar] [CrossRef]
  38. Sibatov, R.T.; Svetukhin, V.V.; Kitsyuk, E.P.; Pavlov, A.A. Fractional Differential Generalization of the Single Particle Model of a Lithium-Ion Cell. Electronics 2019, 8, 650. [Google Scholar] [CrossRef]
  39. Zhang, L.; Peng, H.; Ning, Z.; Mu, Z.; Sun, C. Comparative Research on RC Equivalent Circuit Models for Lithium-Ion Batteries of Electric Vehicles. Appl. Sci. 2017, 7, 1002. [Google Scholar] [CrossRef]
  40. Madani, S.S.; Schaltz, E.; Kær, S.K. A Review of Different Electric Equivalent Circuit Models and Parameter Identification Methods of Lithium-Ion Batteries. ECS Trans. 2018, 87, 23–37. [Google Scholar] [CrossRef]
  41. Jokar, B.; Rajabloo, M.; Désilets, M.; Lacroix, M. Review of Simplified Pseudo-Two-Dimensional Models of Lithium-Ion Batteries. J. Power Sources 2016, 327, 44–55. [Google Scholar] [CrossRef]
  42. Zhang, D.; Dey, S.; Couto, L.D.; Moura, S.J. Battery Adaptive Observer for a Single-Particle Model with Intercalation-Induced Stress. IEEE Trans. Control Syst. Technol. 2020, 28, 1363–1377. [Google Scholar] [CrossRef]
  43. Ren, Z.; Du, C.; Wu, Z.; Shao, J.; Deng, W. A Comparative Study of the Influence of Different Open Circuit Voltage Tests on Model-Based State of Charge Estimation for Lithium-Ion Batteries. Int. J. Energy Res. 2021, 45, 13692–13711. [Google Scholar] [CrossRef]
  44. Noelle, D.J.; Wang, M.; Le, A.V.; Shi, Y.; Qiao, Y. Internal Resistance and Polarization Dynamics of Lithium-Ion Batteries Upon Internal Shorting. Appl. Energy 2018, 212, 796–808. [Google Scholar] [CrossRef]
  45. Xu, Y.; Hu, M.; Fu, C.; Cao, K.; Su, Z.; Yang, Z. State of Charge Estimation for Lithium-Ion Batteries Based on Temperature-Dependent Second-Order RC Model. Electronics 2019, 8, 1012. [Google Scholar] [CrossRef]
  46. Liu, X.; Li, W.; Zhou, A. PNGV Equivalent Circuit Model and SoC Estimation Algorithm for Lithium Battery Pack Adopted in AGV Vehicle. IEEE Access 2018, 6, 23639–23647. [Google Scholar] [CrossRef]
  47. Miao, H.; Chen, J.; Mao, L.; Qu, K.; Zhao, J.; Zhu, Y. A Novel Online Model Parameters Identification Method with Anti-Interference Characteristics for Lithium-Ion Batteries. Int. J. Energy Res. 2021, 45, 9502–9517. [Google Scholar] [CrossRef]
  48. Barcellona, S.; Codecasa, L.; Colnago, S.; Piegari, L. Open-Circuit Voltage Variation in LiCoO2 Battery Cycled in Different States of Charge Regions. Energies 2024, 17, 2364. [Google Scholar] [CrossRef]
  49. Zhang, W.; Wang, L.; Wang, L.; Liao, C.; Zhang, Y. Joint State-of-Charge and State-of-Available-Power Estimation Based on the Online Parameter Identification of Lithium-Ion Battery Model. IEEE Trans. Ind. Electron. 2022, 69, 3677–3688. [Google Scholar] [CrossRef]
  50. Zhang, S.; Zhang, X. A Comparative Study of Different Online Model Parameters Identification Methods for Lithium-Ion Battery. Sci. China Technol. Sci. 2021, 64, 2312–2327. [Google Scholar] [CrossRef]
  51. Yang, K.; Tang, Y.; Zhang, Z. Parameter Identification and State-of-Charge Estimation for Lithium-Ion Batteries Using Separated Time Scales and Extended Kalman Filter. Energies 2021, 14, 1054. [Google Scholar] [CrossRef]
  52. Chung, D.W.; Yang, S.H. SoC Estimation of Lithium-Ion Battery Based on Kalman Filter Algorithm for Energy Storage System in Microgrids. E3S Web Conf. 2019, 57, 6. [Google Scholar] [CrossRef]
  53. Stroe, J.; Meng, D.; Stroe, M.; Świerczyński, M.; Teodorescu, R.; Kær, S.K. Influence of Battery Parametric Uncertainties on the State-of-Charge Estimation of Lithium Titanate Oxide-Based Batteries. Energies 2018, 11, 795. [Google Scholar] [CrossRef]
  54. Meng, J. An Overview and Comparison of Online Implementable SoC Estimation Methods for Lithium-Ion Battery. IEEE Trans. Ind. Appl. 2018, 54, 1583–1591. [Google Scholar] [CrossRef]
  55. He, Z.; Yang, Z.; Cui, X.; Li, E. A Method of State-of-Charge Estimation for EV Power Lithium-Ion Battery Using a Novel Adaptive Extended Kalman Filter. IEEE Trans. Veh. Technol. 2020, 69, 14618–14630. [Google Scholar] [CrossRef]
  56. Zhang, Z.; Jiang, L.; Zhang, L.; Huang, C. State-of-Charge Estimation of Lithium-Ion Battery Pack by Using an Adaptive Extended Kalman Filter for Electric Vehicles. J. Energy Storage 2021, 37, 102457. [Google Scholar] [CrossRef]
  57. Xu, W.; Wang, S.; Jiang, C.; Fernandez, C.; Yu, C.; Fan, Y.; Cao, W. A Novel Adaptive Dual Extended Kalman Filtering Algorithm for the Li-Ion Battery State of Charge and State of Health Co-Estimation. Int. J. Energy Res. 2021, 45, 14592–14602. [Google Scholar] [CrossRef]
  58. Liu, Z.; Li, Z.; Zhang, J.; Su, L.; Ge, H. Accurate and Efficient Estimation of Lithium-Ion Battery State of Charge with Alternate Adaptive Extended Kalman Filter and Ampere-Hour Counting Methods. Energies 2019, 12, 757. [Google Scholar] [CrossRef]
  59. Ramadan, H.; Becherif, M.; Claude, F. Extended Kalman Filter for Accurate State of Charge Estimation of Lithium-Based Batteries: A Comparative Analysis. Int. J. Hydrogen Energy 2017, 42, 29033–29046. [Google Scholar] [CrossRef]
  60. Meng, J.; Stroe, D.-I.; Ricco, M.; Luo, G.; Teodorescu, R. A Simplified Model-Based State-of-Charge Estimation Approach for Lithium-Ion Battery with Dynamic Linear Model. IEEE Trans. Ind. Electron. 2019, 66, 7717–7727. [Google Scholar] [CrossRef]
  61. Abu-Sharkh, S.; Doerffel, D. Rapid Test and Non-Linear Model Characterisation of Solid-State Lithium-Ion Batteries. J. Power Sources 2004, 130, 266–274. [Google Scholar] [CrossRef]
  62. OpenEPT. Available online: https://github.com/turkmanovic/OpenEPT.git (accessed on 6 September 2024).
  63. Turkmanović, H.; Karličić, M.; Rajović, V.; Popović, I. High Performance Software Architectures for Remote High-Speed Data Acquisition. Electronics 2023, 12, 4206. [Google Scholar] [CrossRef]
  64. Pereira, R.; Couto, M.; Ribeiro, F.; Rua, R.; Cunha, J.; Fernandes, J.P.; Saraiva, J. Ranking Programming Languages by Energy Efficiency. Sci. Comput. Program. 2021, 205, 102609. [Google Scholar] [CrossRef]
Figure 1. Energy consumption blocks of battery-powered embedded system with integrated SoC estimation algorithm.
Electronics 13 04256 g001
Figure 2. Illustration of SoC values obtained with: Coulomb counter algorithm with minimal estimation period ( S o C C C ), model-based recursive algorithm with minimal estimation period ( S o C B ) and model-based recursive algorithm with an arbitrary estimation period T > T B ( S o C T ).
Electronics 13 04256 g002
Figure 3. The sequences S o C T [ i ] and S o C B [ i ] during a full battery discharge interval, for an estimation period T.
Electronics 13 04256 g003
Figure 4. nth full discharge area.
Electronics 13 04256 g004
Figure 5. A recursive SoC estimation algorithm execution over several sampling periods.
Electronics 13 04256 g005
Figure 6. (a) Open circuit voltage as a function of state of charge; (b) RMSE of polynomial approximation of open circuit voltage.
Electronics 13 04256 g006
Figure 7. Discharge current pulses (red) and battery terminal voltage (blue) used to extract Rint and the 2nd-order battery model parameters.
Electronics 13 04256 g007
Figure 8. Rint as a function of SoC.
Electronics 13 04256 g008
Figure 9. The 2nd-order RC model parameters as functions of SoC: (a)— R 0 ; (b)— R 1 and R 2 ; (c)— C 1 and C 2 .
Electronics 13 04256 g009
Figure 10. Normalized R M S E T values obtained by theory (dotted lines) and by experiment (full lines) for: (a) Kalman 0; (b) Kalman 2.
Electronics 13 04256 g010
Figure 11. Difference between RMSE obtained by experiment and by theory, for Kalman 0 (full lines) and Kalman 2 (dotted lines).
Electronics 13 04256 g011
Figure 12. Estimator performance curves obtained theoretically (dotted lines) and experimentally (full lines) for various discharge rates, for: (a) Kalman 0; (b) Kalman 2.
Electronics 13 04256 g012
Figure 13. Theoretically obtained estimator performance curves for OPT criterion, for different discharge rates for Kalman 0 (full lines) and Kalman 2 (dotted lines).
Electronics 13 04256 g013
Figure 14. Performance ratio r(T) for Kalman 0 and Kalman 2, for discharge rate C/200 and: (a) OPT optimization criterion; (b) OPTA and OPTE optimization criteria.
Electronics 13 04256 g014
Table 1. Overview of research papers which utilize SoC estimation based on EKF and electrical models.
Ref.Battery ModelParameter Identification MethodEstimation AlgorithmAnalysisImplemented on
Embedded Platform
ACE
[55]1st-order RCOnline/RLSAEKFYesNoNoNo
[56]2nd-order RCOffline/RLSAEKFYesNoNoNo
[57]1st-order RCOffline/RLSDual AEKFYesNoNoNo
[58]1st-order RCOffline/curve fittingAEKF/Ampere-HourYesYesNoNo
[59]1st-order RCOffline/RLSEKFYesNoNoYes
[19]1st-order RCOffline/RLSEKFYesNoNoYes
[20]2nd-order RCOffline/curve fittingDual EKFYesNoNoYes
[21]1st-orderOffline/curve fittingEKF/Unscented Kalman FilterYesYesNoYes
[22]1st-order RCOffline/curve fittingEKFYesYesNoYes
This paperRint/2nd order RCOffline/curve fittingEKFYesYesYesYes
Table 2. Extended Kalman filter equations.
ProcedureEquations
Predict x ^ k / k 1 = A k x ^ k 1 / k 1 + B k u k 1
P k / k 1 = A k P k 1 / k 1 A k T + Q K
Update K k = P k / k 1 H k T ( H k P k / k 1 H k T + R k ) 1
y ~ k = y k H k x ^ k / k 1
x ^ k / k = x ^ k / k 1 + K k y ~ k
P k / k = (I − K k H k ) P k / k 1
Table 3. Number of equations within one EKF iteration.
ProcedureMatrix OperationsBasic Operations
Rint Model2nd-Order RC Model
A/SMINVTa/smda/sMd
Predict12001206120
120112021180
Update141214115241
1100110330
1100110330
120012018270
61213612166871
Table 4. Microcontroller configuration.
NameSTM32H723
CPU speed400 MHz
Active mode consumption~100 mA
Low power mode consumption~1 mA
Table 5. Range of estimation periods for selected discharge rates.
Discharge ProfileRange of Estimation Period
Minimum [ms]Maximum [s]
C/52.17618,000
C/22.1767200
C2.1763600
2C2.1761800
3C2.176900
Table 6. Coefficients of 9th-order polynomial approximation of OCV function.
a 9 a 8 a 7 a 6 a 5 a 3 a 2 a 1 a 0
1172.22−5688.1711,729.04−3389.359238.411034.69−158.7113.303.23
Table 7. Average Rint over chosen SoC ranges.
[% SoC][100, 80)[80, 60)[60, 55)[55, 45)[45, 40)[40, 32.5)
R i n t [mΩ]67.4874.6163.8165.2370.1574.61
[% SoC][32.5, 25)[25, 17.5)[17.5, 10.5)[10.5, 7.5)[7.5, 3.5)[3.5, 0)
R i n t [mΩ]71.1670.6886.12100.44118.67181.69
Table 8. Average 2nd-order parameters values over chosen SoC ranges.
[% SoC][100, 80)[80, 60)[60, 55)[55, 45)[45, 40)[40, 32.5)
R 0 [mΩ]41.4640.9041.8743.0345.0247.37
R 1 [mΩ]11.1812.1310.279.689.599.49
R 2 [mΩ]14.8221.5611.6512.4715.5317.7
C 1 [F]215.70198.56233.69247.92250.34253.04
C 2 [F]2306.941608.132901.732709.372184.511906.07
[% SoC][32.5, 25)[25, 17.5)[17.5, 10.5)[10.5, 7.5)[7.5, 3.5)[3.5, 0)
R 0 [mΩ]49.5552.4656.6961.7769.9796.66
R 1 [mΩ]9.169.5411.5214.3515.1220.04
R 2 [mΩ]12.858.6717.9224.3733.5864.96
C 1 [F]261.90252.17209.74167.53159.87119.91
C 2 [F]2714.064022.562209.571385.491329.62519.20
Table 9. Values of R M S E B for Kalman 0 and Kalman 2 for different system consumption rates.
I S 3C2CCC/2C/5C/10
R M S E B K 0 [ % ] 1.771.551.350.990.940.88
R M S E B K 2 [ % ] 1.521.321.220.920.870.81
relative yield of K 2 [ % ] 14.114.89.67.17.48.0
Table 10. Extended Kalman filter single run cycle execution time.
Average Number of CPU CyclesExecution Time [uS]
Kalman 035 63689
Kalman 251 676129
Table 11. Optimal estimation periods, and RMSE and RAC values at base and optimal estimation periods, for Kalman 0 and Kalman 2, and for different discharge rates.
Kalman I S C/5C/10C/25C/50C/100C/200
Kalman 0 R M S E B [ % ] 0.8700.8100.7500.6900.6300.570
R A C T B [ % ] 3.5466.84915.52726.88042.37159.522
T 0 [ s ] 7.43514.41035.34568.159132.932256.848
R A C T 0 [ % ] 0.0010760.0011100.0011320.0011740.0012040.001246
R M S E ( T 0 ) [ % ] 0.8703140.8103170.7503290.6903330.6303470.570358
Kalman 2 R M S E B [ % ] 0.8100.7700.7000.6400.5900.530
R A C T B [ % ] 5.88211.11023.80838.45955.55371.427
T 0 [ s ] 8.58317.02041.39879.601154.694300.558
R A C T 0 [ % ] 0.0015840.0015980.0016430.0017080.0017580.001810
R M S E ( T 0 ) [ % ] 0.8104500.7704650.7004840.6404890.5905010.530526
Disclaimer/Publisher’s Note: The statements, opinions and data contained in all publications are solely those of the individual author(s) and contributor(s) and not of MDPI and/or the editor(s). MDPI and/or the editor(s) disclaim responsibility for any injury to people or property resulting from any ideas, methods, instructions or products referred to in the content.

