Article

Application of the STFT for Detection of the Rotor Unbalance of a Servo-Drive System with an Elastic Interconnection

1
Department of Electrical Machines, Drives and Measurements, Wroclaw University of Science and Technology, Wybrzeze Wyspianskiego 27, 50-370 Wroclaw, Poland
2
Institute of Robotics and Machine Intelligence, Poznań University of Technology, ul. Piotrowo 3A, 60-965 Poznań, Poland
*
Author to whom correspondence should be addressed.
Electronics 2024, 13(2), 441; https://doi.org/10.3390/electronics13020441
Submission received: 28 December 2023 / Revised: 17 January 2024 / Accepted: 19 January 2024 / Published: 21 January 2024

Abstract

:
The article focuses on the use of short-time Fourier transform (STFT) to detect the unbalance of a drive with a flexible connection between the driving machine and the load. The authors present the unbalance model and justify, through subsequent experiments, why the STFT-based approach is appropriate. The effectiveness of the presented method of analyzing signals from acceleration sensors was confirmed experimentally by designing an artificial neural network for detecting the unbalance.

1. Introduction

Unbalance is a destructive phenomenon that affects all rotating elements, including the rotors of electrical machines. The vibrations generated by the unbalanced rotor are transferred to the stator, which affects the reliability of the drive system. From an economic point of view, it is essential to monitor rotating parts for unbalance, especially precision servo drives. This paper focuses on unbalance detection in a two-mass servo system connected by a long (elastic) shaft. The unbalance was modeled by applying additional masses to the rotating disc, which was rigidly mounted to the motor shaft. During the tests, the value of the test mass and its mounting position on the disc were changed. The authors also decided to check whether the thickness of the linking shaft has an influence on the vibration level by using three shafts with different diameters. The Short Time Fourier transform (STFT) was used to analyze the data for the purpose of unbalance detection. The other important issue was the explanation of the usage of the time-frequency analysis instead of the classic Fourier transform. Additionally, the authors present a sample of artificial neural network detectors that distinguish between healthy and faulty plants as well as determine the amount of unbalance. The presented analysis is an important basis for the development and examination of various methods of classifying the problems discussed in the article.

2. Literature Overview

Electric motors are widely used in various industries. Depending on the application, the most commonly used machines are squirrel-cage induction motors and permanent magnet synchronous motors (PMSM). Apart from safety and economic considerations, reliability is one of the most important factors for the users of such drives. To reduce repair costs, it is essential to detect the initial phase of damage as soon as possible. Modern diagnostic methods make it possible to detect both electrical faults (including short-circuits of various nature, phase breaks, problems with incorrect winding connection, etc.), mechanical faults (including the most common: bearing damage, eccentricity, misalignment of the drive system, unbalanced of rotating elements, shaft deflection, etc. as well as the demagnetization associated with permanent magnet motors [1,2,3,4]. The main causes of demagnetization are high temperatures in the motor, mechanical damage to the magnet, and its naturally occurring aging. Mechanical damage to the magnet is also associated with the unbalance of the rotor.
Currently developed diagnostic systems should be able to detect damages occurring in electrical machines at the initial stage, thanks to which the maintenance will be able to plan necessary service repairs. Low-cost diagnostic systems based on cheap microprocessors, measurement cards, and available programming environments are characterized by a modular structure, which can be expanded with new functionalities in a relatively short time [5,6,7,8,9]. The basic diagnostic signals used in the process of detecting faults in electrical machines include stator current, mechanical vibrations (acceleration), and noise (acoustic wave). The effectiveness of the diagnostic process depends not only on the analyzed diagnostic signal but also on the applied method of its processing. As an example, there could be the analysis of the root mean square value (RMS) of mechanical vibrations, based on which the technical condition of the machine can be determined, but it is not possible to determine what causes its incorrect operation. [10]. Each of the analyzed signals contains symptoms of various faults. Depending on the approach, one can focus on detecting single failures or develop an algorithm to identify different failures. The [11] presents the application of fast Fourier transform (FFT) to the analysis of mechanical vibrations. On this basis, it was possible to detect cracked rotor cage bars, eccentricity, and damaged bearings of the induction machine. Another example of using a mechanical vibration signal to identify many different damages is presented in [12]. The authors discussed the possibility of using the mean, maximum, and RMS values and additionally cross factors, kurtosis, and peak values for rotor unbalance detection. Cracked induction machine rotor cage bars and the damage to the main motor bearing race were also considered. Additionally, the artificial neural network classifiers were used to distinguish between those failures. In [13], motor phase currents and vibrations were utilized to detect the failure of the stator of the PMSM. In this case, wavelet analysis of vibrations can detect as many as 15% of turns short-circuit within one phase. Mechanical vibrations are a universal diagnostic signal, as shown in [14], where this signal was also used to detect electromagnetic damage. An example of the use of vibroacoustic to detect misalignment of a drive system consisting of a motor, a cylindrical gear, and a worm gear can be found in [15].
From the diagnostics point of view, both the signal and the signal processing method are equally important. To detect the unbalance of the drive system with a PMSM, the mechanical vibration signal can be subjected to FFT, bispectrum, full-spectrum, and orbit shape analysis, as shown in [16]. The authors obtained the largest changes in the amplitudes characteristic of unbalanced symptoms from the bispectrum analysis. The research took into account the influence of test mass and rotational speed on the ability to detect the unbalance. In [17], mechanical vibrations were subjected to FFT analysis to detect the unbalance of the PMSM, on which demagnetization and dynamic eccentricity were additionally modeled. In [18], FFT analysis and a bispectrum of mechanical vibrations and stator current were used to detect the unbalance of the rotor of an induction motor powered by a frequency converter. The effectiveness of the proposed methods was confirmed on two different induction machines (different manufacturers and a number of pole pairs). The unbalance was modeled both by using an external disc to which the test masses were screwed and by mounting an additional mass directly to the rotor. The tests were carried out for different supply voltage frequencies. The stator current after the Park transformation was also discussed in [19,20]. The signal after the transformation was analyzed using the discrete wavelet transform. The effectiveness of the proposed approach was confirmed in both simulation and experimental studies conducted in non-stationary conditions. Continuous wavelet transform is discussed in [21]. The stator current was also analyzed. Positive test results were obtained in simulation tests in non-stationary conditions at low load values. In [22], an attempt was made to detect damage to blades in marine current turbines. The analysis included information obtained from both phase current sensors built into the generator and external sensors such as accelerometers, cameras, and temperature sensors. The advantages and disadvantages of the analyzed diagnostic methods are presented in numerous tables. The Hilbert transform can also be used to detect unbalance. In [23], the online detection of rotor unbalance in an induction motor is discussed. FFT analysis, Hilbert transform, envelope analysis, and discrete wavelet transform were used to search for symptoms. The stator current and mechanical vibrations were analyzed as well.
The short-time Fourier transform (STFT) is used to detect damage in dynamic states. STFT allows the detection of both the type of damage and the time of its occurrence. It is used to analyze stator current and mechanical vibrations. In [24], it was used to detect damage to the stator of a PMSM based on the stator current analysis, the stator current envelope, and the stator current spatial vector module. The authors presented the advantages of using STFT compared to classic FFT analysis. In [25], the possibility of detecting the unbalance of an induction motor rotor based on STFT analysis of the stator current Park vector was presented. The obtained results were compared to the approach based on FFT analysis of the stator current. The use of STFT to detect mechanical damage, such as friction of the blades against the stator in turbochargers, based on the vibration signal during startup and coasting of a rotating machine, is presented in [26]. The authors demonstrated the superiority of the proposed method over the traditional method based on FFT analysis. In [27], STFT analysis of the noise of an undamaged motor and the motor with unbalance, misalignment, and damaged bearing were used to precisely determine the time of failure. In [28], the use of variable—window STFT was proposed to detect winding faults in a PMSM. The stator current signal was used in the tests. A convolutional neural network was used to automate the detection process. The proposed approach was validated using a simulation data set and reference data sets with damaged bearings for various rotational speeds. In [29] STFT analysis, continuous wavelet transform (CWT) and Hilbert-Huang transform were used to identify the damage based on the analysis of the start-up process vibrations. The article analyzes the proposed methods in terms of the lowest possible level of induced error and the time needed for calculations to detect shaft misalignment and damage resulting from rotor-stator friction. The [30] presents comparative studies of various time-frequency analyses of mechanical vibrations, including STFT, for detecting damage to an induction motor during start-up. The authors focused on detecting the damage to the rotor cage, unbalance, and bearing damage during engine startup and demonstrated the superiority of time-frequency spectral analysis of mechanical vibrations over current analysis. In the paper [31], an efficient deep learning (DL) algorithm model was developed for rotating shaft unbalance detection for both binary and multi-class identification. A Convolutional Neural Network (CNN) was also implemented to determine feature extraction. Accelerometer data collected by a vibration sensor was used to train the algorithm. This time series data was preprocessed to extract important vibration features using the FFT and the STFT. The advantage of the STFT method over the FFT method was also demonstrated. In [32], the input data was first pre-processed using STFT. Then, a model was developed for classifying the system state based on multi-output classification using CNN. The proposed model was evaluated based on its performance and robustness in classifying complex faults, including the variation of various shaft unbalance features. The paper [33] presents so-called predictive maintenance using vibration sensors and predicting various faults. A mathematical model of the system was developed, and the research was verified experimentally. Among other things, the focus was on shaft unbalance, which is one of the main faults found in any rotating system, leading to excessive vibrations that directly or indirectly lead to premature failure of the device in question. A predictive model has been developed using CNN, which is used to predict time series data of industrial turbine rotor unbalance with monthly prediction in a real-time setting.
The unbalance, in the available literature, is modeled in various types of electrical machines. Modeled unbalance was detected both in induction motors [18,23,25,27,30] and PMSM [16,17,19,20,21], in marine current turbines [22], or in the commutator motor of a hammer drill or blender [34]. The analysis of the literature shows that the problem of unbalance applies to every rotating machine. Therefore, in this work, the authors focused on detecting the unbalance of a two-mass system with a long shaft consisting of two brushless alternating current (AC) servomotors (PMSM). The vibration acceleration signal was subjected to STFT analysis. It was analyzed how the amount of the installed test mass and the place of its installation influences the level of generated vibrations. Moreover, the effect of the diameter of the long shaft on the ability to detect the unbalance was examined. The authors show why, despite performing tests in a steady state, a signal processing method that is dedicated to transient analysis should be used.
As discussed above, rotor unbalance is the most common source of vibration in machines with rotating parts, especially servo drives. On the other hand, detecting rotor unbalance and determining the level of rotor unbalance, which is the aim of this article, further leads to the application of various methods of rotor balancing. The aim of rotor balancing is to prevent excessive bearing load and fatigue damage, thereby increasing the life of the system in question. In a recent paper [35], an extensive literature review of different rotor balancing methods was carried out. Traditional methods, including the influence coefficient method (ICM) [35,36] and the modal balancing method (MBM) [35,36], are presented, and the research progress, stages of operation, and advantages and disadvantages of these methods are discussed. Rotor balancing methods are presented in relation to flexible joints that may be unstable at critical speeds. Paper [36] presents an application note on rotor balancing in static and dynamic processes of mobile equipment. On the other hand, the paper [37] presents the problem of uncertain transients of a rotor system and its balancing in a transient process with acceleration, in addition to a wide review of the literature on balancing methods. The multi-dimensional ellipsoid model (MEM) method used there is used to describe the uncertainties, while the Monte Carlo Simulation (MCS) and Chebyshev interval algorithm (CIA) are introduced to obtain the transient uncertain responses of the rotor system, respectively.

3. The Unbalance Model

The unbalance of rotating elements is encountered every day. This phenomenon occurs not only in the rotors of electrical machines but also applies to shafts, clutches, car wheels, or during uneven distribution of laundry in a washing machine. Unbalance occurs when a rotor with uneven mass distribution relative to the rotation axis is put into rotation. When unbalance occurs, unbalanced centrifugal forces and moments act on the bearings, which cause an increase in the level of mechanical vibrations and noise [38]. Figure 1 shows a graphical interpretation of the unbalance, which is described in the form of an additional mass m mounted at an angle α at a distance R from the rotation axis O. The introduction of the additional mass causes the center of gravity of the rotating element to shift from point O to point O1 by a vector e , called the eccentricity of the center of gravity [39]. Therefore, the unbalance is defined as the product of the unbalance mass m and the vector R on which it is placed [39]:
N ¯ = m R .
When the unbalanced element is put into rotation at a speed ω, the additional mass m causes a centrifugal force F [39,40]:
F = m R ω 2 .
According to Equation (2), the unbalanced changes linearly with the change in the unbalance mass and its support relative to the axis of rotation and with the square of the angular velocity ω.
The unbalance of electrical machines can be detected when the rotor starts to rotate. The resulting unbalanced centrifugal force acts on the machine’s body, causing it to vibrate. Since, according to Equation (2), the unbalance depends on the angular velocity ω, an increase in the amplitude of the rotational frequency is observed in the spectrum of mechanical vibration [41]:
f r u = f r = n 60 = ω 2 π ,
where fru (Hz) is the fault frequency related to the rotor unbalance, fr (Hz) is the rotating frequency of the shaft, and n is the rotational speed (rpm).

4. Two-Mass System with Flexible Joint

The two-mass system is well known in literature [42,43,44,45,46,47,48,49] as a model of basic interconnection between motor and load, and numerous speed and position control algorithms have been developed over time [47,50,51,52,53]. The main problems caused by this type of object are resonances and antiresonances that occur at specified frequencies [53]. The Formulas (4) and (5) describe the natural resonant and antiresonant pulsations of the undamped system (the most common two-mass systems have very low damping) presented in Figure 2. Other symbols mean: TT is the torsional torque, k is the stiffness factor of the shaft, ω1 and ω2 are the motor and load side speeds, and θ1 and θ2 describe the position of the motor and load side. The resonance causes both masses J1 and J2 and the shaft to go into very strong vibrations; on the other hand, the antiresonance causes the propelled mass J1 to achieve very low speed, and strong vibrations occur between the shaft and the load mass J2.
ω r = k J 1 + J 2 J 1 J 2 ,
ω a = k J 2 .
Depending on the control strategy and design requirements, the resonance and antiresonance vibrations can be actively damped by the control system, or filters can be applied to prevent the control system from inducing the vibrations. Regardless of the reason for the oscillations, the occurrence of the vibrations leads to oscillations in the speed signal and, therefore, modulates the centrifugal force (2).

5. STFT Transformation

The Fourier transform assumes that the signal being analyzed is periodic and stationary. The analyzed signal is then decomposed into a specific number of sinusoidal signals with a specific frequency. Unfortunately, in most cases, signals measured on real objects do not meet these basic requirements. The transition from the time domain to the frequency domain results in obtaining information about the frequency of a given component, but knowledge about the moment of its appearance is lost. Therefore, the signal subjected to such analysis should be stationary due to the loss of time information. In other words, the spectrum from the Fourier Transform can be interpreted as the average value of spectral components in a given signal. These disadvantages are not present in the short-time Fourier transform, which is used to analyze non-stationary time-varying signals. STFT allows the detection of the frequencies present in the measured signal and determines the time of changes that may occur in it. There is some trade-off between time and frequency when configuring STFT. This compromise is achieved by appropriately positioning and choosing the type of the windowing function. A long window allows for high resolution in the frequency domain at the expense of lower resolution in the time domain. In the case of a short window, the nature of the obtained resolutions is the opposite. The use of STFT to analyze the signal x(t) is based on shifting the windowing function w(t) along the time axis by the value τ and decomposing the obtained signal parts into a complex form using the Fourier transform, which contains information about the phase and amplitude of the signal in time and frequency domain. The continuous STFT is described by [24,54,55] (6):
S T F T C τ , ω = x t w t τ e j ω t d t .
When performing measurements with a constant sampling frequency, the obtained signal is discrete; therefore, STFT can be written as [24,55] (7):
S T F T C τ , ω S T F T D m , k = n = 0 n = N 1 x n w n m H e j 2 π n k N ,
where: N is the number of samples (points) of FFT, n is the index of input sample in the time domain that depends on the length of the windowing function, x[n] is the input signal, w[n] is the windowing function, m is the position of windowing function, H is the overlapping between successive windows, and k is the frequency index. The time resolution of STFT depends on H, and it is described by the formula H/fs, where fs is a sampling frequency.
The result of the STFT operation may be a three-dimensional energy graph (spectrogram), which is the result of combining spectra of the windowed signal shifted in time [24] (8):
spectrogram τ , ω = S T F T τ , ω 2 .

6. Laboratory Bench and Research Methodology

6.1. Laboratory Stand Description

The bench consists of two brushless AC servomotors from UNIMOTOR with a rated power of 3 kW and a rated speed of 3000 rpms. The motors are interconnected via a long, replaceable metal shaft. On the motor side, a disc was mounted to which a test mass was screwed every 60 degrees on a radius of 42 mm. The metal frame of the test laboratory stand (with the motors attached) was placed on a concrete foundation, which was intended to eliminate vibrations in the drive system. The analyzed signal is mechanical vibrations measured by a three-axis accelerometer (type 4506 from Brüel and Kjær) mounted on the bench frame near the propelling machine. Signals from sensors are collected with a NI 9234 card from National Instruments with a sampling frequency of 12.8 kS/s. Figure 3 shows a photo of the laboratory stand of the drive system with a spring connection enabling modeling of unbalance.
The rotor unbalance was modeled using four test masses: 7.5 g, 15.9 g, 24 g, and 45 g. The tests were carried out at a constant angular velocity of 60 rad/s. The drive system operated without active load torque on the load side. As part of the research, four series of measurements were carried out, in which the impact of unbalance on the operation of the motor itself and the impact of unbalance, and the diameter of the shaft connecting the engine with the working machine on the operation of the entire drive system were examined. During the tests, three shafts with diameters of 6 mm, 8 mm, and 16 mm were used. The control structure is presented in Figure 4. There are two control loops: the current control loop and the speed control loop, based on the active disturbance rejection control (ADRC) [47]. The parameters of the control loop were constant during all the tests. The control strategy was implemented in Analog Devices SHARC DSP 26369. The PMSM was powered by a laboratory 3-phase inverter.

6.2. The Effect of the Laboratory Bench Frame Resonance—Frequency Analysis Limit

As part of the identification of the laboratory stand, the system’s response to mechanical impact stimulation was checked. For this purpose, a series of 9 impulse shocks of similar amplitude were performed during 20 s, and the acceleration was recorded in the three directions indicated in Figure 3. The measured signals were subjected to STFT analysis, and the results are presented in Figure 5.
According to Figure 5, the bench is characterized by different vibration spectra in each direction. In the radial direction (Figure 5)—the “x” axis of vibration measurement (direction of impact), the lowest resonance frequency occurs at approximately 500 Hz. Moreover, an increase in vibrations is observed at approximately 300 Hz. In the tangential direction (“y” axis of vibration measurement), resonance occurs at a frequency of approximately 340 Hz, while in the axial direction (“z” axis of vibration measurement), the response to excitation occurs at approximately 440 Hz, with the highest resonance occurring at approximately 800 Hz. The drawing also shows a close-up of the low-frequency band for vibrations measured in the “y” axis. The close-up shows vibrations occurring at approximately 60 Hz and in the vicinity of the constant component. Due to the occurrence of unbalance symptoms already in the low-frequency band and the appearance of resonance at a frequency of approximately 80Hz (Figure 5, “y” axis), the spectrograms presented later in the article have been limited to the 4–45 Hz band. Limiting the presented bandwidth does not affect the ability to detect unbalance and only improves the readability of the presented results.

6.3. Laboratory Bench Identification—Comparative Analysis of Thin Shaft Influence on the Laboratory Stand Properties

Every real object is characterized by vibrations during operation. These vibrations may come from the motor itself, the working machine, or the drive system, which, in this case, is a long shaft. These oscillations should be identified before detecting irregularities occurring in the tested drive system. Figure 6 shows spectrograms of mechanical vibrations measured in three axes, both of the tested motor itself and the complete drive system with the 6 mm shaft. The table shows that due to the good attachment of the station to the concrete foundation, vibrations in the “x” axis have a very low value (approximately two orders less than vibrations in the “y” and “z” axes). In the case of vibrations generated by the motor itself, the rotational frequency fr of approximately 9.6 Hz, and its first (for vibrations measured in the “y” and “z” axes) and second multiples (only for vibrations measured in the “y” axis) are clearly visible in the “y” and “z” axes. Coupling the engine with a long, thin shaft with the working machine resulted in a significant increase in the fourth multiple of the rotational frequency in the “y” axis, the amplitude of which is approximately half of the amplitude of the rotational frequency. In the case of the “z” axis, a slight increase in the amplitude of the 4fr frequency is observed.
Despite the drive system operating at a constant rotational speed, the amplitudes of rotational frequencies presented on spectrographs are oscillatory. The oscillatory nature of the vibrations results from the operation of the control system, which constantly tries to compensate for defects occurring in the actual drive system. It is worth mentioning that the measurements were carried out with the drive operating in a cascaded closed speed control loop with an ADRC controller [47] and proportional-integral (PI) d–q axis current controller [56]. Confirmation of this thesis will be presented later in the article. Due to the lack of stationarity of the measured signals, the use of the STFT transform to examine the unbalanced state of the tested system is, according to the authors, the correct approach.
The rest of the article will discuss only selected results showing the influence of unbalance and the thickness of the shaft used on vibrations measured in the “y” axis. The authors chose the “y” axis due to the high level of vibrations occurring in this direction; however, it must be noted that the vibration along the “y” axis could be caused not only by unbalance but also by misalignment. This seems to be the right approach, considering the disruptions that may occur in industrial settings.

6.4. The Influence of Additional Test Mas Mounting Angle on the Vibration Level

Every rotating machine, even newly purchased, has a slight unbalance. Figure 7 shows the impact of installing a test mass of 45 g on the vibration level (in the “y” axis) of a two-mass system connected by a thin shaft. The tests were carried out for a steady state of 10 s. The position of the test mass was changed every 60°, starting at an angle of 60°.
The results shown in Figure 7 show that changing the angle on the circumference of the disk of the mounted test mass clearly affects the amplitude of the rotational frequency fr. The biggest vibrations are observed for angles of 60° and 120°. The lowest vibration level occurs at an angle of 240°. Figure 7 shows that for an angle of 240°, there is a loss of mass, i.e., the additional mass introduced balances the tested dual-mass system. Moreover, the introduced test mass affects the change in the amplitude of the 4fr frequency, which may indicate, for example, a deepening level of misalignment of the drive system. This problem was not examined in detail at the laboratory research stage because it required the use of specialized research equipment (i.e., a laser alignment system). The tests also showed that the amplitude of the characteristic rotational frequency-related unbalance is pulsating, which once again confirms the validity of using STFT analysis to study the unbalance of a two-mass system with an elastic connection.
Due to the observed greatest influence of the test mass on the generated vibrations of the dual-mass system, the subsequent tests presented in the article were carried out for the test mass mounted at an angle of 60°.

6.5. The Influence of Additional Test Mas on the Vibration Level

Another problem analyzed in the article was the influence of the value of the test mass mounted at an angle of 60° on the generated vibrations. A long, thin shaft was used for testing. Vibrations in the “y” axis were recorded for 10 s. Four test masses were used for testing. The results of the STFT analysis are shown in Figure 8.
The results presented in Figure 8 show that the introduction of additional test mass causes an increase in the amplitude of the rotational frequency fr. For a test mass of 45 g, an approximately three-times increase in the amplitude is observed compared to the balanced system. The observed vibrations again have an oscillatory character. Additionally, an increase in the amplitude of the 4fr frequency is observed, which may indicate the influence of the additional mass on the misalignment of the dual-mass system.

6.6. The Influence of the Shaft Diameter on the Vibration Level

The last analyzed factor that may affect the generated vibrations of the dual-mass system is the diameter of the long shaft used for linking the motor and load side. As part of the research, three available laboratory shafts with diameters of 6 mm, 8 mm, and 16 mm were used. A balanced system was used for the tests, with additional test masses of 24 g and 45 g mounted at an angle of 60°. The vibrations were recorded for 10 s in a steady state. The results obtained from the STFT analysis are presented in Figure 9.
Figure 9 shows that increasing the shaft diameter does not affect the value of the amplitude of the rotational frequency fr. Only for the thickest shaft (16 mm) is the occurrence of 4fr frequency observed. The introduction of additional test masses of 24 g and 45 g into the system, mounted at an angle of 60°, resulted in an increase in the amplitude of the rotational frequency fr. For a test mass of 45 g, an approximately 2–3 times increase in the amplitude of characteristic frequency for unbalance is observed. The introduction of the test mass resulted in a significant increase in the amplitude of the 4fr frequency of the dual-mass system connected by the thinnest shaft. In the case of a shaft with a diameter of 6 mm, a slight increase in the amplitude of the 4fr frequency is observed, while for the thickest shaft, the amplitude decreased. The comparison shows that the thicker the shaft connecting both machines, the smaller the impact of the introduced test mass on the 4fr frequency amplitude. The shaft diameter does not affect the oscillatory nature of changes in the rotational frequency amplitude.

6.7. The Issues Related to Two-Mass System

The results presented in previous subsections showed that despite the analysis being performed based on the steady state of the drive, the amplitude of the rotational frequency fr has an oscillatory character. Figure 10 shows an explanation of the problem.
The comparison presented in Figure 10 shows that the amplitude of the rotational frequency of the engine itself is quasi-static. The introduction of a long shaft deepens the oscillations in the fr frequency amplitude, which are further amplified by the introduction of additional unbalance. The explanation can be found in the q-axis current. The current iq of the motor itself is characterized by a very small, time-invariant amplitude of the frequency fr. The introduction of a long shaft is an additional disturbance to which the control system responds. Additional tests showed that the shafts used are not perfectly straight, which additionally results in increased vibrations of the rotational frequency and its multiples. The control system tries to compensate for the introduced disturbances by modulating the iq current. The current modulated in this way affects the operation of the two-mass system and the vibrations it generates, which are no longer stationary.

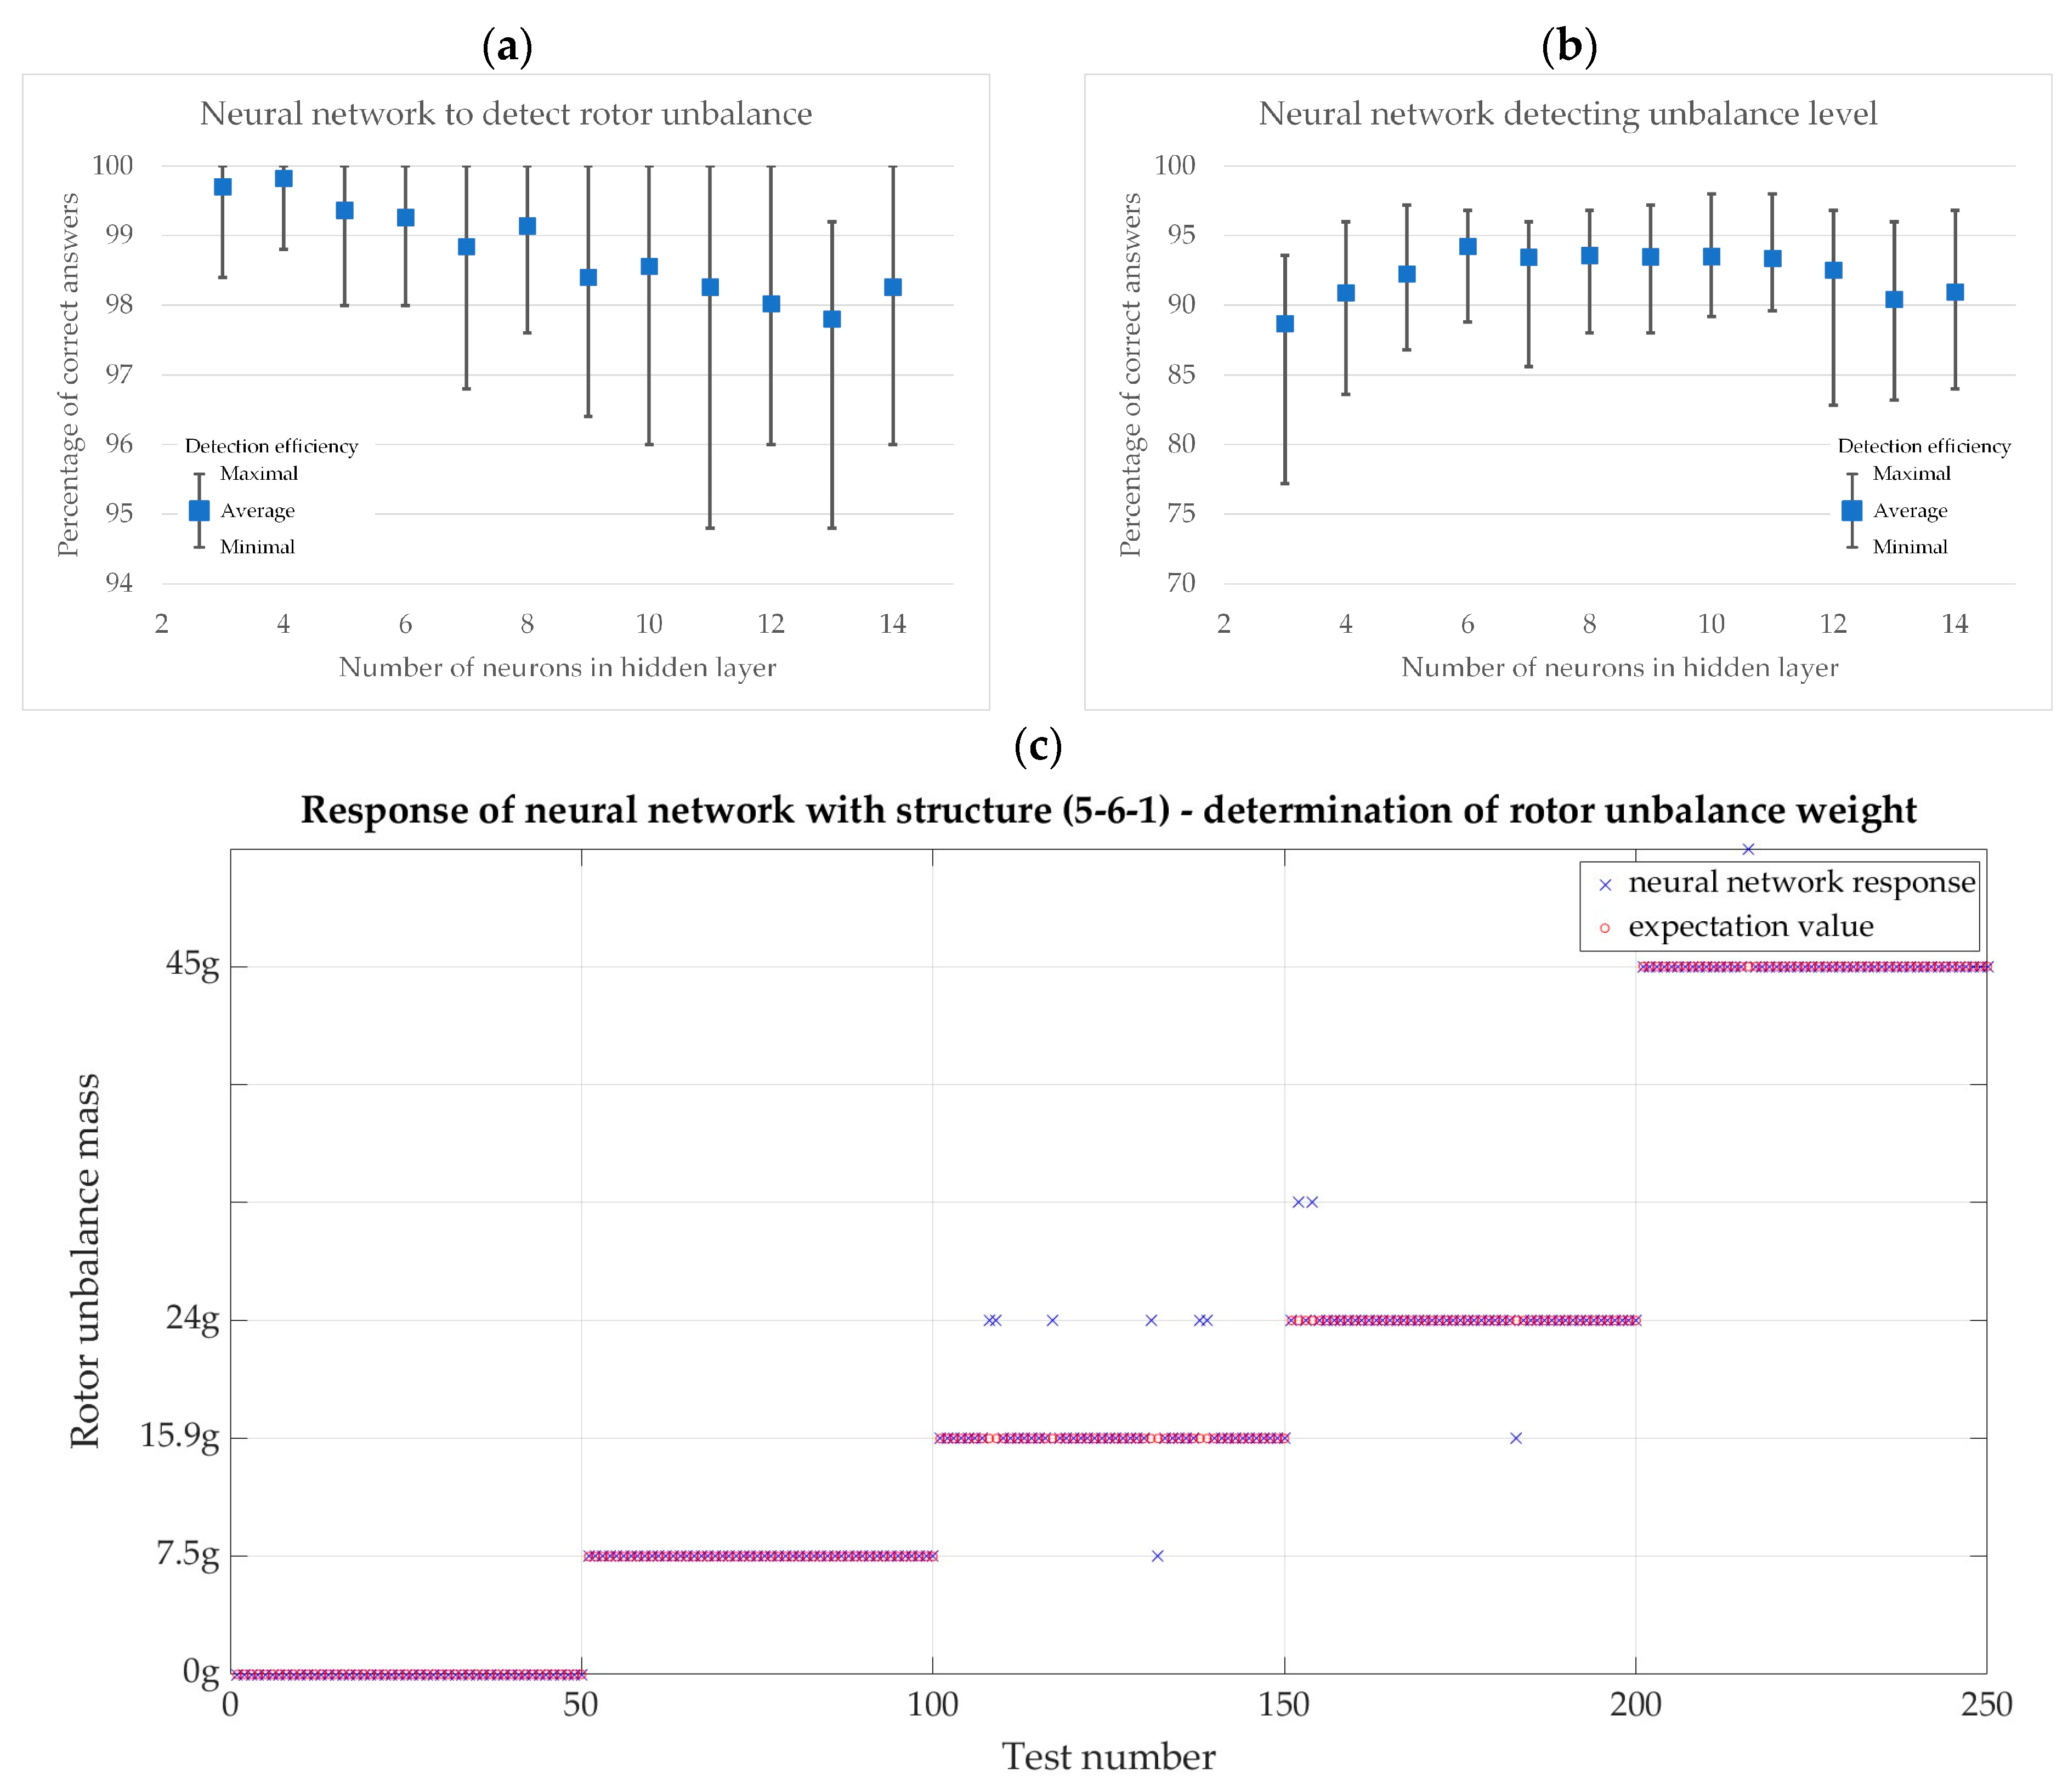
7. Neural Detector of Rotor Unbalance

To automate the process of detecting and determining the level of rotor unbalance, unidirectional multilayer neural networks, referred to in the literature as multilayer perceptrons (MLPs), were used. The MLP neural networks proposed in the article (Figure 11) contain interconnected neurons arranged in layers (input and output, as well as a hidden layer that has no direct connection to external signals). In addition, there are no connections between neurons of the same layer [57,58]. The activation functions of the input and output neurons are linear, while the hidden layer uses a hyperbolic tangent. The output signal of an individual neuron is expressed by the equation:
y i = f i = 1 N w i j x i t + w 0 j ,
f u = t g h β u ,
where: f is the sample activation function, wij is the weighting coefficients, xi is the input signals, β is the coefficient correcting the shape of the activation function, u is the argument of the activation function, and w0j is the bias value.
The values of the weighting connection coefficients were selected using the Levenberg-Marquardt algorithm.
Based on the laboratory tests conducted, the symptoms given to the inputs of the neural networks were prepared accordingly. The algorithm for processing measurement data is presented in Figure 12.
The study of neural detectors was realized in the Matlab R2023a—Simulink environment. As input signals, an averaged value within +/−5% of the kfr frequency width calculated from the current speed value was given. In addition, the input vector was expanded to include the speed value to account for varying operating conditions. The input data was normalized to the range <0, 1>. The learning and testing vectors consisted of 250 elements. All parameters considering the method of obtaining input data and the process of learning neural networks are summarized in Table 1.
Two neural detectors were prepared based on selected measurement data (vibrations measured in the Y-axis, a shaft of 6 mm diameter used, a test mass mounted at an angle of 60°). The task of the first detector was to tell whether the rotor was unbalanced or not, while the second one determined the level of unbalance. To average the results of the effectiveness of detecting unbalance and determining the level of the tested neural detector structures, 20 consecutive training and testing runs were performed. The results obtained for the change of neurons in one hidden layer are summarized graphically in Figure 13a,b, while an example of the performance of a detector with a structure (5-6-1) determining the mass of rotor unbalance is shown in Figure 13c. The detector made 11 mistakes (detection efficiency is 95.6%), and all of them concerned the determination of the unbalance mass.
The summary shows that detectors with a small number of neurons in only one hidden layer can detect rotor unbalance with an average efficiency of over 97% correct indications (Figure 13a) and with an efficiency of over 88% determine its level (Figure 13b). The highest average of the 20 training and testing runs for rotor unbalance detection efficiency was obtained for a network with a (5-4-1) structure. The average detection efficiency was about 99.8%, with a minimum of about 98.8% correct indications. The highest average unbalance determination efficiency of about 94% with a minimum of about 88% was obtained for a network with a structure (5-6-1).

8. Conclusions

The article presents the influence of the elastic connection and additional test mass on the vibrations generated by the two-mass system of a PMSM electric drive. The research presented in the article shows that the tested changes are non-stationary and require the use of appropriate signal-processing methods. The STFT analysis used is ideal for analyzing the vibrations of the tested two-mass system. A detailed analysis showed that an increase in the test mass causes an increase in the amplitude of the rotational frequency fr, for the analyzed electric drive. The angle at which the additional test mass is mounted also causes a change in the amplitude of the characteristic frequency. The use of the test method (Figure 7) will make it possible to find the local minimum of the generated vibrations, which should, in consequence, allow for balancing the tested two-mass system. Changing the shaft diameter has no significant impact on the ability to detect drive system unbalance. The results presented in the article confirm the usefulness of STFT for detecting the unbalance of a dual-mass system connected by a long shaft in the control system of a precision drive with a PMSM. The developed neural detectors are characterized by high performance in both detecting rotor unbalance and determining unbalance mass despite their simplicity. All in all, the STFT approach made it possible to use a simple structure of an artificial neural network to detect the rotor unbalance and determine the amount of it. The presented method of drive system diagnostics in the context of unbalance detection can be used in modern and developing industries that require a continuous and automated process of device supervision. The simplicity of the solution makes it possible to implement the developed method in easily available, low-budget microcontrollers (e.g., the Cortex-M Arm series), often based on existing measurement infrastructure [9].
For the purposes of this article, the object is assumed to be stationary, which implies the assumption that the machine’s unbalance will not change during system operation. In such a situation, the STFT does not have to be calculated in a time similar to the control system calculation step, which makes it possible to use low-budget computational units. However, there are propulsion systems in which the speed of unbalance detection may be important and in which unbalance may appear suddenly (e.g., in the case of unmanned aircraft drives). In this case, units with high computing power should be used—e.g., dedicated signal processors. A separate issue that must be faced in the practical implementation of the unbalance detection algorithm are disturbances in the measurement paths and unidentified sources of vibrations that are not related to the unbalance itself but generate accelerations with amplitudes that are comparable to or even exceeding those resulting from the unbalance itself. This problem was described in Section 6.2 of the article, where significant amplitude vibrations were observed, the source of which were resonances of the test stand frame. The problem was solved by using an appropriate low-pass filter.

Author Contributions

Conceptualization, P.E., B.W. and T.P.; methodology, P.E. and B.W.; software, P.E. and B.W.; validation, P.E., B.W. and T.P.; formal analysis, P.E., B.W. and T.P.; investigation, P.E. and B.W.; resources, P.E., B.W. and T.P.; data curation, P.E. and B.W.; writing—original draft preparation, P.E. and B.W.; writing—review and editing, P.E., B.W. and T.P.; visualization, P.E. and B.W.; supervision, T.P.; project administration, P.E., B.W. and T.P.; funding acquisition, P.E. All authors have read and agreed to the published version of the manuscript.

Funding

This research received no external funding. Publication is exempt from APC.

Data Availability Statement

Data are contained within the article.

Conflicts of Interest

The authors declare no conflicts of interest.

References

  1. Wang, Z.; Yang, J.; Ye, H.; Zhou, W. A review of Permanent Magnet Synchronous Motor fault diagnosis. In Proceedings of the 2014 IEEE Conference and Expo Transportation Electrification Asia-Pacific (ITEC Asia-Pacific), Beijing, China, 31 August 2014–3 September 2014; pp. 1–5. [Google Scholar] [CrossRef]
  2. Krichen, M.; Ben hadj, N.; Chaeib, M.; Neji, R. Fault Detection and Diagnosis Methods in Permanent Magnet Synchronous Machines: A Review. In Proceedings of the International Conference on Recent Advances in Electrical Systems, Hammamet, Tunisia, 22–24 December 2017; pp. 229–237. [Google Scholar]
  3. Chen, Y.; Liang, S.; Li, W.; Liang, H.; Wang, C. Faults and Diagnosis Methods of Permanent Magnet Synchronous Motors: A Review. Appl. Sci. 2019, 9, 2116. [Google Scholar] [CrossRef]
  4. Orlowska-Kowalska, T.; Wolkiewicz, M.; Pietrzak, P.; Skowron, M.; Ewert, P.; Tarchala, G.; Kowalski, C.T. Fault Diagnosis and Fault-Tolerant Control of PMSM Drives–State of the Art and Future Challenges. IEEE Access 2022, 10, 59979–60024. [Google Scholar] [CrossRef]
  5. Boudiaf, M.; Cherroun, L.; Benbrika, M. Real-time diagnosis of three-phase induction machine using Arduino-Uno card based on park’s circle method. Diagnostyka 2018, 19, 63–71. [Google Scholar] [CrossRef]
  6. Huang, S.-R.; Huang, K.-H.; Chao, K.-H.; Chiang, W.-T. Fault analysis and diagnosis system for induction motors. Comput. Electr. Eng. 2016, 54, 195–209. [Google Scholar] [CrossRef]
  7. Lee, J.-H.; Pack, J.-H.; Lee, I.-S. Fault Diagnosis of Induction Motor Using Convolutional Neural Network. Appl. Sci. 2019, 9, 2950. [Google Scholar] [CrossRef]
  8. Wolkiewicz, M.; Skowron, M. Diagnostic System for Induction Motor Stator Winding Faults Based on Axial Flux. Power Electron. Drives 2017, 2, 137–150. [Google Scholar] [CrossRef]
  9. Ewert, P.; Kowalski, C.T.; Orlowska-Kowalska, T. Low-Cost Monitoring and Diagnosis System for Rolling Bearing Faults of the Induction Motor Based on Neural Network Approach. Electronics 2020, 9, 1334. [Google Scholar] [CrossRef]
  10. ISO 20816-3:2022; Measurement and Evaluation of Machine Vibration—Part 3: Industrial Machinery with a Power Rating above 15 kW and Operating Speeds between 120 r/min and 30 000 r/min. Measurement and Evaluation of Mechanical Vibration and Shock as Applied to Machines, Vehicles and Structures. OCT: Geneva, Switzerland, 2022.
  11. Faiz, J.; Takbash, A.M.; Mazaheri-Tehrani, E. A Review of Application of Signal Processing Techniques for Fault Diagnosis of Induction Motors—Part I. AUT J. Electr. Eng. 2017, 49, 109–122. [Google Scholar] [CrossRef]
  12. Ribeiro Junior, R.F.; De Almeida, F.A.; Gomes, G.F. Fault classification in three-phase motors based on vibration signal analysis and artificial neural networks. Neural Comput. Appl. 2020, 32, 15171–15189. [Google Scholar] [CrossRef]
  13. Liang, H.; Chen, Y.; Liang, S.; Wang, C. Fault Detection of Stator Inter-Turn Short-Circuit in PMSM on Stator Current and Vibration Signal. Appl. Sci. 2018, 8, 1677. [Google Scholar] [CrossRef]
  14. Lipus, J.; Jankovych, R.; Hammer, M.; Lipus, T. Vibration and related diagnostics of motors and generators. MM Sci. J. 2016, 2016, 1639–1642. [Google Scholar] [CrossRef]
  15. Pawlik, P.; Lepiarczyk, D.; Dudek, R.; Ottewill, J.R.; Rzeszuciński, P.; Wojcik, M.; Tkaczyk, A. Vibroacoustic study of powertrains operated in changing conditions by means of order tracking analysis. Eksploat. Niezawodn.—Maint. Reliab. 2016, 18, 606–612. [Google Scholar] [CrossRef]
  16. Ewert, P.; Kowalski, C.T.; Jaworski, M. Comparison of the Effectiveness of Selected Vibration Signal Analysis Methods in the Rotor Unbalance Detection of PMSM Drive System. Electronics 2022, 11, 1748. [Google Scholar] [CrossRef]
  17. Rafaq, M.S.; Lee, H.; Park, Y.; Lee, S.B.; Fernandez, D.; Diaz-Reigosa, D.; Briz, F. A Simple Method for Identifying Mass Unbalance Using Vibration Measurement in Permanent Magnet Synchronous Motors. IEEE Trans. Ind. Electron. 2022, 69, 6441–6444. [Google Scholar] [CrossRef]
  18. Ewert, P. The Application of the Bispectrum Analysis to Detect the Rotor Unbalance of the Induction Motor Supplied by the Mains and Frequency Converter. Energies 2020, 13, 3009. [Google Scholar] [CrossRef]
  19. Zhang, J.; Hang, J.; Cheng, M. Diagnosis of Mechanical Unbalance Fault in Permanent Magnet Synchronous Machine Drives. Electr. Power Compon. Syst. 2016, 44, 1408–1417. [Google Scholar] [CrossRef]
  20. Hang, J.; Zhang, J.; Cheng, M.; Wang, Z. Fault Diagnosis of Mechanical Unbalance for Permanent Magnet Synchronous motor Drive System under Nonstationary Condition. In Proceedings of the 2013 IEEE Energy Conversion Congress and Exposition, Denver, CO, USA, 15–19 September 2013; pp. 3556–3562. [Google Scholar] [CrossRef]
  21. Park, C.H.; Lee, J.; Ahn, G.; Youn, M.; Youn, B.D. Fault Detection of PMSM under Non-Stationary Conditions Based on Wavelet Transformation Combined with Distance Approach. In Proceedings of the 2019 IEEE 12th International Symposium on Diagnostics for Electrical Machines, Power Electronics and Drives (SDEMPED), Toulouse, France, 27–30 August 2019; pp. 88–93. [Google Scholar] [CrossRef]
  22. Xie, T.; Wang, T.; He, Q.; Diallo, D.; Claramunt, C. A review of current issues of marine current turbine blade fault detection. Ocean Eng. 2020, 218, 108194. [Google Scholar] [CrossRef]
  23. Rahman, M.M.; Uddin, M.N. Online Unbalanced Rotor Fault Detection of an IM Drive Based on Both Time and Frequency Domain Analyses. IEEE Trans. Ind. Appl. 2017, 53, 4087–4096. [Google Scholar] [CrossRef]
  24. Pietrzak, P.; Wolkiewicz, M. Stator Winding Fault Detection of Permanent Magnet Synchronous Motors Based on the Short-Time Fourier Transform. Power Electron. Drives 2022, 7, 112–133. [Google Scholar] [CrossRef]
  25. Bouras, A.; Bouras, S.; Kerfali, S. Prediction of the mass unbalance of a variable speed induction motor by stator current multiple approaches. Turk. J. Electr. Eng. Comput. Sci. 2018, 26, 1056–1068. [Google Scholar] [CrossRef]
  26. Al-Badour, F.; Cheded, L.; Sunar, M. Non-stationary vibration signal analysis of rotating machinery via time-frequency and wavelet techniques. In Proceedings of the 10th International Conference on Information Science, Signal Processing and Their Applications (ISSPA 2010), Kuala Lumpur, Malaysia, 10–13 May 2010; pp. 21–24. [Google Scholar] [CrossRef]
  27. Atmaja, B.T.; Arifianto, D. Machinery fault diagnosis using independent component analysis (ICA) and Instantaneous Frequency (IF). In Proceedings of the International Conference on Instrumentation, Communication, Information Technology, and Biomedical Engineering 2009, Bandung, Indonesia, 23–25 November 2009; pp. 1–5. [Google Scholar] [CrossRef]
  28. Mohammad-Alikhani, A.; Pradhan, S.; Dhale, S.; Mobarakeh, B.N. A Variable Speed Fault Detection Approach for Electric Motors in EV Applications based on STFT and RegNet. In Proceedings of the 2023 IEEE Transportation Electrification Conference & Expo (ITEC), Detroit, MI, USA, 21–23 June 2023; pp. 1–5. [Google Scholar] [CrossRef]
  29. Chandra, N.H.; Sekhar, A.S. Fault detection in rotor bearing systems using time frequency techniques. Mech. Syst. Signal Process. 2016, 72–73, 105–133. [Google Scholar] [CrossRef]
  30. Delgado-Arredondo, P.A.; Garcia-Perez, A.; Morinigo-Sotelo, D.; Osornio-Rios, R.A.; Avina-Cervantes, J.G.; Rostro-Gonzalez, H.; Romero-Troncoso, R.d.J. Comparative Study of Time-Frequency Decomposition Techniques for Fault Detection in Induction Motors Using Vibration Analysis during Startup Transient. Shock Vib. 2015, 2015, 708034. [Google Scholar] [CrossRef]
  31. Wisal, M.; Oh, K.-Y. A New Deep Learning Framework for Imbalance Detection of a Rotating Shaft. Sensors 2023, 23, 7141. [Google Scholar] [CrossRef] [PubMed]
  32. Son, T.; Hong, D.; Kim, B. Multi–Output Classification Based on Convolutional Neural Network Model for Untrained Compound Fault Diagnosis of Rotor Systems with Non–Contact Sensors. Sensors 2023, 23, 3153. [Google Scholar] [CrossRef] [PubMed]
  33. Bera, B.; Lin, C.-L.; Huang, S.-C.; Liang, J.-W.; Lin, P.T. Establishing a Real-Time Multi-Step Ahead Forecasting Model of Unbalance Fault in a Rotor-Bearing System. Electronics 2023, 12, 312. [Google Scholar] [CrossRef]
  34. Glowacz, A. Recognition of Acoustic Signals of Commutator Motors. Appl. Sci. 2018, 8, 2630. [Google Scholar] [CrossRef]
  35. Li, L.; Cao, S.; Li, J.; Nie, R.; Hou, L. Review of Rotor Balancing Methods. Machines 2021, 9, 89. [Google Scholar] [CrossRef]
  36. Shibo, Z.; Xingmin, R.; Qingyang, Z.; Kuan, L.; Chao, F.; Yongfeng, Y. Transient dynamic balancing of the rotor system with uncertainty. Mech. Syst. Signal Process. 2022, 171, 108894. [Google Scholar] [CrossRef]
  37. MacCamhaoil, M. Static and Dynamic Balancing of Rigid Rotors; Application Note BO 0276-12; Bruel & Kjaer: Naerum, Denmark, 2016; pp. 1–20. Available online: https://www.yumpu.com/en/document/read/7936761/static-and-dynamicbalancing-of-rigid-rotors (accessed on 14 January 2024).
  38. AbdulBary, M.; Embaby, A.; Gomaa, F. Fault Diagnosis in Rotating System Based on Vibration Analysis. ERJ Eng. Res. J. 2021, 44, 285–294. [Google Scholar] [CrossRef]
  39. Yamamoto, G.K.; Da Costa, C.; Da Silva Sousa, J.S. A smart experimental setup for vibration measurement and imbalance fault detection in rotating machinery. Case Stud. Mech. Syst. Signal Process. 2016, 4, 8–18. [Google Scholar] [CrossRef]
  40. Mohammadi, E.; Fadaeinedjad, R.; Moschopoulos, G. Performance Investigation of a Stall-Regulated Wind Turbine Considering Rotor Imbalance Faults. In Proceedings of the IECON 2019—45th Annual Conference of the IEEE Industrial Electronics Society, Lisbon, Portugal, 14–17 October 2019; pp. 2469–2474. [Google Scholar] [CrossRef]
  41. Korkua, S.; Jain, H.; Lee, W.-J.; Kwan, C. Wireless health monitoring system for vibration detection of induction motors. In Proceedings of the 2010 IEEE Industrial and Commercial Power Systems Technical Conference—Conference Record, Tallahassee, FL, USA, 9–13 May 2010; pp. 1–6. [Google Scholar] [CrossRef]
  42. Luczak, D. Mathematical model of multi-mass electric drive system with flexible connection. In Proceedings of the 2014 19th International Conference on Methods and Models in Automation and Robotics (MMAR), Miedzyzdroje, Poland, 2–5 September 2014; pp. 590–595. [Google Scholar] [CrossRef]
  43. Brock, S.; Luczak, D. Speed control in direct drive with non-stiff load. In Proceedings of the 2011 IEEE International Symposium on Industrial Electronics, Gdansk, Poland, 27–30 June 2011; pp. 1937–1942. [Google Scholar] [CrossRef]
  44. Janiszewski, D. Real-time control of drive with elestic coupling based on motor position measured only. In Proceedings of the 2011 IEEE International Symposium on Industrial Electronics, Gdansk, Poland, 27–30 June 2011; pp. 1931–1936. [Google Scholar] [CrossRef]
  45. Szczepanski, R.; Kaminski, M.; Tarczewski, T. Auto-Tuning Process of State Feedback Speed Controller Applied for Two-Mass System. Energies 2020, 13, 3067. [Google Scholar] [CrossRef]
  46. Derugo, P.; Szabat, K. Damping of torsional vibrations of two-mass system using adaptive low computational cost fuzzy PID controller. In Proceedings of the 2015 IEEE 11th International Conference on Power Electronics and Drive Systems, Sydney, Australia, 9–12 June 2015; pp. 1162–1165. [Google Scholar] [CrossRef]
  47. Wicher, B.; Nowopolski, K. Model of ADRC speed control system for complex mechanical object with backlash. In Proceedings of the 2017 22nd International Conference on Methods and Models in Automation and Robotics (MMAR), Miedzyzdroje, Poland, 28–31 August 2017; pp. 379–383. [Google Scholar] [CrossRef]
  48. Galardini, D.G.; Nordin, M.; Gutman, P.O. Robust PI tuning for an elastic two-mass system. In Proceedings of the 1997 European Control Conference (ECC), Brussels, Belgium, 1–7 July 1997; pp. 979–984. [Google Scholar] [CrossRef]
  49. Orlowska-Kowalska, T.; Szabat, K. Damping of Torsional Vibrations in Two-Mass System Using Adaptive Sliding Neuro-Fuzzy Approach. IEEE Trans. Ind. Inform. 2008, 4, 47–57. [Google Scholar] [CrossRef]
  50. Janiszewski, D. Extended Kalman Filter Based Speed Sensorless PMSM Control with Load Reconstruction. In Proceedings of the IECON 2006—32nd Annual Conference on IEEE Industrial Electronics, Paris, France, 6–10 November 2006; pp. 1465–1468. [Google Scholar] [CrossRef]
  51. Wicher, B. ADRC Load Position Controller for Two Mass System with Elastic Joint and Backlash. In Proceedings of the 2018 23rd International Conference on Methods & Models in Automation & Robotics (MMAR), Miedzyzdroje, Poland, 27–30 August 2018; pp. 333–338. [Google Scholar] [CrossRef]
  52. Deskur, J.; Pajchrowski, T.; Zawirski, K. Speed controller for a drive with complex mechanical structure and variable parameters. In Proceedings of the 2014 16th International Power Electronics and Motion Control Conference and Exposition, Antalya, Turkey, 21–24 September 2014; pp. 762–767. [Google Scholar] [CrossRef]
  53. Brock, S.; Deskur, J.; Janiszewski, D.; Muszyński, R. Active damping of torsional vibrations in servodrives. Power Electron. Electr. Driv.—Sel. Probl. 2007, 271–290. [Google Scholar] [CrossRef]
  54. Li, Q.; Wang, W.; Chen, L.; Sun, D. Rotor-System Log-Decrement Identification Using Short-Time Fourier-Transform Filter. Int. J. Rotating Mach. 2015, 2015, 809785. [Google Scholar] [CrossRef]
  55. Satpathi, K.; Yeap, Y.M.; Ukil, A.; Geddada, N. Short-Time Fourier Transform Based Transient Analysis of VSC Interfaced Point-to-Point DC System. IEEE Trans. Ind. Electron. 2018, 65, 4080–4091. [Google Scholar] [CrossRef]
  56. Deskur, J.; Muszynski, R. The problems of high dynamic drive control under circumstances of elastic transmission. In Proceedings of the 2008 13th International Power Electronics and Motion Control Conference, Poznan, Poland, 1–3 September 2008; pp. 2227–2234. [Google Scholar] [CrossRef]
  57. Bishop, C.M. Neural Networks for Pattern Recognition; Clarendon Press: New York, NY, USA; Oxford University Press: Oxford, UK, 1995. [Google Scholar]
  58. Haykin, S.S. Neural Networks: A Comprehensive Foundation, 2nd ed.; Prentice Hall: Upper Saddle River, NJ, USA, 1999. [Google Scholar]
Figure 1. Graphical representation of machine unbalance.
Electronics 13 00441 g001
Figure 2. Block diagram of a two-mass system with flexible joint.
Electronics 13 00441 g002
Figure 3. Photography of a laboratory stand with an accelerometer attached.
Electronics 13 00441 g003
Figure 4. Structure of control loops.
Electronics 13 00441 g004
Figure 5. Vibration registered in all three axes during cyclic impulse shock along with the “x” axis.
Electronics 13 00441 g005
Figure 6. Spectrograms of acceleration signals (x, y, z, axis) with drive coupled by a 6 mm shaft, compared to the situation where no shaft was installed.
Electronics 13 00441 g006
Figure 7. The influence of the mounting angle of the 45 g test mass on the vibrations of the drive system in the “y” axis.
Electronics 13 00441 g007
Figure 8. The influence of the value of test mass mounted at the angle of 60° on the vibration level in the “y” axis.
Electronics 13 00441 g008
Figure 9. The influence of shaft diameter on the vibrations of the drive system is measured in the “y” axis.
Electronics 13 00441 g009
Figure 10. Influence of test mass on the drive system vibrations and q-axis current.
Electronics 13 00441 g010
Figure 11. The structure of the MLP neural network used.
Electronics 13 00441 g011
Figure 12. The algorithm for processing measurement data.
Electronics 13 00441 g012
Figure 13. Graphical comparison of the effectiveness of neural detectors: (a) a detector that detects rotor unbalance, (b) a detector that identifies the level of rotor unbalance, and (c) an example of the performance of a detector (5-6-1) that detects the mass of rotor unbalance.
Electronics 13 00441 g013
Table 1. Summary of parameters considering the method of obtaining input data and the process of learning neural networks.
ParameterExplanation
Input dataAnalyzed signalVibration acceleration in the Y axis
Input dataAmplitudes of: fr, 2fr, 3fr, 4fr and current angular velocity
Calculation of kfr amplitudeAn averaged value within +/−5% of the kfr frequency width calculated from the current speed value
Normalization of input dataYes, in the range <0, 1>
The number of elements of the training vector250
The number of elements of the testing vector250
Neural networkType of neural networkFeed-forward backpropagation network
Transfer function of hidden layersHyperbolic tangent sigmoid transfer function (tansig)
Transfer function of output layerLinear transfer function (purelin)
Network training functionLevenberg-Marquardt backpropagation (trainlm)
Weight/bias learning functionGradient descent with momentum weight and bias learning function (learngdm)
Performance functionMean squared normalized error performance function (mse)
Maximum number of epochs to train2000
Performance goal1 × 10−5
Disclaimer/Publisher’s Note: The statements, opinions and data contained in all publications are solely those of the individual author(s) and contributor(s) and not of MDPI and/or the editor(s). MDPI and/or the editor(s) disclaim responsibility for any injury to people or property resulting from any ideas, methods, instructions or products referred to in the content.

