Abstract
The results of traditional vegetation-measuring methods are mostly two-dimensional data, which can only convey limited information. The greening situation of many cities or regions in the world cannot be fully assessed by these results. In this regard, this paper proposes the use of the air–ground integrated point cloud data acquisition mode for measuring vegetation. This mode combines a backpack-mounted laser scanning system, a vehicle-mounted laser scanning system, and UAV tilt photography technology to collect greening data in a comprehensive park and along a municipal road in Guangzhou, China. To classify the collected greening data, we propose the BiFPN-KPointNet-CBAM model, which was derived from PointNet. The model was introduced to analyze the distribution of green plants in study areas. The experimental findings indicate that our model achieved a notable enhancement in the overall accuracy by approximately 8% compared with other state-of-the-art models. Compared with the traditional greening survey method, this method obtained three-dimensional and more accurate greening data, and thus, provides higher quality greening data for urban managers.
1. Introduction
Recently, environmental protection has attracted more and more attention, and human beings are investing a lot of resources to improve environmental problems. During the process of environmental remediation, regional greening is seen as a more direct and effective approach [1]. Studies [2] showed that 45% of human-generated carbon emissions are absorbed by vegetation. The greening rate of a region is an important indicator to measure environmental protection [3], and the regional greening rate cannot be directly obtained by the naked eye. Therefore, the development of technology to measure the rate of greening becomes particularly important.
Traditional methods used to measure the rate of greening are time-consuming, costly, and cannot be quantified and widely used [4]. The results are mostly two-dimensional data [5,6], which can only convey limited information. This reason leads to the fact that the greening situation of many cities or regions in the world cannot be fully assessed. This situation will have a negative impact on the distribution planning of urban green plants. The rationality of green plant planning has a certain impact on the fixation of carbon [7]. Therefore, how to improve the efficiency and quality of greening data collection through new technologies and methods has become a key issue of common concern for urban managers and researchers.
In order to collect high-quality green holographic data, this study combined backpack, vehicle-mounted 3D laser scanning system, and UAV tilt photography technology to realize air–ground integrated 3D point cloud technology. Through the ICP (iterative closest point) algorithm [8,9,10,11], the collected point cloud data are registered to complete the data fusion, and the point cloud datasets of parks and municipal roads are obtained. The BiFPN-KPointNet-CBAM model classifies the datasets to accurately determine detailed greening conditions, enhancing the output’s dimensional depth and precision. This method has the characteristics of spatial location, geometry, and attributes, and can import the data into the relevant database of the world geographic information system so as to significantly enhance the digitization and precision of human urban greening management [12,13,14,15]. With the continuous expansion of point cloud data, further optimizing the overall performance of deep optimized neural network models to achieves the comprehensive coverage of indoor and outdoor, aboveground and underground spaces. This aims to meet the new demands for data collection efficiency and completeness in the field of real three-dimensional geographic information, thereby driving progress and development in this field [16,17,18,19,20].
The principal innovations of this paper are as follows:
- We introduce a novel approach to measuring vegetation by the air–ground integrated point cloud data acquisition mode for the first time, and this mode was verified in practice. This model realizes the transition from two-dimensional data to three-dimensional data. Figure 1 below shows the 3D reconstruction of vegetation, which was achieved through an innovative air–ground integrated point cloud data acquisition mode that combined aerial and ground-based scanning techniques.
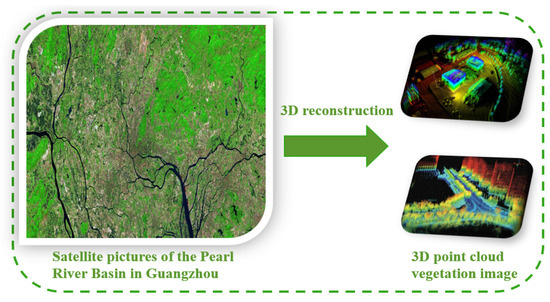 Figure 1. Three-dimensional reconstruction based on air–ground integrated point cloud data acquisition mode.
 - Aiming at the relationship and local characteristics between green point cloud data points, a hybrid model based on the PointNet fusion BiFPN and CBAM is proposed and a k-nearest neighbor algorithm is introduced. This model is of great value for classifying and analyzing point cloud data.
- We also conducted empirical evaluations on the data collection mode and classification model. The results show that our design has advantages in the quality of collected data and the accuracy of classification, reflecting the innovation of urban vegetation measuring technology.
2. Related Research
Point cloud data processing is based on deep learning algorithms. Most of the existing processing methods are used to convert point clouds into images or volume forms before feature learning. Typical representatives, such as References [21,22], converted point cloud voxels into volume grids and extended the image CNN to a 3D CNN. However, because the method is not deep enough for the extraction of data features, it is necessary to extract more dimensions and features of the data. References [23,24] attempted to render a 3D point cloud or shape into a 2D image, and then applied a 2D convolutional network to classify it. By employing a well-designed CNN for image processing, this approach has demonstrated remarkable performance in shape classification and retrieval tasks. However, extending it to scene understanding or other three-dimensional tasks, such as point classification and shape completion, presents challenges.
In view of the shortcomings of previous studies, this study used the air–ground integrated point cloud data acquisition mode to collect data from measuring vegetation. First, the oblique photogrammetry of the survey area was carried out by using the DJI M300 UAV equipped with the Searle 102S Pro five-lens tilt camera. The MS-120 vehicle-mounted 3D laser scanner was used to collect data on the greening areas on both sides of a municipal road. The GeoSLAM backpack mobile 3D laser scanner was used to quickly scan the park survey area. The control points were evenly laid on the ground of the survey area. Through the automatic identification of control points, point cloud data were precisely transformed into the target coordinate system, thereby enabling automatic registration [25]. Then, the three-dimensional tilt model was densely matched to generate a point cloud, which was fused with the three-dimensional laser point cloud data collected by backpacks and vehicles to form a holographic point cloud data result that covered the ground and underground, different heights, and a wide range of complete scenes. Subsequently, the hybrid model of BiFPN and CBAM, which was based on PointNet [26], was integrated, and the k-nearest neighbor algorithm [27] was introduced to classify the point cloud greening data obtained in the previous step into five categories, namely, ‘trees’, ‘shrubs’, ‘vines’, ‘herbs’, and ‘others’. Finally, according to the classification results, the proportions of different types of green plants in the total greening rate of the region were calculated [28,29,30,31]. Through the experiment, we found it overcame the problem that 3D CNN is not deep enough in extracting data features and the problem that 2D convolutional network is difficult to extend to scene understanding or other three-dimensional tasks (such as point classification and shape completion).
3. Data Collection and Fusion
3.1. Park Greening Data Collection Based on Backpack 3D Laser
Due to the large amount of vegetation in the park and the serious obstruction of obstacles, this study used a 3D laser scanning technology backpack based on GeoSLAM technology. The characteristics of this backpack are that it does not require global satellite navigation (GNSS) signals and has strong environmental adaptability, as shown in Figure 2.
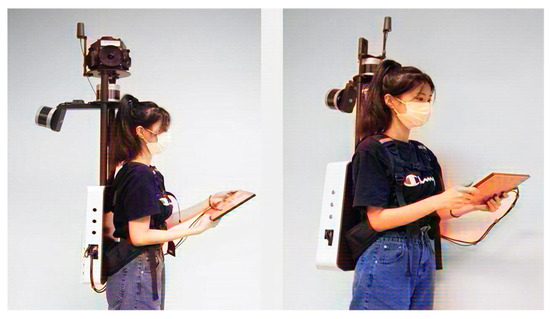
Figure 2.
Backpack laser scanning system.
The 3D laser scanning of large outdoor scenes in the park requires route planning and design, with priority given to a “closed-loop scanning” route. An increased walking distance will cause error accumulation, and the longer the distance, the greater the error [26]. Therefore, the operation process should be as much of a closed loop as possible. The scanning route of the park should form multiple O-shaped closed loops as much as possible, rather than linear closed loops, so that the error can be kept to a minimum.
Point cloud data obtained from backpack-style 3D laser scanning is processed using relatively independent coordinate systems. To achieve the transformation of point cloud data to the target coordinate system, this study evenly distributed control points on the boundary of the three blocks according to the principle of control point measurement and layout. By automatically recording the reference point by the scanner, the scanned data were input into the software to automatically identify the reference point so as to realize the accurate coordinate transformation of the point cloud data.
3.2. Three-Dimensional Laser-Point-Cloud-Assisted Municipal Road Greening Data Acquisition
The acquisition of municipal road greening information mainly depends on a vehicle-mounted measurement system. This system uses an MS-120 vehicle-mounted 3D laser scanner, GNSS positioning, inertial measurement (IMU) positioning, synchronous control, and a high-definition digital camera to realize the real-time acquisition of green place clouds and high-definition panoramic images along urban highways. This approach can significantly enhance the efficiency and precision of measuring municipal road green spaces. Schematic diagram of the vehicular system is illustrated in Figure 3.
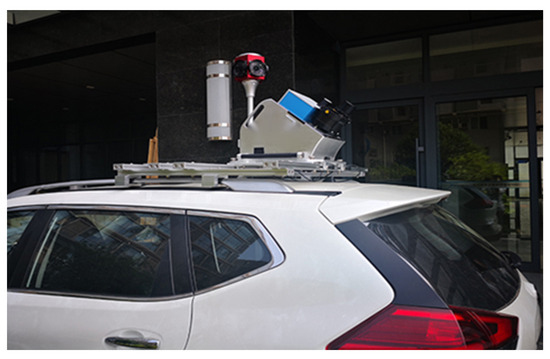
Figure 3.
Vehicle-mounted laser scanning system.
Using the vehicle-mounted point cloud data collection system, the point cloud data of green areas, such as motor vehicle green belts, pedestrian green belts, pedestrian trails, auxiliary green belts, and data street trees on urban roads, can be accurately obtained. In further applications, the point cloud data and panoramic image linkage mapping function can also be realized through professional supporting software. Through the point cloud panoramic linkage, the tree species and types of greening trees on municipal roads can be identified [27]. To ensure the data’s integrity and accuracy, especially in regions inaccessible to vehicles and obstructed by vegetation, a backpack 3D laser scanner is used for auxiliary collection. Compared with the conventional urban green space data collection method, the use of ‘backpack + vehicle’ three-dimensional point cloud data for urban green space data collection can effectively improve the efficiency of the urban green space data collection, save personnel and resources, and reduce the false alarm rate of data collection and improve the accuracy of the obtained data.
3.3. Point Cloud Accuracy Control and Optimization
In the process of data processing, it is necessary to set corresponding parameters for the GPS signal strength and the loss of lock time, control point density, control point network strength, scanning distance, control point accuracy, and other precision-influencing factors. After the further popularization and application of point cloud technology in digital garden construction, it is bound to need a hologram to provide more high-quality greening data. Therefore, according to the needs of hologram drawing, some precision indexes can be measured when processing various special data. Previous studies showed that [28] the measurement accuracy of a point cloud mainly includes the density, resolution, structural details, moderate error, and roughness error. The accuracy of a point cloud can be controlled by means of adjustment, registration, correction, and refinement, and the point cloud can be optimized by means of noise reduction, selection, dilution, and simplification [29].
3.4. Multi-Source Heterogeneous Point Cloud Data Fusion
From the perspective of the whole greening data acquisition, the oblique photography technology is used to obtain the three-dimensional modeling of vegetation. The upper information is relatively complete, and the lower information is relatively scarce. However, the number of bottom features of the point cloud obtained by measuring instruments, such as backpacks and vehicle scanners, are higher, while the number of features related to the top surface are lower. The ground point cloud data collection method can solve the shortcomings of the current tilt photography technology in accuracy and precision. On the other hand, the utilization of oblique photography techniques can effectively address the “blind spots” in 3D laser imaging, as well as the scarcity of point cloud data for tall buildings and trees. This study utilized oblique photography techniques to acquire three-dimensional modeling data of a park in Guangzhou. Employing the dense image registration method, we generated a dense image-matching (DIM) point cloud and integrated it with the three-dimensional laser point clouds captured by backpacks and vehicles [30], that is, data fusion.
It is possible to construct complete holographic point cloud data in the survey area by using an iterated closest points (ICPs) automatic matching algorithm to realize multi-source point cloud data fusion [31,32].
The ICP automatic matching algorithm utilizes two known point clouds, P and Q, to find the point pi in point cloud P that has the shortest Euclidean distance to a point qi in point cloud Q. These pi and qi pairs are then used to obtain the transformation matrix. By eliminating some distant point pairs and iteratively minimizing the error function, the optimal transformation matrix is obtained. This completes the registration of the two known point clouds [26,33]. The calculation formula is presented as follows:
In the equation, f (R, T) represents the error function of the ICP algorithm, where K is the number of nearest point pairs, pi is a point in the target point cloud P, qi is the nearest point in the source point cloud Q corresponding to pi, R represents the rotation relationship, and T represents the translation relationship.
The ICP algorithm is currently a mainstream point cloud registration algorithm that is capable of directly registering two sets of point clouds without the need for corresponding segmentation. It achieves good registration results [34]. In the process of the practical investigation of the green area, the point cloud is registered, and the adjustment, registration, correction, refinement, and other processing are carried out to ensure its accuracy in the same coordinate system. After further popularization and application of this method, the point cloud is optimized by more professional methods used in the industry, such as denoising, thinning, and simplification, so as to eliminate redundant data. The optimized multi-source point cloud data can realize the functions of total factor topographic map production, municipal landscaping data extraction, park thematic data extraction, etc. [35], providing more reference data for digital garden construction.
4. Background
4.1. PointNet
Due to the characteristics of spatial point clouds, neural networks are unable to directly process them. Therefore, PointNet proposed a solution that enables the network to directly handle point clouds. This approach is effective for unordered point clouds, where PointNet can use the symmetric function maximum pooling method to keep its sequence unchanged.
The PointNet model is illustrated in Figure 4.
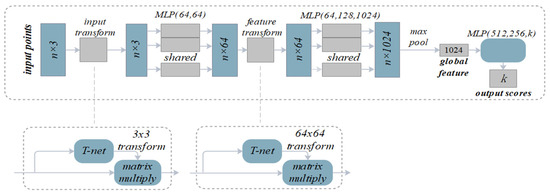
Figure 4.
PointNet model.
As shown in Figure 4, in order to solve the influence of translation and rotation on point cloud classification and segmentation, PointNet uses a small network of T-net [36], which consists of a feature extraction layer, maximum pooling layer, and full connection layer. The input point cloud is processed by the T-net network to acquire a 3 × 3 affine transformation matrix, and then this matrix is multiplied with the original point cloud to obtain a new n × 3 point cloud as the next input. This approach is also applicable to the feature space, ensuring the invariance of features. However, since PointNet cannot extract local information at different scales, it can be improved.
4.2. BiFPN
Under the EfficientDet backbone network, we propose a weighted bi-directional feature pyramid network (BiFPN). This network enables simple and rapid multi-scale feature fusion. As depicted in Figure 5, a notable feature of this network is its ability to integrate more feature information without increasing the computational overhead.
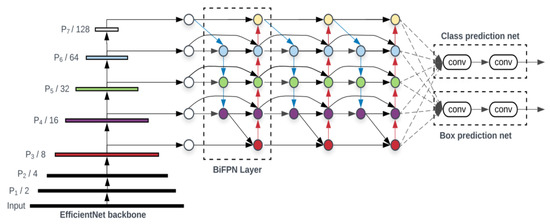
Figure 5.
BiFPN model.
Because point cloud data have local and global features after passing through PointNet and k-nearest neighbor algorithms, multi-scale feature fusion is needed, and this network can achieve this feature, and thus, model fusion can enhance the efficiency and accuracy of the feature extraction.
4.3. CBAM
In the process of using a neural network model to extract features of objects, the attention mechanism [37] can help the model to select more effective features and create a weight for each feature to measure their importance so that the obtained feature vectors are more robust and discriminative to noise, and then the neural network can efficiently and accurately complete the task.
This study drew inspiration from the CBAM (convolutional block attention module) [37] to perform feature weight allocation. The structure is illustrated in Figure 6.
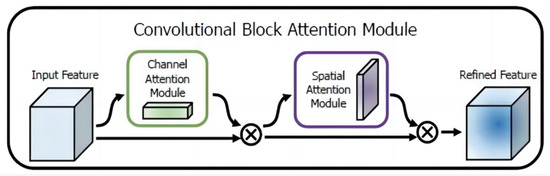
Figure 6.
Squeeze-excitation block structure.
The CBAM integrates spatial and channel attention mechanisms. The figure above illustrates the overall structure after incorporating the CBAM module. It can be observed that the output of the convolutional layer first goes through the channel attention module to obtain the weighted results, followed by the spatial attention module, resulting in the final weighted results.
4.4. Mixing Pooling
The maximum pooling method effectively addresses the issue of cluttered point cloud data. Regardless of the arrangement of point cloud data, the maximum eigenvalue can always be selected to obtain a feature vector of the same size. Although the maximum pooling can better preserve the texture features of the data, it discards all points except the point with the largest eigenvalue of the dimension, thus losing more information [38]. Therefore, in the green plant classification task of this study, the single use of maximum pooling may lead to the neglect of edge point cloud data with insignificant features, thus affecting the green plant classification results and the final area proportion of each green plant.
The effect of average pooling is the opposite to that of maximum pooling. Average pooling can effectively reduce the variance in the predicted value, and at the same time, ensure that the extracted feature vectors remain invariant to different permutations of point cloud data.
Most of the predecessors used single maximum pooling when using PointNet, but in many image target detection tasks, the performance of maximum pooling is often better than that of average pooling. Combined with the research of this study, there was an exploration of and research on the task of green data acquisition. The data types included in this study were more complicated. Therefore, mixing pooling was used to complete the sampling of feature vectors, as shown in Formula (2):
The hybrid pooling layer includes maximum pooling and average pooling to obtain feature vectors containing more cloud data information, and thus, it can avoid the serious problem of information loss caused by PointNet when using maximum pooling alone. In this study, the maximum pooling and average pooling methods were reasonably integrated, which not only ensured the invariance of point cloud data or point cloud feature arrangement, but also further increased the amount of feature information data.
5. The Overall Model Based on Deep Learning in Green Detection
As shown in Figure 7, taking n points as the input, only the three-dimensional coordinates of the points were used for the feature extraction. Based on PointNet, a T-net was used to complete the input alignment and solve the challenge of point cloud irregularity. The n points were sent to two multi-layer perceptrons with an output channel of 64 for feature extraction, and the obtained features were again aligned using a T-net. The feature obtained at this time was the global feature obtained for each point independent operation and did not include the relationship between points, recorded as . In order to obtain local features, we first used uniform sampling to obtain c center points of the sample, and used the k-nearest neighbor algorithm to divide the obtained center points based on the Euclidean distance between the points. The relationship between the central point and its neighboring points was utilized as a feature for the central point itself. A straightforward approach to establish a distance relationship model between the central point and its neighboring points was through feature subtraction. The obtained {Fc − Fc1, Fc − Fc2, …, Fc − Fck} were added as new features to the original feature of the center point. Before further using the attention mechanism to obtain more detailed features, the feature vectors of the points at this time included the relationship between their own features and points.
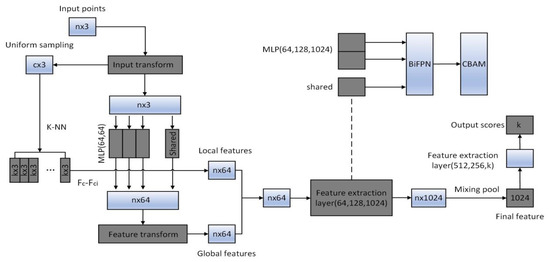
Figure 7.
The overall model of measuring vegetation based on deep learning.
Continuing with deep semantic feature extraction, global features and local features were cascaded as inputs to multi-layer perceptrons (MLPs). Following the non-linear operations of convolution, we incorporated the weighted bi-directional feature pyramid network (BiFPN) to achieve multi-scale feature fusion. Finally, we integrated the CBAM to allocate feature weights, incorporating an attention mechanism into the neural network to enable the learning of more crucial features and enhance the classification accuracy. The above process was repeated until the final feature vector was obtained. The feature at this time was a more discriminative feature after the attention adjustment.
6. Experimental Results and Analysis
6.1. Dataset
The research team collected the greening data of a park in Guangzhou and a municipal road along the road. According to the previous processing, the point cloud datasets Parkpoint and Roadpoint were obtained. Both datasets had five categories: ‘arbor’, ‘shrub’, ‘vine’, ‘herb’, and ‘other’. Parkpoint contained 15,336 aligned CAD models, which were divided into 12,780 training samples and 2556 test samples. Roadpoint contained 13,584 aligned CAD models, which comprised 11,320 training samples and 2264 testing samples.
In order to obtain more convincing experimental results, this study used the same experimental settings as in the PointNet++ benchmark method. For each sample, only the information of the three axes of x, y, and z was used, and the grid information in the original sample was discarded. Each sample point cloud was uniformly downsampled to 1024 points and normalized to a unit sphere with a radius of 1. In the training phase, the random scaling object and the disturbance object and point position were used to enhance the data of the sample, and Gaussian noise (0, 0.01) was added to the coordinate points to enhance the robustness of the model.
6.2. Experimental Environment
During the training process, SGD [29] was employed as the optimizer. The initial learning rate was set to 0.1, with a batch size of 32, and the momentum was set to 0.9. For the two datasets in this study, 200 epochs were trained, and every 50 epochs attenuated the learning rate by 0.1 to 0.001. The cross-entropy loss function was utilized to compute the model loss. The experimental setup is illustrated in Table 1.

Table 1.
Experimental environment.
6.3. Experimental Results
The T-net structure in PointNet was utilized for aligning input point clouds, with the aim to address the challenge posed by the inherent disorderliness of point clouds to neural network applications. The features were extracted by two multi-layer perceptrons with 64 output channels. After the features were aligned again using T-net, k-NN was used to select k neighbors for each point. Feature subtraction was used to model the relationship between points, and the obtained relationship was added to the features of the center point itself as the input of the subsequent network. PointNet used three multi-layer perceptrons (the output channels were 64, 128, and 1024, respectively) to extract features. In this study, the BiFPN was added after the nonlinear operation of the perceptron, and multi-scale feature fusion was carried out by solving various features that existed locally and globally. Finally, the CBAM module was added to allocate the weights between features, that is, it was integrated with the attention mechanism. The final feature map was downsampled using a hybrid pooling method. Finally, three fully connected layers (output channels were 512, 256, and 40) were used to map the learned features into the space of sample labels, and the softmax classifier was used to complete the classification of the samples. In the first two fully connected layers, two dropout layers with a dropout rate of 0.5 were incorporated to mitigate overfitting. The corresponding output of the final fully connected layer represented the classes contained in the dataset.
To provide a better understanding of the model’s behavior, we explored the impacts of different pooling strategies on the model performance, as shown in Table 2.
Table 2.
The impacts of different pooling strategies on the model performance.
The results show that the pooling strategy we adopted enabled the model to have better performance.
Various values of k and α were tested to analyze their impact on the classification accuracy of two specific datasets (Parkpoint and Roadpoint). When k was set to 1, the feature extraction model reduced to PointNet, which primarily focused on global features. On the other hand, when α was set to 1, the maximum pooling operation became equivalent to the mixed pooling method.
As depicted in Figure 8, the optimal classification performance of the model was achieved when k was set to 6 and α was set to 0.7. Furthermore, the figure reveals that the k value had a more significant influence on the model’s performance, highlighting the crucial role of incorporating local features into the analysis.
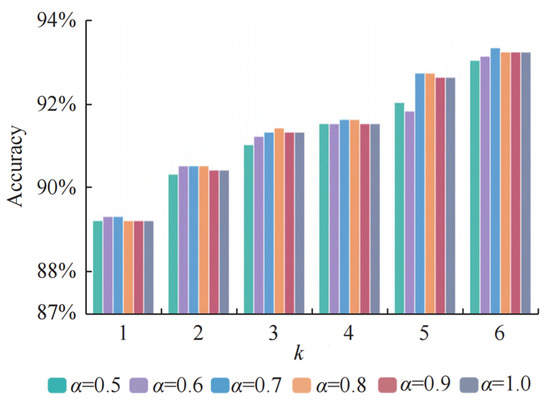
Figure 8.
The influence of the hyperparameters k and α on the model performance.
It can be seen that when k = 6 and α= 0.7, the classification performance of the model reached the best. Therefore, the hyperparameters k = 6 and α= 0.7 were set. The fusion model proposed in this paper was applied to classify two datasets, and the classification accuracy was compared with other methods. From Table 3, it can be observed that the combination of attention mechanism and neural networks contained both global and local features. The classification accuracy was improved compared with PointNet. And it exceeded the performance of most classical algorithms for processing point cloud tasks. To demonstrate the effectiveness of the attention mechanism module, an ablation experiment was set up in Section 6.4 to see the impact of each module on the overall performance of the network.
Table 3.
Classification results on the Parkpoint and Roadpoint datasets.
In the comparison experiment, each sample point cloud was uniformly downsampled to 1024 points, and the fusion model could still maintain a high classification accuracy. To test the robustness of the model, experiments were conducted on sampling point numbers from different sample point clouds. From Figure 9, it can be observed that the performance of the model further improved when the number of sampled points was 2048. When the number of sampling points dropped to 512 and the sample had only a rough outline, the model in this study could still maintain satisfactory classification accuracy, indicating the model exhibited a certain level of robustness to the number of points. For the point cloud samples obtained by the three-dimensional scanning equipment, even if it was a sparse matrix with more missing points, the model in this study could also classify the samples well, and the sample contained fewer points, which could greatly reduce the calculation amount of the model.
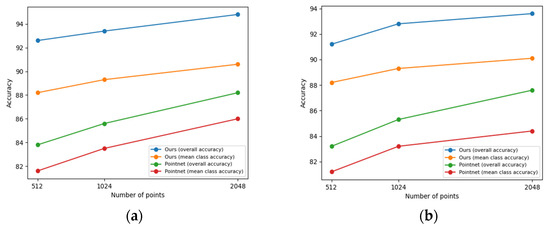
Figure 9.
Classification accuracies corresponding to different sampling point numbers. (a) Parkpoint; (b) Roadpoint.
Because this study integrated multiple improved modules, it was compared with the PointNet model in terms of spatial complexity. From Table 4, it can be observed that the proposed model had a higher spatial complexity compared with the original PointNet model because the introduced k-nearest neighbor module divided the point cloud into regions, and the attention mechanism assigned weights to the feature channels, which provided higher computational complexity.
Table 4.
Comparison of model spatial complexity.
However, limited computing resources constrain the model’s applicability in scenarios due to the increase in computational complexity.
6.4. Ablation Experiment
To demonstrate the effectiveness of the improvement module proposed in this paper based on the PointNet model, the ablation experiments of the k-nearest neighbor, hybrid pooling, BiFPN, and convolutional block attention module (CBAM) were established to evaluate the algorithm’s performance, with the aim to understand the impact of each part of the improvement module on the overall network performance. From Table 5, it can be observed that the model designed in this study does not include any improvement modules, only the maximum pooling is used for feature aggregation, and the model degenerates into PointNet. The classification accuracy of the Parkpoint dataset reached 88.2%, and the classification accuracy of the Roadpoint dataset reached 87.6%. By incorporating the k-nearest neighbors method into the model, local features of the point cloud samples could be extracted, thereby improving the accuracy. When using the hybrid pooling method to aggregate features, the accuracy rate was further improved, but the improvement was less than the improvement provided by the k-nearest neighbor module, indicating that the impact of the hybrid pooling method on the model performance was smaller than that of local feature extraction. When the Bi-FPN was added to the model, the required feature information was obtained to a greater extent by fusing the multi-scale feature information. At this time, the model’s classification accuracy improvement was particularly notable when the convolutional block attention module (CBAM) was integrated into the model; it can be observed that compared with the first three improvement modules, there was a significant increase in the model’s classification accuracy, indicating that the convolutional attention mechanism module CBAM could further obtain more resolution features on the basis of the first three, thereby improving the classification accuracy of the model.
Table 5.
Ablation study for improved parts.
7. Discussion
This paper shows significant advancements in point cloud data acquisition and classification by integrating backpack, vehicle-mounted 3D laser scanning systems, and UAV tilt photography technology, ensuring comprehensive and high-quality datasets. The enhancement of the PointNet model with advanced modules, like the Bi-FPN and CBAM, significantly improved the classification accuracy, as shown by a detailed ablation study. The experimental results were robust and showcased clear improvements in the Parkpoint and Roadpoint datasets, highlighting the practical utility of the proposed method for urban management and digital garden construction. These innovations align well with the fields of artificial intelligence and computer science and engineering, contributing to electronics.
However, the proposed method’s several limitations should be discussed in future research. First, the method was validated on only two datasets, Parkpoint and Roadpoint, which have relatively limited application scenarios. This restricts the generalizability of the findings, as the datasets might not capture the full diversity and complexity of real-world point clouds. Additionally, the scalability of the model to larger and more complex datasets has not been thoroughly explored, raising concerns about its performance in more demanding environments. This study also lacked a detailed analysis of the computational complexity, including the training and inference times, resource requirements, and potential bottlenecks. This omission makes it difficult to assess the model’s efficiency and practical applicability, especially in resource-constrained settings.
Therefore, future research should focus on addressing these limitations to enhance the robustness and applicability of the proposed method. Expanding validation to more diverse and larger datasets will be important to establish the model’s effectiveness across different scenarios. This could involve collaborating with other researchers or institutions to access a broader range of datasets. Additionally, optimization techniques should be explored to improve the computational efficiency, such as algorithmic enhancements or leveraging high-performance computing resources. Integrating advanced attention mechanisms and other state-of-the-art deep learning techniques could further enhance the model’s performance. Applying the model in real-world scenarios, such as urban planning, environmental monitoring, and autonomous navigation, will show its practical utility. Detailed case studies and pilot projects showcasing the model’s performance and benefits in practical use cases will provide valuable insights. Finally, investigating the integration of the model with other emerging technologies, such as edge computing, cloud platforms, and IoT, for the real-time processing and analysis of point cloud data will open up new avenues for its application and development.
Author Contributions
Investigation, Q.L. and S.Z.; methodology, Q.L.; validation, J.J. and S.Z.; writing—original draft preparation, Q.L. and S.Z.; writing—review and editing, J.J. and J.H.; supervision, F.Z. All authors have read and agreed to the published version of the manuscript.
Funding
This study was supported by the National Natural Science Foundation of China (grant nos. 41974014 and 42274004), and the Natural Science Foundation of Guangdong Province, China (grant no. 2022A1515010396).
Data Availability Statement
Data are contained within this article.
Conflicts of Interest
The authors declare no conflicts of interest.
References
- Jinghua, C.; Jin, X.; Zhanhao, L. Coupling relationship and interaction between ecological protection and high-quality economic development in the Yellow River Basin in the new era. J. Shandong Univ. Financ. Econ. 2023, 3, 36–51. [Google Scholar]
- Implementation of the second round of central ecological environmental protection supervision feedback rectification work in Guangdong Province. Nanfang Daily, 10 May 2023.
- Guangzhou Municipal People’s Government. Guangzhou Municipal Government Work Report; Guangzhou Municipal People’s Government: Guangzhou, China, 2023. [Google Scholar]
- Yunxing, Z.; Meiyu, Y.; Ziyang, L. Study on the greening quality of CBD streets in Zhengdong New District based on street panoramic images. Chin. Foreign Archit. 2022, 11, 57–62. [Google Scholar]
- Yamei, C. Study on the Temporal and Spatial Distribution of Nitrogen and Phosphorus in the Typical Riparian Zone of the Linfen Section of the Fenhe River and Its Influencing Factors; Xi’an University of Technology: Xi’an, China, 2021. [Google Scholar]
- Pan, L.; Dai, J.; Wu, Z.; Huang, L.; Wan, Z.; Han, J.; Li, Z. Spatial and Temporal Variations of Nitrogen and Phosphorus in Surface Water and Groundwater of Mudong River Watershed in Huixian Karst Wetland, Southwest China. Sustainability 2021, 13, 10740. [Google Scholar] [CrossRef]
- Jianxiang, G.; Bisheng, Y.; Zhen, D. Intelligent holographic mapping for digital twin cities. Mapp. Bull. 2020, 6, 134–140. [Google Scholar]
- Cheng, F.; Ziwen, Z. Application of ICP algorithm in automatic registration of multi-beam point cloud strips. Ocean. Surv. Mapp. 2023, 43, 5–9. [Google Scholar]
- Ren, P.; Xiaomin, S.; Yuan, L.; Chongbin, X. Application of FR-ICP algorithm in tilt photogrammetry point cloud registration. Space Return Remote Sens. 2023, 44, 13–22. [Google Scholar]
- Yanhu, S.; Xiaodan, Z.; Chengqun, C. A high-precision point cloud registration method based on SAC-NDT and ICP. Single Chip Microcomput. Embed. Syst. Appl. 2023, 23, 61–65+76. [Google Scholar]
- Shuaishuai, W.; Yanhong, B.; Yin, W. ICP point cloud registration method based on ISS-BSHOT feature. J. Yangzhou Univ. (Nat. Sci. Ed.) 2022, 25, 50–55. [Google Scholar]
- Jian, R.; Lianhai, Z.; Sanbao, H. PointNet-based body segmentation method. J. Wuhan Univ. (Eng. Ed.) 2023, 56, 347–352. [Google Scholar]
- Binghai, W. Segmentation of typical elements of subway shield tunnel point cloud based on PointNet. Railw. Constr. Technol. 2022, 12, 159–163. [Google Scholar]
- Jianqi, M.; Hongtao, W.; Puguang, T. Airborne LiDAR point cloud classification by integrating graph convolution and PointNet. Prog. Laser Optoelectron. 2022, 59, 328–334. [Google Scholar]
- Yaoting, H. PointNet-based point cloud classification model. Smart City 2022, 8, 39–41. [Google Scholar]
- Deren, L.; Wenbo, Y.; Zhenfeng, S. Smart city based on digital twins. Comput. Urban Sci. 2021, 1, 4. [Google Scholar] [CrossRef]
- Li, D.; Wang, M.; Shen, X.; Dong, Z. From Earth Observation Satellite to Earth Observation Brain. J. Wuhan Univ. (Inf. Sci. Ed.) 2017, 42, 143–149. [Google Scholar]
- Deren, L.; Jun, M.; Zhenfeng, S. On the Innovation of Geographical Conditions Survey and Monitoring. J. Wuhan Univ. (Inf. Sci. Ed.) 2018, 43, 1–9. [Google Scholar]
- Deren, L.; Hanruo, Y.; Xi, L. Spatio-temporal pattern analysis of urban development in countries along the Belt and Road based on nighttime light remote sensing images. J. Wuhan Univ. (Inf. Sci. Ed.) 2017, 42, 711–720. [Google Scholar]
- Deren, L. From Surveying and Mapping to Geospatial Information Intelligent Service Science. J. Surv. Mapp. 2017, 46, 1207–1212. [Google Scholar]
- Maturana, D.; Scherer, S. Voxnet: A 3d convolutional neutral network for real-time object recognition. In Proceedings of the IEEE/RSJ International Conference on Intelligent Robots and Systems, Hamburg, Germany, 7–10 July 2015. [Google Scholar]
- Wu, Z.; Song, S.; Khosla, A. 3d shapenets: A deep representation for volumetric shapes. In Proceedings of the IEEE Conference on Computer Vision and Pattern Recognition, Boston, MA, USA, 7–12 June 2015; pp. 1912–1920. [Google Scholar]
- Qi, C.R.; Su, H.; Nießner, M.; Dai, A.; Yan, M.; Guibas, L.J. Volumetric and multi-view cnns for object classification on 3d data. In Proceedings of the IEEE Conference on Computer Vision and Pattern Recognition, Las Vegas, NV, USA, 26 June–1 July 2016. [Google Scholar]
- Su, H.; Ma, S.; Kalogeraks, E. Learned-MillerMulti-View Convolutional Neural Networks for 3d Shape Recognition; ICCV: Paris, France, 2015. [Google Scholar]
- Jia, T.; Xianfeng, H.; Bo, G. Precision control of laser scanning in large-scale landscape mapping. Technol. Plaza 2012, 122, 80–83. [Google Scholar]
- Charles, R.Q.; Su, H.; Kaichun, M.; Guibas, L.J. PointNet: Deep Learning on Point Sets for 3D Classification and Segmentation. In Proceedings of the 2017 IEEE Conference on Computer Vision and Pattern Recognition (CVPR), Honolulu, HI, USA, 21–26 July 2017; pp. 77–85. [Google Scholar] [CrossRef]
- Cover, T.; Hart, P. Nearest neighbor pattern classification. IEEE Trans. Inf. Theory 1967, 13, 21–27. [Google Scholar] [CrossRef]
- Hao, Y.; FuZhou, D. Large-scale product flexibility detection technology based on combined measurement. Comput. Integr. Manuf. Syst. 2019, 25, 1037–1046. [Google Scholar]
- Zhenwei, N. Backpack vehicle-borne laser scanning combined with UAV tilt aerial survey practice in community holographic data acquisition. Mapp. Bull. 2021, 528, 159–163. [Google Scholar]
- Shuzhen, W.; Guoqiang, Z.; Guangsheng, W. Refined modeling of buildings based on multi-source point cloud data fusion. Mapp. Bull. 2020, 521, 28–32+38. [Google Scholar]
- Chenchen, Z. Research on Point Cloud Registration Based on ICP Algorithm; Zhengzhou University: Zhengzhou, China, 2019. [Google Scholar]
- Bahdanau, D.; Cho, K.; Bengio, Y. Neural Machine Translation by Jointly Learning to Align and Translate, Computer Science. arXiv 2014, arXiv:1409.0473. [Google Scholar]
- Charles, R.; Qi, L.Y.; Hao, S.; Leonidas, J.G. PointNet++: Deep hierarchical feature learning on point sets in a metric space. Adv. Neural Inf. Process. Syst. 2017, 30, 5105–5114. [Google Scholar]
- Wang, Y.; Sun, Y.; Liu, Z.; Sarma, S.E.; Bronstein, M.M.; Solomon, J.M. Dynamic graph cnn for learning on point clouds. ACM Trans. Graph. (Tog) 2019, 38, 1–12. [Google Scholar] [CrossRef]
- Li, J.; Chen, B.M.; Lee, G.H. So-net: Self-organizing network for point cloud analysis. In Proceedings of the IEEE conference on computer vision and pattern recognition, Salt Lake City, UT, USA, 18–23 June 2018; pp. 9397–9406. [Google Scholar]
- Khan, T.M.; Robles-Kelly, A.; Naqvi, S.S. T-Net: A Resource-Constrained Tiny Convolutional Neural Network for Medical Image Segmentation. In Proceedings of the 2022 IEEE/CVF Winter Conference on Applications of Computer Vision (WACV), Waikoloa, HI, USA, 3–8 January 2022; pp. 1799–1808. [Google Scholar] [CrossRef]
- Kumawat, S.; Raman, S. Lp-3dcnn: Unveiling local phase in 3d convolutional neural networks. In Proceedings of the IEEE/CVF Conference on Computer Vision and Pattern Recognition, Long Beach, CA, USA, 15–20 June 2019; pp. 4903–4912. [Google Scholar]
- Li, Q.; Li, W.; Sun, W.; Li, J.; Liu, Z. Fingerprint and Assistant Nodes Based Wi-Fi Localization in Complex Indoor Environment. IEEE Access 2016, 4, 2993–3004. [Google Scholar] [CrossRef]
Disclaimer/Publisher’s Note: The statements, opinions and data contained in all publications are solely those of the individual author(s) and contributor(s) and not of MDPI and/or the editor(s). MDPI and/or the editor(s) disclaim responsibility for any injury to people or property resulting from any ideas, methods, instructions or products referred to in the content. |
© 2024 by the authors. Licensee MDPI, Basel, Switzerland. This article is an open access article distributed under the terms and conditions of the Creative Commons Attribution (CC BY) license (https://creativecommons.org/licenses/by/4.0/).