1. Introduction
In the field of image processing, image deblurring is essential for enhancing visual quality and extracting meaningful information from degraded images. The advent of deep learning has significantly advanced image deblurring techniques, particularly through the use of CNNs. These end-to-end models can directly learn complex representations from data.
Despite these advancements, deep learning models still face challenges in understanding image content and semantic information, particularly in scenarios with severe blur or significant variations. While some models can learn high-level features, they often struggle with accurately comprehending objects and structures in complex scenes.
Several studies have highlighted the effectiveness of segmentation-assist deblurring methods [
1,
2,
3,
4]. Krishnan et al. [
1] proposed a blind image deblurring method using normalized sparsity measures, segmenting the image into distinct regions to infer the blur kernel and clear image based on regional sparsity. Luo et al. [
2] employed superpixel segmentation priors for blind deblurring, improving deblurring quality by utilizing consistent information within superpixels. Zhang et al. [
3] introduced a method using a three-stage intensity prior, enhancing deblurring by modeling intensity distributions in three distinct regions. Li et al. [
4] introduced a dynamic scene deblurring framework that employs hybrid activation functions and edge-assisted dual-branch residuals. This method enhances deblurring performance by leveraging a combination of activation functions to capture diverse image features and incorporating edge information to guide the deblurring process through a dual-branch architecture, which separately processes edge details and broader image structures.
The SAM is an advanced computer vision model that automatically recognizes and segments arbitrary objects in an image and has gained attention for its potential in image deblurring [
5,
6,
7]. Li et al. [
5] improve generalizability of the deblurring model by enabling a robust interaction between image data and segmentation masks generated by SAM. Zhang et al. [
6] distilled semantic priors from the SAM to enhance the efficiency and accuracy of image restoration models. Jin et al. [
7] demonstrated the practicality of SAM in low-level visual tasks through grayscale encoding and channel expansion. SAM utilizes advanced image segmentation techniques to partition images into coherent regions based on priors such as sparsity, superpixel segmentation, and intensity distribution. This segmentation allows for a more nuanced understanding and processing of image content and structure, enabling tailored deblurring strategies for different regions.
In this paper, we leverage the advantages of SAM and propose the EFE module, which re-weights masks generated by SAM following segmentation by detecting their features and high-frequency information. Masks with greater high-frequency information are assigned higher weights, prompting the network to prioritize them during processing. The EFE module uses the masks to locate blur in an image and identify the intensity of the blur, allowing the model to focus more accurately on specific features. Based on the EFE module, we develop a deblurring network called EFE-CNA Net, which enhances the deblurring process by employing an image-mask decoder to merge features from both the image and the mask from the EFE module, and incorporates the CNA Net as its base network. This design enables the model to focus on distinct features at various locations, enhancing its learning process through the guidance provided by the EFE module and the blurred images. Feature maps extracted by different models show that our model outperforms others in extracting features from key parts of the image. Testing results on the RealBlur [
8] and REDS [
9] datasets showed PSNR and SSIM metrics of 28.77 and 0.902 on RealBlur-J, 36.40 and 0.956 on RealBlur-R, and 31.45 and 0.919 on REDS, surpassing other existing methods.
The remaining part of this article is organized as follows:
Section 2 provides a brief review of related work.
Section 3 describes our method EFE-CNA Net in detail.
Section 4 shows the experimental results. The usefulness of edge perception in image deblurring is discussed in
Section 5.
Section 6 presents the future work.
Section 7 concludes the paper.
2. Related Work
The rapid development of deep learning, particularly CNNs, has significantly improved the effectiveness of image deblurring techniques. Recent methods that have advanced the field considerably include the deblur generative adversarial network (Deblur-GAN) [
10], which uses a generative adversarial network to produce high-quality deblurred images; the deep multi-patch hierarchical network (DMPHN) [
11], which processes overlapping patches through a hierarchical structure to handle non-uniform blurs; and the scale-recurrent network (SRN) [
12], which refines images at multiple scales for various blur levels. Despite the substantial progress these technologies have made in advancing image deblurring, they still face limitations in understanding image content and semantic information. While some advanced models can learn high-level features from images, they struggle to accurately comprehend objects and structures in complex or heavily blurred scenes.
By segmenting the image into meaningful regions, a segmentation mask is obtained, which can be used to facilitate a more detailed understanding and processing of the image content and structure by the network, thus tailoring the deblurring strategy to different regions. Krishnan et al. [
1] proposed a blind image deblurring method based on normalized sparsity measures. They utilize image segmentation techniques to partition the image into different regions and infer the blur kernel and clear image based on the sparsity of each region, thus achieving blind deblurring. However, it relies on relatively simple region partitioning. Luo et al. [
2] employed a superpixel segmentation prior to blind image deblurring. They proposed a method based on superpixel segmentation to assist in recovering clear images by utilizing the prior information from superpixel segmentation. This method first segments the input image into superpixels and then utilizes the consistency information within superpixels to guide the blind deblurring process, thereby improving the quality of deblurred results. Zhang et al. [
3] introduced a method for image deblurring using a three-stage intensity prior. In image deblurring, the intensity prior refers to the distribution of intensities (brightness) in different regions of the image. Traditional intensity priors often assume the existence of only two different intensity distributions in the image, namely background and foreground. However, they proposed a novel approach that divides the image into three different regions, and models the intensity distribution of each region separately, thereby enhancing the deblurring effect. While this partitioning method provides an innovative perspective, it appears somewhat limited in handling more diverse scenes and edge variations. Jin et al. [
7] introduced a method using grayscale encoding and channel expansion, which demonstrated practicality in low-level visual tasks. However, this approach showed some limitations in handling complex image content and fine edges. Although these methods use segmentation and similar methods as additional guidance for image deblurring training, they still have limitations.
To address the limitations of existing methods, we introduce EFE-CNA Net, which excels in capturing edges, enhancing image comprehension, and detecting high-frequency information for superior deblurring performance. The EFE-CNA Net adopts the SAM framework to generate segmentation masks and employs the EFE module to process these masks, which allows the network to prioritize areas with significant detail and accurately identify the location and intensity of the blur. The features from the blurred image are fused with the mask features using an image-mask decoder, and the combined features are then fed into the CNA Net for image recovery. This design enhances the model’s focus on distinct features, thereby addressing issues of insufficient edge handling and semantic perception in previous methods.
3. Approach
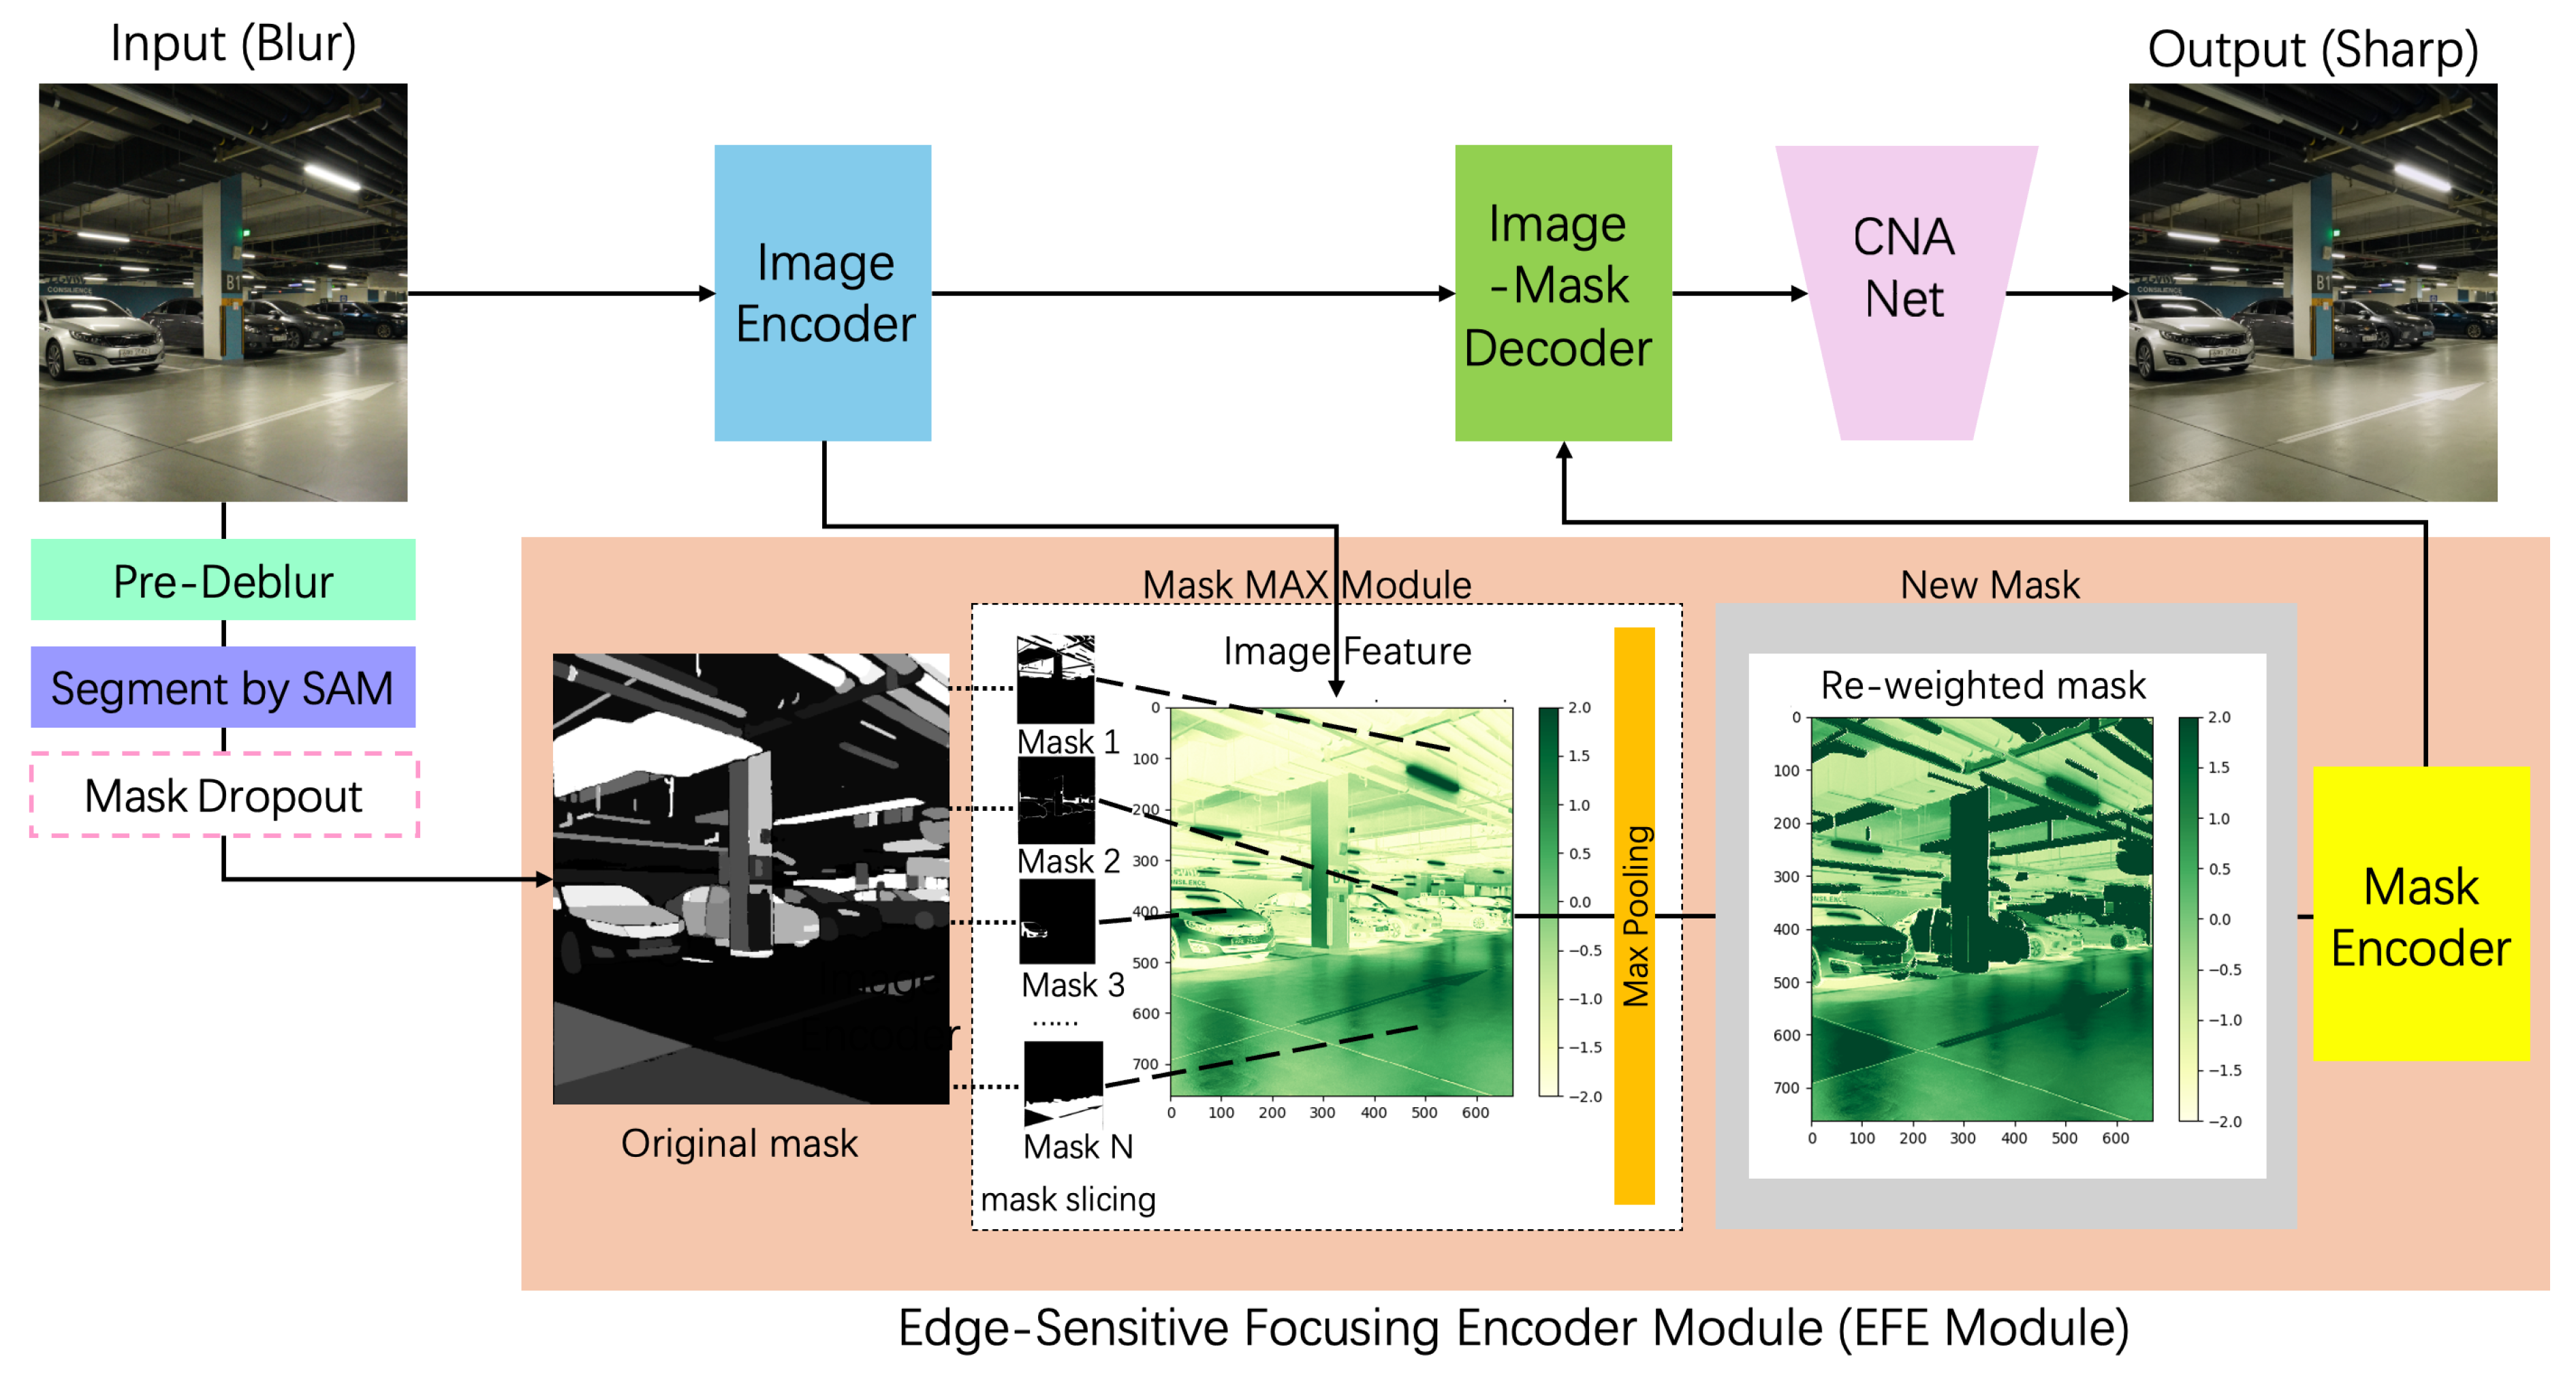
To address the challenge of blurred edges and improve the comprehension and analysis of image content and structure, we propose the EFE-CNA Net. The architecture of the EFE-CNA Net is shown in
Figure 1. The blurred image is first pre-processed and then segmented by SAM to obtain the mask. For the mask acquisition process, we employ an improved method called grouped masking. We slice the mask into multiple segments, with each slice representing a specific grayscale value. This differs from conventional approaches that group pixels based solely on grayscale values. By creating a unique mask for each grayscale value, we enhance precision and capture finer details. These mask slices incorporate multiple grayscale levels, providing a more nuanced and detailed representation of the image. This slicing approach allows us to accurately segment and analyze different regions of the image based on their grayscale levels. In the EFE module, the mask is fused with the blurred image information, reweighted, and calibrated features are obtained. These features are then fused with the original image features via the image-mask decoder, which combines the blurred image and the corresponding mask information. The image encoder, mask encoder, and image-mask decoder all use 3 × 3 convolutions. The structure of the image-mask decoder is obtained by concatenating the image decoder and the mask decoder. These inputs are fed into the deblurring model CNA Net to restore a clear image. In this work, we adopt a two-stage debulrring strategy in which the first stage uses the encoder and decoder structure for coarse processing, and the second stage uses CNA Net for fine processing. This kind of two-stage/multi-stage strategy could jointly promote the quality of image restoration and have been proven in many previous work [
13,
14].
3.1. EFE Module
To address the challenge of blurred edges, we introduce the EFE module, which enhances the understanding and processing of the image content and structure while tailoring deblurring strategies to different regions. The module employs mask slicing, a technique where the mask obtained from SAM is divided into smaller slices. Each slice is then multiplied with the features extracted by the image encoder and a max pooling operation is performed to aggregate these results, resulting in a calibrated mask. This refined mask directs the network’s attention toward critical regions, ensuring that even if certain areas are masked, important edge information remains clear.
The significance of mask slicing in our work lies in its ability to fine-tune the interaction between image information and segmentation masks. By breaking down the mask into slices, the EFE module can more accurately identify and emphasize regions with pronounced edge changes. This nuanced interaction enhances the network’s capacity to discern and preserve crucial edge details. Consequently, the network focuses more on these regions, leading to improved edge definition and overall image clarity.
Specifically, during training, the position of each mask slice is determined first. Each mask slice is then combined with features from the image encoder. The features extracted from the mask max module are re-weighted and aggregated to form new features, which are then further extracted by the mask max module. The pseudo-code of the EFE module is provided in Algorithm 1.
The re-weight process starts by determining the importance of each mask region through the sum of pixel values within that region, representing its weighted significance. Using this sum, we calculate both the maximum pixel value and the weighted sum of the pixel values within each region. The maximum pixel value for each mask region is then multiplied by the corresponding mask region to obtain the weighted image segment for that region. Next, we derive
by identifying and merging regions in the segmentation mask that are not occluded by other instances. The mask for the uncovered regions is calculated, ensuring values are restricted between 0 and 1. The maximum pixel value within the uncovered area is determined and multiplied by the corresponding mask area. This result is then added to the previously computed weighted image segments, enhancing the network’s ability to focus on significant regions and improve overall image quality.
| Algorithm 1 EFE module |
- Require:
Segment mask - Ensure:
Calculated the features in masks - 0:
Input: , where and - 1:
Initialize to 0 - 2:
(blur image) - 3:
if training then - 4:
Mask Dropout - 5:
- 6:
for each do - 7:
- 8:
- 9:
- 10:
end for - 11:
end if
|
3.2. CNA Net
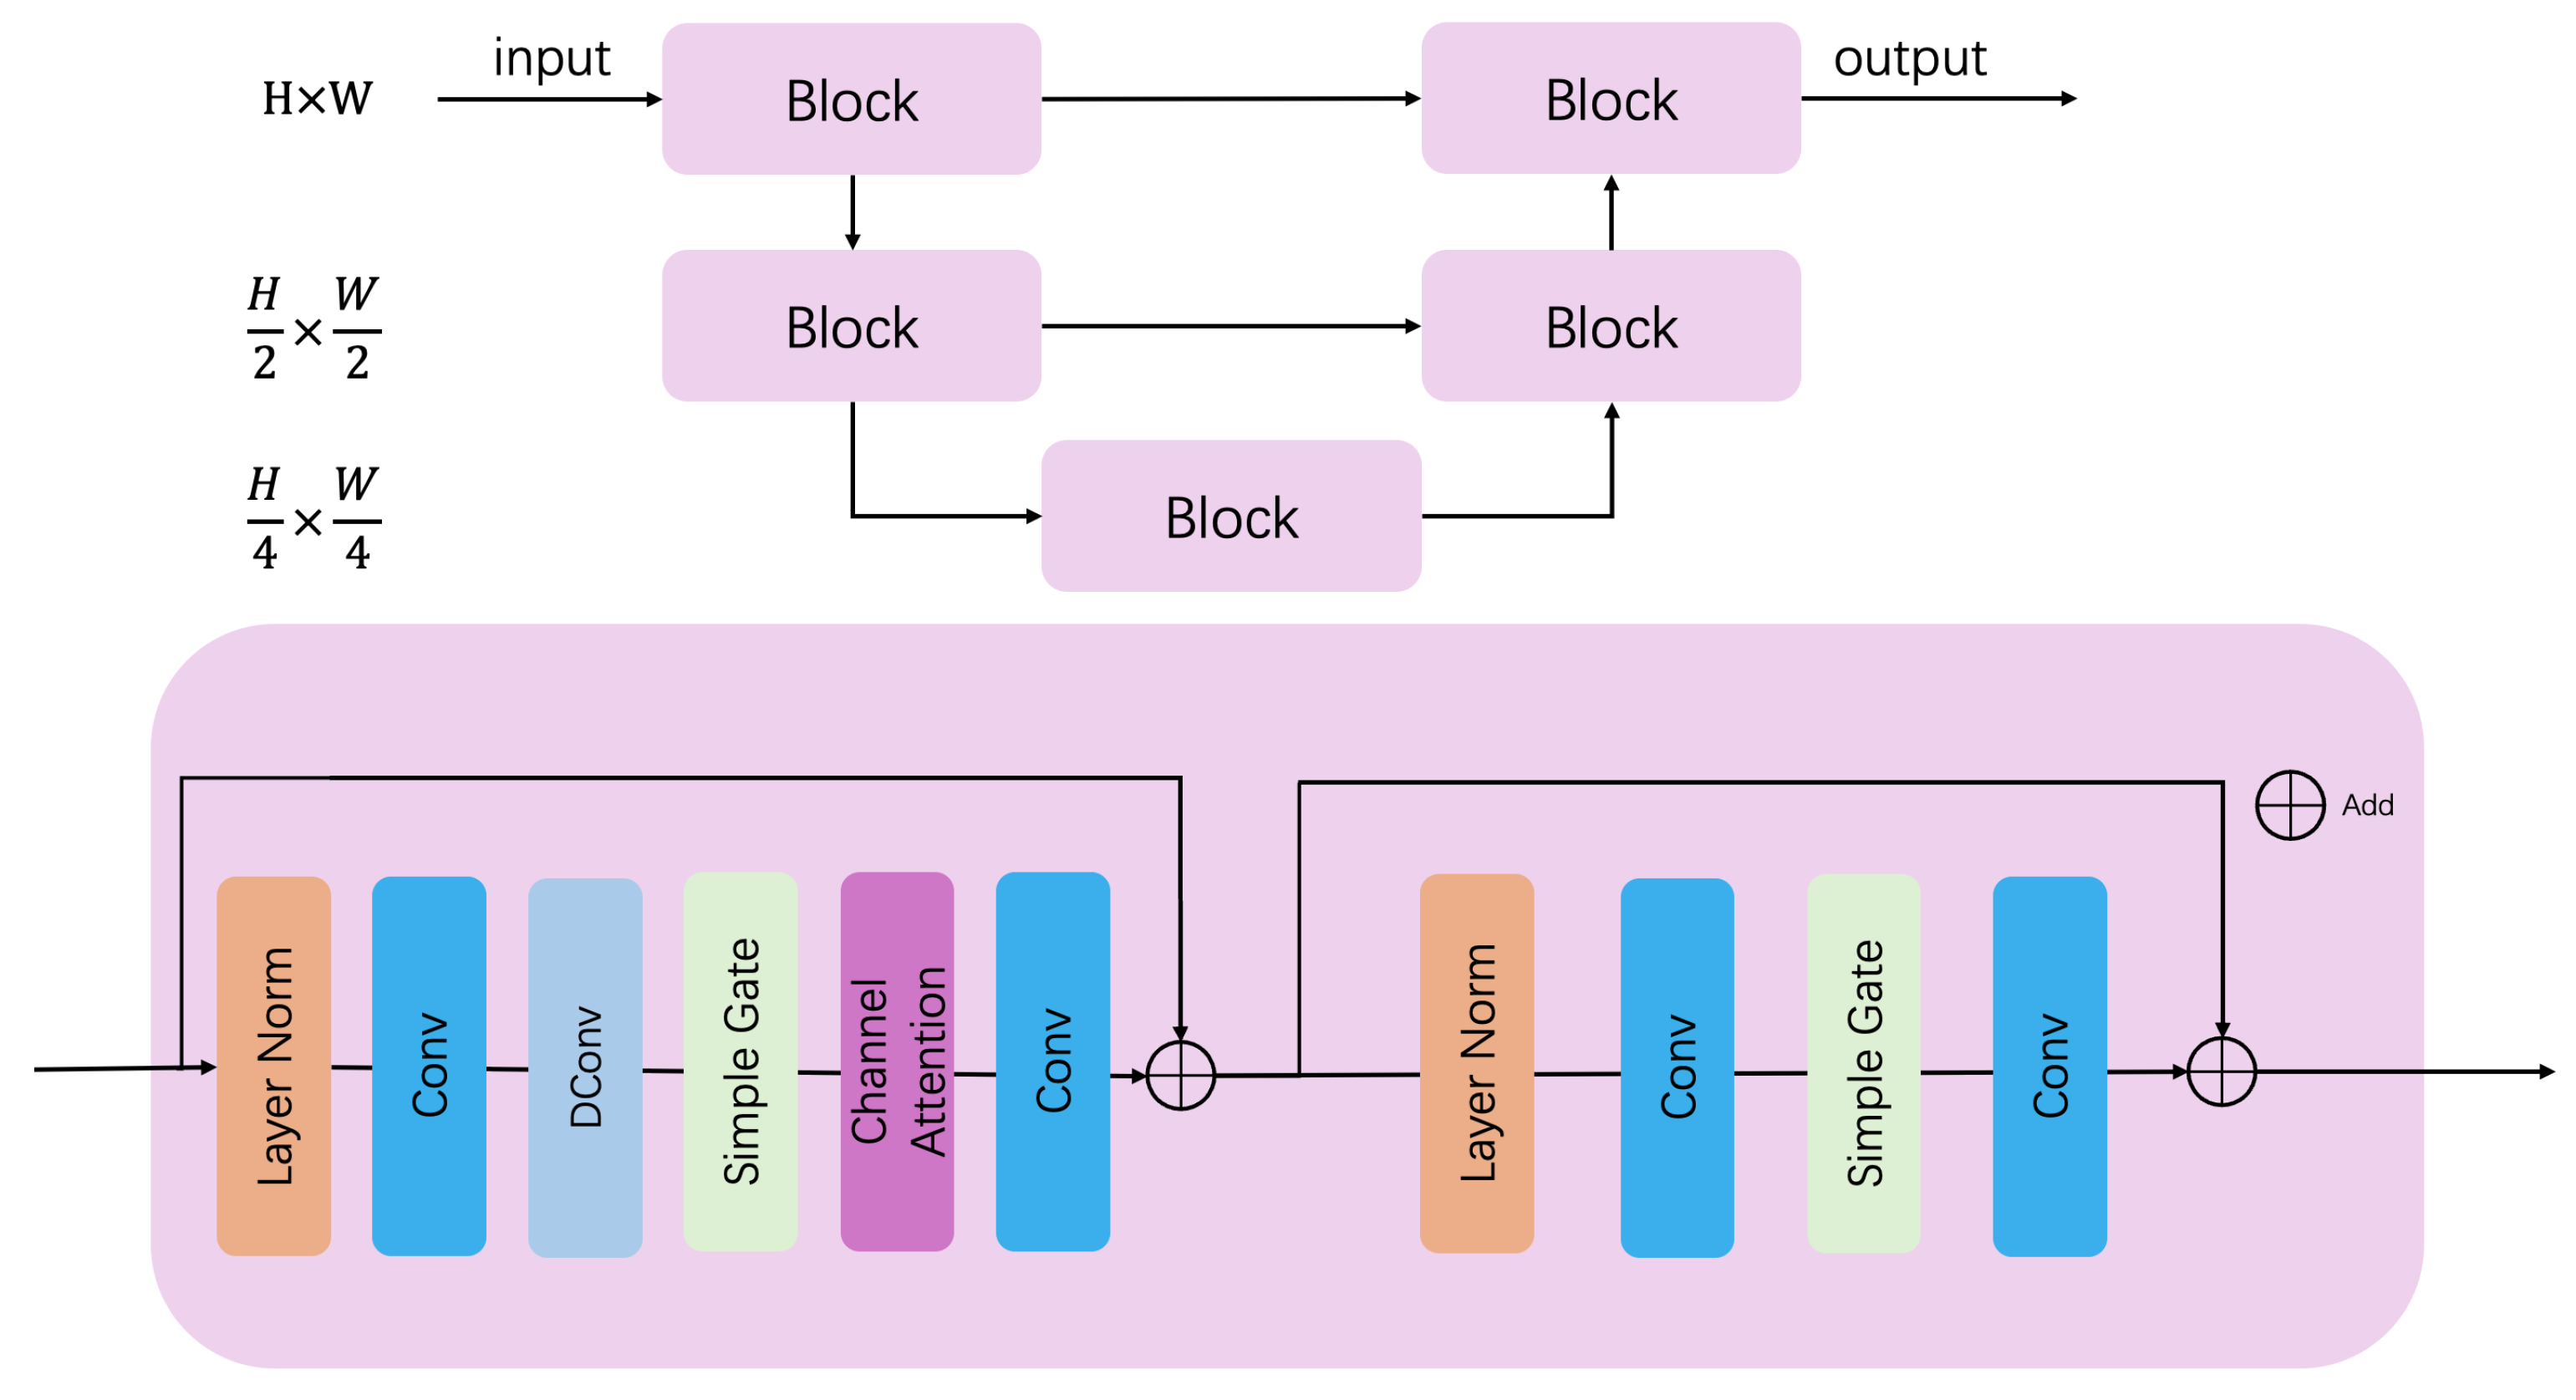
CNA Net, based on a U-Net [
15] backbone, incorporates convolution, normalization, gating, and attention mechanisms in CNA blocks. The architecture, depicted in
Figure 2, includes two downsampling and two upsampling layers with skip connections.
Each CNA block, shown at the bottom of
Figure 2, starts with layer normalization, followed by 1 × 1 convolution and 3 × 3 depth-wise convolution. Simple gating performs element-wise multiplication, and channel attention uses a single Conv and 1 × 1 convolution. The output is summed with the initial normalized features.
In the second stage, data undergo layer normalization and 1 × 1 convolution, without depth-wise convolution. Simple gating and another 1 × 1 convolution follow, with the final output summed with the initial normalized features.
3.3. Loss Function and Training
In this article, we utilize PSNR and SSIM to jointly assess image quality. The PSNR loss function primarily focuses on the peak signal-to-noise ratio of the image, while SSIM considers the structural similarity of the image, including brightness, contrast, and structural information. By simultaneously considering PSNR and SSIM, we can comprehensively evaluate the quality of image reconstruction, ensuring that the output image maintains both the accuracy of the structure and the consistency of visual perception while reducing distortion. The loss function is given by Equation (
1).
where
and
are the weights for the PSNR and SSIM losses, respectively. In our model, both weights are set to 0.5.
is defined as follows:
where
is the maximum possible pixel value of the image (e.g.,
for an 8-bit image), and
and
represent the pixel values at position
of the original and reconstructed images, respectively. A lower PSNR loss indicates a smaller mean squared error between the original and reconstructed images, thus indicating higher image quality.
is defined as follows:
where
and
are the means of the original and reconstructed images,
and
are the variances of the original and reconstructed images,
is the covariance between the original and reconstructed images, and
and
are constants for stability. A lower SSIM loss indicates a higher structural similarity between the original and reconstructed images.
To optimize the EFE-CNA network for enhanced image deblurring performance, we utilize the AdamW optimizer, which combines the backpropagation algorithm with gradient descent and incorporates weight decay to address potential overfitting issues. Our primary goal is to minimize both PSNR and SSIM losses. We employ cosine annealing to adjust the learning rate, starting with a default of and reducing it to . The model operates on 256 × 256 patches with a batch size of 32, and the training process involves a total of iterations.
Through iterative parameter tuning using this approach, the EFE-CNA Net can significantly improve image deblurring, resulting in clearer and more accurate image restoration.
4. Experiments
In this article, we utilize PSNR and SSIM as the primary metrics for evaluating the quality of the restored images. We conducted experiments on the RealBlur dataset and the REDS dataset.
4.1. Dataset
Our model is trained on the RealBlur dataset and the REDS dataset, both of which are publicly accessible resources specifically designed for deblurring tasks.
The RealBlur [
8] dataset consists of a collection of blurry images captured from real-world scenes, utilized for learning and evaluating deblurring algorithms. It comprises 4738 pairs of images from 232 different scenes. Each training set consists of 3758 image pairs, while each test set consists of 980 image pairs. The dataset is divided into two subsets based on the image acquisition format: the RAW format RealBlur-R subset and the JPEG format RealBlur-J subset.
The REDS (realistic and dynamic scenes) [
9] dataset provides realistic and dynamic scene data, including both video and image files, as well as images at both original and low resolutions. This dataset can be used for not only super-resolution research but also image and video deblurring studies. It consists of 300 video sequences with a resolution of 720 × 1280 pixels, each containing 100 frames. The training, validation, and test sets consist of 240, 30, and 30 videos, respectively. The image files in this dataset are extracted from the videos, with each image corresponding to a frame in the video. Thus, there are 24,000 images for training and 3000 images each for validation and testing.
Details of the datasets are in
Table 1.
4.2. Results
Table 2 presents the deblurring comparison results for the RealBlur-R dataset.
Table 3 displays the deblurring comparison results for the RealBlur-J dataset.
Table 4 shows the deblurring comparison results for the REDS dataset. The tables are sorted in ascending order of PSNR, and in the case of PSNR ties, they are further sorted in ascending order of SSIM. Our method is at the end.
As seen in
Table 2,
Table 3 and
Table 4, our method achieves effective results with different datasets. Although MAXIM-3S [
23] achieves the highest PSNR on the RealBlur-J dataset, which is 0.2% higher than ours, its SSIM is 3% lower than ours. Zhang et al. [
22] achieved the highest SSIM on the REDS dataset, surpassing ours by 4%; however, we outperformed their PSNR by 5%. Experiments show that our model is effective in deblurring.
4.3. Quality Experiments
In
Table 2,
Table 3 and
Table 4, we demonstrate the effectiveness and superiority of EFE-CNA Net on the RealBlur dataset and REDS dataset. Additionally, we conducted quality experiments to validate the superiority of our proposed method. We select a subset of models from the aforementioned models for comparison with our model, as shown in
Figure 3 and
Figure 4.
In quality experiments, the superior delineation of edges, the greater structural integrity, and the closer proximity to the GT image mean better image deblurring quality.
As seen in
Figure 3 and
Figure 4, although our method does not exhibit significant improvements in PSNR and SSIM compared to other methods, our images show considerable enhancement in detail when compared to those produced by other methods. For example, consider the image of the medical box in
Figure 3, we can see that the deblurred image from our method exhibits clear edges and visible contours, while the results from other methods do not. Images with clear and continuous contours have a higher quality of recovery.
5. Discussion
The experiment results show the effectiveness of our method. In this section, we conduct additional experiments to further demonstrate the usefulness of edge perception in deblurring tasks.
5.1. Effectiveness of Introducing Segmentation as Additional Guidance
The main improvement of the EFE-CNA network compared to the CNA network is the introduction of SAM as an additional guidance. For the better use of SAM, we specifically designed the EFE module for mask processing. In this section, we conduct experiments to evaluate the effectiveness of these modules from different perspectives. We compare the experimental results of EFE-CNA Net (with SAM) and CNA Net (without SAM) on different datasets. The specific data are shown in
Table 5.
From
Table 5, it can be seen that the use of SAM further improves the quality of image restoration, especially on the SSIM metrics. It can be confirmed that the introduction of segmentation can indeed enhance the comprehension of image content. We conducted experiments to evaluate the SAM framework, conducting quality experiments to validate the effectiveness of the SAM framework. Image quality comparisons are shown in
Figure 5. In quality experiments, the superior delineation of edges, the greater structural integrity, and the closer proximity to the GT image mean better image deblurring quality.
In
Figure 5, the outcome with SAM evidently resembles the GT image’s structure more closely compared to the outcome without SAM.
5.2. Evaluation of the EFE Module
In blurred regions, pixels with higher intensity typically represent brighter features or edges. Therefore, using the maximum value to represent the entire area highlights these brighter features and focuses the network on that portion, enhancing contrast and highlighting details within the blurred area.
We conducted experiments to evaluate the SAM framework and EFE module, conducting both quality experiments and experiments generating network perception feature heatmaps to validate the effectiveness of the combined SAM framework and EFE module. We compare the experimental results of the mask concatenate method (without the mask max module) and EFE-CNA Net (with the mask max module) on different datasets. The image quality comparison is presented in
Figure 6. The feature extraction heat map is presented in
Figure 7. Next, we will compare and evaluate the different modules in the EFE module. The results are shown in
Table 6.
From
Table 6, we find that EFE-CNA Net is better than mask concatenate.
In quality experiments, the superior delineation of edges, the greater structural integrity, and the closer proximity to the GT image mean better image deblurring quality. For example, in
Figure 6, in the license plate section, the characters can be clearly identified, indicating good image deblurring results.
In
Figure 7, through the heat map, we find that the effect of SAM alone (mask concatenate method) improves very little. However, after adding the EFE module, the EFE-CNA Net is more effective than the mask concatenate method.
5.3. Considerations for the Mask Max Module in the EFE Module
The reason for this is that training the model using the maximum value highlights key features, enhances the model’s perception of edges and details, reduces blurring, and makes the image clearer and easier to recognize. In contrast, using the average to represent the entire region results in the network perceiving fewer details and edges, as the average is influenced by all pixel values within the region, including less prominent features. Therefore, using the maximum value better highlights sharp features and edges in the blurred area.
Although using the maximum value may cause some information loss, especially when multiple salient features exist within a region, SAM segmentation effectively divides the region so that each segment does not contain multiple distinct salient features. The use of the mask max module in the EFE module eliminates the potential for information loss, making it highly effective.
We compare the experimental results of the EFE module with those of average pooling and max pooling methods on different datasets. The results are shown in
Table 7.
Figure 8 illustrates the various methods employed within the mask max module of the EFE module. These include the method without using the EFE module (CNA Net), the method that employs average pooling in the mask max module (Average), and the method that utilizes max pooling in the mask max module (MAX).
For example, in the license plate section of an image, the model needs to focus on learning the characters on the license plate. The average pooling method learns from the entire license plate, while the maximum pooling method not only learns from the whole license plate but also further focuses on the characters of the license plate.
Figure 8 demonstrates that the EFE module captures image details better with max pooling, whereas average pooling is less effective in preserving these details.
6. Limitations and Future Work
Although the combination of the SAM framework and the EFE module provides significant assistance and guidance in image deblurring, there are still some limitations in practical applications. For instance, in handling extreme lighting conditions or highly complex dynamic scenes, there is room for improvement in deblurring effects due to inaccurate segmentation, particularly in processing edges and details. For blurry images, SAM sometimes does not handle them well.
In the future, to address the segmentation accuracy issue, we will explore the integration of multidimensional data (like spatiotemporal information) to enhance the precision of image segmentation. Additionally, to tackle the blurring problem in dynamic scenes, future research will explore deblurring models that combine temporal information, temporal prediction, and the SAM framework to better handle blurring in complex dynamic scenarios. In addition, we will propose an evaluation mechanism to assess the confidence of SAM segmentation results. Then we will dynamically adjust the strategy of deblurring processing according to the evaluated confidence level.
7. Conclusions
In this article, we propose EFE-CNA Net, which leverages SAM and utilizes masks to guide image deblurring, addressing the issue of poor object edge perception in traditional deep learning deblurring networks. SAM segmentation and the EFE module can make the network effectively perceive the content information of the image, perceive the edge of the object, and highlight the key information by recalculating the weight. The well-designed image mask decoder effectively combines the information of the blurred image and the segmentation mask, so that the network pays more attention to the key features, to achieve the purpose of guiding the image deblurring. Through experiments, we find that the use of max pooling in the mask max module of the EFE module is more effective than the use of average pooling. Due to the introduction of SAM, the perception of blurred edges of objects can be improved to a certain extent while still distinguishing objects from objects, which is why the use of max pooling enables the network to perceive regions better than average pooling, allowing the network to perceive regions better.


