
The Method of Elementary Solvers in SPICE


Abstract
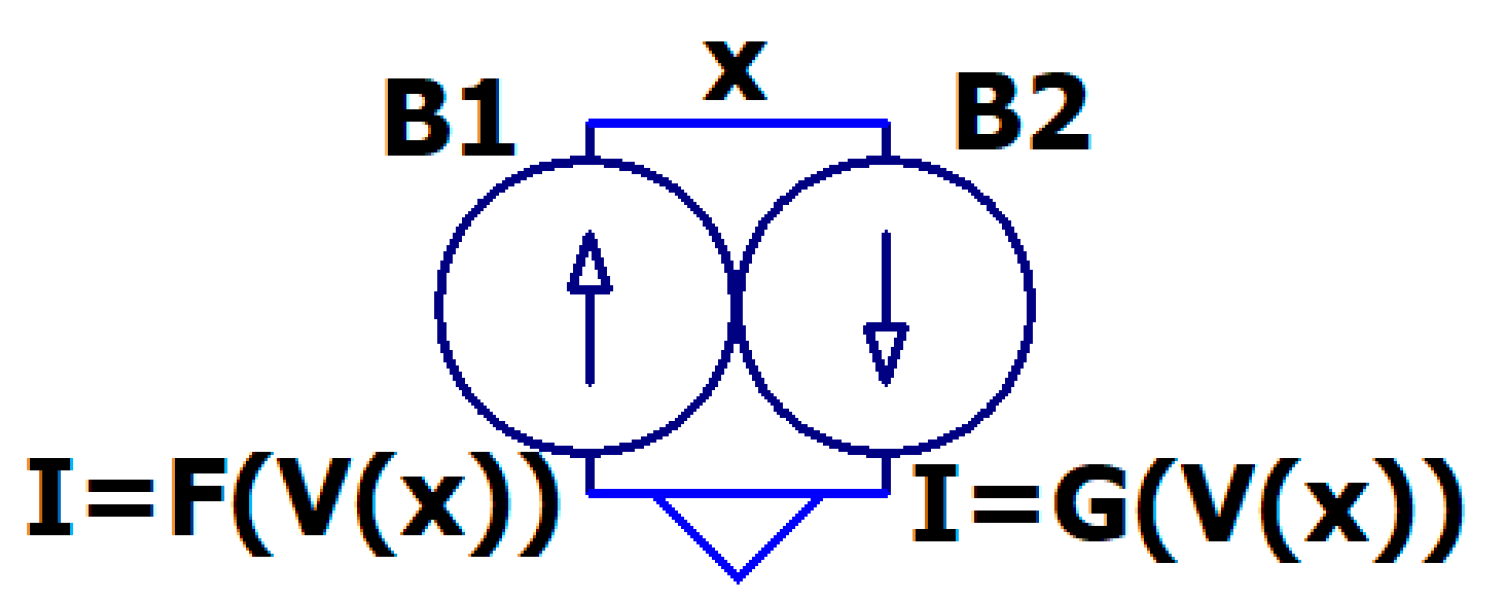
1. Introduction
2. Selected Examples
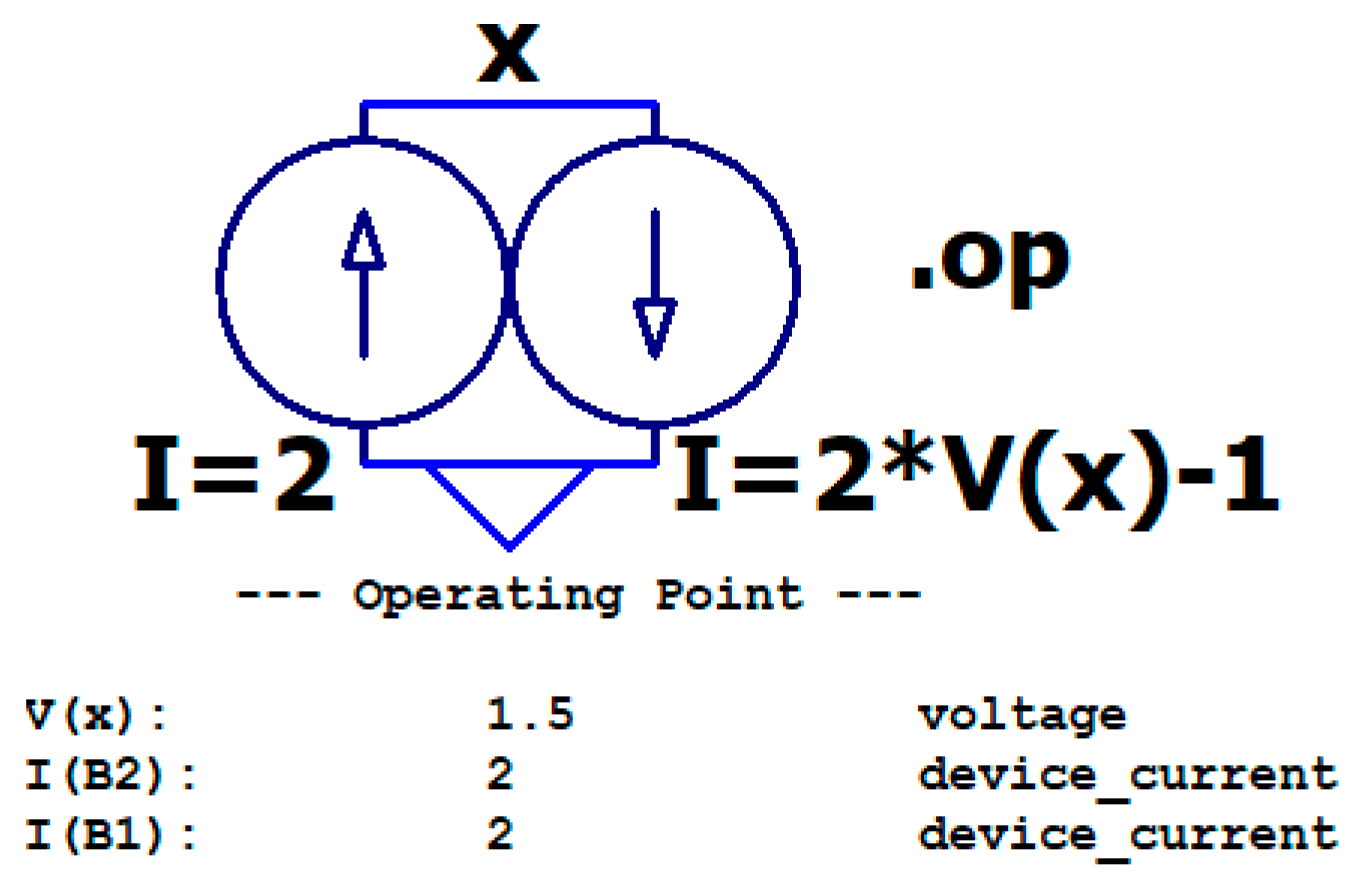
2.1. Solution of a Nonlinear Equation: Lambert W Function
2.2. Analysis of a Function: Polynomial Case
2.3. Indirect Integration: Gamma Function
2.4. Recursion: Explicit Newton–Raphson Method
2.5. System of Linear Equations: Matrix Inversion
2.6. System of Nonlinear Equations: Optimum Solution
2.7. First-Order Autonomous Differential Equation: Newton’s Law of Heat Transfer
2.8. First-Order Non-Autonomous Differential Equation: Redefinition of the Time Coordinate
2.9. Delayed Differential Equation: Logistic Model
2.10. First-Order Integro-Differential Equation: When Integrals and Derivatives Meet
2.11. Second-Order Differential Equation: Harmonic Oscillator
2.12. Differential Equation with Control Parameter: Frequency-Dependent Memristor Model
2.13. System of Nonlinear Differential Equations: Lotka–Volterra Model
2.14. Recurrence Relation: Logistic Map
2.15. System of Nonlinear Differential Equations: SIR Model with Vital Dynamics
2.16. System of Nonlinear Differential Equations: Lorenz Model
2.17. Discrete Fractal Curve: 2D Random Walk
2.18. Parabolic Partial Differential Equation: 1D Heat Equation
2.19. Hyperbolic Partial Differential Equation: 1D Wave Equation
2.20. Stochastic Differential Equation: Ornstein–Uhlenbeck Process
2.21. Control System: When Physics Meets Mathematics Meets Electronics
3. Conclusions
Supplementary Materials
Funding
Data Availability Statement
Acknowledgments
Conflicts of Interest
References
- Zueco, J. An electric simulator to solve education engineering problems in fluid mechanics. Comp. App. Eng. Educ. 2013, 21, 748–757. [Google Scholar] [CrossRef]
- Alfaki, H.; Dauda, M.; Gimba, A.; Ahmed, M. On modelling and simulation of electric circuit problems. Malays. J. Com. Appl. Math. 2020, 3, 21–26. [Google Scholar] [CrossRef]
- Xie, Z.; Harrison, S.; Torti, S.; Torti, F.; Han, J. Application of circuit simulation method for differential modeling of TIM-2 iron uptake and metabolism in mouse kidney cells. Front. Physiol. 2013, 4, 52725. [Google Scholar] [CrossRef] [PubMed]
- Madec, M.; Lallement, C.; Haiech, J. Modeling and simulation of biological systems using SPICE language. PLoS ONE 2017, 12, e0182385. [Google Scholar] [CrossRef] [PubMed]
- Available online: https://www.analog.com/en/design-center/design-tools-and-calculators/ltspice-simulator.html (accessed on 1 January 2023).
- Gilles, B. The LTSpice XVII Simulator: Manual, Methods and Applications; Würth Elektronik: Niedernhall-Waldzimmern, Germany, 2022. [Google Scholar]
- Asadi, F. Essential Circuit Analysis Using Ltspice; Springer: Cham, Switzerland, 2023. [Google Scholar] [CrossRef]
- May, C. Passive Circuit Analysis with Ltspice; Springer: Cham, Switzerland, 2020. [Google Scholar] [CrossRef]
- Svoboda, J. Ltspice for Linear Circuits; Wiley: Hoboken, NJ, USA, 2023. [Google Scholar]
- Corless, R.M.; Gonnet, G.H.; Hare, D.E.G.; Jeffrey, D.J.; Knuth, D.E. On the LambertW function. Adv. Comput. Math. 1996, 5, 329–359. [Google Scholar] [CrossRef]
- Winitzki, S. Uniform Approximations for Transcendental Functions. In Computational Science and Its Applications—ICCSA 2003; Kumar, V., Gavrilova, M.L., Tan, C.J.K., L’Ecuyer, P., Eds.; Lecture Notes in Computer Science; Springer: Berlin/Heidelberg, Germany, 2003; Volume 2667. [Google Scholar] [CrossRef]
- Chen, C. A more accurate approximation for the gamma function. J. Number Theory 2016, 164, 417–428. [Google Scholar] [CrossRef]
- Yang, Z.; Tian, J. An accurate approximation formula for gamma function. J. Inequalities Appl. 2018, 2018, 56. [Google Scholar] [CrossRef] [PubMed]
- Deuflhard, P. Newton Methods for Nonlinear Problems. Affine Invariance and Adaptive Algorithms; Springer Series in Computational Mathematics; Springer International: Berlin/Heidelberg, Germany, 2004; Volume 35. [Google Scholar]
- Grockenbach, M.; Schmidtke, K. Newton’s law of heating and the heat equation. Involve 2009, 2, 419–437. [Google Scholar] [CrossRef]
- Kashchenko, S. Asymptotics of the solutions of the generalized Hutchinson equation. Autom. Control Comput. Sci. 2013, 47, 470–494. [Google Scholar] [CrossRef]
- Guckenheimer, J.; Myers, M.; Sturmfels, B. Computing Hopf Bifurcations I. SIAM J. Numer. Anal. 1997, 34, 1–21. [Google Scholar] [CrossRef]
- Chua, L. Resistance switching memories are memristors. Appl. Phys. A 2011, 102, 765–783. [Google Scholar] [CrossRef]
- Aguirre, F.L.; Suñe, J.; Miranda, E. SPICE implementation of the dynamic memdiode model for bipolar resistive switching devices. Micromachines 2022, 13, 330. [Google Scholar] [CrossRef] [PubMed]
- Bartlett, M.; Hiorns, R.W. Mathematical Theory of the Dynamics of Biological Populations: v.1; Academic Press Inc.: Cambridge, MA, USA, 1973; Volume I. [Google Scholar]
- May, R.M. Simple mathematical models with very complicated dynamics. Nature 1976, 261, 459–467. [Google Scholar] [CrossRef] [PubMed]
- Okabe, Y.; Shudo, A. A mathematical model of epidemics—A tutorial for students. Mathematics 2020, 8, 1174. [Google Scholar] [CrossRef]
- Lorenz, E.N. Deterministic nonperiodic flow. J. Atmos. Sci. 1963, 20, 130–141. [Google Scholar] [CrossRef]
- Peitgen, H.; Jurgens, H.; Saupe, D. Chaos and Fractals; Springer: New York, NY, USA, 2004. [Google Scholar]
- Popov, S. Two-Dimensional Random Walk; Cambridge University Press: Cambridge, UK, 2020. [Google Scholar]
- Carslaw, H.S.; Jaeger, J.C. Conduction of Heat in Solids, Oxford Science Publications, 2nd ed.; The Clarendon Press, Oxford University Press: New York, NY, USA, 1988; ISBN 978-0-19-853368-9. [Google Scholar]
- Oksendal, B. Stochastic Differential Equations: An Introduction with Applications, 6th ed.; Springer Science & Business Media: Berlin/Heidelberg, Germany, 2013. [Google Scholar]
- Scott, D. Box-Muller transformation. WIREs Comput. Stat. 2011, 3, 177–179. [Google Scholar] [CrossRef]


| Method | Directive to Disable |
|---|---|
| Direct Newton Iteration | .options noopiter |
| Adaptive Gmin Stepping | .options gminsteps = 0 |
| Adaptive Source Stepping | .options srcsteps = 0 |
| Pseudo Transient | .options ptrantau = 0 |
Disclaimer/Publisher’s Note: The statements, opinions and data contained in all publications are solely those of the individual author(s) and contributor(s) and not of MDPI and/or the editor(s). MDPI and/or the editor(s) disclaim responsibility for any injury to people or property resulting from any ideas, methods, instructions or products referred to in the content. |
© 2024 by the author. Licensee MDPI, Basel, Switzerland. This article is an open access article distributed under the terms and conditions of the Creative Commons Attribution (CC BY) license (https://creativecommons.org/licenses/by/4.0/).
Share and Cite
Miranda, E. The Method of Elementary Solvers in SPICE. Electronics 2024, 13, 2480. https://doi.org/10.3390/electronics13132480
Miranda E. The Method of Elementary Solvers in SPICE. Electronics. 2024; 13(13):2480. https://doi.org/10.3390/electronics13132480
Chicago/Turabian StyleMiranda, Enrique. 2024. "The Method of Elementary Solvers in SPICE" Electronics 13, no. 13: 2480. https://doi.org/10.3390/electronics13132480
APA StyleMiranda, E. (2024). The Method of Elementary Solvers in SPICE. Electronics, 13(13), 2480. https://doi.org/10.3390/electronics13132480