Abstract
In the food industry, ensuring product quality is crucial due to potential hazards to consumers. Though metallic contaminants are easily detected, identifying non-metallic ones like wood, plastic, or glass remains challenging and poses health risks. X-ray-based quality control systems offer deeper product inspection than RGB cameras, making them suitable for detecting various contaminants. However, acquiring sufficient defective samples for classification is costly and time-consuming. To address this, we propose an anomaly detection system requiring only non-defective samples, automatically classifying anything not recognized as good as defective. Our system, employing active learning on X-ray images, efficiently detects defects like glass fragments in food products. By fine tuning a feature extractor and autoencoder based on non-defective samples, our method improves classification accuracy while minimizing the need for manual intervention over time. The system achieves a 97.4% detection rate for foreign glass bodies in glass jars, offering a fast and effective solution for real-time quality control on production lines.
1. Introduction
The problem of detecting defects, especially foreign bodies and glass fragments in glass jars, poses a significant challenge for the food industry. Foreign bodies can include materials such as glass, metal, plastic, or wood, which pose potential consumer risks. For example, glass fragments can easily mix with the contents of jars, leading to injury during consumption. Similarly, foreign metal bodies can cause poisoning or injury. Traditional quality control methods may be insufficient to detect subtle contaminants from different materials, especially in the case of products in glass jars, where foreign bodies may be too complex to notice with the naked eye. Additionally, different types of foreign bodies may require different methods (for example, detection using an inductive sensor will not detect contaminants made of plastics, and ultrasonic methods may not work for, e.g., vegetables in brine). Therefore, it is necessary to use advanced technologies, such as X-ray image analysis supported by artificial intelligence, to effectively detect these defects and ensure the safety of food products for consumers. The novelty in this article is the application of active learning in the feature extractor from X-ray images while maintaining the prediction speed requirements for samples.
This article focuses on the problem of detecting foreign bodies in glass jars, particularly glass contaminants. The article’s structure is as follows: The first section describes known methods of detecting foreign bodies in food products. Next, the initial feature extractor system with an autoencoder is described. The section then describes the active learning module, with which the system has been expanded. Then, the research results are presented, and a discussion of the results and a comparison with other methods are provided. The article concludes with a summary and presentation of future work.
1.1. Related Work
1.1.1. Challenges in Detecting Defects in Food Products
Foreign bodies in food can be divided into organic and inorganic materials. The former include bones, teeth, nails, splinters, wood, hair, seeds, fur, etc., whereas the latter include metals, glass, plastic, stones, etc. All of these can be equally dangerous; thus, they must be detected [1]. As a rule, these foreign bodies are characterized by different physical properties, especially in the area of electromagnetic and mechanical wave absorption. This requires the detection system to be versatile, since it is impossible to predict all possible instances of contamination in products [2,3].
The tasks of foreign body detection can also be divided based on whether optical methods in the visible spectrum can be applied. For example, the former applies in cases of transparent contents and packaging or before product packaging, e.g., when the product is laid out on a conveyor belt. Cases in which visual methods in the visible spectrum cannot be applied concern non-transparent packaging (milk cartons), large dimensions, non-transparent products (jams and sauces), or the situation when the volume of the product is large enough that defects may be invisible close to the packaging surface (ready meals) or when the product itself is heterogeneous (preserved vegetables) [4]. Another division of foreign body detection methods is the moment of control: before or after packaging. Naturally, the most significant advantage of pre-packaging inspection is the ease of detecting contaminants, because there is no need to use methods that penetrate the packaging. On the other hand, post-packaging control is final, meaning that there is certainty that no further contamination will occur [5].
Despite the popularity of glass packaging, manufacturers must ensure that there is no risk of contaminants from glass in the products. In the 2016/17 season, 5% of incidents reported to the U.K. Food Standards Agency were due to the presence of foreign bodies, including glass. The number of product recalls may be low. However, the consequences can be fatal or life-changing for consumers, with long-lasting consequences for all businesses involved in the supply chain [6].
The appropriate method for detecting foreign bodies depends on various factors, such as the product type, production scale, costs, and the required accuracy level. Contemporary technologies based on artificial intelligence are increasingly becoming an essential element of quality control systems, enabling precise and efficient detection of defects, including foreign bodies, thereby improving the safety and quality of food products.
1.1.2. Quality Control Methods
Optical Sorting: This technique utilizes optical systems to identify contaminants based on their shape, size, color, or structure. Advanced cameras and algorithms analyze the product’s image and detect contaminants that deviate from the norm. For example, fruit-sorting machines can remove fruits with contaminants such as seeds, branches, or other foreign elements. These methods include human eye inspection and RGB camera inspection [4,7,8,9,10,11,12].
Magnetic Sorting: This method uses strong magnets to extract metal foreign bodies from food products. If a metal inclusion is present in the product, such as a wire fragment or metal part, the magnetic attraction force allows for its capture [2].
Vibratory Sieves: This is a simple technique in which the product is sifted through a vibratory sieve with specified size openings. Foreign bodies larger than these openings are retained on the sieve while the product passes through unhindered. This method is mainly used in the flour industry or grain-based products [1].
Light-based Detection Techniques: Various substances in food products can be identified by utilizing different properties of light, such as absorption, scattering, or fluorescence. For example, spectroscopy techniques can analyze the spectral profile of light and detect the presence of foreign substances based on characteristic absorption or fluorescence patterns. These methods include spectroscopy, hyperspectral cameras, and X-ray imaging techniques [7,13,14,15,16,17,18,19,20].
Ultrasonics: This method uses ultrasonic waves to scan the product and detect invisible contaminants. Ultrasonics can penetrate food substances and detect differences in density, allowing for the identification of foreign bodies. This is particularly useful for quality control of packaged products, where other methods may be limited, such as in milk or other liquids like olive oil [21,22].
Inductive and Capacitive Sensors: This method detects deviations from changes in the electric field or capacitance when the product passes through. However, this method can only detect contaminants with ferromagnetic or dielectric properties.
X-ray Techniques: The application of X-ray imaging methods allows for overcoming a range of disadvantages of other detection methods, although it has drawbacks [23,24,25,26,27,28]. The key features of X-ray imaging in quality control include high sensitivity, a wide range of detection, automation of the process, and versatility in detecting various types of foreign bodies, not just inorganic ones but also other defects like cracks, voids, density changes, or irregularities in food products. Despite its high sensitivity, some materials may be challenging to detect using X-rays, especially those with densities similar to those of food products. Additionally, the high cost of X-ray equipment and safety concerns regarding radiation exposure for personnel are notable drawbacks.
In conclusion, despite these limitations, X-ray-based methods for detecting foreign bodies in food products remain one of the most effective quality control tools, capable of ensuring high quality and safety standards for food products consumed by consumers.
1.1.3. Detection of Glass Fragments in Glass Packaging
The problem of detecting glass fragments in glass packaging is challenging, especially in jars, because all physical properties of foreign objects are identical to those of the packaging itself. Whereas inclusions made of metal, wood, or stone are easily visible in X-ray images, glass shards are much less distinct. This issue has been recognized for a long time [29], with earlier publications indicating its difficulty [2]. In a study [30], ultrasound was used to detect glass shards, but this study pertains to the medical field rather than the industry. Some efforts to detect glass in food using thermographic methods have been described in [7]. Research on detecting defects in glass packaging has been undertaken in [31,32,33], but these studies do not specifically address foreign glass bodies. One work [34] describes an ultrasonic method for detecting glass in beer bottles, but this method may not apply to jars of pickled vegetables due to the heterogeneous contents. The detection of glass using Compton scattering of X-rays has been described in [35], and promising results have been achieved for glass submerged in water. However, this approach does not consider the issue of X-ray penetration through the packaging. Attention has been drawn to the problem of detecting transparent glass in transparent bottles in the wine industry [36]. Commercial implementation of a system for detecting glass in glass packaging can be found in [6,37], but only the former directly addresses the solution for detecting glass within glass.
From the above, the problem of detecting glass fragments in glass packaging is not adequately addressed and remains a challenge.
1.1.4. Classification of Inclusions vs. Anomaly Detection
In image processing, object detection, classification, and anomaly detection fundamentally differ in their goals and approaches [38]. Object detection and classification focus on identifying and locating specific objects in an image or data, using machine-learning techniques to assign appropriate labels or categories [39,40]. On the other hand, anomaly detection focuses on identifying abnormal or atypical patterns that deviate from the norm without specific object classes, using machine-learning techniques to detect deviations from expected behaviors [41,42,43]. Both approaches have different goals and strategies but utilize similar machine-learning tools.
Both object detection and classification, as well as anomaly detection, have their advantages and disadvantages. Object detection and classification enable precise localization and identification of specific objects. However, this can be challenging in the case of a large variety of objects or complex scenarios. The main disadvantage of classification is the need for a complete representation of all defects in the training set, which requires preparation of such data before network training. Acquiring faulty data is always a problem in production facilities, as the data need to be intentionally obtained, resulting in production downtime to acquire faulty data. On the other hand, anomaly detection can identify unexpected or harmful phenomena that may be difficult to predict. However, it can generate many false alarms (over-detections) and require much training data to develop versatile norm patterns.
In the use of neural networks in defect classification tasks and anomaly detection, it is noteworthy that the former method requires the use of a more complex network for object classification (e.g., YOLOv4-8, Faster R-CNN, GroundingDINO, Co-DETR) [44,45], whereas the latter method can use a simpler network for image classification (EfficientNetV2, MobileNetV2, ResNet50, AlexNet, etc.) [46,47].
Object detection involves identifying and locating objects in an image and classifying their types. This works by determining frames around objects and assigning labels to them, meaning that object detection algorithms recognize objects and determine their location in the image [48]. This method is more versatile, as it detects multiple objects of different types in a single image. However, it may be more computationally demanding and time-consuming than image classification. Additionally, more training data are required to learn to recognize different types of objects in different contexts.
Image classification involves assigning specific categories or classes to entire images. The image classification model does not deal with identifying and locating objects in the image but instead recognizes the overall context of the image and assigns it an appropriate label [49,50,51]. This method is more straightforward and may be more computationally efficient than object detection, especially for single objects in an image. However, it may not be sufficiently compelling if images contain multiple objects of different types, because the image classification model cannot provide information about the location and identification of individual objects.
In the case of industrial systems operating in real time, the inference speed for a single sample is crucial to catch faulty products before they reach palletization. Model simplicity is another advantage, as it shortens the time for tuning model hyperparameters, resulting in faster system deployment in production.
For the above vital reasons, the decision was made to utilize an image classification model in anomaly detection. In other words, the neural network classifies the entire image as good or faulty without specifying, for example, the defect’s nature, the foreign body’s material, or its exact location. Although information about the nature of the inclusion could help determine where it came from to prevent such incidents, the speed of deployment and inference time are more critical in production applications, and inclusion classification is rarely used in industry practice.
1.1.5. Anomaly Detection
Artificial intelligence-based anomaly detection methods use data analysis to identify abnormal or atypical patterns that deviate from the norm [52,53,54]. In this approach, models learn to represent normal behaviors or characteristics based on available training data, allowing them to detect observations that significantly differ from those patterns. Various techniques can be used, including supervised, unsupervised, and semi-supervised methods [55]. Supervised methods utilize data containing labels, enabling model training based on normal and anomalous examples. Unsupervised methods involve identifying anomalies without using labeled training data, which can be helpful in the case of a lack of access to appropriately labeled data. Meanwhile, semi-supervised methods combine labeled and unlabeled data, allowing for anomaly detection with less labeling effort.
In industrial practice, the easiest method to apply is anomaly detection with unsupervised learning. The most significant advantage of this method is that it only requires non-faulty training data, which can be obtained without interrupting production. A relatively small amount of faulty data only are needed for model validation.
1.1.6. Active Learning
Active learning in neural networks is an approach in which the model can select examples it wants to process or learn from. This approach is beneficial in cases of limited computational resources or training data, as it allows the model to more efficiently utilize these resources by focusing on the most valuable examples [56,57,58].
There are several variations of active learning in neural networks, including:
- Active search: The model actively seeks examples from different classes that are most confusing or difficult to classify. By asking questions about new examples, the model can effectively learn to distinguish between different classes more efficiently [59].
- Active reinforcement: The model actively interacts with the environment, making decisions and observing their consequences. Through exploration and selecting actions with the most significant potential for reinforcement, the model can learn effective strategies or policies more quickly [60].
- Active query learning: The model decides which examples it wants to know about and then requests labels for those examples. This process allows for the selective gathering of information, focusing on areas most challenging or relevant to the model. This method has two combinations: one can use data close to the decision boundary (i.e., the most doubtful: usually, near this boundary, there is a mix of good and faulty classes) or data far from the decision boundary (this way, the model reinforces its knowledge based on samples it is most confident about when classifying) [61].
In this work, the query learning approach was utilized, meaning the selection of samples is based on the distance from the decision boundary.
This study focuses on detecting inclusions in glass jars containing pickled cucumbers using anomaly detection. Particular emphasis is placed on detecting glass shards. The anomaly detector is based on a model for image classification (as opposed to object detection in images). Since the effectiveness of anomaly detection on production data using the existing system has not been satisfactory so far (ranging between 85 and 95%), we decided to use the active learning method to improve classification.
2. Materials and Methods
2.1. Description of the Current System’s Operation
In the publication cited in [62], a system successfully operating on multiple production lines from various fields was described. This system classifies tablets in blister packs, bottle caps, and defects on wooden boards. It is characterized by ease of implementation, fast operation, and high detection effectiveness. However, the application of anomaly detection in food jars using X-ray images proves to be insufficient. There are many instances of False Negatives and False Positives. Hence, a need arose to modify the system to maintain its advantages while increasing its effectiveness. Therefore, first, we will describe the current system’s architecture and then indicate where exactly the new contribution of this publication lies.
Our anomaly detection system consists of a feature extractor, a feature processing block, and an autoencoder. The feature extractor is responsible for extracting relevant information from the input image. We utilize a pre-trained CNN to obtain well-generalized features. The next step is feature scaling, which standardizes the extracted features, ensuring they are at the same level. The scaled features are then passed to the autoencoder, which reconstructs the input features. Finally, the reconstruction loss is computed as the difference between the input and reconstructed features. The reconstruction loss value is treated as the anomaly score. Image classification is performed based on the value of the reconstruction loss. Our previous system’s training was limited to setting the parameters of the feature scaler and training the autoencoder, enabling fast training on devices with limited computational power. The previous system’s operation scheme is depicted in Figure 1. Now, there is additional step after the calculating reconstruction loss, which collects every ambiguous sample. After some time, those uncertain samples are used to fine-tune the feature extractor to make predictions more accurate and reduce the amount of the samples being on the border of the classes. The process is iterative—after the fine tuning, there might be other ambiguous samples, which can be used for subsequent fine tuning. Each iteration improves overall system accuracy.

Figure 1.
Operational diagram of the anomaly detection system.
2.1.1. Feature Extractor
The feature extractor’s task is to extract essential information from the input image. Our system utilizes the architecture of the MobileNetV2 CNN as the foundation. We employ an instance of MobileNetV2, pre-trained on the ImageNet dataset. The primary goal of MobileNetV2 is classification; to leverage its feature extraction capabilities, we discard the model’s last 12 (top) layers. This way, the 12th layer from top becomes the output layer (Figure 2), so the output shape now assumes values of (7, 7, 160).
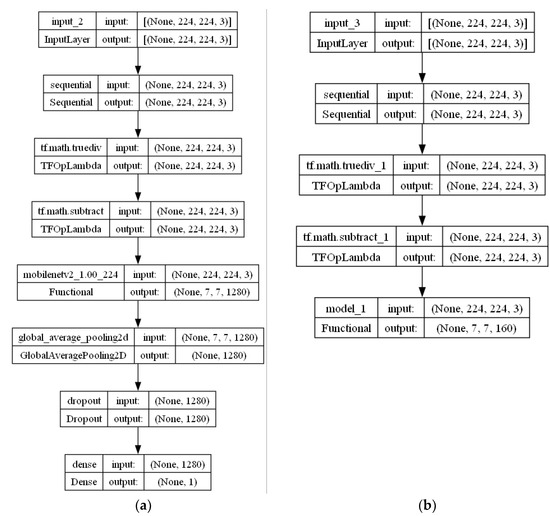
Figure 2.
MobileNetV2 network architecture. The full network adapted for training is presented in (a), with the preprocessing and data augmentation layers at the beginning, then the internal MobileNetV2 model, and finally, the pooling, dropout, and dense layers added. The architecture of the feature extractor is presented in (b). It was created by cutting off the last 12 layers of the model on the left (also counting the hidden sub-layers of mobilenetv2_1.00_244, of which there are 154—therefore, they are not shown in the diagram). In this way, a model with the output (7, 7, 160) was obtained. Layer model_1 has 146 hidden layers copied from the MobileNetV2 model.
2.1.2. Feature Processing
Assuming an input shape of (224, 224, 3) for the CNN, the features extracted from it are initially organized into a tensor structure with dimensions of 7 × 7 × 160. This tensor retains spatial information that is not necessary at this particular stage. As a result, we perform a flattening operation, transforming the tensor into a vector with a dimensionality of 7840. The next step is feature normalization, ensuring that all features have the same scale and will have a comparable impact on the autoencoder’s predictions. We utilize min-max normalization, scaling each feature from 0 to 1.
2.1.3. Autoencoder
The proposed autoencoder architecture is a fully connected neural network with batch normalization layers and one dropout layer (Table 1). The autoencoder was implemented in TensorFlow using Keras layers. The autoencoder’s final architecture results from experiments on various datasets from different products and market segments. This empirical approach ensures the adaptability and robustness of the final autoencoder design, confirming its effectiveness in a wide range of applications and domains. The reconstruction error is calculated as the difference between the input features and the autoencoder output. The reconstruction error is computed using the mean squared error (MSE) metric.

Table 1.
Autoencoder architecture.
After the reconstruction process is completed, the reconstruction error undergoes a polynomial transformation. The transformation is as follows: The reconstruction step output is a tensor of shape (1, 7, 7, 160). The tensor is reduced to a scalar using Tensorflow’s built-in method, polyval. The polyval method returns a value of an n-order polynomial with given coefficients and the reconstruction tensor as input. The polynomial order is determined by coefficient vector length. Then, the polynomial value is simply clipped to a range of [0 0.99], which is the actual anomaly score for the given input image. The coefficients of the polynomial function are determined manually (by evaluating the output score for a set of test images with adjustment of the coefficients), so that the decision border for a set of images is near the value of 0.25. The actual coefficient’s vector determined by us is [1.550 × 10³, −7.545 × 10³, 1.559 × 10⁴, −1.781 × 10⁴, 1.227 × 10⁴, −5.209 × 10³, 1.336 × 10³, −1.974 × 10², 1.671, −2.975 × 10⁻².
The input image of the system is classified as abnormal if its anomaly score exceeds the threshold value. The exact threshold value is automatically set based on the anomaly scores of the training samples but can be manually adjusted by the operator.
2.2. Active Learning Feature Extractor in Anomaly Detection
The system described in this work has been enhanced with an active learning module, which involves tuning the feature extractor on specially selected data collected during the system’s routine operation on the production line.
A threshold for the anomaly score is determined for each product batch, typically set at 0.25. This threshold serves as the decision boundary: all samples with an anomaly score greater than the threshold are classified as defective. For the examples described in [62], such a threshold selection achieves effectiveness ranging from 92.5% to 100%, as determined by the F1-score metric, depending on the test set (e.g., defects in blister pack tablets, defects in bottle caps).
Numerous parameters or preprocessing steps for images could change in the existing system, but the feature extractor based on the MobileNetV2 model remained constant. This model was trained on the Imagenet dataset containing approximately 1000 different classes. This presents a significant disparity with anomaly detection, where there are only two classes, and the objects of interest, such as metal inclusions in food jars, were not considered during model training. Hence, there was a need to fine-tune the feature extractor. However, the availability of training data posed a challenge. There had to be enough data to cover the requirements for training such a complex model. Since the system was already operating with reasonable effectiveness, we decided to improve its performance only through fine tuning on specifically selected samples—active learning. We envisioned two scenarios:
- Selecting samples with anomaly scores close to the threshold.
- Selecting samples with anomaly scores far from the threshold.
During system operation, each sample meeting the above condition is recorded. Once a sufficient number of these samples are collected, the operator is notified. The operator must manually label the images of these samples. This labeling process is used to tune the feature extractor. The fine-tuned model resumes operation and makes predictions on subsequent samples on the production line. The procedure is repeated until the required prediction effectiveness is achieved (so the number of samples close to the threshold decreases). This allows the system to start operating on the line earlier without waiting for sufficient good and defective samples to be collected.
The Process of Active Learning
Active learning proceeded as follows each time:
- A clean model (MobileNetV2 or EfficientNetV2) is obtained in the first iteration. The obtained model is without a head due to the mismatch of default output classes. The initial layers are added to the input model (see Figure 2):
- Input layer with the shape of a 224 × 224 image;
- Data augmentation layer (flip and rotate);
- Pixel scaling layer in the range of −1:1.
The final layers are:- Global average pooling;
- Dropout layer;
- Prediction layer.
- At this point, the feature extractor is cut out from the model. This involves removing the last 12 layers, so that the last layer has an output shape of 7 × 7 × 160 for the Mo-bileNetV2 model and 7 × 7 × 232 for the EfficientNetV2 model, making it applicable in the anomaly detector.
- The autoencoder is fitted with a set of non-faulty samples. Then, the regular operation of the system is initiated: the system takes successive samples from the set of jar images, saving those images that meet the distance requirements from the threshold for the anomaly detector score.
- If 20 such samples (those close to threshold or far from the threshold) are collected, fine tuning of the neural network model is initiated. The number 20 was chosen arbitrarily. It had to be small enough to provide material for more training iterations in a relatively small dataset. The process is as follows:
- As part of fine tuning, the previously saved head of the model is reattached to the feature extractor, so the full model is restored.
- The model is pre-trained, where weight changes are allowed only in the last three layers. This sets up the model’s head to enable deeper fine tuning with a prediction layer capable of immediately working on the specified classes (which are only good and defective). The preliminary training takes place on the data collected in point 3.
- Then, the main fine tuning takes place. This time, weight changes were allowed in the number of layers specified by the “number of layers subject to fine-tuning” parameter. Also indicated was the learning rate divider, which determined how many times smaller this coefficient should be compared to the preliminary tuning. The last parameter was the number of epochs of fine tuning.
- After the fine tuning is completed, a new feature extractor is constructed from the newly trained model (by cutting off the top 12 layers). The upper 12 layers are kept separately for the next iteration of fine tuning.
- At this step, each time after fine tuning the feature extractor, the autoencoder model was tuned again to ensure that subsequent predictions on production data incorporate new knowledge gained by the model.
- Further data are collected. If more than 20 samples are collected again, the procedure from points 3–5 is repeated.
Due to the small size of the dataset, the software sorted the training set into good and defective samples. The data had been previously labeled, but at no point did the prediction-making system see whether it was receiving defective or good data. This ensured the expert knowledge needed for labeling data whose class was doubtful for the system. The full system is depicted in Figure 3.
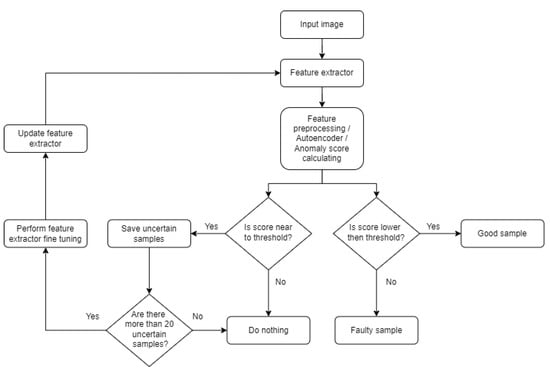
Figure 3.
Diagram of a full system with active learning.
2.3. Adopted Metrics and Indicators
We conducted a model evaluation on two datasets—one dataset contained only faulty samples, and the other contained only good samples. This way, we automatically obtained two popular metrics for binary classifiers—sensitivity and specificity.
where TP—True Positive, TN—True Negative, FP—False Positive, FN—False Negative.
In this case, accuracy is expressed by the following formula:
These criteria were used to find the best hyperparameters and the best model, because they are most closely related to production requirements—maximizing the indicators of correctly identifying defective and good samples.
The F1-score indicator was also used to compare the best-selected models better, which is the harmonic mean of precision and recall measures. The F1-score is defined as
Active learning was conducted and compared on two models available in the TensorFlow library: MobileNetV2 and EfficientNet2. Their high effectiveness indicators and popularity dictated the choice of these models as image classification models available in the TensorFlow library. The training dataset was the same for these two models, and the same sets of hyperparameters were also checked. The aim was to find a combination of parameters to maximize the sensitivity and specificity indicators. An examination was also carried out to assess the impact of the method of selecting samples for active learning. Firstly, samples close to the decision boundary were taken, and then samples far from this boundary were taken. For the default anomaly detector model based on MobileNetV2, the anomaly detector scores were obtained exclusively on samples that were only non-defective and only defectively overlapped (Figure 4). Sample selection for active learning can be made by distinguishing certain bands relative to the decision boundary (Figure 5). Two cases are considered: when the anomaly detector score is close to the threshold with some tolerance, e.g., 0.25 ± 0.15, or when this result is distant, e.g., the complement of the set 0.25 ± 0.2. The parameter defining the width of the anomaly detector score range that qualifies samples for active learning is referred to as the threshold tolerance (the width of the yellow area for samples close to the threshold and the width of the white gap between the blue areas for samples far from the threshold).
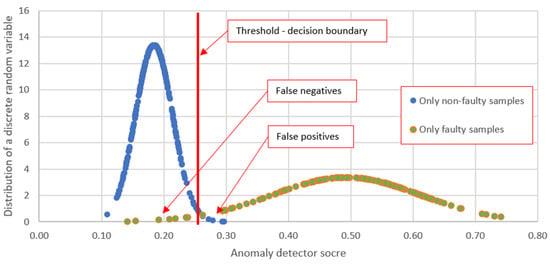
Figure 4.
Normal distribution of anomaly detector scores. The graph shows the results for two sets: blue shows the results for the set containing only non-defective samples, and green shows the results for the set containing only defective samples. The decision limit is marked for a score of 0.25. Blue results above the threshold are False Positives, and green results below the threshold are False Negatives. The goal of active learning is to separate the results from these two sets. The main purpose of presenting the results using a Gaussian curve was the ease of graphical presentation of the data where the classes are binary.
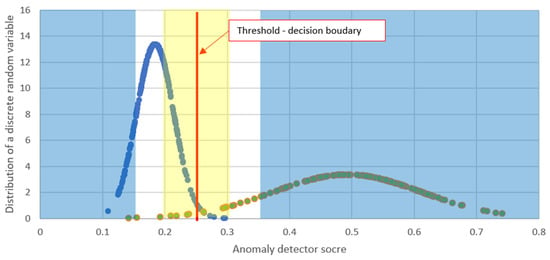
Figure 5.
Sample selection bands for active learning. Two scenarios are considered: samples close to the threshold (yellow area) or samples far from the threshold (blue area) are taken for fine tuning the feature extractor.
2.4. Dataset and Experimental Parameters
The data were collected at the testing station (Figure 6). The station consists of an X-ray source, a linear camera recording images in the X-ray band (a detector), and a conveyor belt. The VJ P290-IXS100SE150P290 X-Ray generator has an output voltage of 100 kV and a power of 150 W. The detector, a Hamamatsu Photonics linear camera of type C14300-08U, allows for data collection in two sensitivity modes: high- and low-energy.
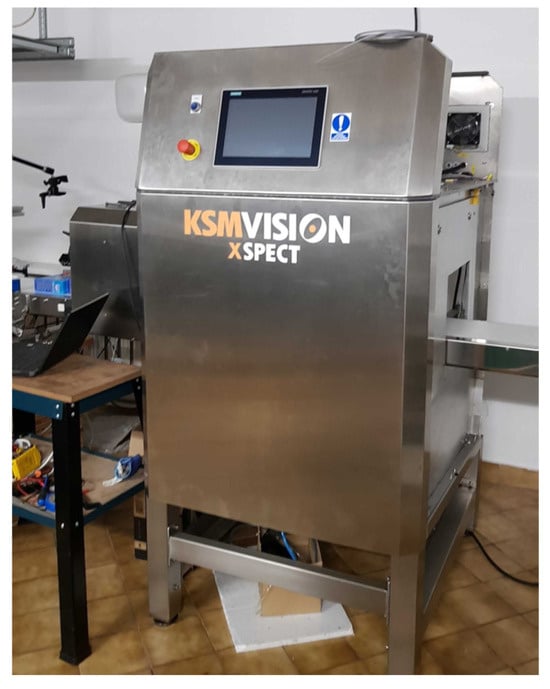
Figure 6.
Station for detecting inclusions in food products.
The dataset used for fine tuning the model and testing consisted of 572 images of jars of pickled cucumbers. Out of these, 357 images were non-defective, meaning the jars did not contain any foreign bodies. A total of 156 jars contained inclusions of glass shards. The remaining 60 jars contained foreign bodies made of metal (steel, aluminum, copper) or stone.
The image captured in the low-sensitivity mode of the detector provided better contrast for foreign bodies, so only those images were utilized in the system’s operation (Figure 7).

Figure 7.
Raw data from the X-ray detector. This is an image of the same jar. The left one was recorded in the high-sensitivity mode of the detector, and the right one was recorded in the low-sensitivity mode.
An image of a single jar taken in the low-sensitivity mode of the detector and normalized is shown in Figure 8.
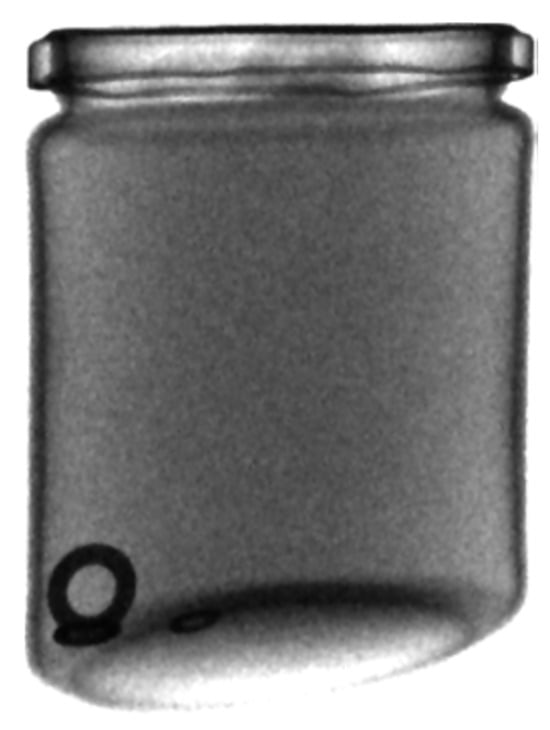
Figure 8.
A rotated and normalized image of a glass jar with a foreign body inside. The darker place on the jar cap is a shadow of cucumber, which means that the vegetables are barely visible in high-energy mode.
Firstly, the center of the jar was cropped, and the lid and the bottom were omitted. An example of the final images used in the system is shown in Figure 9.
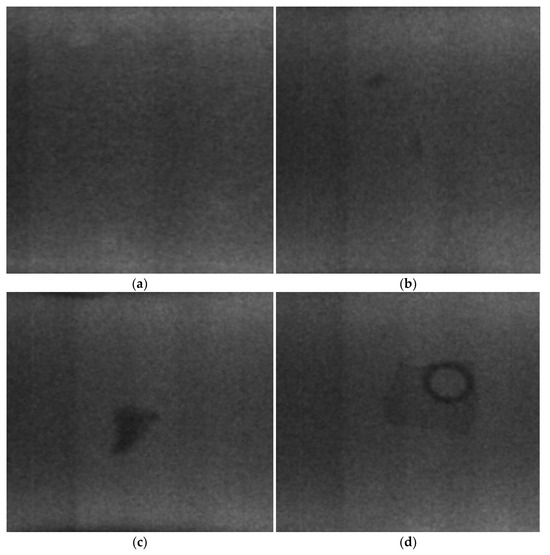
Figure 9.
Cropped images of jars taken in the low-sensitivity mode of the X-ray wave detector. (a) shows a non-defective jar, without any inclusions. In (b), there are two small glass fragments (5 mm in size). In (c), a glass fragment with a size of 15 mm is shown. A steel washer is in (d).
From this dataset, a smaller subset was selected for the inference process to select the training set during active learning. It contained 463 mixed defective and non-defective samples selected randomly. This subset was then divided into 10 batches, with the same proportions of defective and non-defective samples in each batch. Inference was then carried out, and samples were selected at an appropriate distance from the threshold. When 20 such samples were collected, fine tuning of the image classification model was performed on this dataset. Because the anomaly score in a threshold of 0.25 is above the values of most common non-defective samples and below the values of most common defective samples, both in scenarios of sampling close to the threshold and sampling far from the threshold, the training set received samples in different proportions of good to defective ones. Therefore, the training set had to be balanced using samples that did not originate from the inference set. For example, when 15 good samples and 5 defective samples were qualified for active learning sampling close to the threshold, the latter set was augmented with samples from the main set—those that were not a part of the inference set. This was to ensure sufficient balancing of the training set for active learning.
3. Results and Discussion
Both models, MobileNetV2 and EfficientNetV2, were tested for numerous combinations of hyperparameters to select a set that maximized sensitivity and specificity. Additionally, data collection was tested for samples close to and far from the threshold. Furthermore, the issue of what would happen if the training data from previous iterations were used in subsequent iterations was also examined for each combination. Thus, there were two possibilities:
- After each iteration of active learning, the training set was cleared.
- Each iteration of active learning took new data from the system’s predictions and all doubtful data from previous iterations.
The hyperparameters tested included the learning rate, training epoch number (for initial training), fine-tuning epoch number, and learning rate divider (determining the ratio of the fine-tuning learning rate to the initial training learning rate).
Two approaches to initial data preprocessing were also compared: the model was fed with raw data or data subjected to adaptive thresholding (which turned the data into binary images instead of grayscale) (Figure 10).
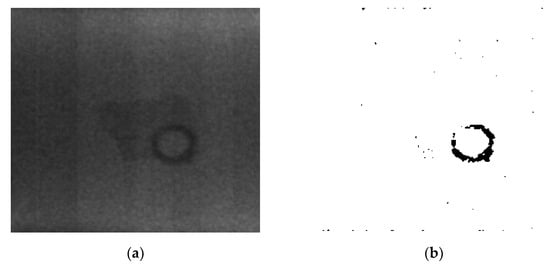
Figure 10.
Raw (a) and adaptively thresholded (b) image of a foreign body in a jar.
Taking into account two models, two data preprocessing methods (raw or thresholded), two methods of selecting samples for active learning (close and far from the threshold), adding samples of active learning to the existing dataset or fine tuning on a new dataset, and four hyperparameters of model tuning (learning rate, learning rate divider, threshold tolerance, and layers of fine tuning), a total of 120 model combinations were trained. Among them, those that resulted in increased sensitivity and specificity were sought. In this way, 10 models were selected. This means the remaining 110 models did not improve the indicators compared to the clean baseline feature extractor.
From the analysis of all combinations, it can be concluded that the highest number of correct True Positive and True Negative analyses was achieved for the MobileNetV2 model, for samples of active learning close to the threshold, for images subjected to adaptive thresholding, and for cleaning the training set after each training.
The best-achieved results have a sensitivity equal to 1 and a specificity equal to 0.981. Four parameter combinations achieved such results (see Table 2).

Table 2.
A summary of the parameters of the best models in terms of maximizing sensitivity and specificity indicators.
From the analysis in Table 1, the following observations can be made:
- The indicator of correct predictions of defective samples was initially high and remained unchanged.
- The indicator of correct predictions of good samples improved significantly by 30 percentage points.
- It is impossible to unequivocally determine which set of hyperparameters is the best (considering the learning rate, learning rate divider, layers of fine tuning, and threshold tolerance).
- Two combinations achieved maximum indicators after only two fine-tuning iterations.
3.1. Prediction Time and Training Time
The prediction time, as a key parameter on the production line, remained unchanged, because the structure of the feature extractor model always remained the same. This time was seven milliseconds for a single sample for both models: MobileNetV2 and EfficientNetV2. The training time for four iterations was 10 min for the MobileNetV2 model and 15 min for the EfficientNetV2 model.
3.2. Model Evaluation
The third of the four models listed in Table 2 was used to present the evaluation on the test set. This set consisted of 307 good samples and 152 defective samples. The autoencoder was trained on good samples for the clean MobileNetV2 model from the TensorFlow library and then again on good samples for the fine-tuned MobileNetV2 model with the parameters presented in Table 3. All anomaly detector scores for good and defective samples were used to calculate the mean and standard deviation values to present their discrete independent variable distribution. Graphs for the default model and the model trained after three iterations are shown in Figure 11. Although the mean values approached the threshold after fine tuning, their standard deviation clearly decreased, indicating that the model is more predictable. The number of False Positive and False Negative samples also decreased—for good samples, these are those above the threshold, and for defective samples, those below the threshold. The mean values and standard deviation are shown in Table 4. After fine tuning, the standard deviation decreased, making the results more consistent.

Table 3.
Model parameters for the presented evaluation.
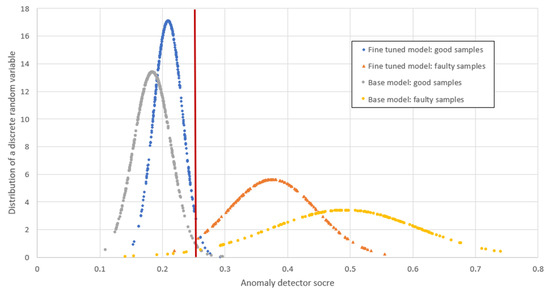
Figure 11.
Distribution charts of a discrete random variable for anomaly detector score for the untrained model (base model) and the fine-tuned model. The red line marks the threshold—the decision boundary. Although the mean values approached the threshold after fine tuning, their standard deviation decreased significantly, which means that the model is more predictable. The number of False Positive and False Negative samples has also decreased—for good samples, these are those above the threshold, and for defective samples, these are below the threshold.

Table 4.
Mean values and standard deviation for the pure MobileNetV2 model (base model) for the model after fine tuning. These measures indicate the predictability of the predictions. After fine tuning, the standard deviation decreased, so the results are more similar to the previous one.
3.3. Comparison of MobileNetV2 and EfficientNetV2 Results
A comparison of sensitivity and specificity results for representative examples of EfficientNetV2 and MobileNetV2 models is presented in Table 5. Although the former consistently yields higher scores for good samples from the beginning, its specificity score for defective samples noticeably decreases in each subsequent iteration. This trend was observed for most examples with the EfficientNetV2 model, contrary to MobileNetV2, where, in most cases, the prediction accuracy for defective samples either increased or remained constant. This is also reflected in the F1-score, which decreases with each iteration of active learning for the EfficientNetV2 model and increases for the MobileNetV2 model. This indicates that the EfficientNetV2 model is not suitable for this application. Perhaps the polynomial-reducing feature extractor output tensor should be improved to improve the metrics of the EfficientNetV2 model.

Table 5.
Summary of sensitivity, specificity, and F1-score results for representative examples of the EfficientNetV2 and MobileNetV2 models. Although the former gives higher rates for good samples from the very beginning, the rate for defective samples (specificity) drops significantly with each subsequent iteration. This situation occurred for the vast majority of examples using the EfficientNetV2 model.
3.4. Glass Detection
One of the main goals of this study was to improve the effectiveness of glass detection. Although the above analyses focus on improving the prediction indicators for non-defective samples, addressing glass detection separately from other foreign materials indicates that glass detection performs significantly worse.
The results for glass were compared to the results for the entire dataset of jar images. The set of defective samples was divided into glass and non-glass defects. There were 155 samples with glass inclusions and 60 with metal and stone inclusions.
To better illustrate the anomaly detector’s performance, we implemented a heatmap, where deviations from the norm are highlighted in brighter colors (Figure 12). Brighter areas around visible inclusions indicate deviations from the norm. The higher the anomaly detector’s score, the brighter the color of the anomaly. Both images depict the same sample. The left image shows the result of the default MobileNetV2 feature extractor, and the right image shows fine-tuned feature extractor. The brightening in the right image indicates that the base model is more confident in finding the inclusion. This is reflected in the anomaly detector’s score. The left image scored 0.32, whereas the right one obtained 0.51. Therefore, during active learning, the model’s confidence in detecting defects decreased, which can be associated with the convergence of the average anomaly detector score to the threshold of 0.25.
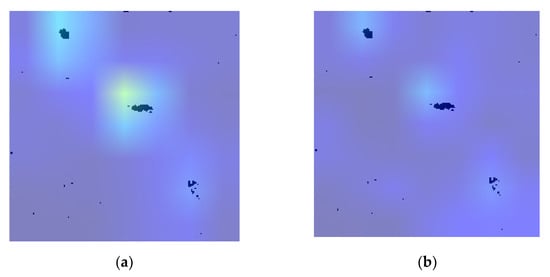
Figure 12.
Heatmap of an autoencoder-based anomaly detector. A lighter area around a visible inclusion indicates an abnormal location. The higher the anomaly detector score, the brighter the color of that anomaly. Both drawings show the same sample. Image (a) shows the default untrained MobileNetV2 feature extractor, and (b) show an active learning trained feature extractor. The brightening in the left image indicates that the model is more confident in finding the inclusion. This is reflected in the anomaly detector score value. The left photo received a score of 0.32, the right one 0.51. The lower the score, the closer the sample is to a “good” class.
On the base, the pretrained MobileNetV2 model, the sensitivity index (for only non-defective samples) was 0.966. For non-glass materials, the specificity index was 0.964. For glass, this index was 0.95.
On the trained model, the same one used in Section 3.2, the sensitivity index achieved on a set of only non-defective samples was 0.997. For non-glass foreign bodies, the specificity index was 0.95. For glass, it was 0.974.
It can be seen that the correct detection rate for good samples increased by three percentage points. For non-glass foreign bodies, it decreased by 1.4 percentage points, whereas for glass, it increased by 2.4 percentage points. Although numerically, the results of the anomaly detector during active learning decreased (which is also evident in Figure 11), the True Positive and True Negative detection rates increased. This indicates that although there was a partial loss of effectiveness for non-glass defects, active learning can significantly improve the effectiveness of detecting glass foreign bodies in glass jars with heterogeneous food products.
3.5. Conclusions from Active Learning
Regarding the best approach to active learning, the scenario of selecting samples distant from the threshold and close to the threshold was analyzed. To illustrate the learning process, the accuracy for 10 consecutive fine-tuning epochs for MobileNetV2 and EfficientNetV2 models for the first iteration of active learning was presented on the X-axis plot, divided into the method of selecting samples close and far from the threshold. Models with the same hyperparameters as those presented in Table 6 were used.

Table 6.
Hyperparameters for which the fine-tuning process was analyzed.
Figure 13 and Figure 14 depict accuracy and loss, respectively, for the MobileNetV2 and EfficientNetV2 models for samples in active learning that are far from the threshold and close to the threshold. For accuracy, only the EfficientNetV2 model for samples far from the threshold indicates a significantly lower rate. No significant change was observed in these parameters. For the loss indicator, the values for the MobileNetV2 model are several orders of magnitude lower than those for EfficientNetV2. It can be observed that the value decreases for each combination up to the fourth epoch. Training could be terminated at this epoch due to no major changes in accuracy occurring.
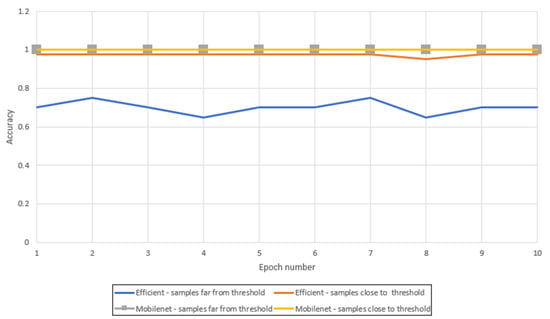
Figure 13.
Graph of accuracy changes in relation to subsequent epochs. The MobileNetV2 model achieved an accuracy of 1 for all epochs for samples close to and far from the threshold, which is why the graph lines overlap. The model with samples distant from the threshold achieved significantly lower results. The yellow and the gray lines are overlapping.
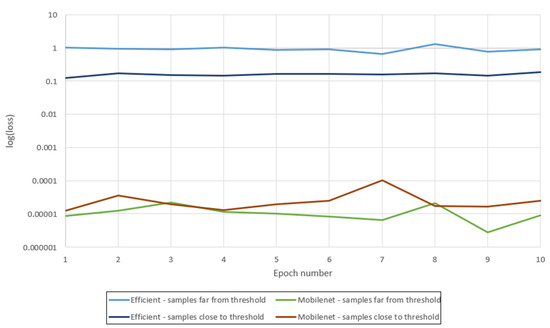
Figure 14.
Loss chart for four models. The vertical axis is presented on a logarithmic scale. The loss rate for the MobileNetV2 model is several orders of magnitude lower. There is no significant difference whether samples are taken close to or far from the threshold.
The change in accuracy values before fine tuning (and after initial training of the model’s head) and after the first iteration on the test set is illustrated in Table 7. For the MobileNetV2 model, a decrease in the accuracy rate was observed, whereas for EfficientNetV2, there was an increase. Moreover, the MobileNetV2 model achieved better results considering sensitivity, specificity, and F1-score as an extractor of features. With a depth of 100 layers for training and removing the top 12 layers from each model, MobileNet performs better as a feature extractor for X-ray images. In this context, no significant impact was observed from the selection of samples (close or far from the decision boundary) on the effectiveness of the models.

Table 7.
Accuracy comparison before and after the first fine-tuning iteration. For the MobileNetV2 model, there is a decrease in accuracy, but for EfficientNetV2, there is an increase. Nevertheless, EfficientNetV2 achieved worse performance in the anomaly detector.
4. Conclusions
Detecting foreign bodies in the heterogeneous content of glass containers poses a challenge. Ensuring production quality to avoid contamination is not always feasible; hence, the effectiveness of packaging inspection systems must be high. X-ray radiation is a good solution, as it quickly penetrates various materials, but classifying such images presents difficulties due to the low signal-to-noise ratio.
The research demonstrated that active learning can effectively reduce the number of false detections of foreign bodies in glass jars and improve the efficiency of intrusion detection. On the given test set, the problem of false detections was eliminated (improving sensitivity from 0.703 to 1.0), maintaining the same value for foreign body detection (0.98) and improving the F1-score (the harmonic mean of precision and recall) from 0.806 to 0.980.
The impact of numerous parameters was examined to identify the best set of hyperparameters for tuning the feature extractor. The influence of different ways of selecting samples for active learning was investigated, and the effect of preprocessing images on learning outcomes was checked. A small dataset consisting of 460 samples proved to be sufficient to significantly improve the system’s prediction quality for detecting foreign bodies in glass jars. In particular, the rate of correct detections of glass intrusions in glass increased by 2.4 percentage points to 97.4%. Such a quality indicator is high in typical industrial standards.
Prediction times for a single sample remained unchanged. This time is a critical indicator in industrial applications where systems must operate in real time.
These system characteristics allow it to react quickly to changes in production conditions (e.g., altering product features after changing suppliers), thus making the system adaptive. In this scenario, there is no need for a complete system overhaul; simply fine tuning the model is sufficient.
Despite promising results, there are areas where further development could positively impact the improvement of parameters. In future work on the system, it is worth considering the method of selecting the initial dataset for the initial training of the network to adjust the classification before proper tuning. Additionally, improving the polynomial function by reducing the tensor returned by the autoencoder could enhance the results for the EfficientNetV2 model. Now, this function is crafted manually by experiments, but it might be calculated automatically. Classifying jar bottoms from the jar itself remains challenging, because the glass thickness changes abruptly, and dead zones are present in X-ray images. Another issue that could improve the system’s effectiveness is better balancing the training data for the feature extractor.
Author Contributions
Conceptualization, J.R.; methodology, J.R.; software, J.R.; validation, J.R.; formal analysis, J.R.; investigation, J.R.; resources, M.M.; data curation, M.M.; writing—original draft preparation, J.R.; writing—review and editing, J.R.; visualization, J.R.; supervision, M.M.; project administration, M.M.; funding acquisition, M.M. All authors have read and agreed to the published version of the manuscript.
Funding
This research was funded by the National Centre of Research and Development from European Union Funds under the Smart Growth Operational Programme, grant number: POIR.01.01.01-00-0488/20.
Data Availability Statement
The datasets presented in this article are not readily available because the data are part of an ongoing study. Requests to access the datasets should be directed to the corresponding author.
Acknowledgments
The authors would like to thank Michał Kocon for valuable tips in developing active learning software and KSM Vision’s engineering team for support in data acquisition and tests.
Conflicts of Interest
Author Marcin Malesa was employed by the company KSM Vision sp. z o.o. The authors declare that the research was conducted in the absence of any commercial or financial relationships that could be construed as a potential conflict of interest.
References
- Edwards, M. (Ed.) Detecting Foreign Bodies in Food; Elsevier: Amsterdam, The Netherlands, 2004. [Google Scholar]
- Graves, M.; Smith, A.; Batchelor, B. Approaches to foreign body detection in foods. Trends Food Sci. Technol. 1998, 9, 21–27. [Google Scholar] [CrossRef]
- Rosak-Szyrocka, J.; Abbase, A.A. Quality management and safety of food in HACCP system aspect. Prod. Eng. Arch. 2020, 26, 50–53. [Google Scholar] [CrossRef]
- Tadhg, B.; Sun, D.-W. Improving quality inspection of food products by computer vision–A review. J. Food Eng. 2004, 61, 3–16. [Google Scholar]
- Chen, H.; Liou, B.K.; Dai, F.J.; Chuang, P.T.; Chen, C.S. Study on the risks of metal detection in food solid seasoning powder and liquid sauce to meet the core concepts of ISO 22000: 2018 based on the Taiwanese experience. Food Control 2020, 111, 107071. [Google Scholar] [CrossRef]
- Mettler-Toledo Glass Container X-ray Inspection Systems. Available online: https://www.mt.com/us/en/home/products/Product-Inspection_1/safeline-x-ray-inspection/glasscontainer-x-ray-inspection.html (accessed on 4 April 2024).
- Mohd Khairi, M.T.; Ibrahim, S.; Md Yunus, M.A.; Faramarzi, M. Noninvasive techniques for detection of foreign bodies in food: A review. J. Food Process Eng. 2018, 41, e12808. [Google Scholar] [CrossRef]
- Mi, C.; Kai, C.; Zhiwei, Z. Research on tobacco foreign body detection device based on machine vision. Trans. Inst. Meas. Control 2020, 42, 2857–2871. [Google Scholar]
- Becker, F.; Schwabig, C.; Krause, J.; Leuchs, S.; Krebs, C.; Gruna, R. From visual spectrum to millimeter wave: A broad spectrum of solutions for food inspection. IEEE Antennas Propag. Mag. 2020, 62, 55–63. [Google Scholar] [CrossRef]
- Xie, T.; Li, X.; Zhang, X.; Hu, J.; Fang, Y. Detection of Atlantic salmon bone residues using machine vision technology. Food Control 2021, 123, 107787. [Google Scholar] [CrossRef]
- Zhang, Z.; Luo, Y.; Deng, X.; Luo, W. Digital image technology based on PCA and SVM for detection and recognition of foreign bodies in lyophilized powder. Technol. Health Care 2020, 28, 197–205. [Google Scholar] [CrossRef]
- Zhu, L.; Spachos, P.; Pensini, E.; Plataniotis, K.N. Deep learning and machine vision for food processing: A survey. Curr. Res. Food Sci. 2021, 4, 233–249. [Google Scholar] [CrossRef]
- Hu, J.; Xu, Z.; Li, M.; He, Y.; Sun, X.; Liu, Y. Detection of foreign-body in milk powder processing based on terahertz imaging and spectrum. J. Infrared Millim. Terahertz Waves 2021, 42, 878–892. [Google Scholar] [CrossRef]
- Sun, X.; Cui, D.; Shen, Y.; Li, W.; Wang, J. Non-destructive detection for foreign bodies of tea stalks in finished tea products using terahertz spectroscopy and imaging. Infrared Phys. Technol. 2022, 121, 104018. [Google Scholar] [CrossRef]
- Li, Z.; Meng, Z.; Soutis, C.; Wang, P.; Gibson, A. Detection and analysis of metallic contaminants in dry foods using a microwave resonator sensor. Food Control 2022, 133, 108634. [Google Scholar] [CrossRef]
- Wang, Q.; Hameed, S.; Xie, L.; Ying, Y. Non-destructive quality control detection of endogenous contaminations in walnuts using terahertz spectroscopic imaging. J. Food Meas. Charact. 2020, 14, 2453–2460. [Google Scholar] [CrossRef]
- Voss, J.O.; Doll, C.; Raguse, J.D.; Beck-Broichsitter, B.; Walter-Rittel, T.; Kahn, J. Detectability of foreign body materials using X-ray, computed tomography and magnetic resonance imaging: A phantom study. Eur. J. Radiol. 2021, 135, 109505. [Google Scholar] [CrossRef] [PubMed]
- Vasquez, J.A.T.; Scapaticci, R.; Turvani, G.; Ricci, M.; Farina, L.; Litman, A. Noninvasive inline food inspection via microwave imaging technology: An application example in the food industry. IEEE Antennas Propag. Mag. 2020, 62, 18–32. [Google Scholar] [CrossRef]
- Ricci, M.; Štitić, B.; Urbinati, L.; Di Guglielmo, G.; Vasquez, J.A.T.; Carloni, L.P. Machine-learning-based microwave sensing: A case study for the food industry. IEEE J. Emerg. Sel. Top. Circuits Syst. 2021, 11, 503–514. [Google Scholar] [CrossRef]
- Saeidan, A.; Khojastehpour, M.; Golzarian, M.R.; Mooenfard, M.; Khan, H.A. Detection of foreign materials in cocoa beans by hyperspectral imaging technology. Food Control 2021, 129, 108242. [Google Scholar] [CrossRef]
- Zarezadeh, M.R.; Aboonajmi, M.; Varnamkhasti, M.G.; Azarikia, F. Olive oil classification and fraud detection using E-nose and ultrasonic system. Food Anal. Methods 2021, 14, 2199–2210. [Google Scholar] [CrossRef]
- Alam, S.A.Z.; Jamaludin, J.; Asuhaimi, F.A.; Ismail, I.; Ismail, W.Z.W.; Rahim, R.A. Simulation Study of Ultrasonic Tomography Approach in Detecting Foreign Object in Milk Packaging. J. Tomogr. Syst. Sens. Appl. 2023, 6, 17–24. [Google Scholar]
- Ou, X.; Chen, X.; Xu, X.; Xie, L.; Chen, X.; Hong, Z.; Yang, H. Recent development in x-ray imaging technology: Future and challenges. Research 2021, 2021, 9892152. [Google Scholar] [CrossRef] [PubMed]
- Lim, H.; Lee, J.; Lee, S.; Cho, H.; Lee, H.; Jeon, D. Low-density foreign body detection in food products using single-shot grid-based dark-field X-ray imaging. J. Food Eng. 2022, 335, 111189. [Google Scholar] [CrossRef]
- Li, F.; Liu, Z.; Sun, T.; Ma, Y.; Ding, X. Confocal three-dimensional micro X-ray scatter imaging for non-destructive detecting foreign bodies with low density and low-Z materials in food products. Food Control 2015, 54, 120–125. [Google Scholar] [CrossRef]
- Bauer, C.; Wagner, R.; Leisner, J. Foreign body detection in frozen food by dual energy X-ray transmission. Sens. Transducers 2021, 253, 23–30. [Google Scholar]
- Morita, K.; Ogawa, Y.; Thai, C.N.; Tanaka, F. Soft X-ray image analysis to detect foreign materials in foods. Food Sci. Technol. Res. 2003, 9, 137–141. [Google Scholar] [CrossRef]
- Wang, Q.; Wu, K.; Wang, X.; Sun, Y.; Yang, X.; Lou, X. Recognition of dumplings with foreign body based on X-ray and convolutional neural network. Shipin Kexue Food Sci. 2019, 40, 314–320. [Google Scholar]
- Arsenault, M.; Bentz, J.; Bouchard, J.L.; Cotnoir, D.; Verreault, S.; Maldague, X. Glass fragments detector for a jar filling process. In Proceedings of the Canadian Conference on Electrical and Computer Engineering, Halifax, NS, Canada, 14–17 September 1993. [Google Scholar]
- Schlager, D.; Sanders, A.B.; Wiggins, D.; Boren, W. Ultrasound for the detection of foreign bodies. Ann. Emerg. Med. 1991, 20, 189–191. [Google Scholar] [CrossRef]
- Zhou, X.; Wang, Y.; Xiao, C.; Zhu, Q.; Lu, X.; Zhang, H.; Zhao, H. Automated visual inspection of glass bottle bottom with saliency detection and template matching. IEEE Trans. Instrum. Meas. 2019, 68, 4253–4267. [Google Scholar] [CrossRef]
- Ma, H.M.; Su, G.D.; Wang, J.Y.; Ni, Z. A glass bottle defect detection system without touching. In Proceedings of the International Conference on Machine Learning and Cybernetics, Beijing, China, 4–5 November 2022; Volume 2. [Google Scholar]
- Li, F.; Hang, Z.; Yu, G.; Wei, G.; Xinyu, C. The method for glass bottle defects detecting based on machine vision. In Proceedings of the 29th Chinese Control and Decision Conference (CCDC), Chongqing, China, 28–30 May 2017. [Google Scholar]
- Bosen, Z.; Basir, O.A.; Mittal, G.S. Detection of metal, glass and plastic pieces in bottled beverages using ultrasound. Food Res. Int. 2003, 36, 513–521. [Google Scholar]
- McFarlane, N.J.B.; Bull, C.R.; Tillett, R.D.; Speller, R.D.; Royle, G.J. SE—Structures and environment: Time constraints on glass detection in food materials using Compton scattered X-rays. J. Agric. Eng. Res. 2001, 79, 407–418. [Google Scholar] [CrossRef]
- Strobl, M. Red Wine Bottling and Packaging; Red Wine Technology; Academic Press: Cambridge, MA, USA, 2019; pp. 323–339. [Google Scholar]
- Heuft eXaminer II XAC. Available online: https://heuft.com/en/product/beverage/full-containers/foreign-object-inspection-heuft-examiner-ii-xac-bev (accessed on 4 April 2024).
- Biswajit, J.; Nayak, G.K.; Saxena, S. Convolutional neural network and its pretrained models for image classification and object detection: A survey. Concurr. Comput. Pract. Exp. 2022, 34, e6767. [Google Scholar]
- Xu, S.; Zhang, M.; Song, W.; Mei, H.; He, Q.; Liotta, A. A systematic review and analysis of deep learning-based underwater object detection. Neurocomputing 2023, 527, 204–232. [Google Scholar] [CrossRef]
- Deng, L.; Bi, L.; Li, H.; Chen, H.; Duan, X.; Lou, H.; Liu, H. Lightweight aerial image object detection algorithm based on improved YOLOv5s. Sci. Rep. 2023, 13, 7817. [Google Scholar] [CrossRef] [PubMed]
- Liu, J.; Xie, G.; Wang, J.; Li, S.; Wang, C.; Zheng, F.; Jin, Y. Deep industrial image anomaly detection: A survey. Mach. Intell. Res. 2024, 21, 104–135. [Google Scholar] [CrossRef]
- Liu, Z.; Zhou, Y.; Xu, Y.; Wang, Z. Simplenet: A simple network for image anomaly detection and localization. In Proceedings of the IEEE/CVF Conference on Computer Vision and Pattern Recognition, Vancouver, BC, Canada, 24 June 2023. [Google Scholar]
- Xie, G.; Wang, J.; Liu, J.; Lyu, J.; Liu, Y.; Wang, C.; Jin, Y. Im-iad: Industrial image anomaly detection benchmark in manufacturing. IEEE Trans. Cybern. 2024, 54, 2720–2733. [Google Scholar] [CrossRef] [PubMed]
- Ravpreet, K.; Singh, S. A comprehensive review of object detection with deep learning. Digit. Signal Process 2023, 132, 103812. [Google Scholar]
- Ezekiel, O.O.; Irhebhude, M.E.; Evwiekpaefe, A.E. A comparative study of YOLOv5 and YOLOv7 object detection algorithms. J. Comput. Soc. Inform. 2023, 2, 1–12. [Google Scholar]
- Sheldon, M.; Agarwal, M. A comparison between VGG16, VGG19 and ResNet50 architecture frameworks for Image Classification. In Proceedings of the 2021 International Conference on Disruptive Technologies for Multi-Disciplinary Research and Applications (CENTCON), Bengaluru, India, 19–21 November 2021; Volume 1. [Google Scholar]
- Pin, W.; Fan, E.; Wang, P. Comparative analysis of image classification algorithms based on traditional machine learning and deep learning. Pattern Recognit. Lett. 2021, 141, 61–67. [Google Scholar]
- Liu, Y.; Sun, P.; Wergeles, N.; Shang, Y. A survey and performance evaluation of deep learning methods for small object detection. Expert Syst. Appl. 2021, 172, 114602. [Google Scholar] [CrossRef]
- José, M.; Domingues, I.; Bernardino, J. Comparing vision transformers and convolutional neural networks for image classification: A literature review. Appl. Sci. 2023, 13, 5521. [Google Scholar] [CrossRef]
- Bharadiya, J. Convolutional neural networks for image classification. Int. J. Innov. Sci. Res. Technol. 2023, 8, 673–677. [Google Scholar]
- Gulzar, Y. Fruit image classification model based on MobileNetV2 with deep transfer learning technique. Sustainability 2023, 15, 1906. [Google Scholar] [CrossRef]
- Beggel, L.; Pfeiffer, M.; Bischl, B. Robust anomaly detection in images using adversarial autoencoders. In Proceedings of the Machine Learning and Knowledge Discovery in Databases: European Conference, ECML PKDD 2019, Würzburg, Germany, 16–20 September 2019; Part I. Springer International Publishing: Berlin/Heidelberg, Germany, 2020. [Google Scholar]
- Chow, J.K.; Su, Z.; Wu, J.; Tan, P.S.; Mao, X.; Wang, Y.H. Anomaly detection of defects on concrete structures with the convolutional autoencoder. Adv. Eng. Inform. 2020, 45, 101105. [Google Scholar] [CrossRef]
- Thudumu, S.; Branch, P.; Jin, J.; Singh, J. A comprehensive survey of anomaly detection techniques for high dimensional big data. J. Big Data 2020, 7, 42. [Google Scholar] [CrossRef]
- Nassif, A.B.; Talib, M.A.; Nasir, Q.; Dakalbab, F.M. Machine learning for anomaly detection: A systematic review. IEEE Access 2021, 9, 78658–78700. [Google Scholar] [CrossRef]
- Ren, P.; Xiao, Y.; Chang, X.; Huang, P.Y.; Li, Z.; Gupta, B.B.; Wang, X. A survey of deep active learning. ACM Comput. Surv. CSUR 2021, 54, 42. [Google Scholar] [CrossRef]
- Cao, X.; Yao, J.; Xu, Z.; Meng, D. Hyperspectral image classification with convolutional neural network and active learning. IEEE Trans. Geosci. Remote Sens. 2020, 58, 4604–4616. [Google Scholar] [CrossRef]
- El-Hasnony, I.M.; Elzeki, O.M.; Alshehri, A.; Salem, H. Multi-label active learning-based machine learning model for heart disease prediction. Sensors 2022, 22, 1184. [Google Scholar] [CrossRef]
- Shui, C.; Zhou, F.; Gagné, C.; Wang, B. Deep active learning: Unified and principled method for query and training. In Proceedings of the International Conference on Artificial Intelligence and Statistics, Online, 26–28 August 2020. [Google Scholar]
- Ménard, P.; Domingues, O.D.; Jonsson, A.; Kaufmann, E.; Leurent, E.; Valko, M. Fast active learning for pure exploration in reinforcement learning. In Proceedings of the International Conference on Machine Learning, Online, 18–24 July 2021. [Google Scholar]
- Punit, K.; Gupta, A. Active learning query strategies for classification, regression, and clustering: A survey. J. Comput. Sci. Technol. 2020, 35, 913–945. [Google Scholar]
- Michał, K.; Malesa, M.; Rapcewicz, J. Ultra-Lightweight Fast Anomaly Detectors for Industrial Applications. Sensors 2023, 24, 161. [Google Scholar] [CrossRef]
Disclaimer/Publisher’s Note: The statements, opinions and data contained in all publications are solely those of the individual author(s) and contributor(s) and not of MDPI and/or the editor(s). MDPI and/or the editor(s) disclaim responsibility for any injury to people or property resulting from any ideas, methods, instructions or products referred to in the content. |
© 2024 by the authors. Licensee MDPI, Basel, Switzerland. This article is an open access article distributed under the terms and conditions of the Creative Commons Attribution (CC BY) license (https://creativecommons.org/licenses/by/4.0/).