


Assessing the Effects of Various Gaming Platforms on Players’ Affective States and Workloads through Electroencephalogram


Abstract
1. Introduction
1.1. Background
1.2. Research Questions
- RQ1: How do players’ emotional responses to low- versus high-stimulation games differ across PlayStation 5, Nintendo Switch, and Meta Quest 2 (VR device)?
- RQ2: What differences in cognitive load are observed between low- and high-stimulation games across different gaming platforms?
- RQ3: How does brain activity differ in players playing low- and high-stimulation games across different gaming platforms?
- RQ4: Which brain regions are associated with subjective user experiences and EEG measures across different platforms?
1.3. Analysis and Evaluation
2. Related Works
2.1. Application of EEG for Emotion Recognition and Brain State Detection
2.2. Application of EEG in Video Games and Virtual Reality Environments
3. Experiment Design
3.1. Participants
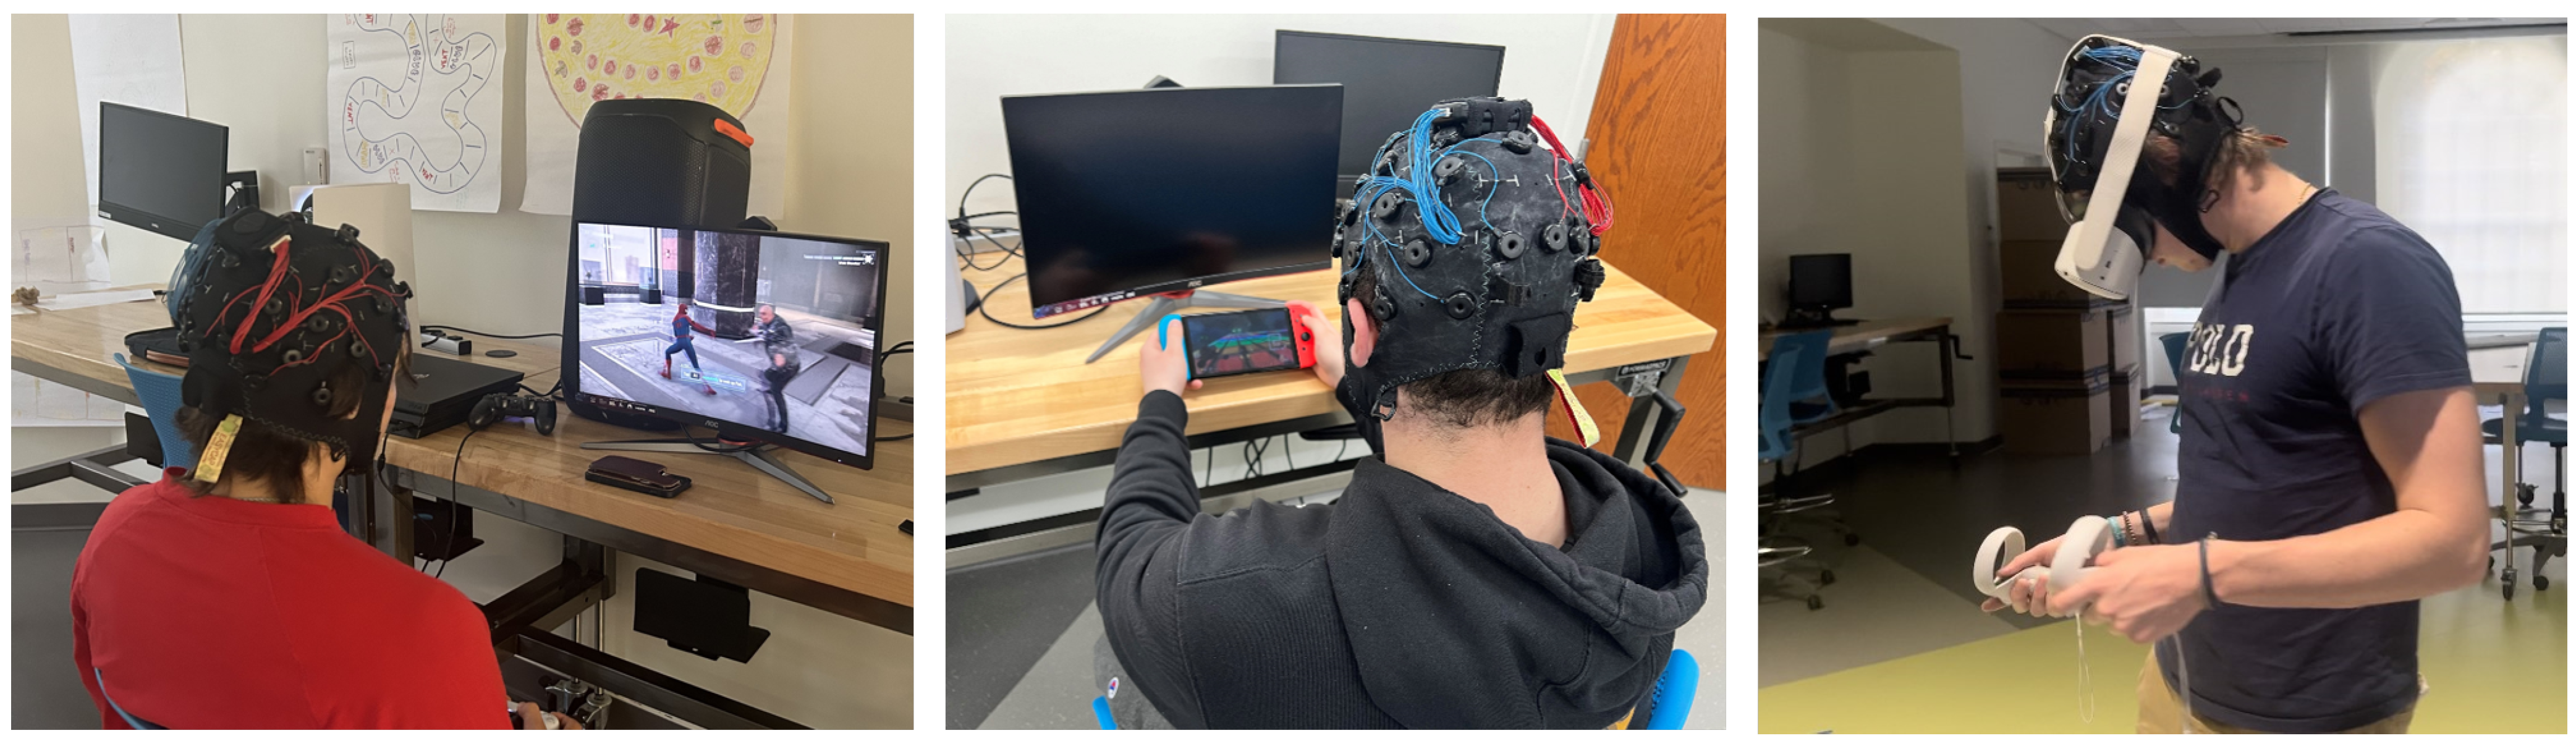
3.2. Apparatus
3.2.1. Consoles and EEG Device
3.2.2. Low- and High-Stimulation Games
3.3. Procedure
4. Results and Discussion
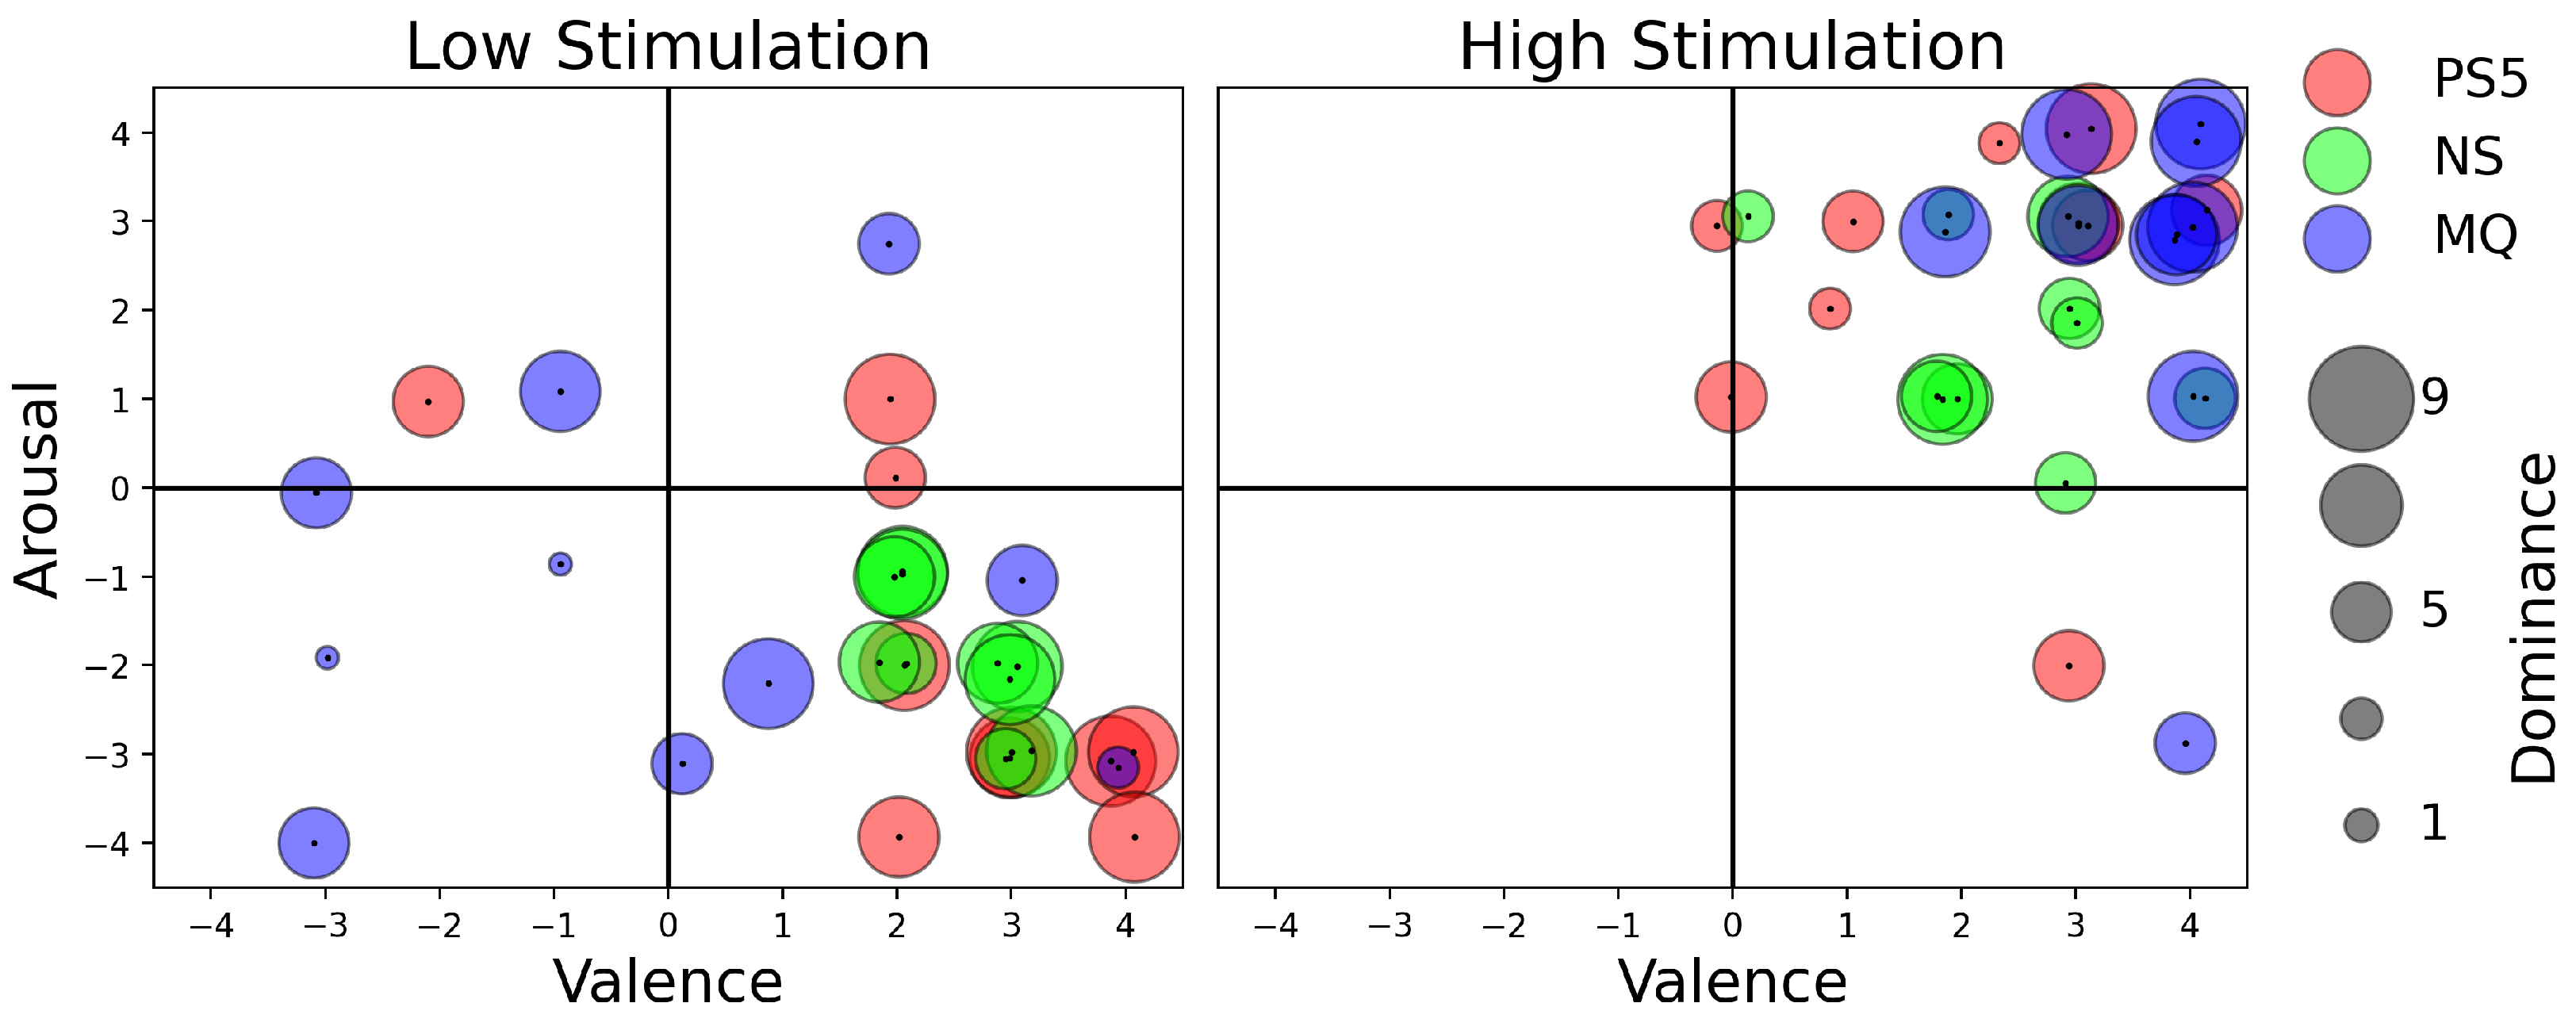
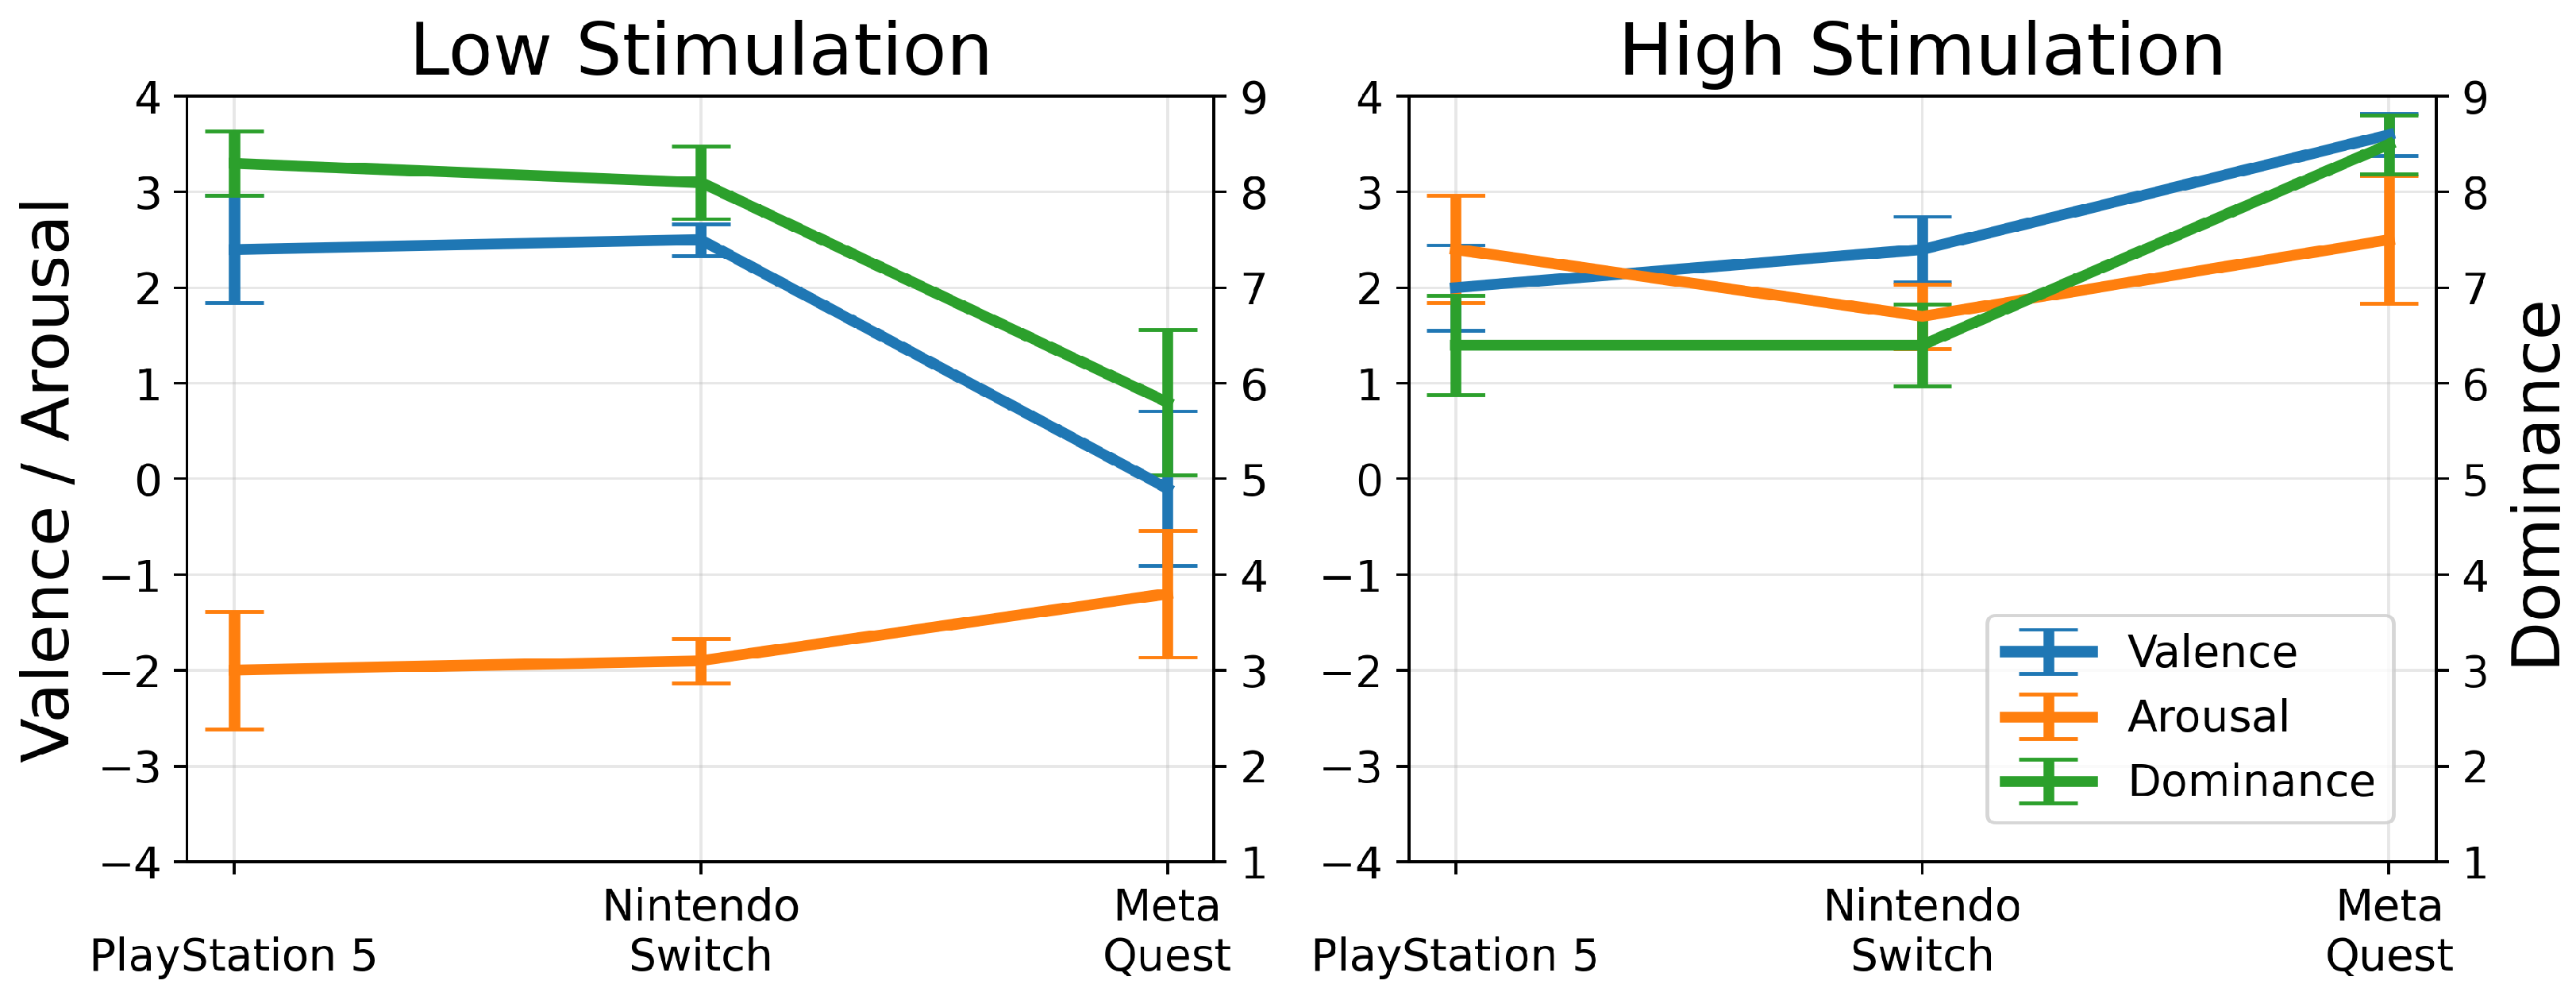
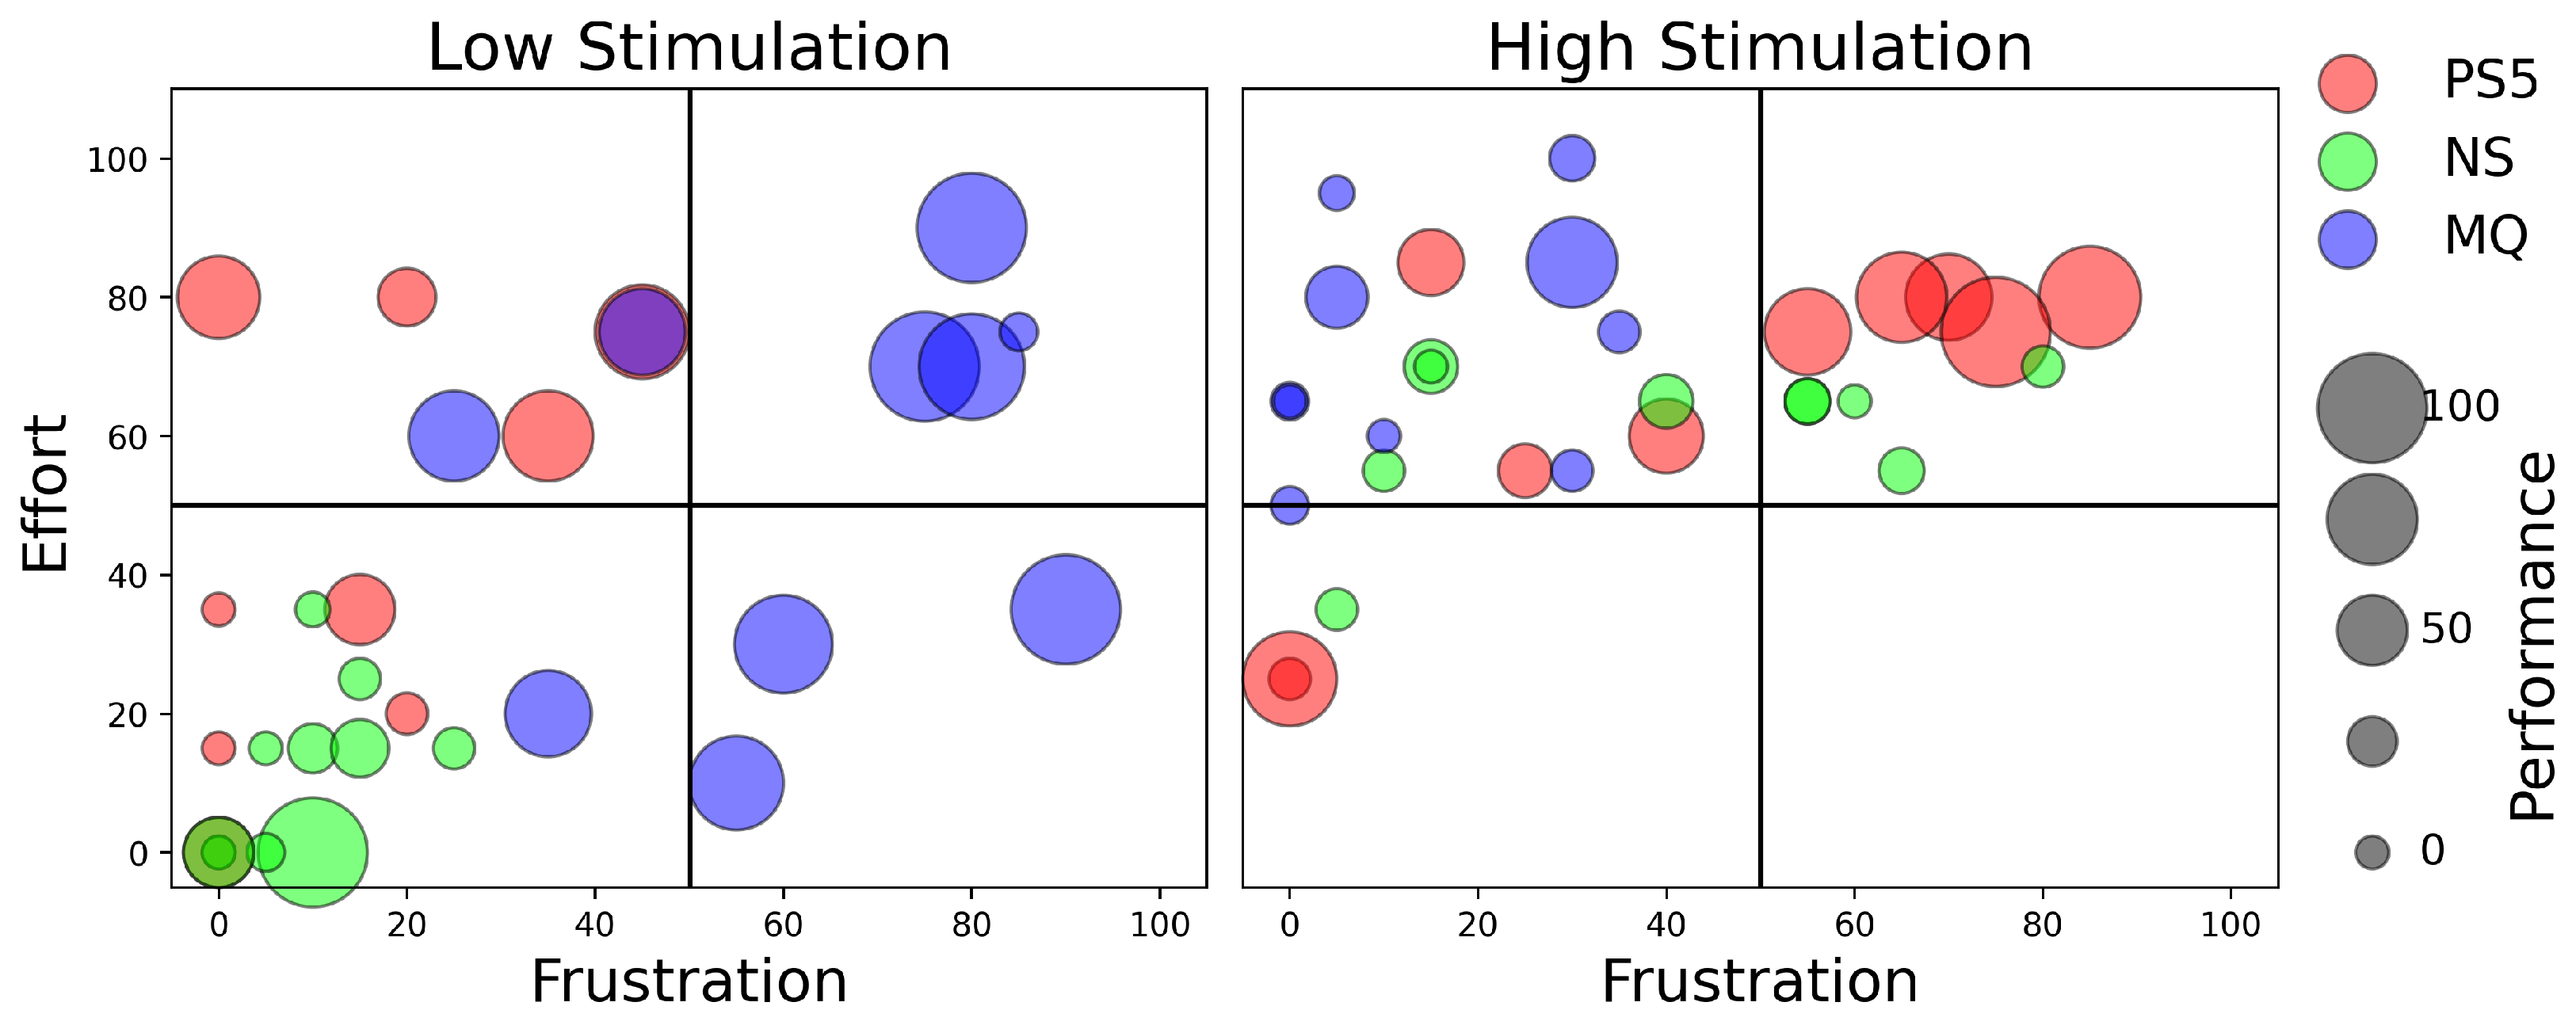
4.1. Affective Experience Analysis Using Self-Assessment Manikin (Low- and High-Stimulation Games)
4.2. Discussion on Affective Experience Analysis
4.2.1. Dominance across Platforms
4.2.2. Valence and Emotional Engagement
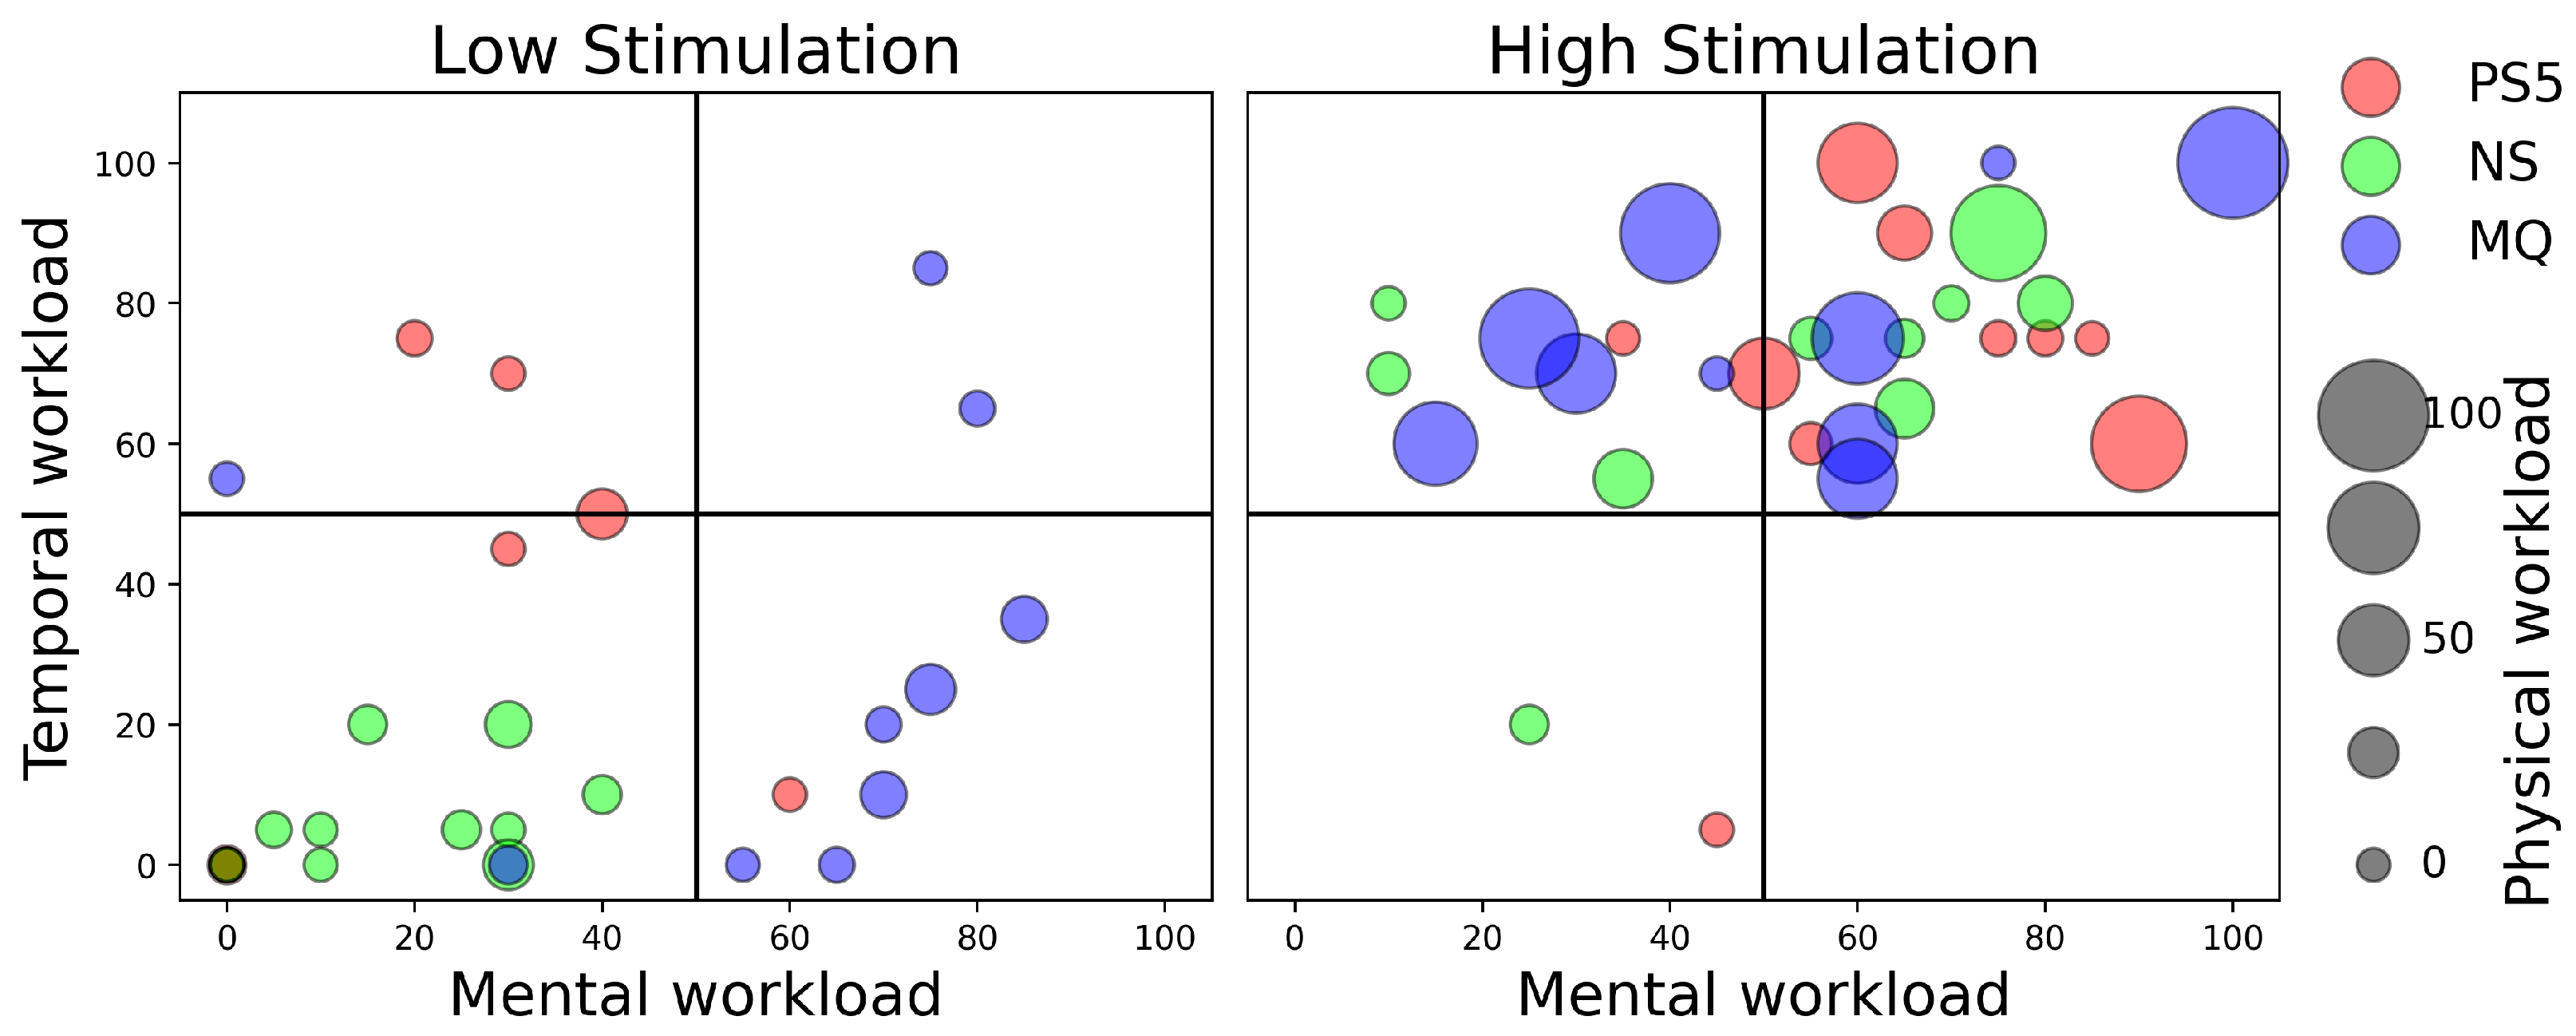
4.3. Workload Analysis Using NASA Task Load Index (Low- and High-Stimulation Games)
4.4. Discussion on Workload Analysis
4.4.1. Performance Efficiency Differences
4.4.2. Physical Workload and Frustration
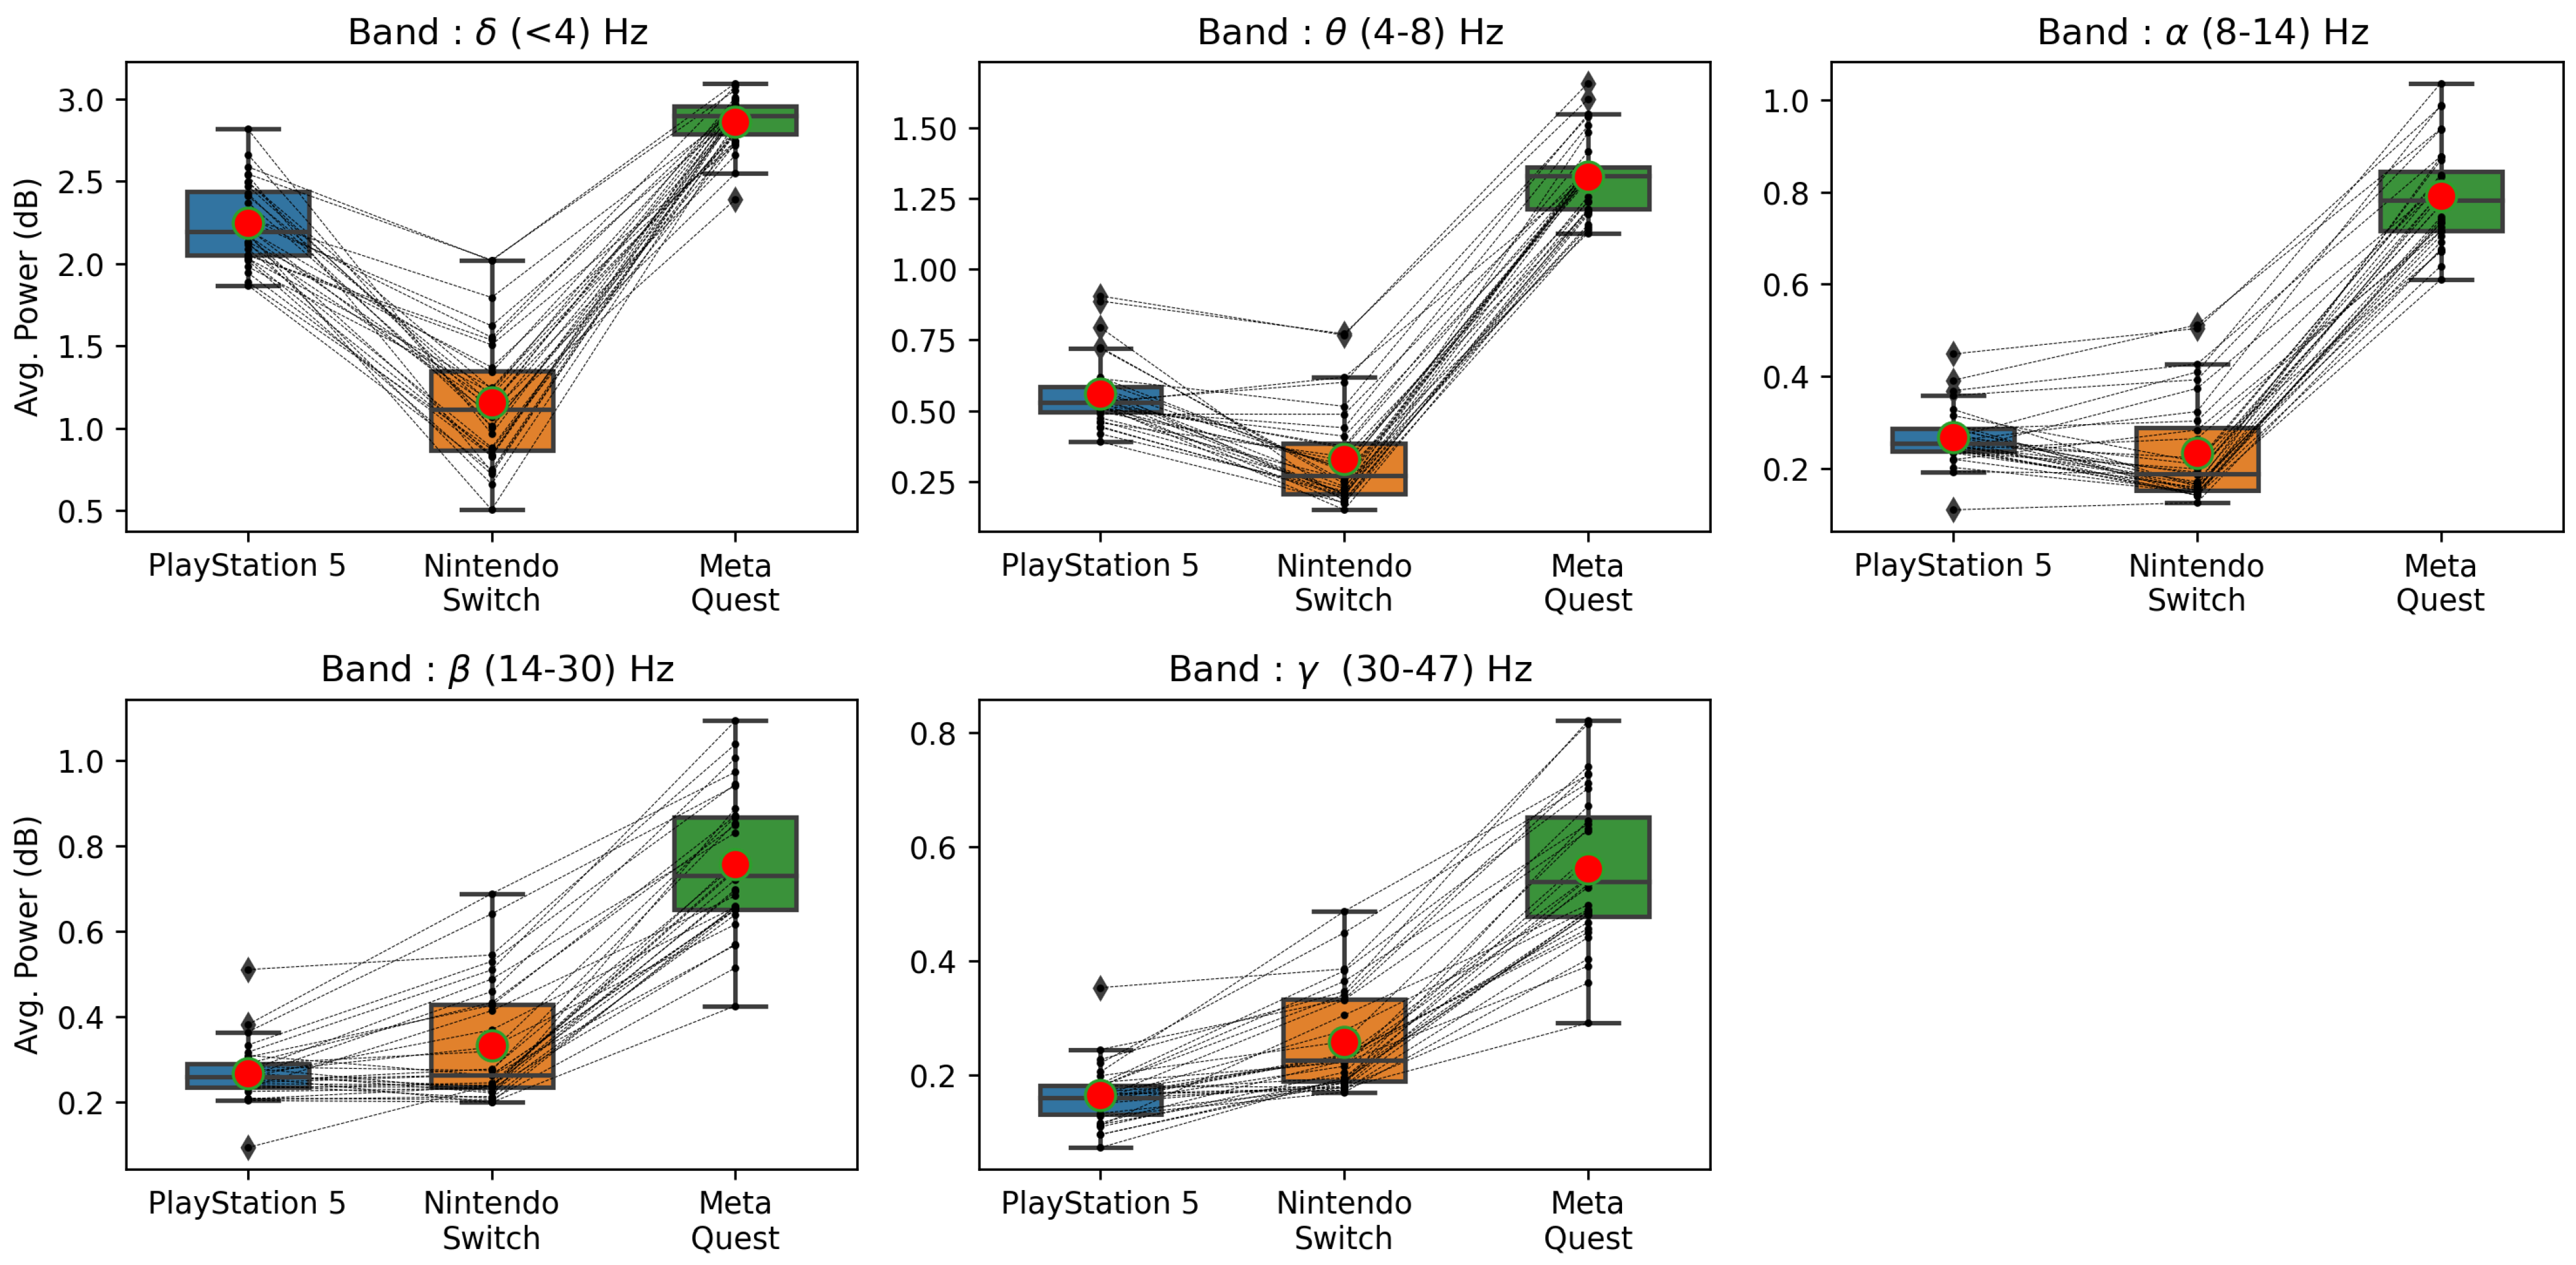
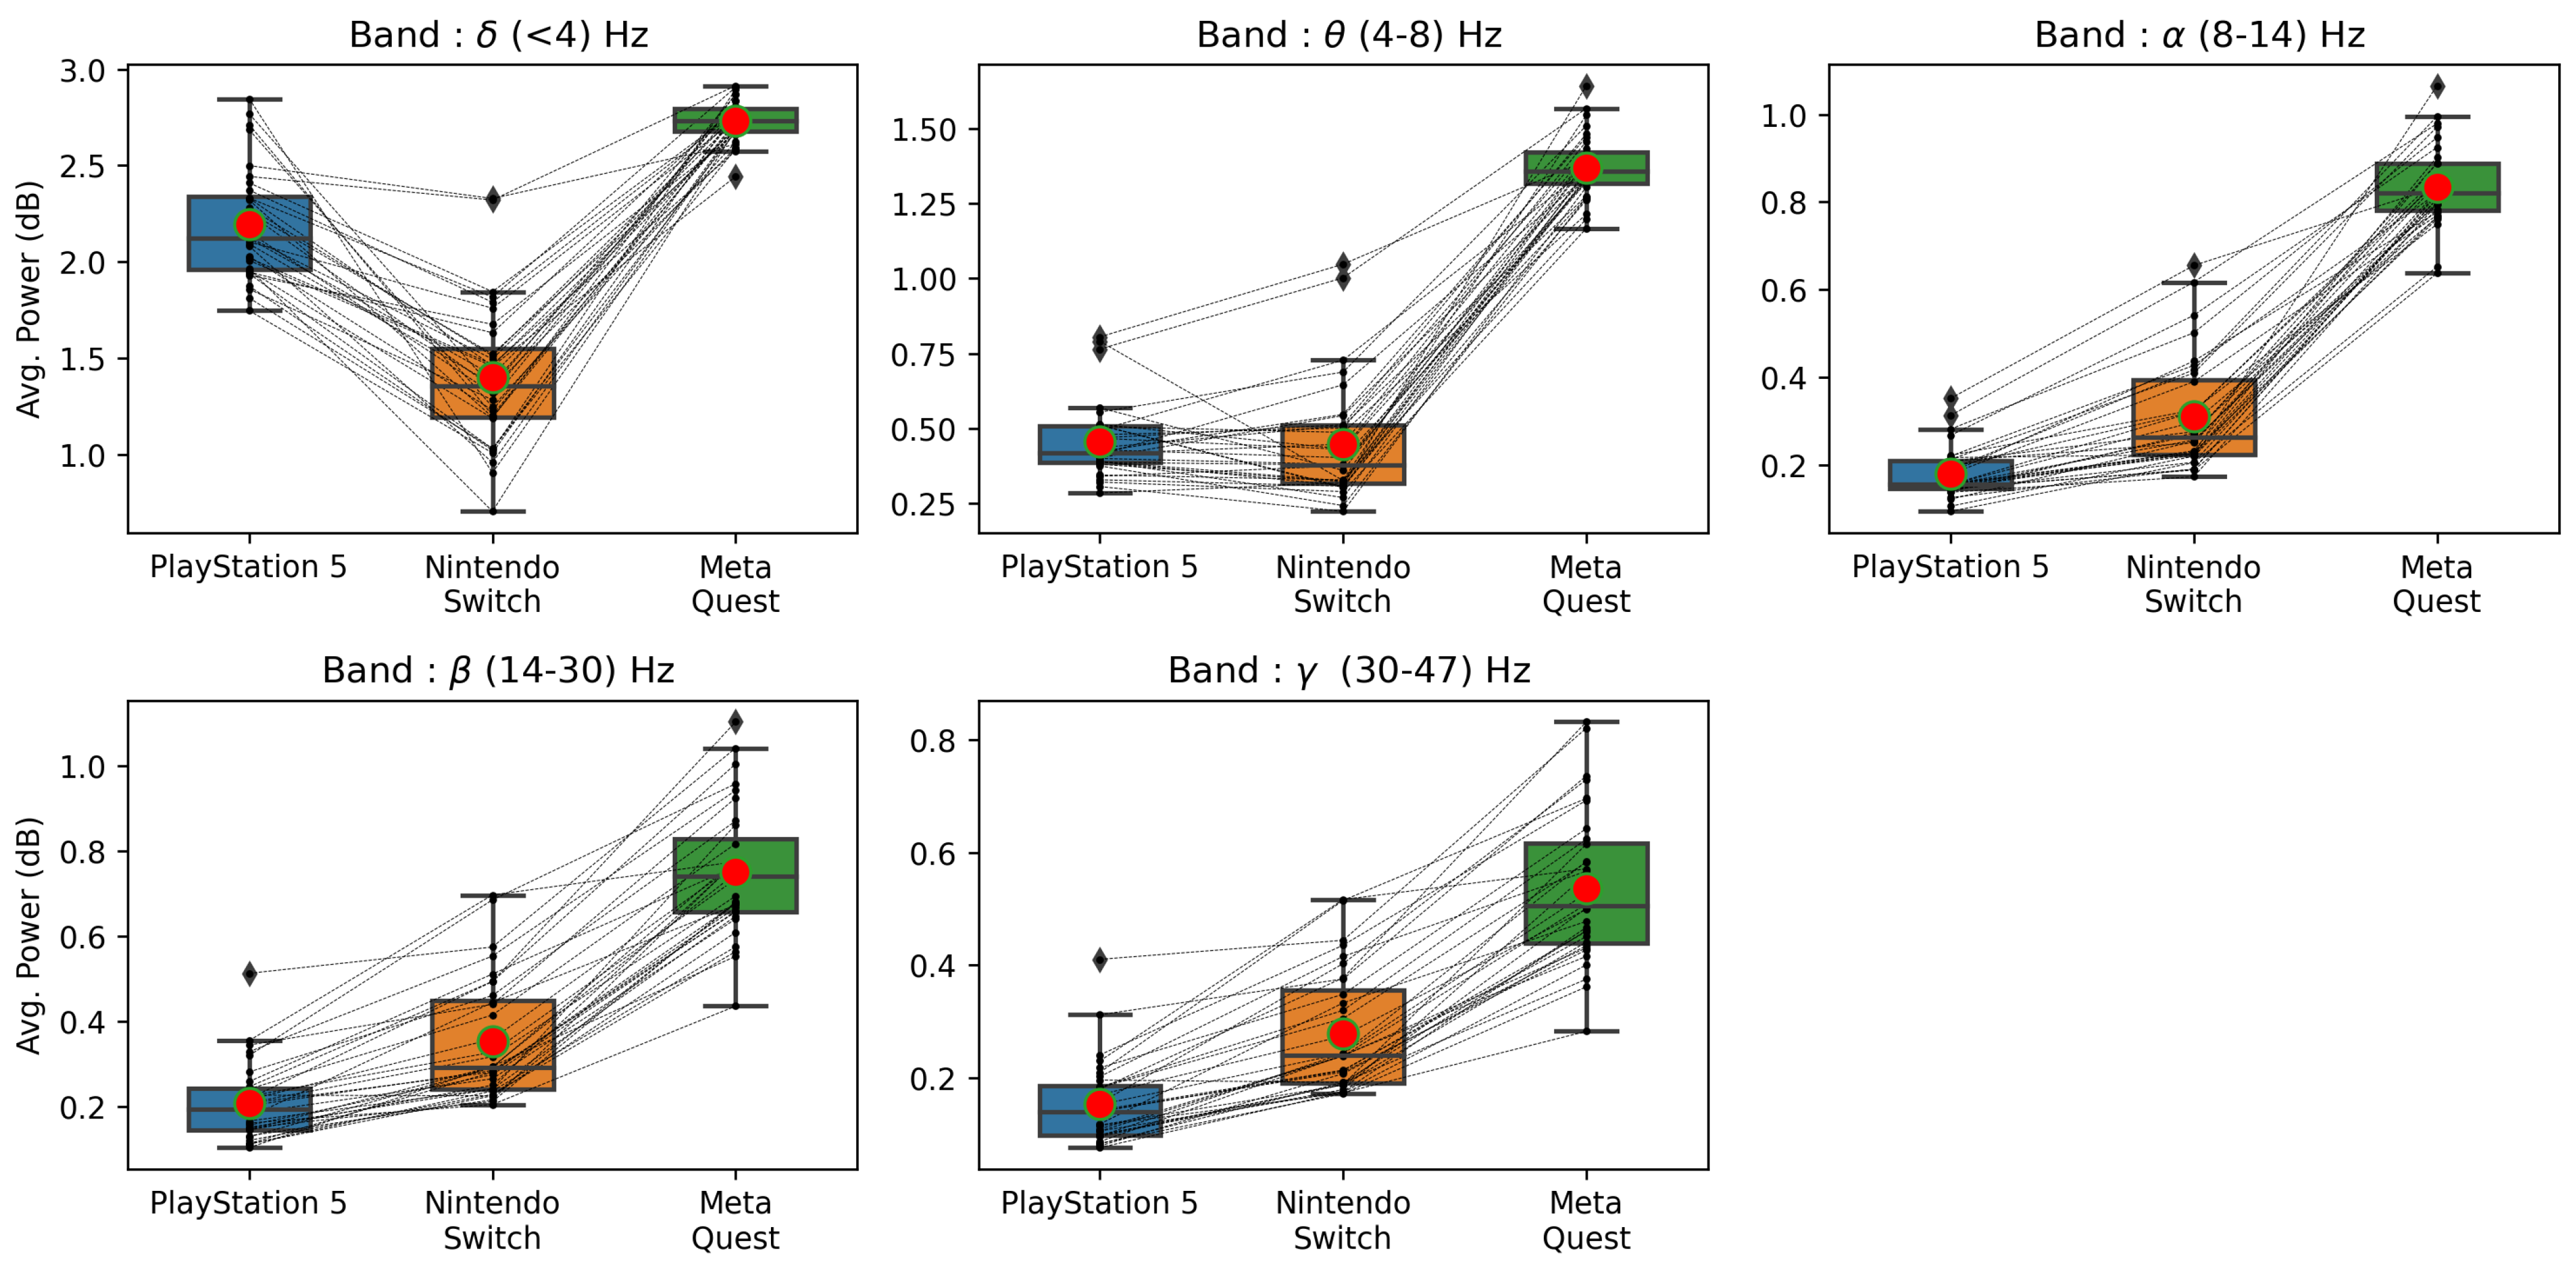
4.5. Brain Activity of Players for Low- and High-Stimulation Games across Different Game Platforms
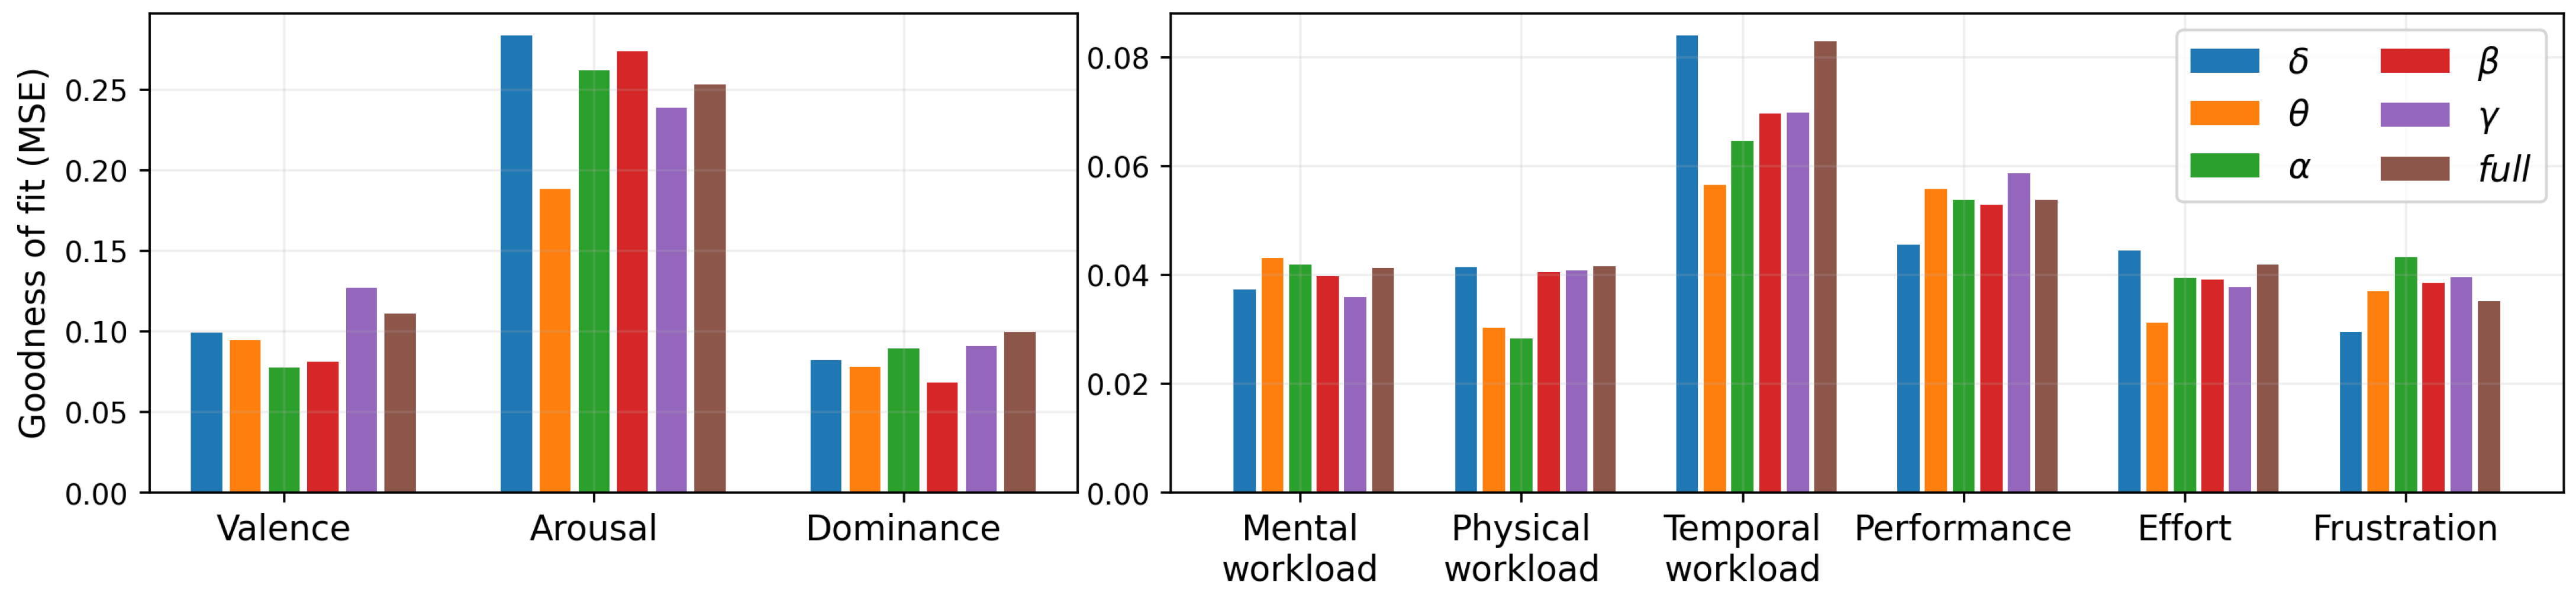
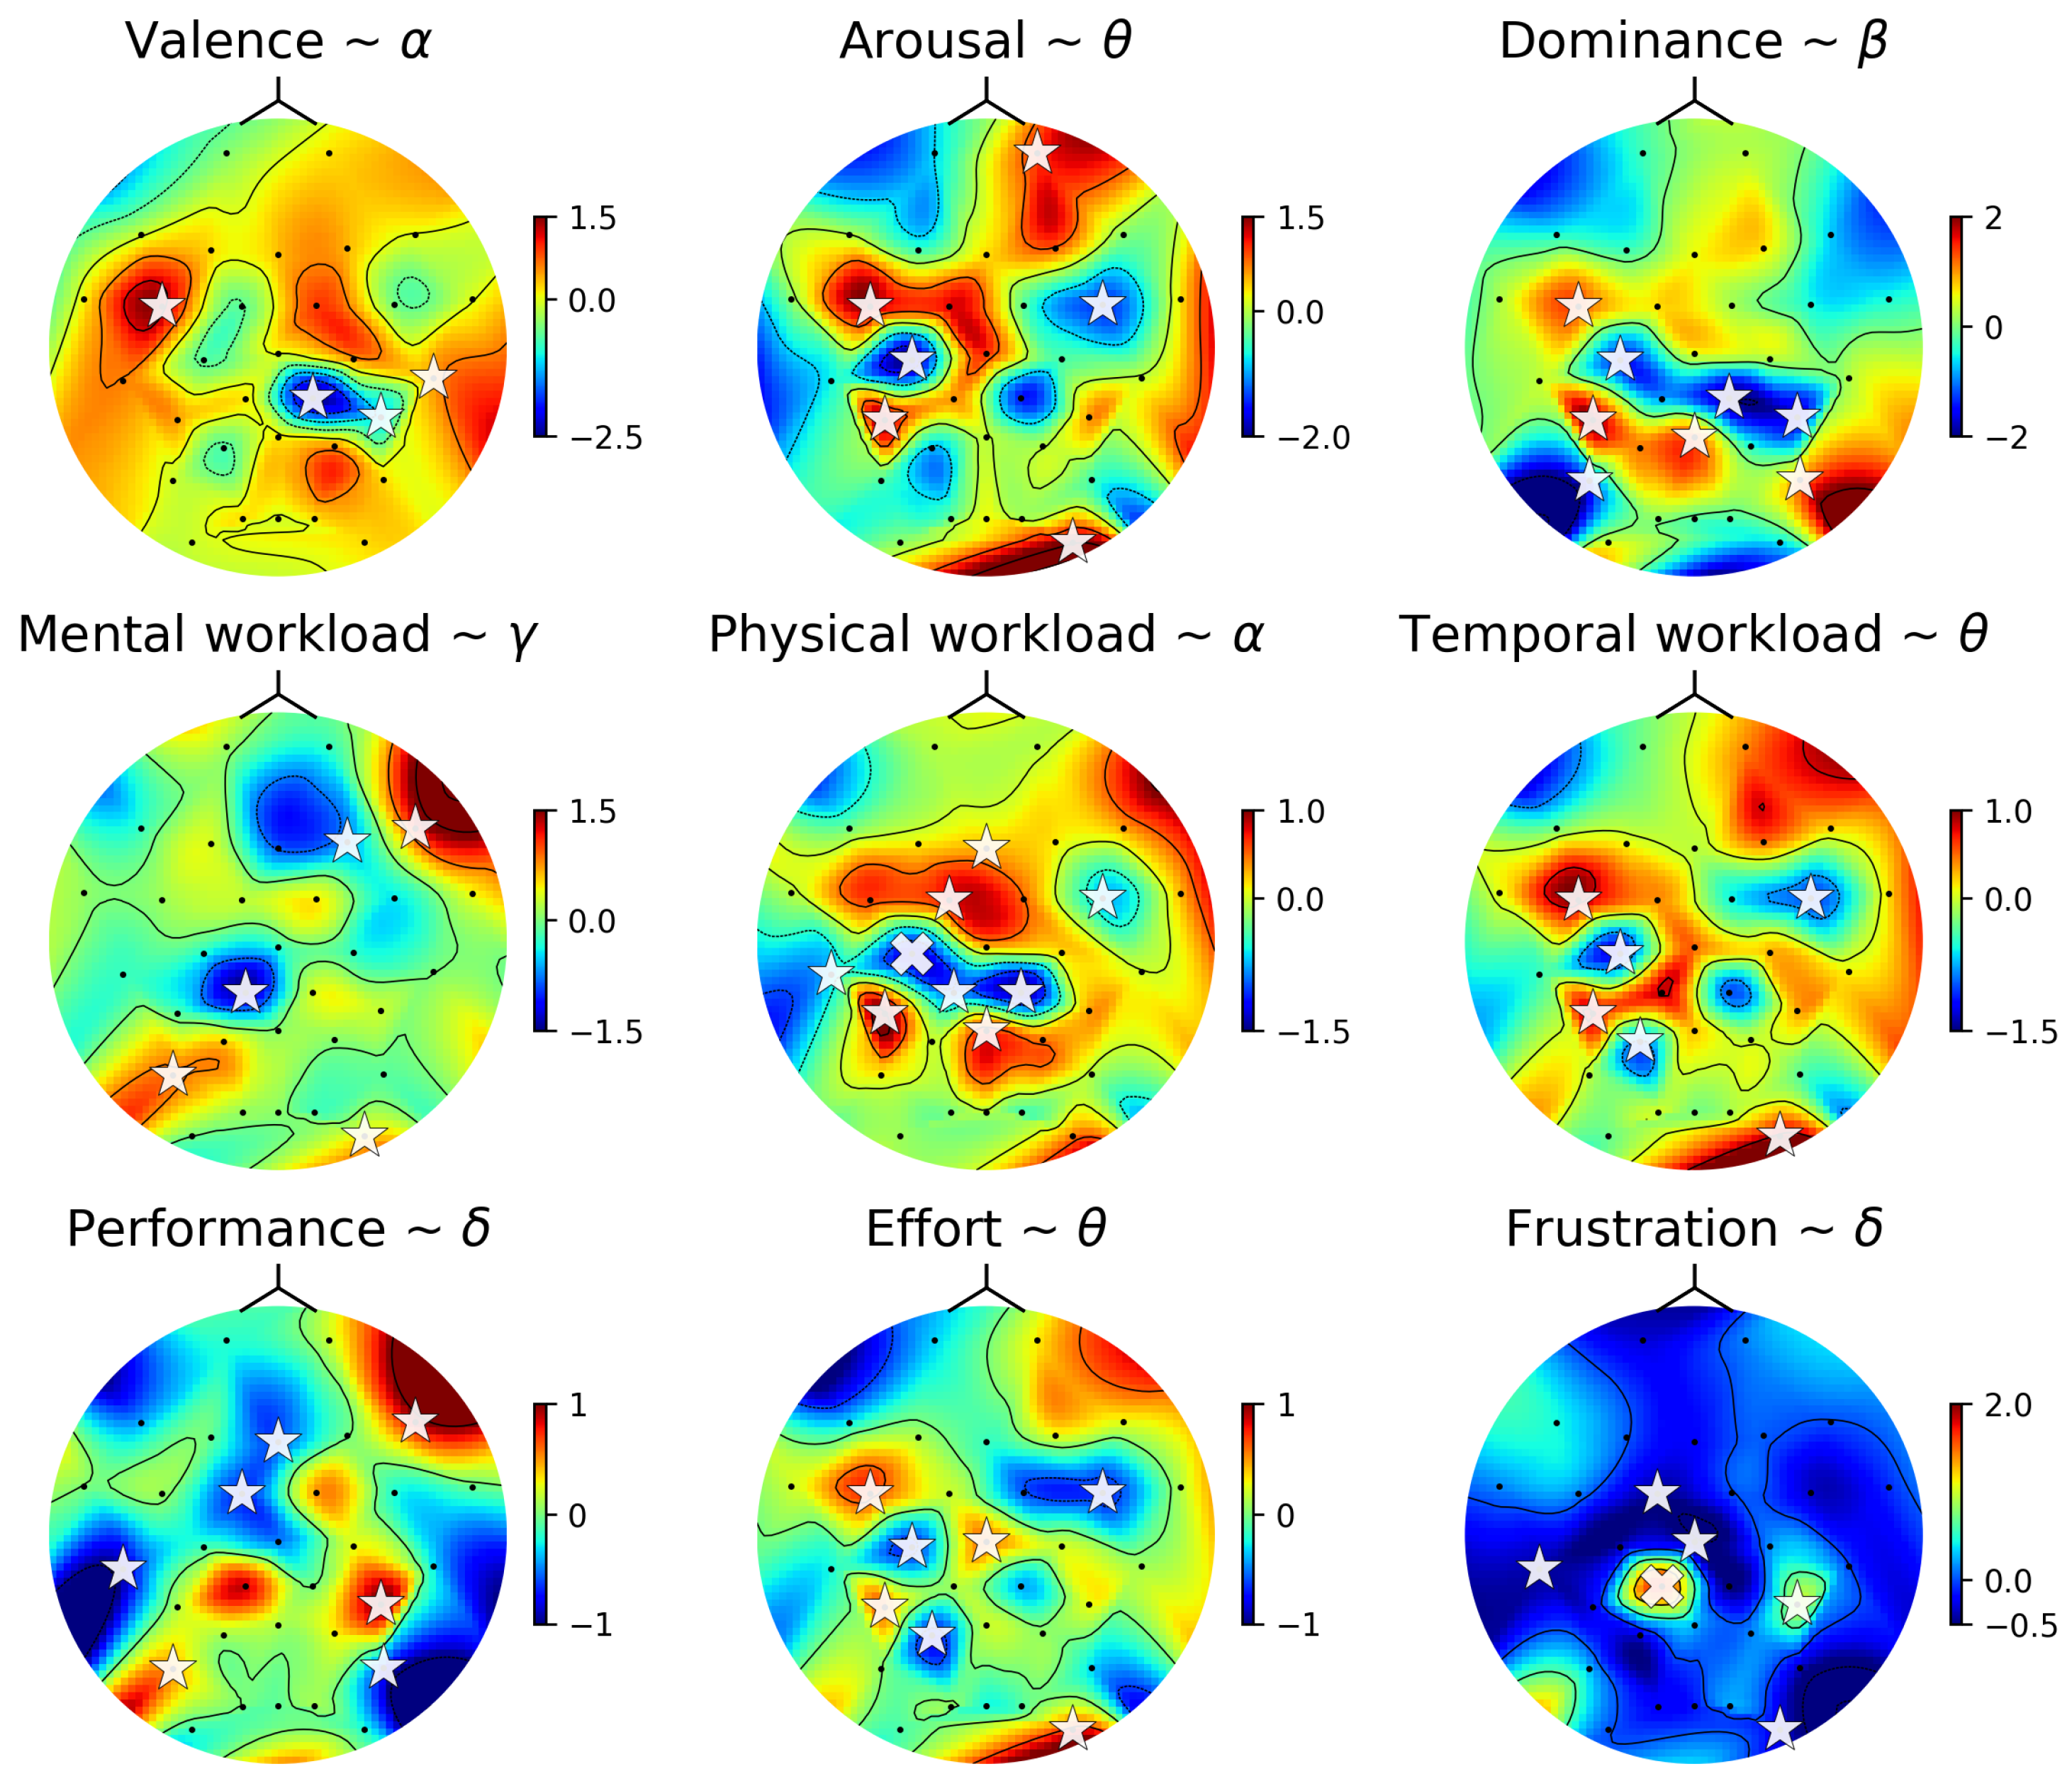
4.6. Linear Model of Subjective Responses and Brain Activity
5. Conclusions
Author Contributions
Funding
Institutional Review Board Statement
Informed Consent Statement
Data Availability Statement
Conflicts of Interest
References
- Alakus, T.B.; Gonen, M.; Turkoglu, I. Database for an emotion recognition system based on EEG signals and various computer games—GAMEEMO. Biomed. Signal Process. Control 2020, 60, 101951. [Google Scholar] [CrossRef]
- Holman, M.; Adebesin, F. Taking the subjectivity out of UX evaluation with emotiv EPOC+. In Proceedings of the SAICSIT ’19: South African Institute of Computer Scientists and Information Technologists 2019, Skukuza, South Africa, 17–18 September 2019; Association for Computing Machinery: New York, NY, USA, 2019. [Google Scholar] [CrossRef]
- Muse. Muse Website. 2024. Available online: https://choosemuse.com/ (accessed on 15 May 2024).
- NeuroSky. NeuroSky Website. 2024. Available online: https://neurosky.com/ (accessed on 15 May 2024).
- Pireva, K.; Tahir, R.; Shariq Imran, A.; Chaudhary, N. Evaluating learners’ emotional states by monitoring brain waves for comparing game-based learning approach to pen-and-paper. In Proceedings of the 2019 IEEE Frontiers in Education Conference (FIE), Covington, KY, USA, 16–19 October 2019; pp. 1–8. [Google Scholar] [CrossRef]
- Kosiński, J.; Szklanny, K.; Wieczorkowska, A.; Wichrowski, M. An analysis of game-related emotions using EMOTIV EPOC. In Proceedings of the 2018 Federated Conference on Computer Science and Information Systems (FedCSIS), Poznan, Poland, 9–12 September 2018; pp. 913–917. [Google Scholar]
- Martínez-Tejada, L.A.; Puertas-González, A.; Yoshimura, N.; Koike, Y. Exploring EEG Characteristics to Identify Emotional Reactions under Videogame Scenarios. Brain Sci. 2021, 11, 378. [Google Scholar] [CrossRef] [PubMed]
- Ramirez, R.; Planas, J.; Escude, N.; Mercade, J.; Farriols, C. EEG-Based Analysis of the Emotional Effect of Music Therapy on Palliative Care Cancer Patients. Front. Psychol. 2018, 9, 254. [Google Scholar] [CrossRef] [PubMed]
- Dadebayev, D.; Goh, W.W.; Tan, E.X. EEG-based emotion recognition: Review of commercial EEG devices and machine learning techniques. J. King Saud Univ.-Comput. Inf. Sci. 2022, 34, 4385–4401. [Google Scholar] [CrossRef]
- Haider, A.; Wallner, G.; Gerling, K.; Vanden Abeele, V. Preliminary Study of the Performance of the miniPXI when Measuring Player Experience throughout Game Development. In Proceedings of the CHI PLAY Companion ’23: Companion Proceedings of the Annual Symposium on Computer-Human Interaction in Play, Stratford, ON, Canada, 10–13 October 2023; Association for Computing Machinery: New York, NY, USA, 2023; pp. 56–62. [Google Scholar] [CrossRef]
- Denisova, A.; Nordin, A.I.; Cairns, P. The convergence of player experience questionnaires. In Proceedings of the CHI PLAY ’16: 2016 Annual Symposium on Computer-Human Interaction in Play, Austin, TX, USA, 16–19 October 2016; Association for Computing Machinery: New York, NY, USA, 2016; pp. 33–37. [Google Scholar] [CrossRef]
- Cui, R.; Jiang, J.; Zeng, L.; Jiang, L.; Xia, Z.; Dong, L.; Gong, D.; Yan, G.; Ma, W.; Yao, D. Action Video Gaming Experience Related to Altered Resting-State EEG Temporal and Spatial Complexity. Front. Hum. Neurosci. 2021, 15, 640329. [Google Scholar] [CrossRef] [PubMed]
- Russell, J. A circumplex model of affect. J. Personal. Soc. Psychol. 1980, 39, 1161–1178. [Google Scholar] [CrossRef]
- Surangsrirat, D.; Intarapanich, A. Analysis of the meditation brainwave from consumer EEG device. In Proceedings of the SoutheastCon 2015, Fort Lauderdale, FL, USA, 9–12 April 2015; pp. 1–6. [Google Scholar] [CrossRef]
- Sabio, J.; Williams, N.S.; McArthur, G.M.; Badcock, N.A. A scoping review on the use of consumer-grade EEG devices for research. PLoS ONE 2024, 19, e0291186. [Google Scholar] [CrossRef] [PubMed]
- Sarhan, S.M.; Al-Faiz, M.Z.; Takhakh, A.M. A review on EMG/EEG based control scheme of upper limb rehabilitation robots for stroke patients. Heliyon 2023, 9, e18308. [Google Scholar] [CrossRef] [PubMed]
- Patil, A.U.; Lin, C.; Lee, S.H.; Huang, H.W.; Wu, S.C.; Madathil, D.; Huang, C.M. Review of EEG-based neurofeedback as a therapeutic intervention to treat depression. Psychiatry Res. Neuroimaging 2023, 329, 111591. [Google Scholar] [CrossRef]
- Chen, J.; Xia, Y.; Zhou, X.; Vidal Rosas, E.; Thomas, A.; Loureiro, R.; Cooper, R.J.; Carlson, T.; Zhao, H. fNIRS-EEG BCIs for Motor Rehabilitation: A Review. Bioengineering 2023, 10, 1393. [Google Scholar] [CrossRef]
- OpenBCI. OpenBCI. 2024. Available online: https://openbci.com/ (accessed on 13 May 2024).
- LaRocco, J.; Le, M.D.; Paeng, D.G. A Systemic Review of Available Low-Cost EEG Headsets Used for Drowsiness Detection. Front. Neuroinform. 2020, 14, 553352. [Google Scholar] [CrossRef] [PubMed]
- Chen, J.; Lin, X.; Ma, W.; Wang, Y.; Tang, W. EEG-based emotion recognition for road accidents in a simulated driving environment. Biomed. Signal Process. Control 2024, 87, 105411. [Google Scholar] [CrossRef]
- Bai, L.; Guo, J.; Xu, T.; Yang, M. Emotional Monitoring of Learners Based on EEG Signal Recognition. In Procedia Computer Science, Proceedings of the 2019 International Conference on Identification, Information and Knowledge in the Internet of Things, Jinan, China, 25–27 October 2019; Elsevier: Amsterdam, The Netherlands, 2020; Volume 174, pp. 364–368. [Google Scholar] [CrossRef]
- Liu, L.; Ji, Y.; Gao, Y.; Li, T.; Xu, W. A Data-Driven Adaptive Emotion Recognition Model for College Students Using an Improved Multifeature Deep Neural Network Technology. Comput. Intell. Neurosci. 2022, 2022, 1343358. [Google Scholar] [CrossRef] [PubMed]
- Avola, D.; Cinque, L.; Mambro, A.D.; Fagioli, A.; Marini, M.R.; Pannone, D.; Fanini, B.; Foresti, G.L. Spatio-Temporal Image-Based Encoded Atlases for EEG Emotion Recognition. Int. J. Neural Syst. 2024, 34, 2450024. [Google Scholar] [CrossRef] [PubMed]
- Sánchez-Reolid, R.; Martínez-Sáez, M.C.; García-Martínez, B.; Fernández-Aguilar, L.; Ros, L.; Latorre, J.M.; Fernández-Caballero, A. Emotion Classification from EEG with a Low-Cost BCI Versus a High-End Equipment. Int. J. Neural Syst. 2022, 32, 2250041. [Google Scholar] [CrossRef] [PubMed]
- Suhaimi, N.S.; Mountstephens, J.; Teo, J. A Dataset for Emotion Recognition Using Virtual Reality and EEG (DER-VREEG): Emotional State Classification Using Low-Cost Wearable VR-EEG Headsets. Big Data Cogn. Comput. 2022, 6, 16. [Google Scholar] [CrossRef]
- Sakib, N.; Faruk, T.; Islam, M.K. Wireless EEG based anxiety screening among young adults using machine learning model. In Proceedings of the ICBSP ’23: 2023 8th International Conference on Biomedical Imaging, Signal Processing, Singapore, 20–22 October 2023; Association for Computing Machinery: New York, NY, USA, 2024; pp. 97–103. [Google Scholar] [CrossRef]
- Trigka, M.; Dritsas, E.; Fidas, C. A survey on signal processing methods for EEG-based brain computer interface systems. In Proceedings of the PCI ’22: 26th Pan-Hellenic Conference on Informatics, Athens, Greece, 25–27 November 2022; Association for Computing Machinery: New York, NY, USA, 2023; pp. 213–218. [Google Scholar] [CrossRef]
- Liu, Y.; Sourina, O.; Nguyen, M.K. Real-time EEG-based human emotion recognition and visualization. In Proceedings of the 2010 International Conference on Cyberworlds, Singapore, 20–22 October 2010; pp. 262–269. [Google Scholar] [CrossRef]
- Cano, S.; Araujo, N.; Guzman, C.; Rusu, C.; Albiol-Pérez, S. Low-Cost Assessment of User eXperience Through EEG Signals. IEEE Access 2020, 8, 158475–158487. [Google Scholar] [CrossRef]
- Ahonen, V.; Leino, M.; Lipping, T. Electroencephalography in evaluating mental workload of gaming. In Proceedings of the 2021 43rd Annual International Conference of the IEEE Engineering in Medicine & Biology Society (EMBC), Virtual, 1–5 November 2021; pp. 845–848. [Google Scholar] [CrossRef]
- Marucci, M.; Di Flumeri, G.; Borghini, G.; Sciaraffa, N.; Scandola, M.; Pavone, E.; Babiloni, F.; Betti, V.; Aricò, P. The impact of multisensory integration and perceptual load in virtual reality settings on performance, workload and presence. Sci. Rep. 2021, 11, 4831. [Google Scholar] [CrossRef]
- Zyma, I.; Tukaev, S.; Seleznov, I.; Kiyono, K.; Popov, A.; Chernykh, M.; Shpenkov, O. Electroencephalograms during Mental Arithmetic Task Performance. Data 2019, 4, 14. [Google Scholar] [CrossRef]
- Babusiak, B.; Hostovecky, M.; Smondrk, M.; Huraj, L. Spectral Analysis of Electroencephalographic Data in Serious Games. Appl. Sci. 2021, 11, 2480. [Google Scholar] [CrossRef]
- Pellouchoud, E.; Smith, M.E.; McEvoy, L.; Gevins, A. Mental Effort-Related EEG Modulation During Video-Game Play: Comparison Between Juvenile Subjects with Epilepsy and Normal Control Subjects. Epilepsia 1999, 40, 38–43. [Google Scholar] [CrossRef] [PubMed]
- Malik, A.S.; Osman, D.A.; Pauzi, A.A.; Khairuddin, R.N.H.R. Investigating brain activation with respect to playing video games on large screens. In Proceedings of the 2012 4th International Conference on Intelligent and Advanced Systems (ICIAS2012), Kuala Lumpur, Malaysia, 12–14 June 2012; Volume 1, pp. 86–90. [Google Scholar] [CrossRef]
- Mondéjar, T.; Hervás, R.; Johnson, E.; Gutierrez, C.; Latorre, J.M. Correlation between videogame mechanics and executive functions through EEG analysis. J. Biomed. Inform. 2016, 63, 131–140. [Google Scholar] [CrossRef]
- Khairuddin, H.R.; Malik, A.S.; Mumtaz, W.; Kamel, N.; Xia, L. Analysis of EEG signals regularity in adults during video game play in 2D and 3D. In Proceedings of the 2013 35th Annual International Conference of the IEEE Engineering in Medicine and Biology Society (EMBC), Osaka, Japan, 3–7 July 2013; pp. 2064–2067. [Google Scholar] [CrossRef]
- Cabañero-Gómez, L.; Hervas, R.; Bravo, J.; Rodriguez-Benitez, L. Computational EEG Analysis Techniques When Playing Video Games: A Systematic Review. Proceedings 2018, 2, 483. [Google Scholar] [CrossRef]
- GomezRomero-Borquez, J.; Del Puerto-Flores, J.A.; Del-Valle-Soto, C. Mapping EEG Alpha Activity: Assessing Concentration Levels during Player Experience in Virtual Reality Video Games. Future Internet 2023, 15, 264. [Google Scholar] [CrossRef]
- Naumann, L.; Schultze-Kraft, M.; Dähne, S.; Blankertz, B. Prediction of difficulty levels in video games from ongoing EEG. In Proceedings of the Symbiotic Interaction, Padua, Italy, 29–30 September 2016; Gamberini, L., Spagnolli, A., Jacucci, G., Blankertz, B., Freeman, J., Eds.; Springer: Cham, Switzerland, 2017; pp. 125–136. [Google Scholar]
- McMahan, T.; Parberry, I.; Parsons, T.D. Evaluating electroencephalography engagement indices during video game play. In Proceedings of the International Conference on Foundations of Digital Games, Pacific Grove, CA, USA, 22–25 June 2015. [Google Scholar]
- Oliveira, S.M.S.d.; Medeiros, C.S.P.d.; Pacheco, T.B.F.; Bessa, N.P.O.S.; Silva, F.G.M.; Tavares, N.S.A.; Rego, I.A.O.; Campos, T.F.; Cavalcanti, F.A.d.C. Electroencephalographic changes using virtual reality program. Neurol. Res. 2018, 40, 160–165. [Google Scholar] [CrossRef] [PubMed]
- Paranthaman, P.K.; Vallabhajosula, S.; Giordano, A.; Walton, S.; Tuisa, O.; Bajaj, N. User experience analysis in obstacle clearance tasks in virtual and mixed reality environments. In Intelligent Sustainable Systems, Selected Papers of WorldS4 2022; Nagar, A.K., Singh Jat, D., Mishra, D.K., Joshi, A., Eds.; Springer: Singapore, 2023; pp. 675–686. [Google Scholar]
- Beyer, J.; Varbelow, R.; Antons, J.N.; Möller, S. Using electroencephalography and subjective self-assessment to measure the influence of quality variations in cloud gaming. In Proceedings of the 2015 Seventh International Workshop on Quality of Multimedia Experience (QoMEX), Pilos, Greece, 26–29 May 2015; pp. 1–6. [Google Scholar] [CrossRef]
- Pangistu, L.; Azhari, A. Deep Learning on Game Addiction Detection Based on Electroencephalogram. J. Media Inform. Budidarma 2021, 5, 963. [Google Scholar] [CrossRef]
- Hossain, E.; Kulshreshth, A.K. Exploring the effects of stereoscopic 3D on gaming experience using physiological sensors. In Proceedings of the SUI ’19: Symposium on Spatial User Interaction, New Orleans, LA, USA, 19–20 October 2019; Association for Computing Machinery: New York, NY, USA, 2019. [Google Scholar] [CrossRef]
- Amjad, I.; Toor, H.; Niazi, I.K.; Pervaiz, S.; Jochumsen, M.; Shafique, M.; Haavik, H.; Ahmed, T. Xbox 360 Kinect Cognitive Games Improve Slowness, Complexity of EEG, and Cognitive Functions in Subjects with Mild Cognitive Impairment: A Randomized Control Trial. Games Health J. 2019, 8, 144–152. [Google Scholar] [CrossRef] [PubMed]
- Paranthaman, P.K.; Bajaj, N.; Solovey, N.; Jennings, D. Comparative evaluation of the EEG performance metrics and player ratings on the virtual reality games. In Proceedings of the 2021 IEEE Conference on Games (CoG), Copenhagen, Denmark, 17–20 August 2021; pp. 1–8. [Google Scholar] [CrossRef]
- EMOTIV. EPOC Flex. 2024. Available online: https://www.emotiv.com/pages/epoc-flex (accessed on 12 May 2024).
- Bradley, M.M.; Lang, P.J. Measuring emotion: The self-assessment manikin and the semantic differential. J. Behav. Ther. Exp. Psychiatry 1994, 25, 49–59. [Google Scholar] [CrossRef]
- Hart, S.G.; Staveland, L.E. Development of NASA-TLX (task load index): Results of empirical and theoretical research. In Human Mental Workload; Advances in Psychology; Hancock, P.A., Meshkati, N., Eds.; North-Holland: Amsterdam, The Netherlands, 1988; Volume 52, pp. 139–183. [Google Scholar] [CrossRef]
- Bajaj, N.; Requena Carrión, J.; Bellotti, F.; Berta, R.; De Gloria, A. Automatic and tunable algorithm for EEG artifact removal using wavelet decomposition with applications in predictive modeling during auditory tasks. Biomed. Signal Process. Control 2020, 55, 101624. [Google Scholar] [CrossRef]


| Player Experience | Low Stimulation | High Stimulation | ||||
|---|---|---|---|---|---|---|
| PS5-NS | PS5-MQ | NS-MQ | PS5-NS | PS5-MQ | NS-MQ | |
| Valence | 0.705 | 0.031 * | 0.023 * | 0.623 | 0.008 * | 0.011 * |
| Arousal | 0.385 | 0.345 | 0.545 | 0.104 | 0.650 | 0.054 |
| Dominance | 0.705 | 0.009 * | 0.019 * | 0.880 | 0.005 * | 0.004 * |
| Mental workload | 0.545 | 0.004 * | 0.004 * | 0.257 | 0.186 | 0.940 |
| Physical workload | 0.241 | 0.151 | 0.850 | 0.623 | 0.045 * | 0.049 * |
| Temporal workload | 0.705 | 0.597 | 0.112 | 0.821 | 0.910 | 0.880 |
| Performance | 0.473 | 0.005 * | 0.007 * | 0.001 * | 0.003 * | 0.521 |
| Effort | 0.041 * | 0.450 | 0.002 * | 0.257 | 0.545 | 0.226 |
| Frustration | 0.940 | 0.001 * | 0.000 † | 0.762 | 0.059 | 0.017 * |
| Player Experience | Frequency Band | Sensors with p < 0.05 |
|---|---|---|
| Valence | Alpha | FC5, CP2, CP6, T8 |
| Arousal | Theta | C3, FC5, CP5, PO10, FC6, Fp2 |
| Dominance | Beta | C3, FC5, CP5, P7, Pz, P8, CP2, CP6 |
| Mental workload | Gamma | CP1, P7, PO10, F4, F8 |
| Physical workload | Alpha | Fz, FC1, C3†, T7, CP5, CP1, Pz, CP2, FC6 |
| Temporal workload | Theta | C3, FC5, CP5, P3, PO10, FC6 |
| Performance | Delta | Fz, FC1, T7, P7, P8, CP6, F8 |
| Effort | Theta | Cz, C3, FC5, CP5, P3, PO10, FC6 |
| Frustration | Delta | Cz, FC1, T7, CP1†, PO10, CP6 |
Disclaimer/Publisher’s Note: The statements, opinions and data contained in all publications are solely those of the individual author(s) and contributor(s) and not of MDPI and/or the editor(s). MDPI and/or the editor(s) disclaim responsibility for any injury to people or property resulting from any ideas, methods, instructions or products referred to in the content. |
© 2024 by the authors. Licensee MDPI, Basel, Switzerland. This article is an open access article distributed under the terms and conditions of the Creative Commons Attribution (CC BY) license (https://creativecommons.org/licenses/by/4.0/).
Share and Cite
Paranthaman, P.K.; Graham, S.; Bajaj, N. Assessing the Effects of Various Gaming Platforms on Players’ Affective States and Workloads through Electroencephalogram. Electronics 2024, 13, 2043. https://doi.org/10.3390/electronics13112043
Paranthaman PK, Graham S, Bajaj N. Assessing the Effects of Various Gaming Platforms on Players’ Affective States and Workloads through Electroencephalogram. Electronics. 2024; 13(11):2043. https://doi.org/10.3390/electronics13112043
Chicago/Turabian StyleParanthaman, Pratheep Kumar, Spencer Graham, and Nikesh Bajaj. 2024. "Assessing the Effects of Various Gaming Platforms on Players’ Affective States and Workloads through Electroencephalogram" Electronics 13, no. 11: 2043. https://doi.org/10.3390/electronics13112043
APA StyleParanthaman, P. K., Graham, S., & Bajaj, N. (2024). Assessing the Effects of Various Gaming Platforms on Players’ Affective States and Workloads through Electroencephalogram. Electronics, 13(11), 2043. https://doi.org/10.3390/electronics13112043