Article

RoCS: Knowledge Graph Embedding Based on Joint Cosine Similarity

1
School of Computer Science and Electronic Engineering, Hunan University, Changsha 410000, China
2
School of Journalism and Communication, Hunan University, Changsha 410000, China
*
Author to whom correspondence should be addressed.
Electronics 2024, 13(1), 147; https://doi.org/10.3390/electronics13010147
Submission received: 19 November 2023 / Revised: 19 December 2023 / Accepted: 27 December 2023 / Published: 28 December 2023
(This article belongs to the Special Issue Advances in Intelligent Data Analysis and Its Applications, Volume II)

Abstract

:
Knowledge graphs usually have many missing links, and predicting the relationships between entities has become a hot research topic in recent years. Knowledge graph embedding research maps entities and relations to a low-dimensional continuous space representation to predict links between entities. The present research shows that the key to the knowledge graph embedding approach is the design of scoring functions. According to the scoring function, knowledge graph embedding methods can be classified into dot product models and distance models. We find that the triple scores obtained using the dot product model or the distance model were unbounded, which leads to large variance. In this paper, we propose RotatE Cosine Similarity (RoCS), a method to compute the joint cosine similarity of complex vectors as a scoring function to make the triple scores bounded. Our approach combines the rotational properties of the complex vector embedding model RotatE to model complex relational patterns. The experimental results demonstrate that the newly introduced RoCS yields substantial enhancements compared to RotatE across various knowledge graph benchmarks, improving up to 4.0% in hits at 1 (Hits@1) on WN18RR and improving up to 3.3% in Hits@1 on FB15K-237. Meanwhile, our method achieves some new state-of-the-art (SOTA), including Hits@3 of 95.6%, Hits@10 of 96.4% on WN18, and mean reciprocal rank (MRR) of 48.9% and Hits@1 of 44.5% on WN18RR.

1. Introduction

Theknowledge graph is composed of many fact triples (head entity, relation, tail entity), in the directed graph, the source and target nodes correspond to the head and tail entities, respectively, while the relations are depicted as edges [1,2]. In recent years, knowledge graphs (KGs) have found applications across a broad spectrum of real-world scenarios, including intelligent question answering [3], personalized recommendation [4,5], natural language processing [6], and object detection [7,8]. However, real-world knowledge graphs including WordNet [9], Freebase [10], or Yago [11] are usually incomplete. In recent years, predicting missing links through knowledge graph embedding (KGE) has gained substantial attention as a pivotal research area in achieving knowledge graph completion [2].
KGE transforms the entities and relations within the knowledge graph into low-dimensional continuous space representations. Each fact triple (head entity, relation, tail entity) is represented as ( h , r , t ) . If entities and relations are represented using d-dimensional real vectors, h , r , t R d . To evaluate the performance of the entity and the relation representation, the KGE approach evaluates the credibility of the triples by designing a scoring function. The optimization objective of KGE is geared towards ensuring that elevated scores are assigned to positive triples, while negative triples receive lower scores. Presently, prevailing KGE methods can be classified into dot product models and distance models based on the structure of the scoring function. The dot product model is used as a triple scoring function by calculating the dot product between head entity embedding, relation embedding, and tail entity embedding. Examples of such methods include DistMult [12], HoLE [13], ComplEx [14], QuatE [15], which capture semantic information through pairwise feature interactions between potential factors. The distance model uses L 1 or L 2 distance as the scoring function. Among them, the translation model TransE [16] and the complex embedding model RotatE [17] can be classified into this category. In the distance model, the process involves either adding the head entity embedding to the relation embedding or computing the Hadamard product to obtain a vector close to the tail entity embedding. Subsequently, the distance between the two vectors is calculated. Such methods as TransH [18], TransR [19], TorusE [20] and GIE [21] utilize translation invariance to preserve the original semantic relationships.
We observe that the scoring function’s range remains unbounded, irrespective of whether it belongs to the dot product model or the distance model. This unrestricted range raises the potential for increased variance. The score range of the dot product model is from negative infinity to positive infinity, and the score range of the distance model is from 0 to positive infinity. Given that the score range of triples is unbounded, the sensitivity of triple scores to variations in both the embeddings of entities and relations results in substantial model variance. To resolve this issue, a straightforward approach is to normalize [22] both the embeddings of entities and relations. The range of triple scores is guaranteed to be bounded by eliminating the difference in numerical values between each feature. However, such approach is affected by the dimensionality of the embedding, and the score range varies for embeddings of different dimensions. As a result, to obtain a fixed bounded range, we adopt the use of cosine similarity as a scoring function. Firstly, the cosine similarity is used as a normalization mechanism, independent of the embedding dimension, and its score is fixed in the range of −1 to 1. Secondly, cosine similarity stands out as a widely employed semantic similarity measure, commonly used to assess the similarity between document vectors [23,24,25]. Smaller angles between similar vectors aid in distinguishing the encoded information of various types of entity embeddings.
To achieve this goal, we propose RoCS, a KGE based on joint cosine similarity. Cosine similarity is chosen for its bounded range, dimensionality independence, and effectiveness in capturing semantic relationships. This measure ensures numerical stability during training and adapts seamlessly to varying dimensions of embeddings. The rotation embedding model RotatE [17] is a stronger baseline for reasoning about three important relational patterns in knowledge graphs, i.e., symmetric/antisymmetric, inverse and composition. RotatE uses L 2 distance as the score function to score an unbounded range, while we consider the use of cosine similarity as the score function to ensure that the score range is bounded. However, directly calculating the cosine similarity result for two complex vectors can be intricate, while we need a real number result to score the triplet. To address this challenge, we present a joint cosine similarity calculation method as the complex vector cosine similarity, as shown in Figure 1. Specific, we merge the real and imaginary aspects of the complex vector into a novel joint vector, and subsequently compute the cosine similarity of this joint vector. It can be found that the joint cosine similarity does not change the range of the calculated results while reflecting the overall similarity between the two complex vectors. We evaluate the performance of our method on FB15K [16], FB15K-237 [26], WN18 [16], and WN18RR [27] datasets for the link prediction task. Experimental results show that our method outperforms the current state-of-the-art complex vector embedding models ComplEx [14] and RotatE [17] on all evaluation metrics for all datasets. Furthermore, the proposed method RoCS is highly competitive with the current state-of-the-art methods [15,28,29]. We also explore various techniques for computing the cosine similarity of complex vectors, and through experiments, we validate the superiority of our proposed joint method over other approaches.
In summary, the primary contributions of our work are as follows:
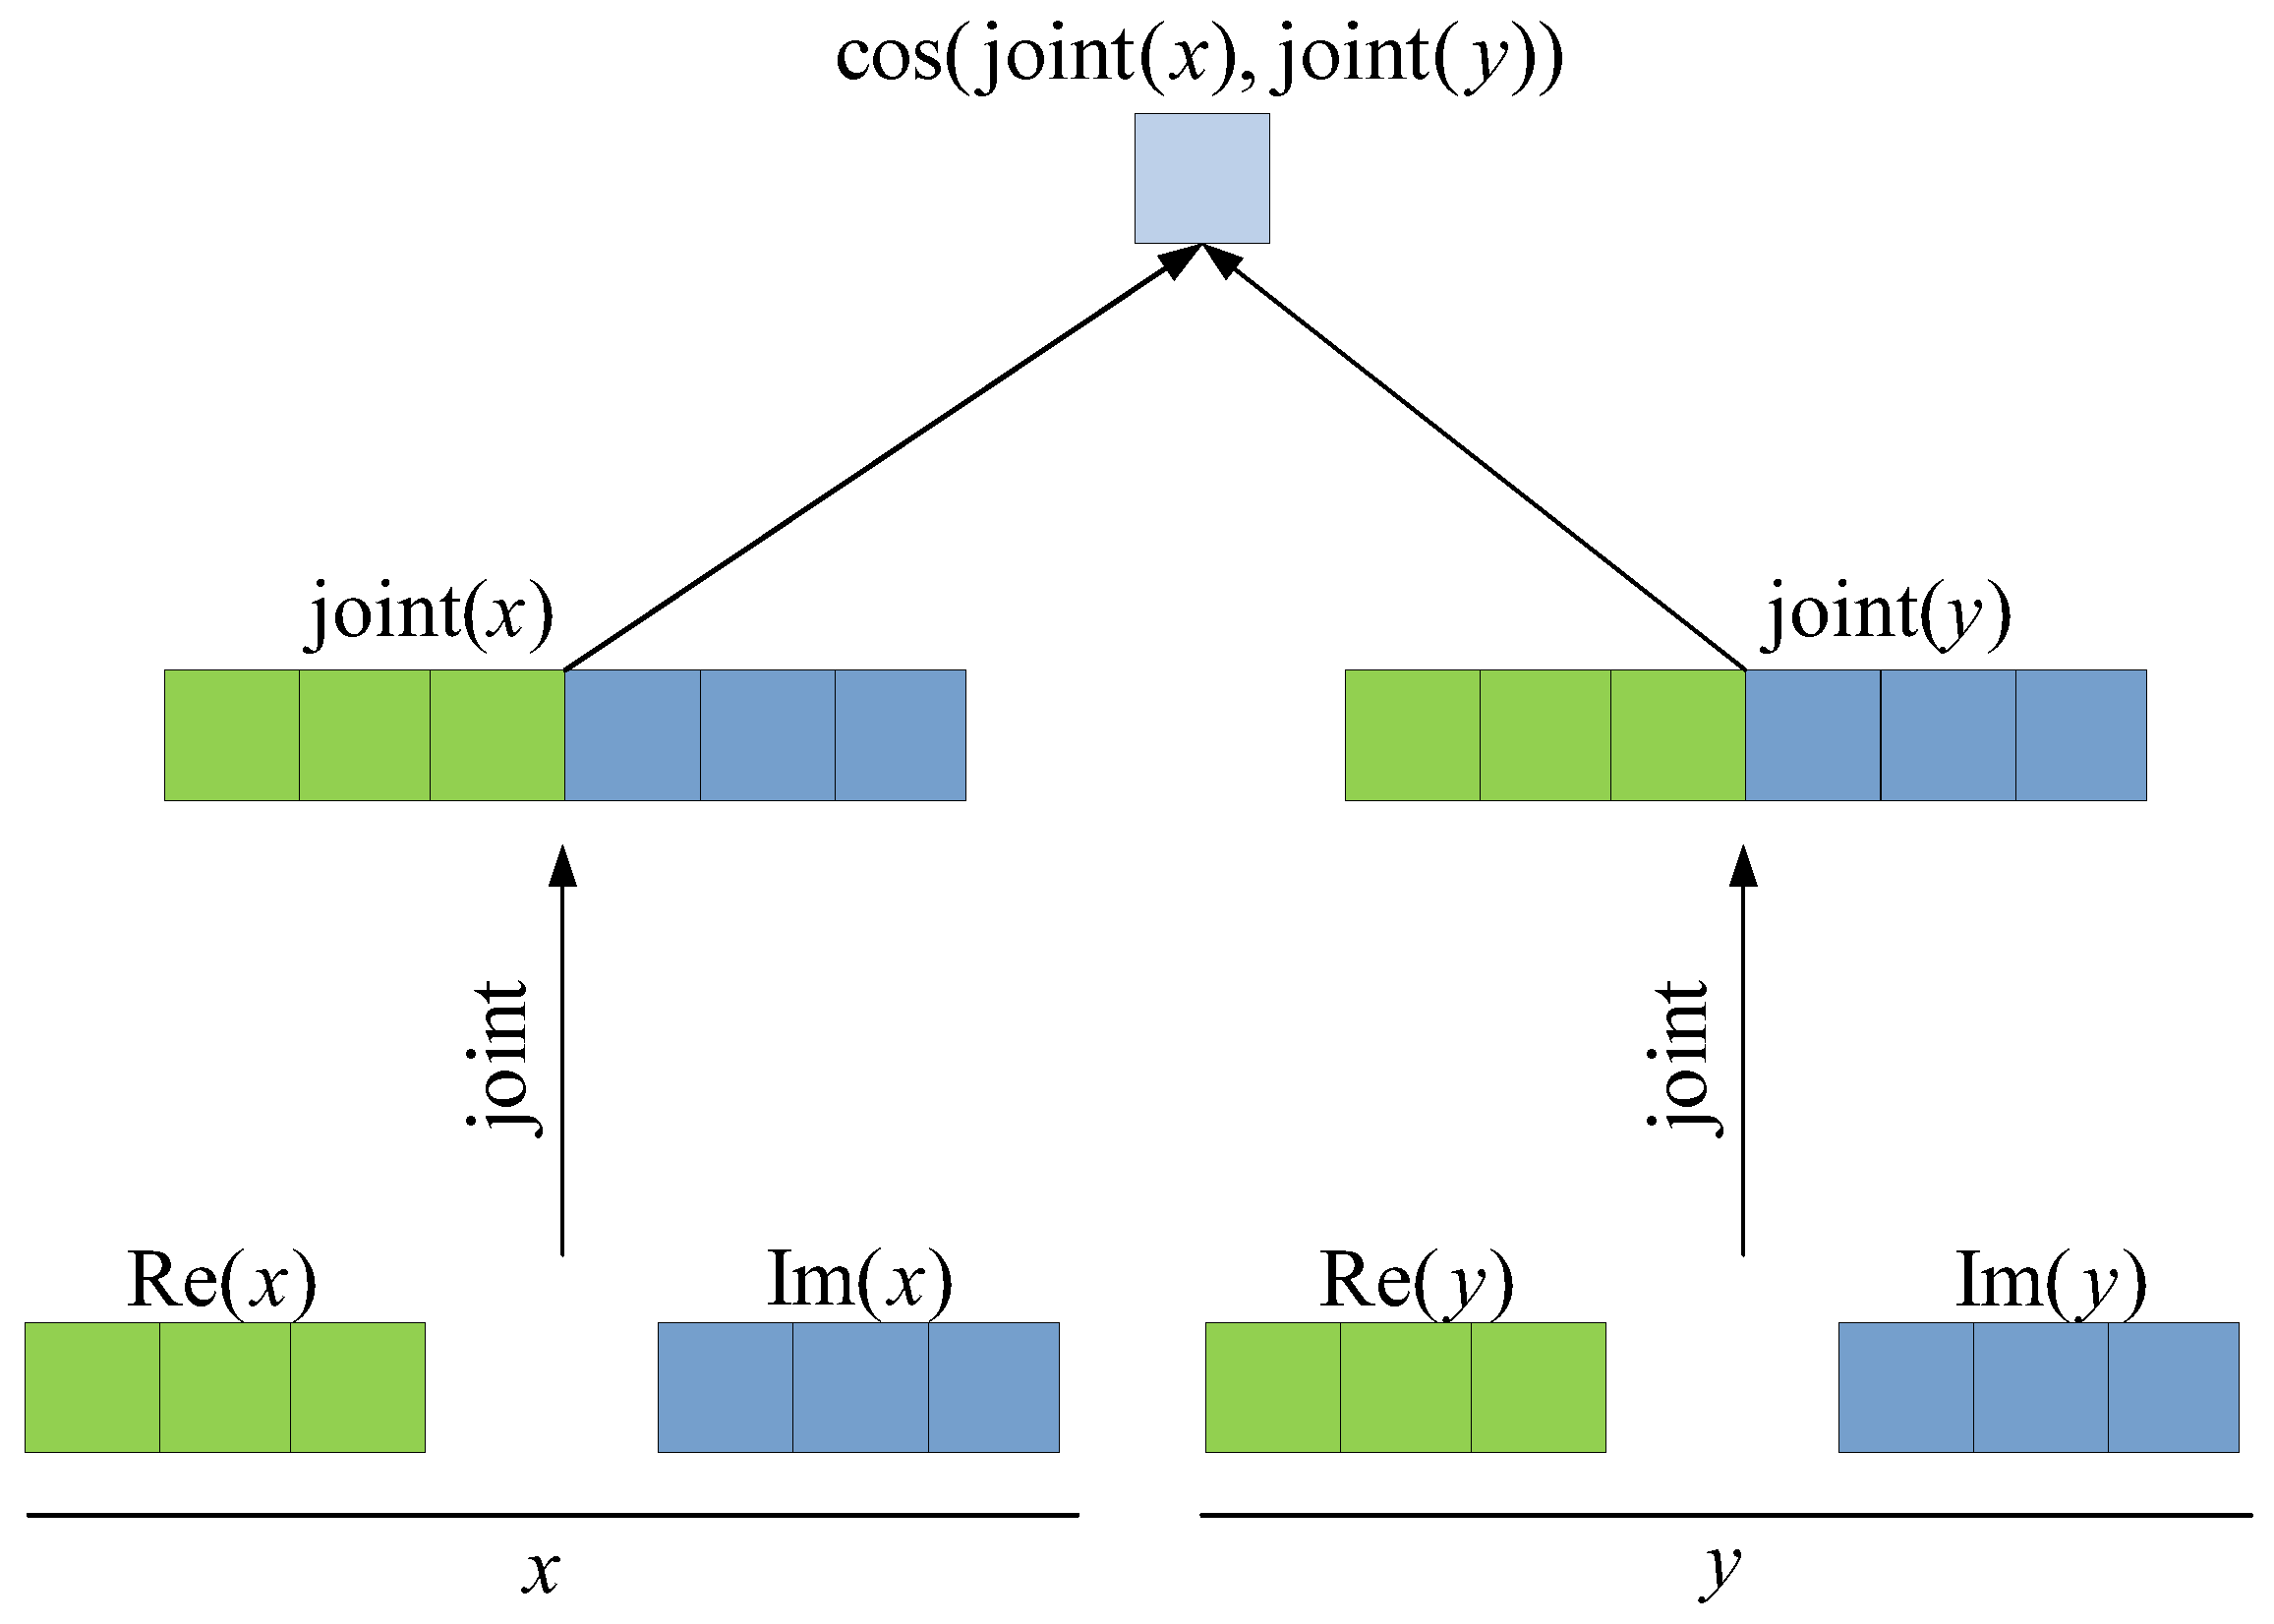
  • We propose a joint cosine similarity method to calculate the complex vector similarity as a scoring function.
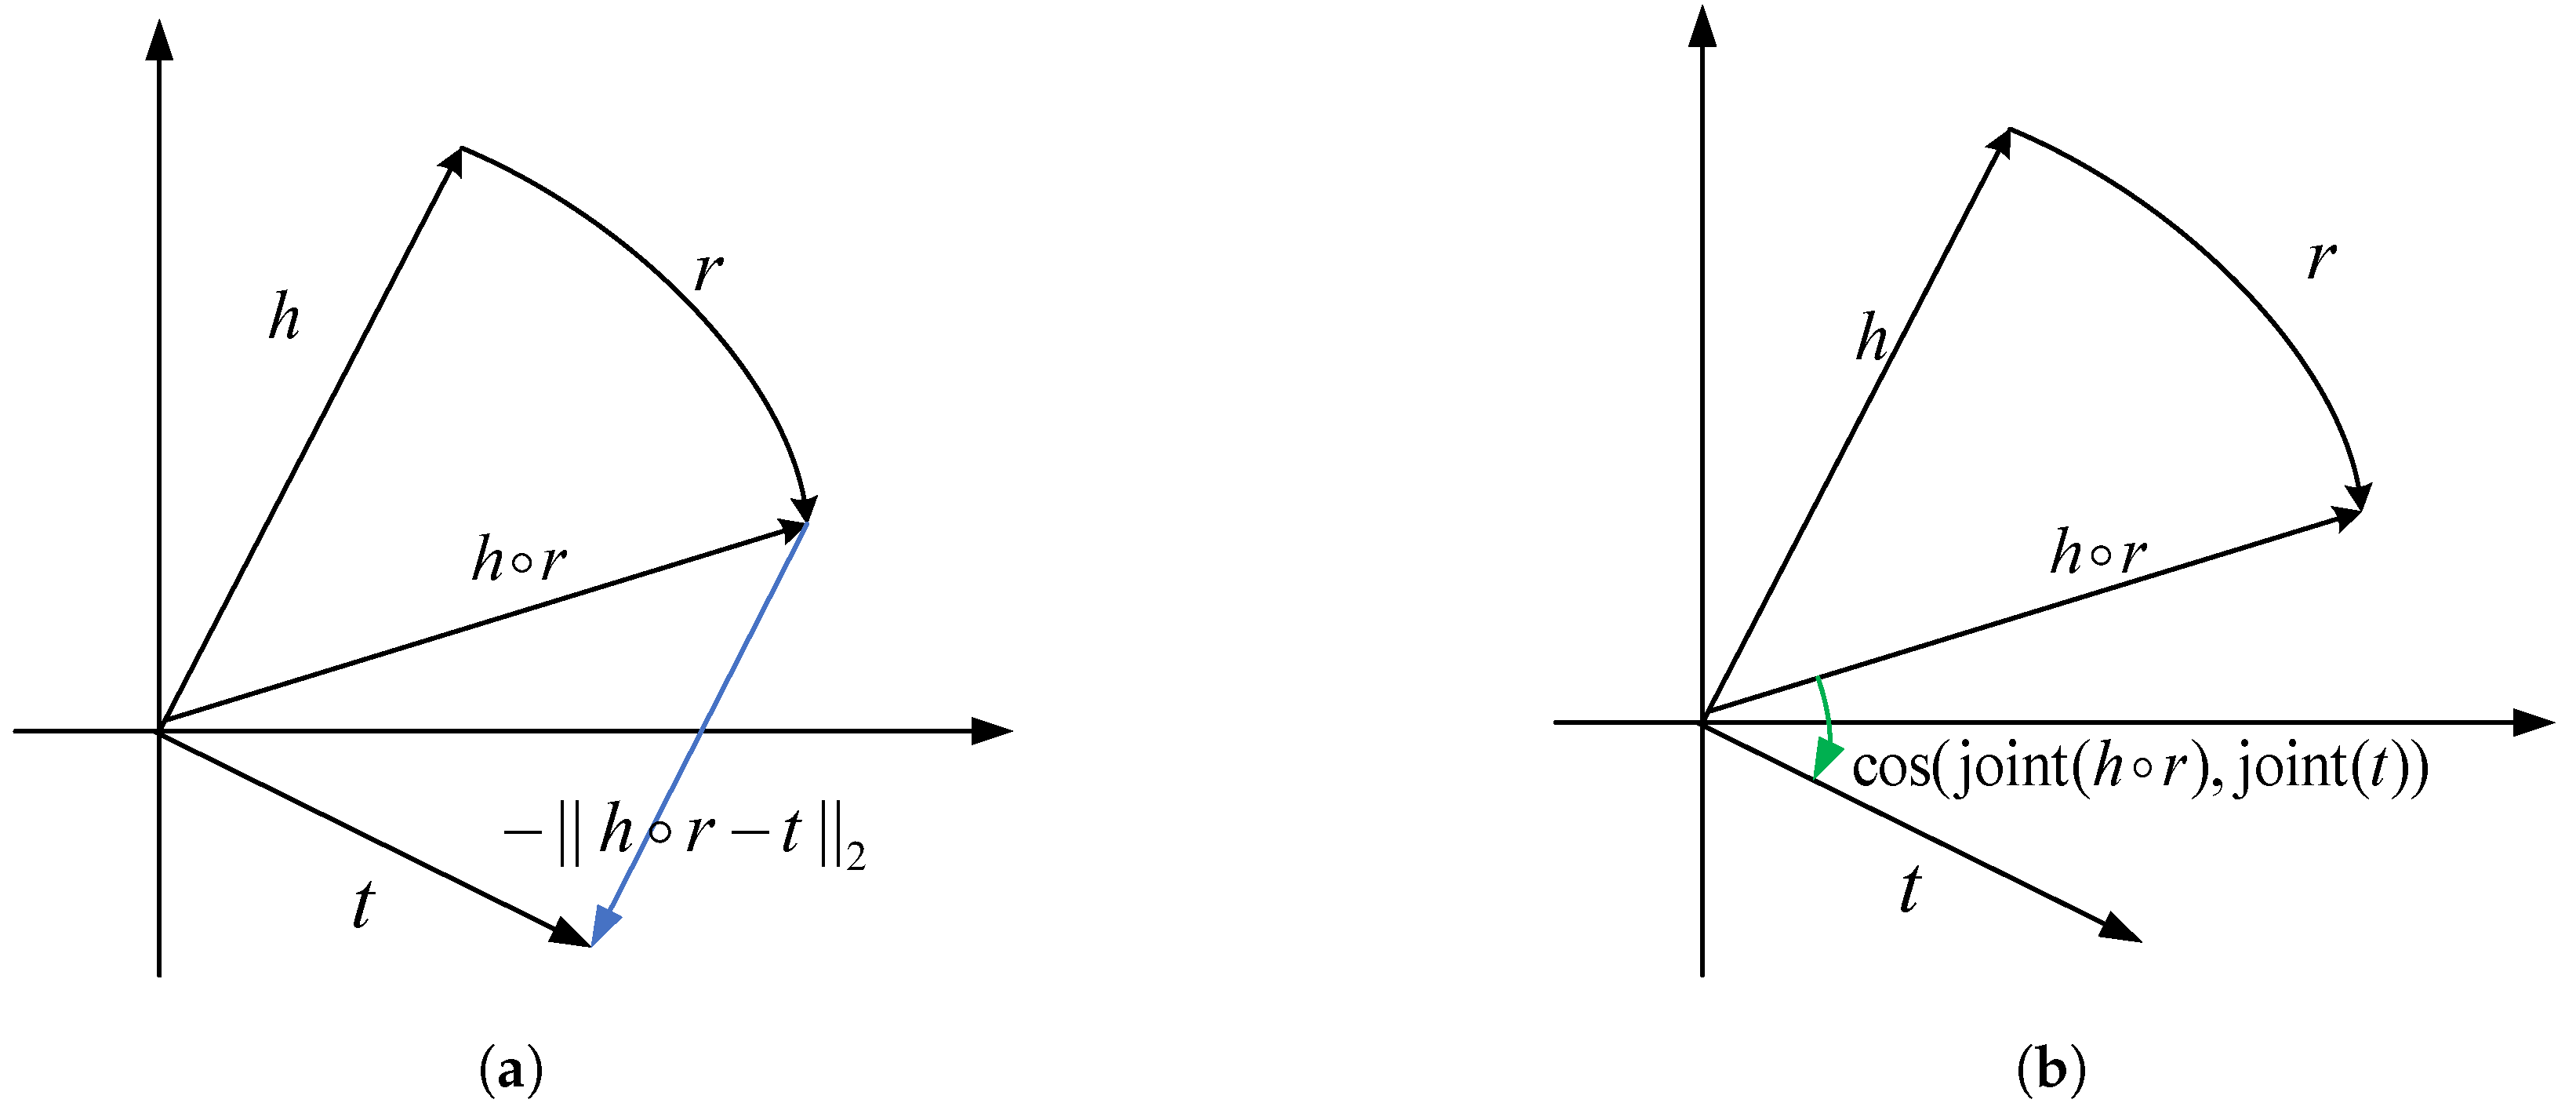
  • Our approach combines the rotational properties of the complex vector model RotatE to reason about a variety of important relational patterns.
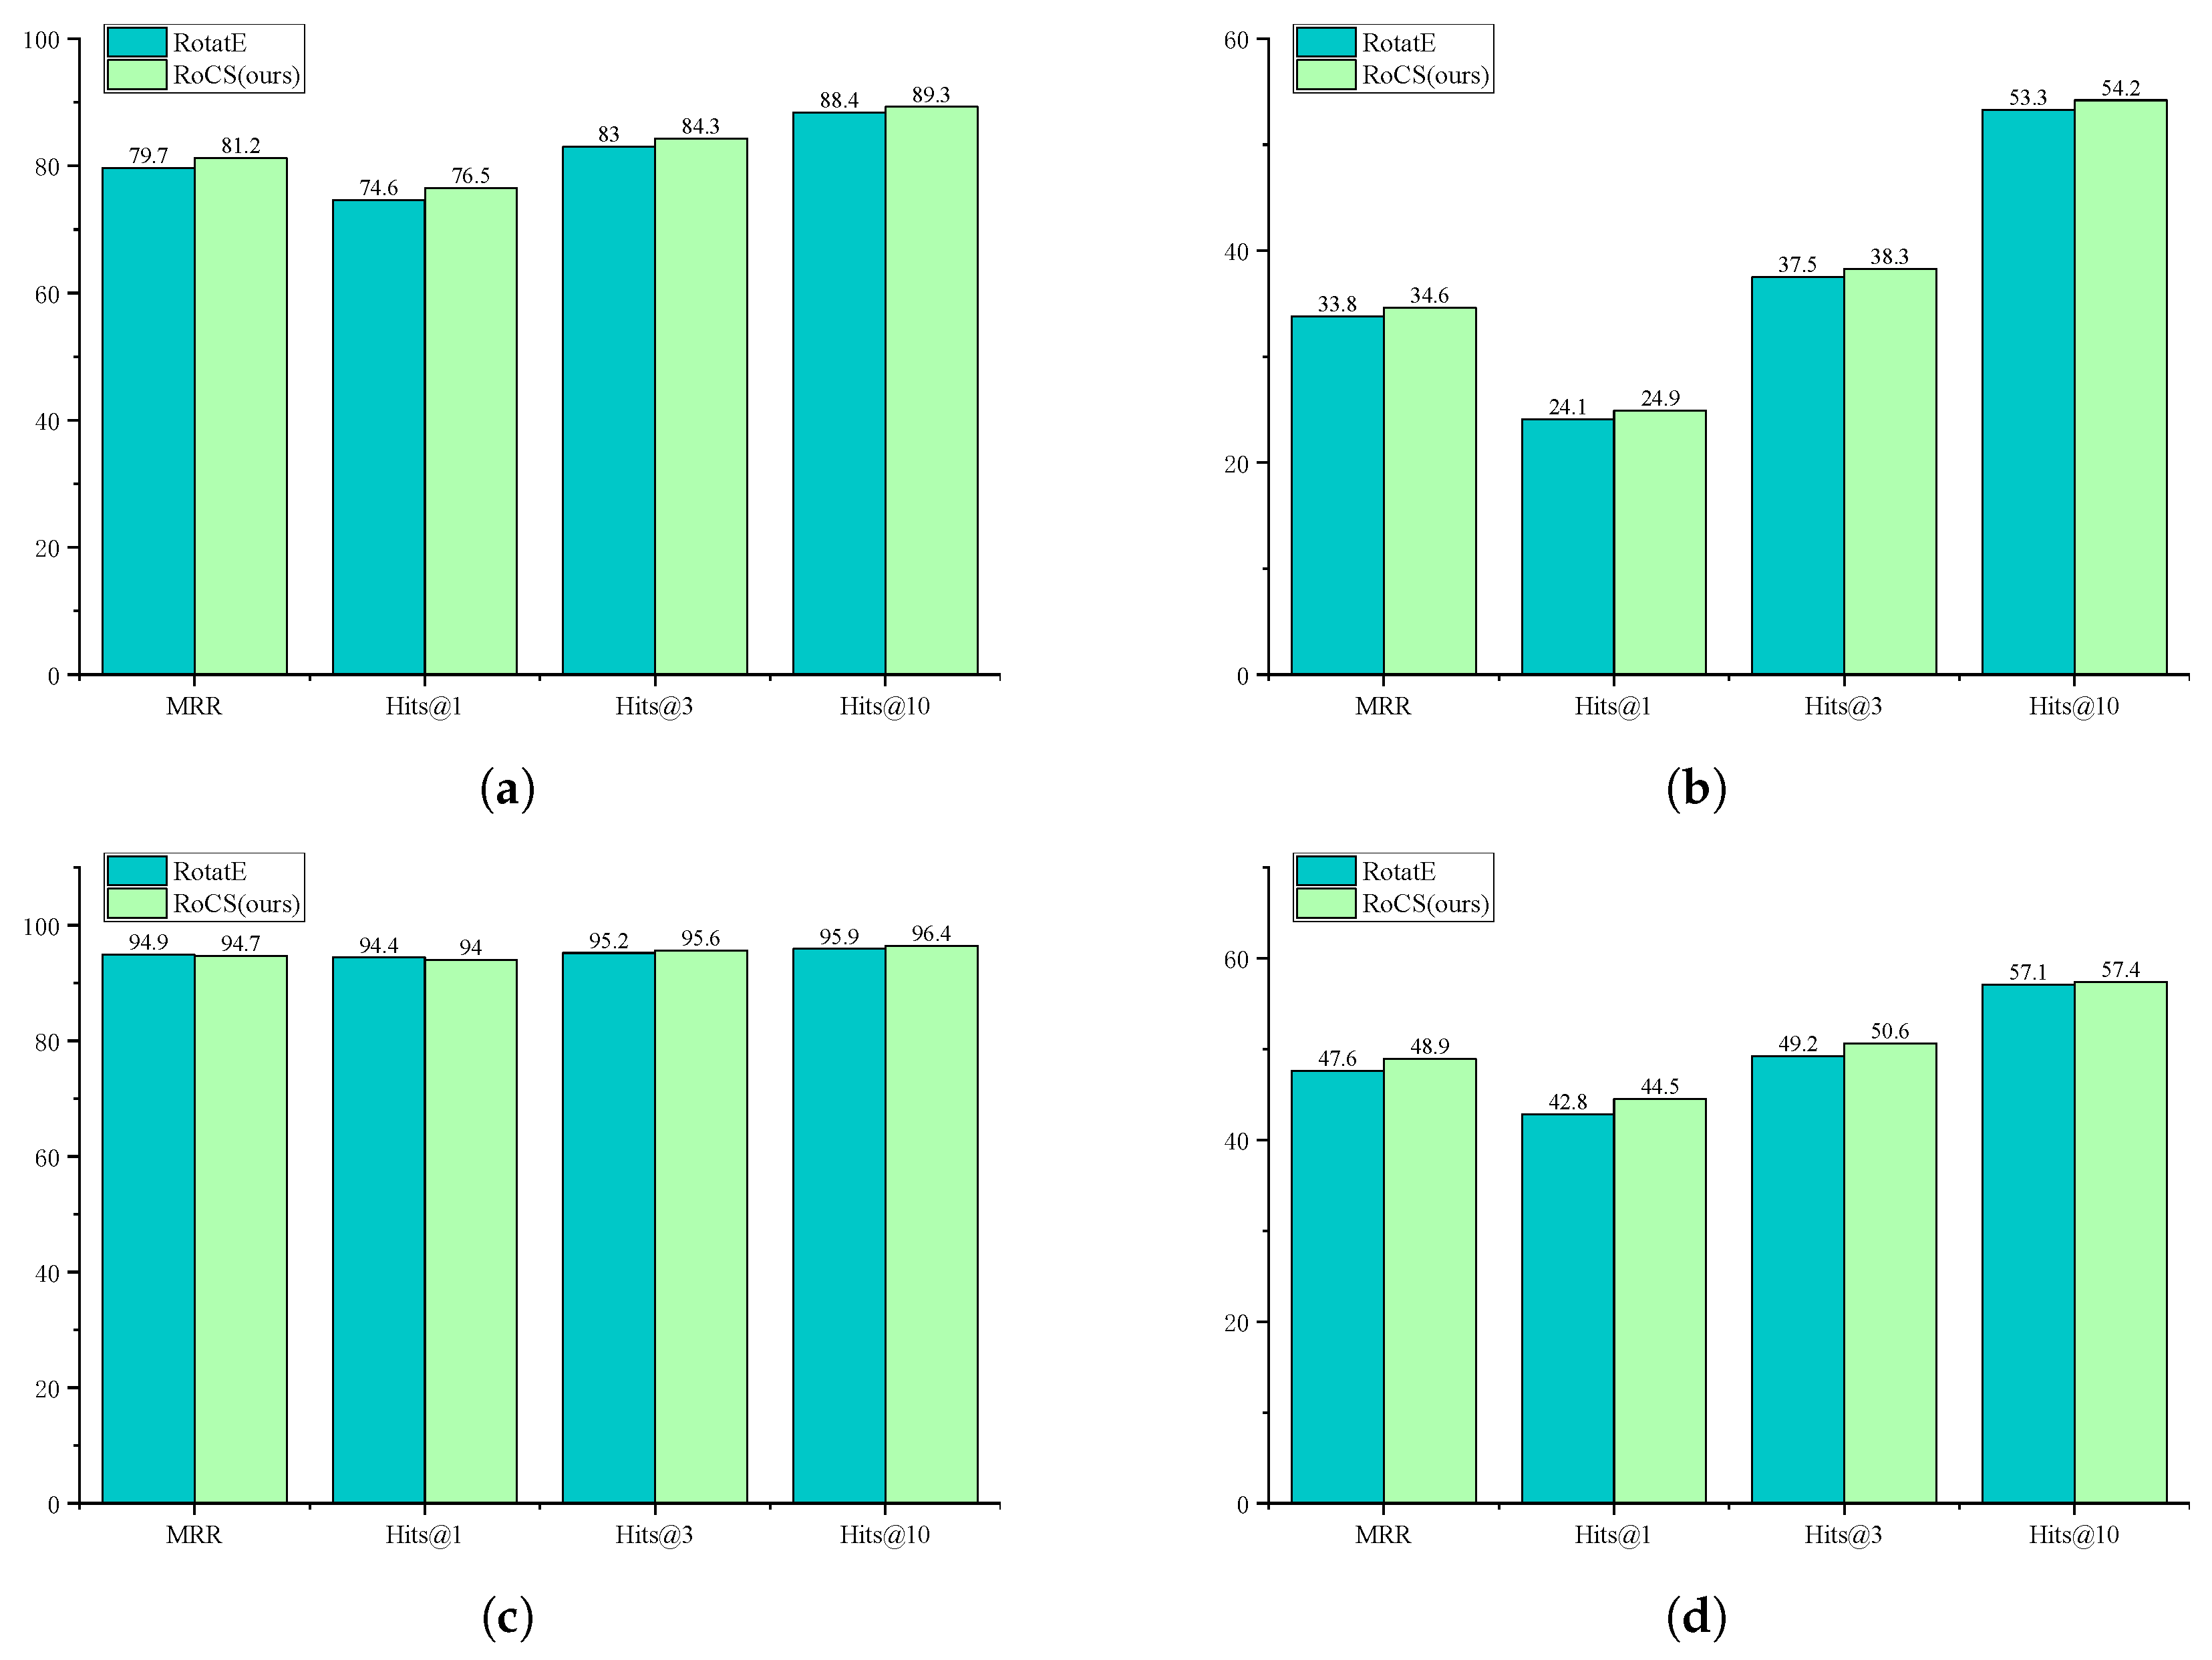
  • We have experimentally verified that the proposed RoCS provides a significant improvement over RotatE and achieves results close to or even higher than the current state-of-the-art.

2. Related Work

KGE predicts missing links by mapping symbolic representations of entities and relations into vector or matrix representations. Most KGE methods [30] are considered to utilize triples as learning resources, deriving the semantics of entities and relations from graph structures. Preserving original semantic relations through scoring function design has become a key research focus in recent years [1,2]. Based on the scoring function’s structure, the majority of the work can be categorized into dot product models and distance models.
The dot product model takes the form of dot product operations on the head entity, relation, and tail entity. Semantic information is captured through pairwise feature interactions between potential factors. The earliest work is the RESCAL [31], which uses a matrix to represent the relation r R d × d and a vector to represent the entities h , t R d . To reduce the relation embedding parameters, DistMult [12] constrains the relation matrix to be a diagonal matrix and uses a vector to represent the relation r R d . Since DistMult is overly simple and can only infer symmetric relations. HolE [13] utilizes the cyclic correlation dot product operation to infer anti-symmetric relations. ComplEx [14] applies a complex space to encode entities and relations, utilizing the complex conjugate property to model anti-symmetric relations. To further facilitate feature interaction, QuatE [15] suggests the use of quaternion spaces to represent entities and relations. In addition, there are neural network models including ConvE [27], InteractE [32], graph neural networks [33,34] and tensor decomposition models Tucker [28], LowFER [29] can also be regarded as dot product models.
Distance models utilize relations to translate or rotate the head entity and subsequently calculate the distance to the tail entity as the scoring function. In the case of TransE [16], the relationship is a translation originating from the head entity and extending to the tail entity. Guided by the principle of translation invariance, the sum of the head entity embedding and the relation embedding is expected to be close to the distance between the tail entity embeddings. Consequently, TransE uses the L 1 or L 2 distances as a scoring function. Since the TransE model cannot handle N-to-N relationships, TransH [18] presents a hyperplane representation that maps entities to relationship specifications. TransR [19] consider simplifying the space specified by the hyperplane for relationships. The complex embedding model RotatE [17] has been recently proposed, which uses a complex space to represent entities and relations. RotatE utilizes Euler’s formula to represent the relationship as a rotational operation between the head entity and the tail entity. By leveraging the rotation property, RotatE deduces various essential relation patterns [17].
Nevertheless, whether using the dot product model or distance model, the triple scores remain unbounded. Substantial score disparities between positive and negative samples amplify variance and diminish the model’s generalization capability. In contrast to prior approaches, we propose the method of computing the joint cosine similarity of complex vectors as a scoring function to constrain the bounded triple scoring range. Moreover, we propose a KGE method utilizing joint cosine similarity. Our work combines the RotaE rotation property of the complex vector embedding model to model a variety of different relational patterns. Table 1 summarizes our approach with other related work. The normalization effect of cosine similarity can reduce the variance and prevent gradient vanishing [35]. Moreover, cosine similarity finds extensive application in natural language processing for assessing the similarity of words, sentences, and document vectors [23,24,25]. The angle between similar vectors should be smaller, which can also help to distinguish different types of entities. In short, the main motivations behind these models include (1) using cosine similarity can make the triple scores bounded and reduce the variance, (2) distinguishing the embedding information of various entity types, and (3) reflecting the difference in direction between vectors.

3. RoCS

In this section, we introduce the RoCS method. Initially, we present the novel concept of joint cosine similarity for complex vectors, followed by the introduction of the scoring function derived from this joint cosine similarity. Subsequently, we outline the training methodology and conclude with a detailed discussion of the proposed approach.

3.1. Joint Cosine Similarity of Complex Vectors

Given two complex vectors x , y C d , the definition of cosine similarity is given by the dot product and the vector length. As per the cosine similarity definition, the formula for complex vector cosine similarity calculation is as follows:
cos ( x , y ) = x · y | x | | y | = i = 1 d x i y i i = 1 d x i x ¯ i i = 1 d y i y ¯ i ,
where x i , y i C denotes each elementary component of the complex vector x , y and x ¯ i denotes the conjugate complex number of x. Since each complex number includes both real and imaginary components, the dot product part of Equation (1) is calculated as follows,
x · y = i = 1 d Re x i Re y i Im x i Im y i + j ( Re x i Im y i + Im x i Re y i ) ,
where j 2 = 1 denotes the complex number sign.
The dot product between the complex vectors results in a complex number. Since the score of the triplet requires a real number to evaluate the training. Thus, if the above complex vector cosine similarity formula is used directly to calculate the triplet score will not work. To overcome this shortcoming, ComplEx [14] proposes calculating the complex dot product without considering the imaginary part of the score. Although considering only the real part of the score results can achieve positive performance. However, it is inaccurate to consider only the real part scores because having the same real part scores does not necessarily mean having the same imaginary part scores.
In contrast to previous work, we introduce a joint cosine similarity calculation method so that both the real part and the imaginary part scores results are considered. First, the complex vector’s real and imaginary components are treated as a combined pair of vectors. Then, the combined vector cosine similarity is calculated. Figure 1 illustrates the joint cosine similarity calculation process. The formula for calculating the joint cosine similarity of complex vectors is as follows,
cos joint ( x , y ) = cos ( joint ( x ) , joint ( y ) ) = Re ( x ) · Re ( y ) + Im ( x ) · Im ( y ) | x | · | y | = i = 1 d Re x i Re y i + i = 1 d Im x i Im y i i = 1 d x i x ¯ l i = 1 d y i y ¯ i ,
where joint ( x ) represents the joint of the real part vector of x with the imaginary part vector. Our method preserves the original real and imaginary components by converting a d-dimensional complex vector into a 2d-dimensional real vector before calculating the cosine similarity. Therefore, it can more accurately reflect the degree of similarity of complex vectors.

3.2. Scoring Function Based on Joint Cosine Similarity

In this part, we introduce the RoCS scoring function, which is founded on the concept of joint cosine similarity. We combine the rotational properties of the complex vector embedding model RotatE [17] to model a variety of important relational patterns. RotatE uses a complex vector to represent the head entity h, the relation r, and the tail entity t, i.e., h , r , t C d . RotatE shares similarities with TransE [16], the process involves rotating the head entity’s embedding through the relational embedding and subsequently computing the distance to the tail entity as a scoring function. For each element within the embedding vector, the rotation model expects t i = h i r i , where h i , r i , t i C , r i = 1 . With Euler’s formula, we can obtain e j θ t , i = e j θ h , i e j θ r , i , i.e., θ t , i = θ h , i + θ r , i , where j denotes the complex symbol and θ denotes the corresponding complex space phase. It can be found that the rotation model rotates the head entity by Euler angles.
Given that the distance model anticipates the head entity embedding to be in closer proximity to the tail entity following translation or rotation through the relational embedding. RotatE expects the distance between the two complex vectors to be minimized. We believe that there are several problems. First, the higher triple score and smaller distances conflict with each other, which makes the rotation mode have to solve the problem by multiplying the scores by a negative numbers transformation. Second, the range of the triple score is calculated using distance as the score function is unbounded. The significant contrast in scores between positive and negative samples amplifies variance and diminishes the model’s generalization capability. Third, the distance model is easily influenced by the embedded dimensionality. The enlargement of the embedding dimension leads to an expanded range in triple scores, which is detrimental to effective model training. For these reasons, We suggest employing joint cosine similarity as the scoring function, computed as follows,
S ( h , r , t ) = cos joint ( h r , t ) ,
where ∘ is the Hadamard (or element-wise) product and joint ( t ) denotes the joint vector for computing t, as shown in Figure 1.
The cosine similarity, as a normalization method, calculates the score range from −1 to 1. This ensures that the score of the triples is bounded and reduces the variance. Simultaneously, regardless of whether the embedding dimension increases or decreases, it does not impact the alteration of the score range, providing advantages for model training. Furthermore, the transformation of the distance model is addressed by utilizing cosine similarity as a scoring function, where a higher score signifies greater similarity. In addition, our proposed joint cosine similarity calculation method considers both real and imaginary components, and the scores are more accurate. While the rotation model RotatE reflects the same degree of the complex vectors by distance, our model RoCS reflects the similarity of the two complex vectors by the phase difference. Figure 2 shows the difference between our method RoCS and the rotation model RotatE.

3.3. Training

Knowledge graph embedding training steps mainly include generating negative samples and designing loss functions. There are uniform sampling, Bernoulli sampling, and self-adversarial negative sampling [17] for generating negative samples. For a fair comparison with the RotatE rotation model, we employ the self-adversarial negative sampling method to generate negative samples. Higher sampling weights are assigned to negative samples with elevated scores, ensuring that these generated negatives contribute more substantial training information. The sampling probability for negative samples in the self-adversarial negative sampling is defined as follows,
p h j , r , t j h i , r i , t i = exp α S h j , r , t j i exp α S h i , r , t i ,
where α is the sampling hyperparameter.
Loss function design is generally related to the scoring function. The logistic regression loss function [12,14] is typically chosen for the dot product model, and the rank loss [16,19] is typically chosen for the distance model selection [1]. Since the rotation model uses a self-adversarial negative sampling loss function [17], our method also uses the same loss function for a fair comparison. Therefore, the loss function of RoCS is calculated as follows,
L = log ( σ ( γ μ S ( h , r , t ) ) ) i = 1 n p h i , r , t i log σ μ S h i , r , t i γ ,
where γ is the fixed margin hyperparameter, μ is the score function scaling hyperparameter. To extend the scoring range of the triplet, We introduce a scaling hyperparameter μ to fine-tune the scoring function, and experimental results demonstrate this helps model training.

3.4. Discussion

In this section, we will first discuss the ability of our method to infer three important patterns of the relations. Then we will discuss the connection of our method with existing methods.

3.4.1. Infer Patterns of the Relations

Knowledge graphs have various relationship patterns, among which the three most common relationship patterns are symmetric/antisymmetric, inverse, and combinatorial. Hence, for precise prediction of missing links in the knowledge graph, the designed score function requires inferring the above three relationship patterns. RotatE [17] expects the tail entity to be equivalent to the head entity after relational rotation, i.e., t = h r . All the above relational patterns can be inferred using the rotation property. Specifically, if r is a symmetric relation then r r = 1 , and if r is an antisymmetric relation then r r 1 . If r 1 and r 2 are inverse relations, then it is sufficient to satisfy r 1 = r 2 1 . If r 1 is a combined relationship of r 2 , r 3 , then r 1 = r 2 r 3 . The rotation model uses distance as the score function, while our method uses cosine similarity. Since using cosine similarity does not change the rotation property, our method can also infer all the above relationship patterns.

3.4.2. Connection with Existing Methods

Our method can be naturally extended to all distance models. Since both translational and rotational models use relations to translate or rotate the head entity, expecting the rotated head entity to be equivalent to the tail entity, i.e., expecting t = h + r or t = h r . Therefore, it is straightforward to use joint cosine similarity instead of distance as the scoring function. After normalizing the entity embedding and relational embedding vectors, the rotation model RotatE [17] is approximately equivalent [36] to our method as follows,
h n o r r n o r t n o r 2 2 1 cos joint h n o r r n o r , t n o r ,
where h n o r , r n o r , t n o r C d , x n o r denotes the normalization of the vector x normalization result, i.e., x n o r = x x 2 . It is noticed that our method RoCS is approximately equivalent to the normalized RotatE model score function after normalization. When using the real number space to represent entities and relations, the joint cosine similarity is calculated in an exactly equivalent way to the cosine similarity [36]. Therefore, the following equivalence exists between RoCS and the scoring function of the translational model TransE [16] when only the real part is considered,
h n o r + r n o r t n o r 2 = 2 1 cos h n o r + r n o r , t n o r ,
where h n o r , r n o r , t n o r R d . In summary, RoCS can be naturally extended to the distance model. We evaluates the similarity based on direction, while the distance model evaluates vector similarity based on distance, as shown in Figure 2.

4. Experiment

In this section, we outline our experimental setup and report the corresponding results. We begin by detailing the experimental configuration. Next, we evaluate the efficacy of our approach compared to the baseline rotation model. Subsequently, we present the results of our method in comparison to state-of-the-art approaches. Finally, we analyze the performance of our model utilizing both the dot product and distance models in the complex space. Additionally, we conduct ablation studies by comparing different methods of computing complex vector cosine similarity.

4.1. Experimental Setup

4.1.1. Datasets

We selected four standard datasets for the link prediction task including FB15k [16], FB15k-237 [26], WN18 [16], and WN18RR [27] to evaluate our proposed method. FB15K is a subset of the real-world knowledge graph Freebase [10], containing 14,951 entities and 1345 relations. FB15k-237 is a subset of FB15K after removing the inverse relations, containing 14,541 entities with 237 relations. WN18 is a subset of WN18 [9], a knowledge graph constructed by vocabulary, containing 40,943 entities and 18 relations. WN18RR is a subset of WN18, with inverse relations removed, containing 40,943 entities and 11 relations. Among them, FB15k-237 and WN18RR primarily exhibit symmetric/anti-symmetric and combinatorial relationship patterns. The principal relationship patterns in FB15K and WN18 involve symmetry/anti-symmetry and inverse patterns. The statistical information of these knowledge graphs is summarized in Table 2.

4.1.2. Evaluation Criterion

We use the score function designed by Equation (4) to score the test triple ( h , r , t ) with all candidate triples, and calculate the test triple ranking based on the scoring results. All candidate triples are generated by substituting either the head entity or the tail entity of the test triple, i.e., h , r , t or h , r , t . We follow filters setting [16] that all candidate triples are excluded from appearing in the training set, validation set, and test set. Similar to the previous work [28,29], we choose MRR, Hits@k ( k { 1 , 3 , 10 } ) as the ranking evaluation metric. MRR represents the average inverse ranking of the test triples, while Hits@k indicates the proportion of test triples within the top k rankings.

4.1.3. Baselines

We select some representative baselines from the dot product model and the distance model respectively for comparison. For the dot product model we report DistMult [12], ComplEx [14], ConvE [27], SimplE [37], QuatE [15], TuckER [28] and LowFER [29]. For the distance model we report TransE [16], TorusE [20] and RotatE [17]. Among them, QuatE, TuckER, and LowFER are reported as the latest SOTA models.

4.1.4. Experimental Details

We implement our proposed model based on the Pytorch [38] deep learning framework and train it on an NVIDIA Tesla P100 GPU. We use Adam [39] as the trainer and Equation (6) defines the loss function. We use grid search to determine the hyperparameters, selecting the optimal ones based on evaluating MRR metrics on the validation set. The hyperparameter search range is as follows: fixed margin γ { 1 , 3 , 6 , 10 , 12 , 15 , 20 , 30 } , and scaling hyperparameter μ { 1 , 5 , 10 , 15 , 20 , 25 , 30 , 50 } . In addition, the embedding dimension we set the following d { 100 , 200 , 500 , 1000 } , and learning rate l r { 0.001 , 0.0001 , 0.00003 , 0.00001 } . The initial parameter settings follow the rotation model settings [17].

4.2. Compare RotatE

We first evaluated the performance of our RoCS method alongside the original rotation model RotatE [17]. Figure 3 illustrates the performance of our method RoCS with RotatE on the FB15K, FB15K-237, WN18, and WN18RR datasets. Figure 3a shows that our method improves 1.9% in MRR, 2.5% in Hits@1, 2.6% in Hits@3, and 1.0% in Hits@10 compared to RotatE on the FB15K dataset. Figure 3b shows that our method improves 2.4% in MRR, 3.3% in Hits@1, 2.1% in Hits@3, and 1.7% in Hits@10 compared to RotatE on the FB15K-237 dataset. Figure 3c shows that our method improves −0.2% in MRR, −0.1% in Hits@1, 0.4% in Hits@3, and 0.5% in Hits@10 compared to RotatE on the WN18 dataset. Figure 3d shows that our method improves 2.7% in MRR, 4.0% in Hits@1, 2.8% in Hits@3, and 0.5% in Hits@10 compared to RotatE on the WN18RR dataset. Overall, our method RoCS shows a significant improvement compared to RotatE. It shows that using joint cosine similarity as a scoring function to constrain the bounded triple scores can reduce the variance and improve the model generalization.

4.3. Comparison with Current SOTA Models

The main results of the link predictions are shown in Table 3 and Table 4. Table 3 indicates that our RoCS method achieves new benchmarks, achieving a SOTA performance, including Hits@3 of 95.6%, Hits@10 of 96.4% on WN18, and MRR of 48.9%, Hits@1 of 44.5% on WN18RR. Table 4 illustrates that our method RoCS is highly competitive in the FB15K dataset, with MRR, Hits@1, and Hits@3 only below the SOTA model LowFER [29]. And, our method also achieved a top 3 ranking on WN18RR. In short, neither SOTA models TuckER [28], LowFER nor QuatE [15] models can achieve excellent performance in all datasets. TuckER and LowFER perform poorly in the WN18RR dataset, and QuatE models achieve lower performance in FB15K MRR, Hits@1, and Hits@3, while our method RoCS achieves competitive results in all datasets. This indicates that our approach is highly competitive with the current leading knowledge graph embedding models.

4.4. Comparing Complex Vector Embeddings

To further investigate the effectiveness of cosine similarity as a score function, we investigated using the same representation space to compare our method with the dot product model ComplEx [14], and the distance model RotatE [17]. For a fair comparison, we additionally train the ComplEx model utilizing a self-adversarial negative sampling loss function [17]. As shown in Table 5, RoCS is significantly outperformed by ComplEx and RotatE. This indicates that using the joint cosine similarity as a scoring function for the complex vector embedding model is better than the dot product model and the distance model.

4.5. Ablation Study

In Section 3.2, we propose to use the joint cosine similarity as a scoring function to improve the model’s performance. To verify the validity of the joint cosine similarity, we compare it with other methods for calculating the cosine similarity of complex vectors. The first method is similar to ComplEx [14], which considers only the real part of the scoring function and is formulated as follows,
S 1 ( h , r , t ) = Re ( cos ( h r , t ) ) ,
where h , r , t C d , Re denotes the real part. The second approach combines the cosine similarity of real vectors and the cosine similarity of imaginary vectors separately. The calculation is as follows,
S 2 ( h , r , t ) = cos ( Re ( h r ) , Re ( t ) ) + cos ( Im ( h r ) , Im ( t ) ) ,
where Im denotes the imaginary part.
We compare the way of calculating complex vector cosine similarity in Equation (9) and Equation (10) to prove that our proposed joint cosine similarity is effective. As shown in Table 6, our proposed method for calculating the joint cosine similarity of complex vectors achieves the best results. The first method is not accurate enough for triplet scoring because the imaginary part of the triplet score is discarded. The second method ignores the connection between the real and imaginary parts, and thus also obtains poorer results. In contrast, our method achieves excellent performance in both cases. Therefore, this proves that our calculation method can give a more accurate scoring result by considering both the real part and the imaginary part.

5. Conclusions and Future Work

In this paper, we first propose a method to compute the joint cosine similarity of complex vectors. Then, a knowledge graph embedding model based on joint cosine similarity is proposed, named RoCS. Specifically, the proposed RoCS uses joint cosine similarity as a scoring function to constrain the triple score range to be bounded, thus reducing the variance of the model and improving model performance. Meanwhile, our method combines the rotational properties of the RotatE can reason about a variety of important relational patterns. Our experimental results indicate a significant improvement over the original RotatE model, achieving performance levels that closely rival or even surpass the latest advancements in the field. In the future, we plan to further consider extending the joint cosine similarity to other representation learning problems.

Author Contributions

Conceptualization, L.W., S.D. and X.G.; Methodology, L.W., J.L. and S.D.; Writing—original draft, L.W.; Supervision, J.L. and X.G. All authors have read and agreed to the published version of the manuscript.

Funding

This work was supported in part by the National Natural Science Foundation of China under Grant 62372163, Natural Science Foundation of Chongqin under Grant ZE20210011, Key scientific and technological research and development plan of Hunan Province under Grant 2022NK2046.

Data Availability Statement

The data presented in this study are available in the article.

Acknowledgments

We thank the authors of RotatE for the Knowledge Graph embedding open-source code. Our code is based on their open-source code for improvement.

Conflicts of Interest

The authors declare no conflicts of interest.

References

  1. Wang, Q.; Mao, Z.; Wang, B.; Guo, L. Knowledge graph embedding: A survey of approaches and applications. IEEE Trans. Knowl. Data Eng. 2017, 29, 2724–2743. [Google Scholar] [CrossRef]
  2. Ji, S.; Pan, S.; Cambria, E.; Marttinen, P.; Philip, S.Y. A survey on knowledge graphs: Representation, acquisition, and applications. IEEE Trans. Neural Netw. Learn. Syst. 2021, 33, 494–514. [Google Scholar] [CrossRef] [PubMed]
  3. Huang, X.; Zhang, J.; Li, D.; Li, P. Knowledge graph embedding based question answering. In Proceedings of the Twelfth ACM International Conference on Web Search and Data Mining, Melbourne, Australia, 11–15 February 2019; pp. 105–113. [Google Scholar] [CrossRef]
  4. Zhang, F.; Yuan, N.J.; Lian, D.; Xie, X.; Ma, W.Y. Collaborative knowledge base embedding for recommender systems. In Proceedings of the 22nd ACM SIGKDD International Conference on Knowledge Discovery and Data Mining, New York, NY, USA, 13–17 August 2016; pp. 353–362. [Google Scholar] [CrossRef]
  5. Wang, H.; Zhang, F.; Xie, X.; Guo, M. DKN: Deep knowledge-aware network for news recommendation. In Proceedings of the 2018 World Wide Web Conference, Lyon, France, 23–27 April 2018; pp. 1835–1844. [Google Scholar] [CrossRef]
  6. Yang, B.; Mitchell, T. Leveraging Knowledge Bases in LSTMs for Improving Machine Reading. In Proceedings of the 55th Annual Meeting of the Association for Computational Linguistics (Volume 1: Long Papers), Vancouver, BC, Canada, 30 July–4 August 2017. [Google Scholar] [CrossRef]
  7. Qin, Z.; Cen, C.; Jie, W.; Gee, T.S.; Chandrasekhar, V.R.; Peng, Z.; Zeng, Z. Knowledge-graph based multi-target deep-learning models for train anomaly detection. In Proceedings of the 2018 International Conference on Intelligent Rail Transportation (ICIRT), Singapore, 12–14 December 2018; pp. 1–5. [Google Scholar] [CrossRef]
  8. Chen, C.; Li, K.; Zou, X.; Cheng, Z.; Wei, W.; Tian, Q.; Zeng, Z. Hierarchical Semantic Graph Reasoning for Train Component Detection. IEEE Trans. Neural Netw. Learn. Syst. 2021, 33, 4502–4514. [Google Scholar] [CrossRef] [PubMed]
  9. Miller, G.A. WordNet: A lexical database for English. Commun. ACM 1995, 38, 39–41. [Google Scholar] [CrossRef]
  10. Bollacker, K.; Evans, C.; Paritosh, P.; Sturge, T.; Taylor, J. Freebase: A collaboratively created graph database for structuring human knowledge. In Proceedings of the 2008 ACM SIGMOD International Conference on Management of Data, Vancouver, BC, Canada, 9–12 June 2008; pp. 1247–1250. [Google Scholar] [CrossRef]
  11. Suchanek, F.M.; Kasneci, G.; Weikum, G. Yago: A core of semantic knowledge. In Proceedings of the 16th International Conference on World Wide Web, Banff, AB, Canada, 8–12 May 2007; pp. 697–706. [Google Scholar] [CrossRef]
  12. Yang, B.; tau Yih, W.; He, X.; Gao, J.; Deng, L. Embedding Entities and Relations for Learning and Inference in Knowledge Bases. In Proceedings of the 3rd International Conference on Learning Representations, ICLR 2015, San Diego, CA, USA, 7–9 May 2015. Conference Track Proceedings. [Google Scholar]
  13. Nickel, M.; Rosasco, L.; Poggio, T. Holographic embeddings of knowledge graphs. In Proceedings of the AAAI Conference on Artificial Intelligence, Phoenix, AZ, USA, 12–17 February 2016; Volume 30. Available online: https://dl.acm.org/doi/10.5555/3016100.3016172 (accessed on 18 December 2023).
  14. Trouillon, T.; Welbl, J.; Riedel, S.; Gaussier, É.; Bouchard, G. Complex embeddings for simple link prediction. In Proceedings of the International Conference on Machine Learning (ICML), New York, NY, USA, 19–24 June 2016; Available online: https://dl.acm.org/doi/10.5555/3045390.3045609 (accessed on 18 December 2023).
  15. Zhang, S.; Tay, Y.; Yao, L.; Liu, Q. Quaternion knowledge graph embeddings. In Proceedings of the Advances in Neural Information Processing Systems 32: Annual Conference on Neural Information Processing Systems 2019, NeurIPS 2019, Vancouver, BC, Canada, 8–14 December 2019; pp. 2735–2745. [Google Scholar] [CrossRef]
  16. Bordes, A.; Usunier, N.; Garcia-Duran, A.; Weston, J.; Yakhnenko, O. Translating embeddings for modeling multi-relational data. Adv. Neural Inf. Process. Syst. 2013, 26, 2787–2795. Available online: https://dl.acm.org/doi/10.5555/2999792.2999923 (accessed on 18 December 2023).
  17. Sun, Z.; Deng, Z.H.; Nie, J.Y.; Tang, J. RotatE: Knowledge Graph Embedding by Relational Rotation in Complex Space. In Proceedings of the International Conference on Learning Representations, New Orleans, LA, USA, 6–9 May 2019. [Google Scholar]
  18. Wang, Z.; Zhang, J.; Feng, J.; Chen, Z. Knowledge graph embedding by translating on hyperplanes. In Proceedings of the AAAI Conference on Artificial Intelligence, Quebec City, QC, Canada, 27–31 July 2014; Volume 28. Available online: https://dl.acm.org/doi/10.5555/2893873.2894046 (accessed on 18 December 2023).
  19. Lin, Y.; Liu, Z.; Sun, M.; Liu, Y.; Zhu, X. Learning entity and relation embeddings for knowledge graph completion. In Proceedings of the AAAI Conference on Artificial Intelligence, Austin, TX, USA, 25–30 January 2015; Volume 29. [Google Scholar]
  20. Ebisu, T.; Ichise, R. Toruse: Knowledge graph embedding on a lie group. In Proceedings of the AAAI Conference on Artificial Intelligence, New Orleans, LA, USA, 2–7 February 2018; Volume 32. [Google Scholar]
  21. Cao, Z.; Xu, Q.; Yang, Z.; Cao, X.; Huang, Q. Geometry interaction knowledge graph embeddings. In Proceedings of the AAAI Conference on Artificial Intelligence, Vancouver, BC, Canada, 20–27 February 2022; Volume 36, pp. 5521–5529. [Google Scholar]
  22. Ioffe, S.; Szegedy, C. Batch normalization: Accelerating deep network training by reducing internal covariate shift. In Proceedings of the International Conference on Machine Learning, PMLR, Lille, France, 6–11 July 2015; pp. 448–456. Available online: https://dl.acm.org/doi/10.5555/3045118.3045167 (accessed on 18 December 2023).
  23. Singhal, A. Modern information retrieval: A brief overview. IEEE Data Eng. Bull. 2001, 24, 35–43. [Google Scholar]
  24. Dai, A.M.; Olah, C.; Le, Q.V. Document Embedding with Paragraph Vectors. arXiv 2015, arXiv:1507.07998. [Google Scholar]
  25. Thongtan, T.; Phienthrakul, T. Sentiment classification using document embeddings trained with cosine similarity. In Proceedings of the 57th Annual Meeting of the Association for Computational Linguistics: Student Research Workshop, Florence, Italy, 28 July–2 August 2019; pp. 407–414. [Google Scholar] [CrossRef]
  26. Toutanova, K.; Chen, D. Observed versus latent features for knowledge base and text inference. In Proceedings of the 3rd Workshop on Continuous Vector Space Models and their Compositionality, Beijing, China, 26–31 July 2015; pp. 57–66. [Google Scholar] [CrossRef]
  27. Dettmers, T.; Minervini, P.; Stenetorp, P.; Riedel, S. Convolutional 2d knowledge graph embeddings. In Proceedings of the AAAI Conference on Artificial Intelligence, New Orleans, LA, USA, 2–7 February 2018; Volume 32. [Google Scholar]
  28. Balažević, I.; Allen, C.; Hospedales, T.M. Tucker: Tensor factorization for knowledge graph completion. In Proceedings of the 2019 Conference on Empirical Methods in Natural Language Processing and the 9th International Joint Conference on Natural Language Processing (EMNLP-IJCNLP), Hong Kong, China, 3–7 November 2019. [Google Scholar] [CrossRef]
  29. Amin, S.; Varanasi, S.; Dunfield, K.A.; Neumann, G. LowFER: Low-rank Bilinear Pooling for Link Prediction. In Proceedings of the International Conference on Machine Learning, PMLR, Virtual, 13–18 July 2020; pp. 257–268. [Google Scholar]
  30. Jin, L.; Yao, Z.; Chen, M.; Chen, H.; Zhang, W. A Comprehensive Study on Knowledge Graph Embedding over Relational Patterns Based on Rule Learning. In Proceedings of the International Semantic Web Conference, Athens, Greece, 6–10 November 2023; Springer: Cham, Switzerlnd, 2023; pp. 290–308. [Google Scholar]
  31. Nickel, M.; Tresp, V.; Kriegel, H.P. A three-way model for collective learning on multi-relational data. In Proceedings of the 28th International Conference on Machine Learning, Bellevue, WA, USA, 28 June–2 July 2011; Volume 11, pp. 809–816. Available online: https://dl.acm.org/doi/10.5555/3104482.3104584 (accessed on 18 December 2023).
  32. Vashishth, S.; Sanyal, S.; Nitin, V.; Agrawal, N.; Talukdar, P. Interacte: Improving convolution-based knowledge graph embeddings by increasing feature interactions. In Proceedings of the AAAI Conference on Artificial Intelligence, New York, NY, USA, 7–12 February 2020; Volume 34, pp. 3009–3016. [Google Scholar]
  33. Chen, C.; Li, K.; Wei, W.; Zhou, J.T.; Zeng, Z. Hierarchical graph neural networks for few-shot learning. IEEE Trans. Circuits Syst. Video Technol. 2021, 32, 240–252. [Google Scholar] [CrossRef]
  34. Schlichtkrull, M.; Kipf, T.N.; Bloem, P.; Van Den Berg, R.; Titov, I.; Welling, M. Modeling relational data with graph convolutional networks. In Proceedings of the European Semantic Web Conference, Heraklion, Crete, Greece, 3–7 June 2018; Springer: Cham, Switzerland, 2018; pp. 593–607. [Google Scholar] [CrossRef]
  35. Luo, C.; Zhan, J.; Xue, X.; Wang, L.; Ren, R.; Yang, Q. Cosine normalization: Using cosine similarity instead of dot product in neural networks. In Proceedings of the International Conference on Artificial Neural Networks, Rhodes, Greece, 4–7 October 2018; Springer: Cham, Switzerland, 2018; pp. 382–391. [Google Scholar] [CrossRef]
  36. Kryszkiewicz, M. The cosine similarity in terms of the euclidean distance. In Encyclopedia of Business Analytics and Optimization; IGI Global: Hershey, PA, USA, 2014; pp. 2498–2508. [Google Scholar] [CrossRef]
  37. Kazemi, S.M.; Poole, D. Simple embedding for link prediction in knowledge graphs. In Proceedings of the Advances in Neural Information Processing Systems 31: Annual Conference on Neural Information Processing Systems 2018, NeurIPS 2018, Montreal, QC, Canada, 3–8 December 2018; pp. 4284–4295. [Google Scholar]
  38. Paszke, A.; Gross, S.; Massa, F.; Lerer, A.; Bradbury, J.; Chanan, G.; Killeen, T.; Lin, Z.; Gimelshein, N.; Antiga, L.; et al. Pytorch: An imperative style, high-performance deep learning library. In Proceedings of the Advances in Neural Information Processing Systems 32: Annual Conference on Neural Information Processing Systems 2019, NeurIPS 2019, Vancouver, BC, Canada, 8–14 December 2019. [Google Scholar]
  39. Kingma, D.; Ba, J. Adam: A Method for Stochastic Optimization. In Proceedings of the 3rd International Conference on Learning Representations, ICLR 2015, San Diego, CA, USA, 7–9 May 2015. [Google Scholar]
Figure 1. A demonstration of the process of calculating the joint cosine similarity of the complex vectors.
Electronics 13 00147 g001
Figure 2. The rotation model calculates the distance between vectors as the score function (left ((a) RotatE)), while our approach RoCS uses joint cosine similarity as the score function (right ((b) RoCS)).
Electronics 13 00147 g002
Figure 3. Comparison of the link prediction results of our method RoCS with the original rotation model RotatE [17] on FB15K, FB15K-237, WN18 and WN18RR. (a) FB15K; (b) FB15K-237; (c) WN18; (d) WN18RR.
Electronics 13 00147 g003
Table 1. Comparison of our approach with several representative knowledge graph embedding models in the representation space, score range.
ModelsScoring FunctionRepresentation SpaceScore Range
TransE [16] h + r t 1 / 2 h , r , t R d Unbounded
DistMult [12] h , r , t h , r , t R d Unbounded
ComplEx [14] Re ( h , r , t ¯ ) h , r , t C d Unbounded
ConvE [27] f ( vec ( f ( [ h ; r ] ω ) ) W ) t h , r , t R d Unbounded
RotatE [17] h r t h , r , t C d Unbounded
QuatE [15] h r · t h , r , t H d Unbounded
LowFER [29] S k diag U T h V T r T t h , r , t R n × d Unbounded
RoCS (ours) cos joint ( h r , t ) h , r , t C d Bounded
Table 2. Statistics of datasets.
Dataset#Entity#Relation#Train#Valid#Test
FB15K14,9511345483,14250,00059,071
FB15K-23714,541237272,11517,53520,466
WN1840,94318141,44250005000
WN18RR40,9431186,83530343134
Table 3. Link predictions in WN18 and WN18RR results.State-of-the-art (SOTA) results are shown in bold, and top 3 ranking results are underlined. QuatE [15] reports QuatE 3 results, and LowFER [29] reports LowFER-k* results.
ModelsWN18WN8RR
MRR Hits@1 Hits@3 Hits@10 MRR Hits@1 Hits@3 Hits@10
TransE [16]49.511.388.894.322.6--50.1
DistMult [12]79.7--94.643.039.044.049.0
ComplEx [14]94.393.594.695.646.039.043.048.0
ConvE [27]94.293.994.494.7----
SimplE [37]94.794.395.095.4----
TorusE [20]94.193.694.594.744.041.046.051.0
RotatE [17]94.994.495.295.947.642.849.257.1
QuatE [15]95.094.595.495.948.843.850.858.2
TuckER [28]95.394.995.595.847.044.348.252.6
LowFER [29]95.094.695.295.846.543.447.952.6
RoCS (ours)94.794.095.696.448.944.550.657.4
Table 4. Link predictions are shown in FB15K and FB15K-237 results.
ModelsFB15KFB15K-237
MRR Hits@1 Hits@3 Hits@10 MRR Hits@1 Hits@3 Hits@10
TransE [16]46.329.757.874.929.4--46.5
DistMult [12]65.454.673.372.824.115.526.341.9
ComplEx [14]69.259.975.984.032.523.725.650.1
ConvE [27]74.567.080.187.3----
SimplE [37]72.766.077.383.8----
TorusE [20]73.367.477.183.224.715.827.542.8
RotatE [17]79.774.683.088.433.824.137.553.3
QuatE [15]78.271.183.590.034.824.838.255.0
TuckER [28]79.574.183.389.235.826.639.354.4
LowFER [29]82.478.285.289.735.926.639.654.4
RoCS (ours)81.276.584.389.334.624.938.354.2
Table 5. A comparison of the complex vector embedding models ComplEx, RotatE and RoCS (ours), where ComplEx also uses a self-adversarial negative sampling loss function for fair comparison.
ModelsWN18WN8RRFB15KFB15K-237
MRR Hits@10 MRR Hits@10 MRR Hits@10 MRR Hits@10
ComplEx a d v 89.295.447.055.778.089.032.150.9
RotatE94.995.947.657.179.788.433.853.3
RoCS(ours)94.796.448.957.481.289.334.654.2
Table 6. The results of using Equation (9) (RoReCS), Equation (10) (RoAddCS) as score functions on WN18, WN18RR, FB15K, FB15K-237.
ModelsWN18WN8RRFB15KFB15K-237
MRR Hits@10 MRR Hits@10 MRR Hits@10 MRR Hits@10
RoReCS63.790.736.744.549.165.923.133.4
RoAddCS92.195.246.052.168.579.028.044.9
RoCS94.796.448.957.481.289.334.654.2
Disclaimer/Publisher’s Note: The statements, opinions and data contained in all publications are solely those of the individual author(s) and contributor(s) and not of MDPI and/or the editor(s). MDPI and/or the editor(s) disclaim responsibility for any injury to people or property resulting from any ideas, methods, instructions or products referred to in the content.

