Article

Instance Segmentation of Irregular Deformable Objects for Power Operation Monitoring Based on Multi-Instance Relation Weighting Module

1
School of Electrical Engineering and Automation, Xiamen University of Technology, Xiamen 361024, China
2
Xiamen Key Laboratory of Frontier Electric Power Equipment and Intelligent Control, Xiamen 361024, China
*
Author to whom correspondence should be addressed.
Electronics 2023, 12(9), 2126; https://doi.org/10.3390/electronics12092126
Submission received: 2 April 2023 / Revised: 2 May 2023 / Accepted: 4 May 2023 / Published: 6 May 2023

Abstract

:
Electric power operation is necessary for the development of power grid companies, where the safety monitoring of electric power operation is difficult. Irregular deformable objects commonly used in electrical construction, such as safety belts and seines, have a dynamic geometric appearance which leads to the poor performance of traditional detection methods. This paper proposes an end-to-end instance segmentation method using the multi-instance relation weighting module for irregular deformable objects. To solve the problem of introducing redundant background information when using the horizontal rectangular box detector, the Mask Scoring R-CNN is used to perform pixel-level instance segmentation so that the bounding box can accurately surround the irregular objects. Considering that deformable objects in power operation workplaces often appear with construction personnel and the objects have an apparent correlation, a multi-instance relation weighting module is proposed to fuse the appearance features and geometric features of objects so that the relation features between objects are learned end-to-end to improve the segmentation effect of irregular objects. The segmentation mAP on the self-built dataset of irregular deformable objects for electric power operation workplaces reached up to 44.8%. With the same 100,000 training rounds, the bounding box mAP and segmentation mAP improved by 1.2% and 0.2%, respectively, compared with the MS R-CNN. Finally, in order to further verify the generalization performance and practicability of the proposed method, an intelligent monitoring system for the power operation scenes is designed to realize the actual deployment and application of the proposed method. Various tests show that the proposed method can segment irregular deformable objects well.

1. Introduction

As society continues to develop, the electric power industry is making constant progress. Electric power operation has become an essential path for the development of power grid companies [1]. However, accidents frequently occur in electric power industry operations, resulting in casualties and economic losses. Therefore, ensuring the personal safety of construction personnel has become a key focus of research for power grid companies. According to the Power Safety Work Regulations [2] and the practical needs of electric power production [3], construction personnel are required to wear safety helmets at construction, maintenance, installation and aerial workplaces. In addition, when working at a height of more than 2 m from the ground, construction personnel must use safety belts [4]. In the electric construction workplace, the activities of construction personnel are difficult to control. In order to ensure the safety of personnel, safety seines are set up to restrict access to certain areas. However, some construction personnel violate the rules by crossing the safety seines to take shortcuts which can easily lead them into electrical hazard areas [5]. Furthermore, due to factors, such as hot weather and equipment, that cause inconvenience, construction personnel may not wear safety equipment properly, such as removing their safety helmets or not using safety belts. Therefore, in the safety management of electric construction workplace workers, it is particularly important to monitor the wearing of safety helmets and safety belts as well as regulate the violation of crossing safety seines.
The traditional monitoring method is to inspect the construction workplace regularly by safety management personnel. However, this method is time consuming and requires more human resources to meet the monitoring demands of the rapidly growing power grid. With the widespread use of video surveillance systems, power operation workplaces mainly use the combination of perambulation inspection and video supervision to monitor workplace conditions [6]. Supervisory personnel observe whether workers wear safety equipment in real-time images transmitted back by cameras in power operation environments. However, as the monitoring scenes expand and cameras are deployed in large quantities, the workload increases geometrically [7]. It is unrealistic to require the monitoring personnel to monitor a large number of monitoring videos in real time, and the background personnel need to be on duty for a long time to coordinate the monitoring and tracking work. When an emergency occurs, due to the difficulty of personnel scheduling, lack of energy and other reasons, even if the monitoring personnel doing real-time monitoring may not be able to find a violation. Manual monitoring methods have problems with low supervisory efficiency, poor timeliness and insufficient skills. Therefore, a system that can automatically identify violations in the video will greatly improve the efficiency of safety inspections and supervision.
As time progresses, traditional video surveillance systems are gradually moving towards intelligence [8]. Intelligent video analysis technology uses the methods of object detection and instance segmentation to extract, detect and recognize features in the collected images, thereby completing the detection of the objects in the image. Video intelligent analysis technology replaces the role of the human eye, allowing computers to judge whether workers are wearing standard equipment based on the collected images, thereby significantly reducing the workload of workers, improving work efficiency and increasing the safety of power operation workplaces.
In safety monitoring for electric power operations, targets can be categorized based on their appearance as either rigid or deformable. The safety helmet worn by workers falls under the category of rigid objects and existing object detection methods have already achieved high detection accuracy for rigid objects. However, irregular deformable objects, such as safety belts and seines have irregular and variable geometric appearances [9]. How to accurately detect them in video surveillance is an important task. Existing object detection methods still have problems with irregular deformable objects. The main reasons for the difficulty in detecting irregular deformable objects are as follows:
(1) The physical properties of deformable objects give rise to their unique characteristics. Unlike rigid objects, irregular deformable objects are prone to bending or folding and are easily tangled. A safety belt, for example, is a simple shape but can present an infinite number of geometric shapes. Due to the uncertainty in their appearance and edge features, it brings great difficulty to the location of object detection and instance segmentation.
(2) The object detection algorithm using the horizontal rectangle as the detector has inherent flaws when detecting deformable objects. Current mainstream object detection methods, such as the YOLO series [10,11,12,13] and R-CNN series [14,15,16], use horizontal rectangles as detectors to describe the location information of objects. These detectors cannot fully fit the shape of deformable objects, resulting in a large proportion of invalid information belonging to the background within the bounding box. In Figure 1a, the seine is the object to be detected. When detected using a horizontal rectangle, the seine area only accounts for one-third of the horizontal rectangle, and the horizontal rectangle also includes workers unrelated to the seine. The geometric features of rigid objects are invariant, so this does not affect their detection. However, deformable objects are prone to deformable, and the horizontal rectangle is not the best choice for obtaining deformable object features. As shown in Figure 1b, using the polygonal bounding box to detect deformable objects eliminates the interference pixels of the background, allowing for the acquisition of precise appearance information for the targets. The polygonal bounding box can effectively separate the seine and workers.
(3) Currently, there is a lack of publicly available datasets for detecting irregular deformable objects in various electric power operation scenes.
Due to the complexity of deformable objects, there is little research on deformable object detection. Improving the detection effect of irregular deformable objects is the focus of this study. In addition, as the actual monitoring scenes of electric power operation are usually complex and changeable, the security monitoring of electric power operation will also face the following challenges:
(1) Safety belts are frequently used for high-altitude operations, but the weather and lighting conditions at the workplace are highly changeable, making it difficult to extend visual solutions for specific scenes to high-altitude workplaces.
(2) The safety belts and seines are relatively small when the high-altitude worker is far from the camera. Small object detection is one of the difficult problems in computer vision [17].
(3) Most existing deep learning detection solutions are not end-to-end and may accumulate errors, leading to poor detection performance [18].
Therefore, to apply detection algorithms to electricity safety monitoring, it is necessary to comprehensively apply theoretical methods from fields, such as image processing, computer vision and artificial intelligence [19], which presents significant challenges and research value.
Instance segmentation refers to the separation of the foreground and background of the object to be detected by using polygonal boxes, achieving pixel-level object separation [20]. Instance segmentation not only classifies each pixel but also classifies different individuals of the same object. For irregular deformable objects, the polygonal box detector based on the instance segmentation can frame the deformable objects as large as possible and segment the object and background along the object contour to remove background noise so as to detect the objects more accurately. Therefore, for detecting irregular deformable objects in the electric power operation field, an instance segmentation method based on the multi-instance relation weighting module is proposed in this paper. During the training phase, the model learns the mutual relation features between objects end-to-end. During the testing phase, the model can accurately segment and classify different types of irregular deformable objects. The main contributions of this paper are as follows:
  • To solve the problem of introducing redundant background information when using the horizontal rectangular box detector, we perform instance segmentation in the electric power operation for irregular deformable objects. Using instance segmentation can not only locate and classify each object in the image but also achieve pixel-level segmentation of the object, achieving more precise detection.
  • Adding a multi-instance relation weighting module to the instance segmentation network. First, the appearance and geometric features of objects are extracted through deep convolutional neural networks. Then, the features of the mutual relation among all the objects are learned through the multi-instance relationship weighting module in an end-to-end approach, improving the segmentation accuracy of deformable objects.
  • Due to the lack of a detection dataset for various irregular deformable objects in power operation scenes, we built a dataset of irregular deformable objects for the electric power operation scenes, including three types of annotations: safety belts, safety seines and construction personnel. We performed data augmentation on the dataset and used it to train and test the method proposed in this paper. The experimental results show that the proposed method can achieve a high detection accuracy, effectively improving the safety monitoring efficiency for construction personnel.
  • In order to further verify the generalization performance and practicability of the proposed instance segmentation method, we design an intelligent monitoring system for the electric power operation based on the proposed method to detect the protective equipment, avoid safety accidents and achieve the practical deployment of the algorithm.

2. Related Work

2.1. Instance Segmentation

Instance segmentation classifies and locates different objects in the image through the pixel-level instance masks. Instance segmentation includes single-stage methods and two-stage methods.
Single-stage instance segmentation requires simultaneous localization, classification and segmentation of objects. YOLACT [21] predicted a set of prototype masks and mask coefficients for each instance and combined them by matrix multiplication. PolarMask [22] used instance center point classification and dense distance regression to model instance masks based on the polar coordinate system. The segmentation speed of a single-stage method is fast, but the segmentation accuracy is limited [23].
The two-stage instance segmentation methods first generate Regions of Interest using the detector and then perform instance segmentation on these regions to generate pixel-level masks for each instance. Mask R-CNN [24] extended the Faster R-CNN [16] by adding a mask prediction branch to perform instance segmentation on the detected regions. It significantly improved segmentation accuracy by efficiently utilizing both the detection and segmentation stages. BMask R-CNN [25] further enhanced mask feature boundary awareness by using an additional branch to directly estimate boundaries. DCT-Mask [26] employed discrete cosine transform to encode high-resolution binary masks into compact vectors which improved instance segmentation performance. Although two-stage instance segmentation methods have been significantly improved, they still suffer from poor real-time performance and generalization performance [27].

2.2. Irregular Deformable Object Detection

The detection of irregular deformable objects is always a difficulty in computer vision research. The present research mainly solves the problem from three aspects: improvement of the bounding box detector, feature expression and training loss function [28,29,30,31,32,33]. Zhou et al. [34] introduced a four-pole and center-point detector to replace traditional horizontal bounding box detectors, thereby resolving the bounding box representation issue for deformable objects. Wang et al. [35] proposed a detector for the text of arbitrary shape that utilizes a text Region Proposal Network to predict text proposal boxes, but its applicability to arbitrary-shaped non-text objects may be limited. Yang et al. [36] presented a modified single-stage detection network to achieve superior rotated bounding box detection by strengthening multi-angle feature representation and registering object features. Qian et al. [37] tackled the difficulty of deformable object detection by designing an efficient loss function to fit the real box through counterclockwise rotation of the predicted box when encountering boundary problems, but such methods are plagued by boundary discontinuity issues.
Since general convolutional neural networks cannot effectively learn and adapt to deformable objects [38], the effect of the existing irregular deformable object detection methods needs to be improved and the research of deformable object detection methods is still faced with great challenges.

2.3. Object Relation

At present, the detection of irregular deformable objects, such as safety belts, should be divided into multiple detection stages [39] in security monitoring. The first step is to detect the construction worker followed by the detection of the safety belt. By using the coordinate information of the two, the spatial relation between the safety belt and the construction worker can be determined. Finally, the threshold for the spatial relation is manually set to determine whether the workers properly fasten the seat belts. The object relation of this detection method is calculated as a post-processing step, and the threshold value of the correlation relation is manually designed. As a result, the neural network cannot perform end-to-end feature learning of the relation between objects, making it difficult to achieve high accuracy and real-time performance.
In specific scenes, there is often a certain relationship between objects in the image [40]. When a certain type of object appears, there will always be related objects. Drawing on the application of the attention mechanism, the weight of the relationship between objects is calculated by using the feature information of different objects, and the modeling of the relationship between objects can be helpful for object detection and instance segmentation when the features of objects are not obvious [41].
DeepID-Net [42] classified the entire image to obtain the classification score of the scene where the image is located. Then, the classification score was used to connect specific objects related to the scene, improving the accuracy of object recognition in this scene. Non-Local neural networks [43] captured long-distance relationships by calculating the relationships between each position pixel and all other position pixels thus improving the performance of image segmentation. DANet [44] combined the spatial attention mechanism and channel attention mechanism to capture spatial positional relationships and explore channel importance. Inspired by graph neural networks, He et al. [45] proposed a multi-object relation inference detection algorithm, RGC, to dynamically construct a relationship graph between objects and encode the geometric and visual relationships between objects. Chen et al. [46] designed a graph-based relation-aware network, Relation R-CNN, where the spatial relationship network used the RGC method to capture local relationships, and the semantic relationship network combined the OD-GCN method to obtain global co-occurrence relationship information from labels.

2.4. Electric Power Field Monitoring System
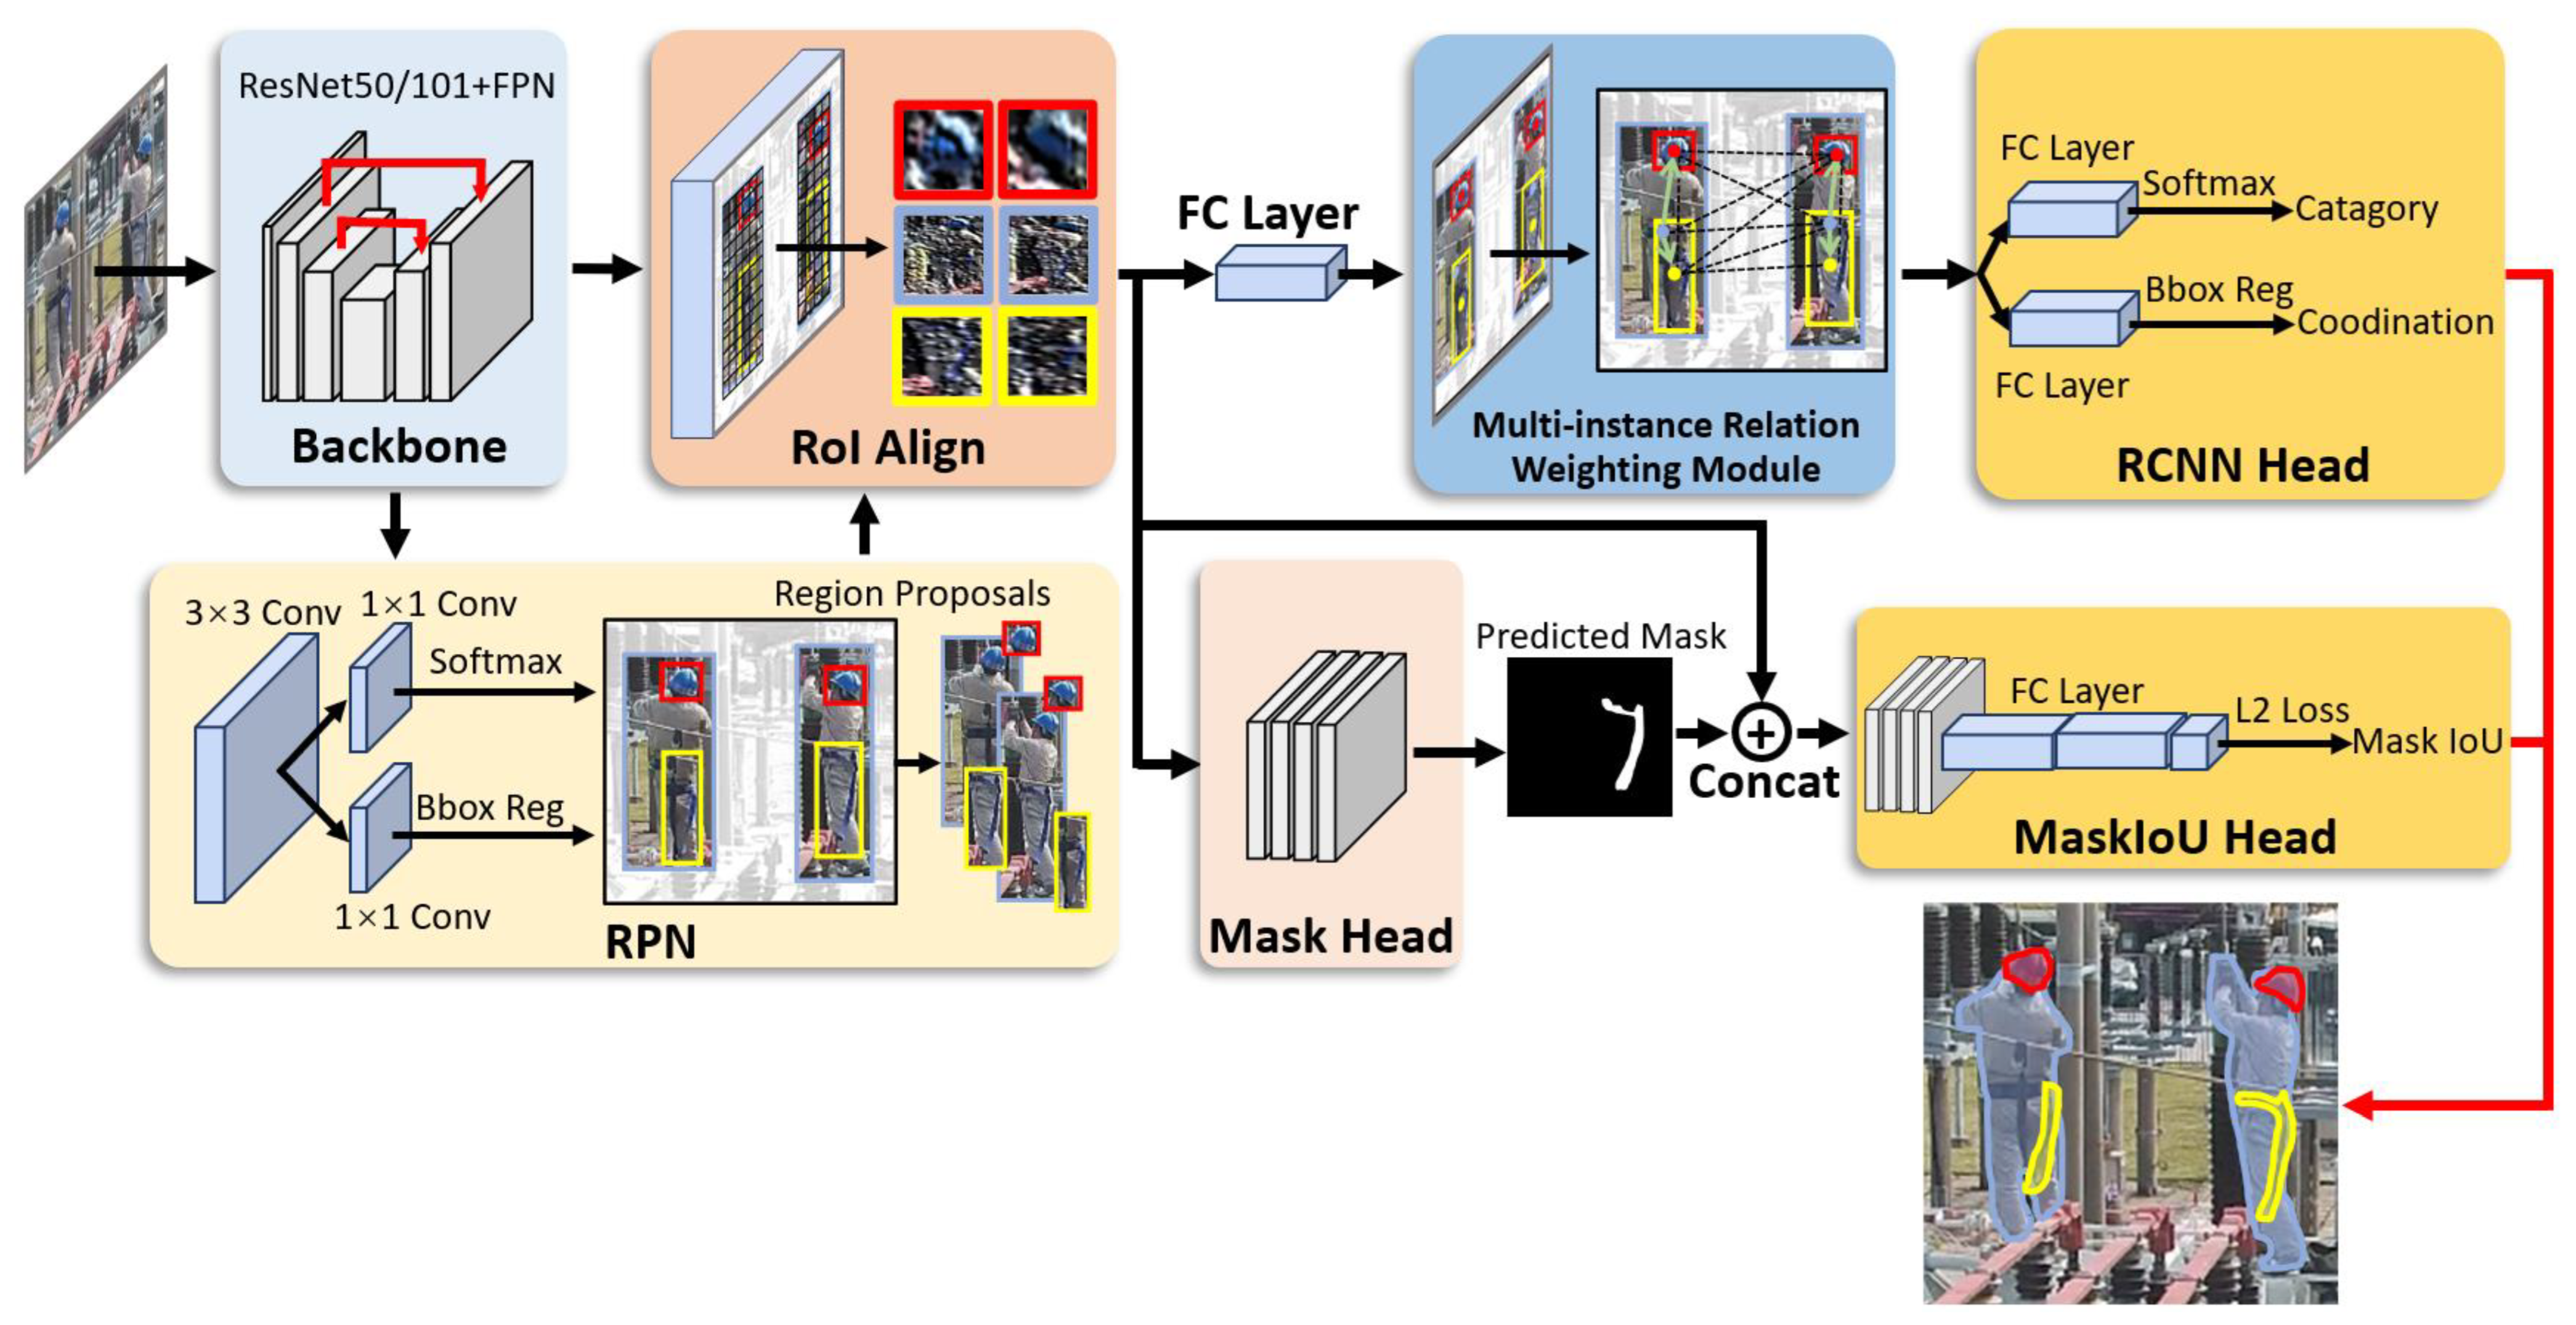
The current state of intelligent monitoring in power operations relies on a combination of humans and machines to achieve object detection within the scene. The traditional object detection method for safety equipment worn by workers in power operation scenes is based on a combination of feature selection and classifiers [47,48]. However, due to the intricate and complex environment of the power industry, the traditional manual feature extraction method for object detection is very poor. When facing situations such as changes in weather, lighting, and complex environmental backgrounds, traditional methods often struggle to meet the diverse features of the target.
In recent years, the development and application of deep learning have made object detection and instance segmentation in power operation workplaces become a reality. Chen et al. [5] used the improved YOLOv5 to detect the behaviors of not wearing safety helmets and smoking in the industry. The improved YOLOv5 adopted the weighted feature pyramid network module to replace PANet so as to alleviate the loss of feature information caused by excessive network layers. However, the weighted feature pyramid network module assumes that the distribution and shape of the detected scene targets have certain regularity which may perform poorly in some atypical scenes. Ku et al. [49] designed ISR-YOLOv4 based on the image super-resolution module to enhance photo resolution and solve the problem of detecting small safety helmets in construction workplaces. However, the complexity of the ISR-YOLOV4 has increased compared to YOLOV4, which makes it slightly difficult to deploy the algorithm for real-time inference. Arabi et al. [50] deployed existing deep learning-based security monitoring methods on two embedded devices, demonstrating the practicality of deep learning-based object detection solutions in construction workplace security monitoring. However, the deployed algorithm is a relatively basic and simple object detection algorithm.
In summary, most of the algorithms currently applied in the intelligent monitoring system for power operation are object detection algorithms. The object detection algorithms in some research have poor detection performance in irregular deformable objects, making them difficult to be applied in intelligent monitoring. The algorithms in the other part of the research usually require complex network structures and module designs to improve detection accuracy which increases computational complexity. These algorithms require higher performance from deployment devices that have larger computing resources and storage space, otherwise, there would be a phenomenon of insufficient detection performance or slow detection speed. Therefore, these algorithms are difficult to deploy in practice and perform real-time detection. Moreover, research on the application of instance segmentation to deformable object detection in intelligent monitoring for power operation is still scarce. Therefore, this paper designs an intelligent monitoring system for electric power construction based on the proposed instance segmentation method. The effectiveness of the proposed algorithm is verified in the system, and the actual deployment is completed.

3. Methods

The use of irregular deformable objects is frequent in power operation workplaces, such as safety belts worn by construction personnel and safety seines set up at construction workplaces. These objects are crucial detection targets for security monitoring. The accurate and rapid detection of protective equipment in power operation is of great importance to intelligent power operation monitoring. However, the performance of current detection algorithms applied directly to detecting irregular deformable objects is generally unsatisfactory. Therefore, it is necessary to improve the existing instance segmentation algorithm framework based on the physical characteristics and environmental factors of irregular deformable objects.
The deformable object segmentation method proposed in this paper based on the multi-instance relation weighting module is shown in Figure 2. This method introduces relation features between objects which are used to solve the detection problem of irregular deformable objects in power operation. Specifically, a multi-instance relation weighting module is added in Mask Scoring R-CNN [51] to model the appearance feature f A and geometric feature f G of objects so as to learn the mutual relation features among the objects in an end-to-end approach, enhancing the segmentation accuracy of deformable objects.
First, the input image is processed by the backbone feature extraction network to obtain the feature map. The Region Proposal Network (RPN) scans each position on the feature map by means of a sliding window to obtain independent Regions of Interest (RoIs). The RoI Align layer zooms the RoIs of different sizes into a unified size. The proposed multi-instance relation weighting module is added after the RoI Align layer, allowing each RoI to contain relation features between objects. Finally, the results output by the multi-instance relation weighting module are sent to the RCNN head, Mask head and MaskIoU head to get the accurate classification and segmentation results.

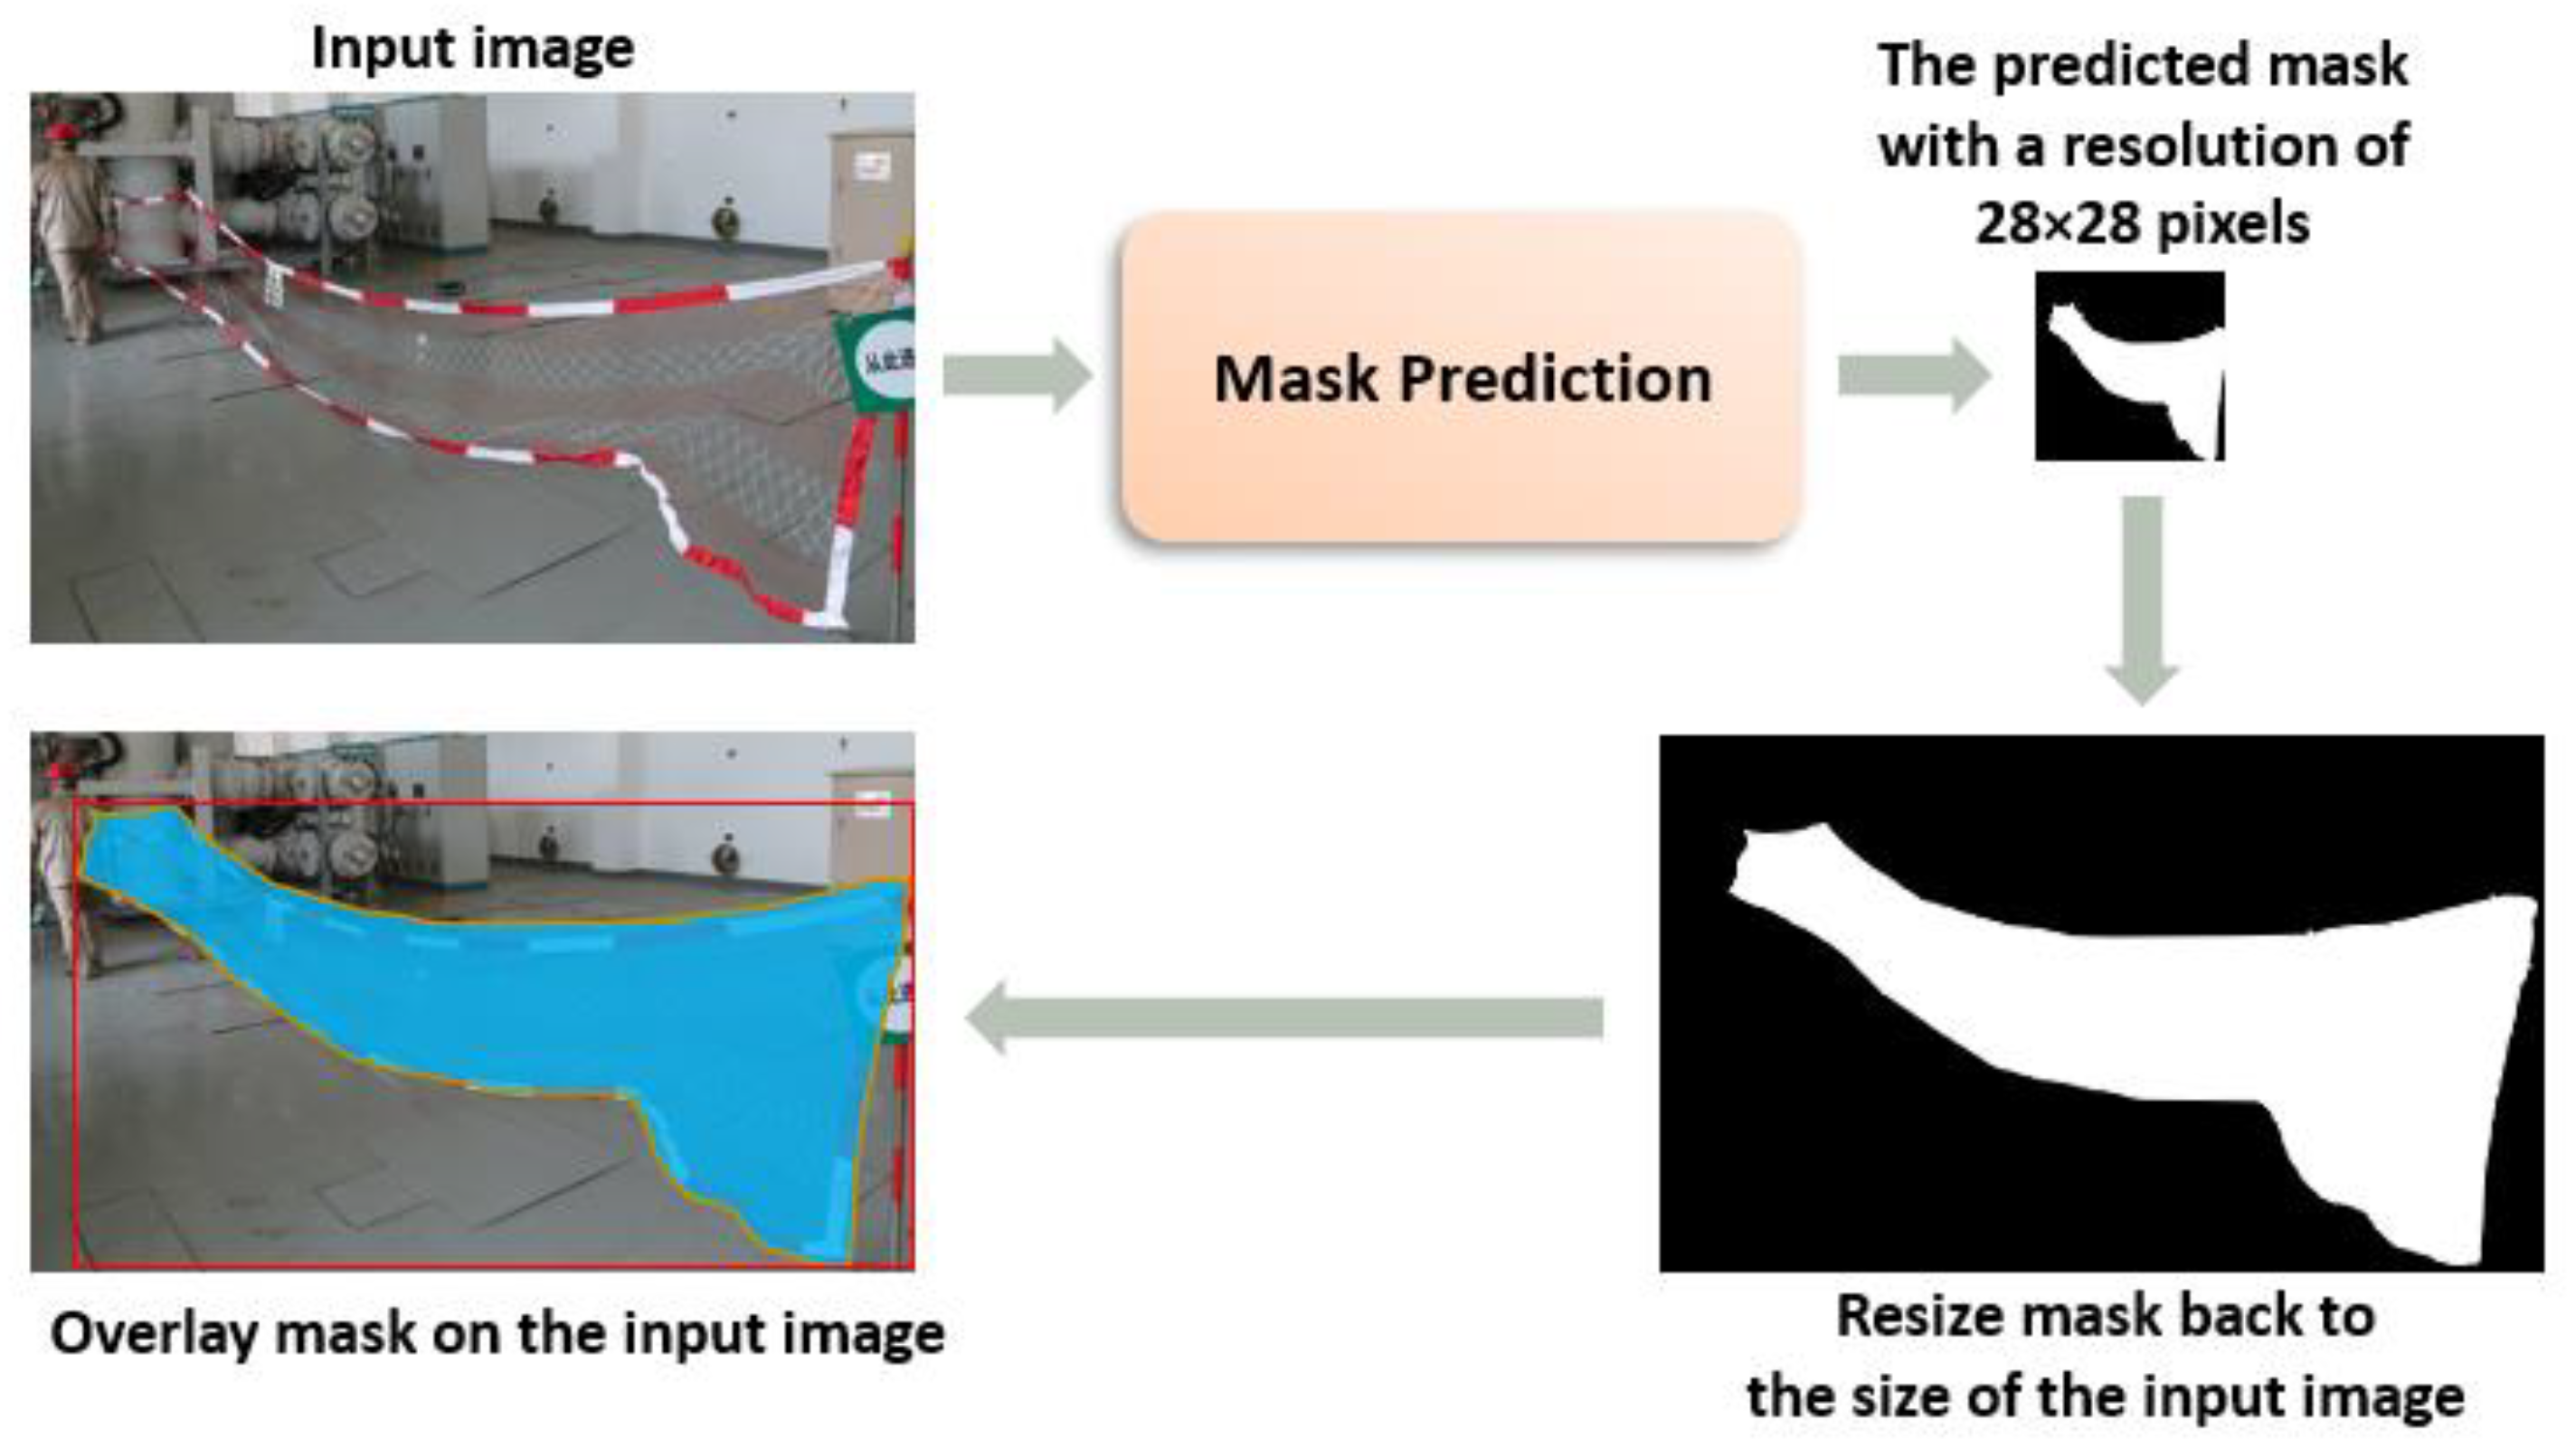
3.1. Mask Scoring-RCNN

Mask Scoring-RCNN (MS R-CNN) is a complex extension of Mask-RCNN which combines the advantages of object detection and semantic segmentation. Using polygonal boxes as detectors in Mask R-CNN allows for the segmentation of irregularly shaped objects in the image. It is a top-down instance segmentation method that uses Faster R-CNN’s approach to find the class and bounding box of each instance and then performs semantic segmentation on the objects inside the bounding box to obtain the segmentation results for each instance.
During the training of the instance segmentation model, convolutional neural network parameters are used for image recognition and segmentation. The predicted segmentation results are repeatedly compared with the manually labeled results (ground truth) to score different mask segmentation results. Network parameters are constantly optimized to improve the score until the model that can accurately segment the target is finally trained. Therefore, accurate scoring of mask segmentation results is crucial for obtaining a high-accuracy instance segmentation model.
In Mask R-CNN, the object bounding box is considered to have some correlation with the mask and uses the classification confidence of the bounding box as the score for evaluating the mask segmentation results. However, the correlation between the mask and the classification confidence is weak. Moreover, due to the problem of target clustering and overlap, situations may arise where the classification confidence is high, but the mask segmentation result is poor. Therefore, there are flaws in the scoring mechanism of Mask R-CNN for mask segmentation results.
To improve upon Mask R-CNN, MS R-CNN calculates the Intersection over Union (IoU) between the predicted segmentation mask and the ground truth to obtain MaskIoU. MaskIoU and classification confidence are integrated to evaluate the mask segmentation results so as to improve the accuracy of image segmentation compared with Mask R-CNN. The corresponding approach in the network structure is to add the MaskIoU head. The structure diagram of MS R-CNN is shown in Figure 3.
The MS R-CNN model is composed of three main components. The first component is the backbone feature extraction network. The backbone network is composed of the ResNet50/101 deep residual convolutional neural network and the Feature Pyramid Network (FPN). FPN fuses multi-scale features, allowing the output feature to provide rich semantic information and powerful spatial information, effectively extracting features for small objects in electric power operation.
The second component comprised the RPN and the RoI Align layer. The RPN performs convolutional operations on the feature map to obtain region proposals (also known as RoIs) and performs an initial correction on the region proposals. Local feature maps are then obtained by extracting feature maps from the region proposals. However, due to the varying sizes of the local feature maps, it is challenging for the model to learn. Therefore, the RoI Align layer is utilized to normalize the local feature maps to a consistent size.
The third component consists of the RCNN head, Mask head and MaskIoU head which classify detected objects, correct the bounding boxes and generate masks for the detected objects. After obtaining uniform-sized feature maps through RoI Align, these feature maps are input into the RCNN head and Mask head. The RCNN head needs to complete two tasks: implement the Softmax function to classify the bounding boxes and use the L1 or L2 loss function to perform bounding box regression and obtain the accurate position of the target.
The Mask head is used to implement semantic segmentation tasks and obtain instance binary masks for each category. The Mask head is a seven-layer convolutional neural network that inputs positive samples selected by the RoI classifier and generates their masks. The resolution of the generated masks is 28 × 28 pixels, and the mask generation process is shown in Figure 4.
MaskIoU head is a branch added to Mask R-CNN aimed at obtaining a score for the predicted mask. The ideal score for the predicted mask, denoted by S mask , should be the IoU between the predicted mask and the corresponding ground truth mask for its classification, namely MaskIoU. Since each mask belongs to only one category, the ideal mask score should be positive only for the corresponding category and 0 for all other categories. To determine whether the predicted mask is optimal, it is necessary to evaluate both whether the mask corresponds to the correct object classification and whether it matches the target mask. Therefore, obtaining the S mask involves two steps: classifying the mask and regressing the MaskIoU. The S mask can be expressed as follows:
S mask = S cls   ×   S mask _ iou
where S cls represents the classification score or classification confidence, focused on classifying the input RoI feature and S mask _ iou represents the predicted MaskIoU focused on regressing the MaskIoU. The predicted MaskIoU is multiplied by the classification score to obtain the predicted mask score.
In the MaskIoU head, MS R-CNN combines the features from the RoI Align layer with the predicted mask as the input to the MaskIoU Head. When combining these features, a max pooling layer with kernel size two and stride two is used to ensure that the predicted mask has the same spatial dimensions as the RoIs. When regressing the MaskIoU, only the MaskIoU of the correct category is considered, and not for all categories. As shown in Figure 3, the MaskIoU Head consists of multiple convolutional and fully connected layers. The convolutional layers are set to have the kernel size and filter number of 3 and 256, respectively, similar to the Mask Head. The MaskIoU Head includes three fully connected layers, with the output of the first two being 1024 and the output of the last being the number of categories. MS R-CNN also considers the loss value of the MaskIoU head as a loss term and uses the L2 loss function for MaskIoU regression. Using S mask as the mask score can effectively combine the semantic category and mask quality, providing more accurate masks for instance segmentation and better object boundary localization.

3.2. Multi-Instance Relation Weighting Module

The feature of the inter-object correlation relation is a highly significant attribute. In our everyday existence, the human eye typically employs the inter-object correlation to describe the objects present in the given scene. For example, the pen is placed on top of the book, and the book is resting on the desk. We transfer this relationship description to power intelligent monitoring. In the electric power operation workplace, when the construction personnel are detected, there is a high probability of safety belts and safety seines in the vicinity of the construction personnel.
The current deep learning models face significant challenges in describing inter-object correlations, as the objects present in images can vary in terms of category, size and location, and their numbers may differ across different images. Current object detection methods employed in electric power operation safety monitoring typically require staged processing to detect the relation between the construction personnel and safety belts. The correlation calculation among objects is post-processed and the deep convolutional neural network cannot detect the safety belt end-to-end. Therefore, to tackle the aforementioned problem, this paper proposes the multi-instance relation weighting module as shown in Figure 5.
The design of the multi-instance relation weighting module is based on the self-attention mechanism [52]. The self-attention mechanism enables the consideration of information from the entire sequence and establishes a dependency model for each element in the sequence, without the need to consider the distance between the elements. The input to the attention module includes queries and keys with a dimension of d k as well as values with a dimension of d v . Queries represent the query vector, keys represent the vector of relevance between the queried information and other information and values represent the vector of the queried information. To calculate the correlation coefficient α between the query and all the keys, a dot product operation is performed between the query and all the keys. The Softmax function is used to obtain the weights of the values. The queries can be represented as q , while all the keys are packed into matrix K and all the values are packed into matrix V . The self-attention mechanism can be represented as follows:
v out = Softmax q K T d k V
where the output value is the weighted average of the input values, that is, v out contains the relation information between q and K .
We consider all the objects with geometric features f G and appearance features f A [53]. f G is a 4D bounding box that contains information about the object’s coordinates ( x , y , w , h ) . Meanwhile, the appearance features f A correspond to the region feature of RoI. The dimension of f A is determined by the learning task, such as a 1024-dimensional feature output from a fully connected layer. Specifically, f A n represents the appearance feature of the nth object, and f G n represents the geometric feature of the nth object. As a result, an input set containing N objects can be represented as { ( f A n , f G n ) } n = 1 N . The formula for calculating the relation feature f R of the entire set of objects is as follows:
f R = f R ( 1 ) f R ( n ) = ω 11 ω 1 N ω N 1 ω NN W V f A 1 f A n
The calculation formula for the relation feature f R ( n ) of the entire object set with respect to the nth object is as follows:
f R ( n ) = m ω mn ( W V f A m )
where W V is the transformation matrix used for linear transformation of f A m equivalent to V in Equation (2). As for the relation weight ω mn which represents the influence of the m-th object on the nth object and reflects the impact from other objects, its calculation formula is as follows:
ω mn = ω G mn exp ( ω A mn ) k ω G kn exp ( ω A kn )
The denominator is to normalize the numerator. The relation weight ω mn is determined jointly by appearance and geometry, that is, the appearance weight and geometry weight together form the ω mn . The calculation formula for the appearance weight ω A mn is as follows:
ω A mn = dot ( W K f A m , W Q   f A n ) d k
where W K and W Q are matrices similar to K and q in Equation (2), projecting the original appearance features f A m and f A n into a low-dimensional subspace, measuring the similarity between the appearance features of the two objects through vector dot products and the projected feature dimension is d k .
The calculation formula of geometric weight ω G mn is as follows:
ω G mn = max { 0 , W G , ε G ( f G m , f G n ) }
f G m = x m , y m , w m , h m
f G n = x n , y n , w n , h n
The calculation of ω G mn can be divided into two steps. Firstly, the ε G is used to map the geometric features between the m-th and nth objects to a high-dimensional space. A four-dimensional relative geometric feature is used to ensure invariance to translation and scaling transformations as shown in the following formula:
f G m , f G n T = log x m x n w m , log y m y n h m , log w n w m , log h n h m T
The four-dimensional feature is embedded into the high-dimensional representation by computing cosine and sine functions of different wavelengths. The embedded feature dimension is d g . Secondly, the matrix W G is used to transform the ε G into a scalar. The ε G is then clipped at 0 and passed through the ReLU activation function to obtain geometric weights. The zero fine-tuning operation is only limited to the relation between certain geometric objects.
While f R ( n ) is simply the relation feature of the entire object set with respect to the nth object, the multi-instance relation weighting module consists of N r relation feature modules. The N r relation features are concatenated together, and then added to the original appearance features of the nth object to obtain the enhanced feature:
f A n = f A n + Concat [ f R 1 ( n ) , , f R N r ( n ) ] , n
where Concat ( · ) is the concatenate operation used to aggregate multiple relation features. To match the channel dimension, each output channel of W V r is set to 1 N r of the dimension of the input feature f A m .
In the multi-instance relation weighting module, the four matrices W K , W Q , W G and W V are the weights to be learned. The number of relation features N r , the dimension d k of key, and the dimension d g of geometric feature embedding are configurable hyperparameters. Multiple experiments have shown that increasing parameters N r , d k , and d g can improve the segmentation accuracy of the algorithm. However, as the values of these three parameters increase, the number of network parameters and computational complexity also increase. After setting N r , d k , and d g to 16, 64, and 64 respectively, larger parameter values no longer improve the segmentation accuracy. Therefore, N r will be set to 16, d k and d g will be set to 64 in subsequent experiments.
After the relationship modeling between objects, we added the multi-instance relation weighting module to MS RCNN. Existing object detection methods scan the feature map with the RPN and obtain a sparse set of region proposals, and then classify and regress the bounding boxes of each region proposal independently without considering the spatial positional relations between different region proposals. In order to learn the relations between objects, we added the multi-instance relation weighting module after RPN. After RPN and before the multi-instance relation weighting module, there is also a fully connected layer with a dimension of 1024. The region proposals predicted by the RPN network are treated as a whole and sent into the module rather than as individual entities.
Initially, RPN scans each position on the feature map utilizing a sliding window and extracts the appearance features and geometric features of each object, obtaining the RoIs that may contain objects in the image. At this point, the relations between the objects are still independent. Then, the RoI Align layer zooms the RoIs of different sizes into a unified size. Subsequently, the normalized RoIs are inputted into the fully connected layer which has a dimension of 1024. The input dimension of the multi-instance relation weighting module is 1024 and so is the output dimension. Therefore, we added the module after the fully connected layer. Finally, the results outputted by the multi-instance relation weighting module are sent into two fully connected layers, completing the tasks of object classification and bounding-box regression.
Similar to the self-attention mechanism, the multi-instance relation weighting module has the function of modeling the object relations between region proposals, enabling the output region proposals of the module to contain the relational information of each object. The main difference between the proposed module and the current attention mechanism in the CV domain is that the geometric weights of objects are introduced into the attention mechanism in our proposed module. The multi-instance relation weighting module extends the attention mechanism into two parts: appearance weight and geometric weight. The module obtains the geometric weight and appearance weight by inputting the geometric features and appearance features of the object. Geometric weight and appearance weight are combined to obtain the object relation feature. Then, the model is completed by superimposing multiple object relation features. Geometric weight is responsible for modeling the spatial relationship between objects, taking into account the relative geometric relationship between objects. In addition, the geometric weight gives the module the desirable property of being translation invariant. The proposed relational module has the same input and output dimensions and can be easily applied to the basic building blocks in any network structure. This module is differentiable and can be optimized by backpropagation. The proposed module models the interaction between the appearance and geometry of objects to achieve joint reasoning and learning of all objects and significantly improves object recognition accuracy.

3.3. Model Loss Function

The loss function is employed to evaluate the dissimilarity between the ground truths and the predicted outputs in the training phase. The smaller the loss function value is, the better the model fitting effect and prediction performance are and the predicted outputs of the model are closer to the truth. The total loss of the proposed method consists of the RPN loss, and the four loss terms generated by the three functional branches. The total loss function is as follows:
L = L RPN + L cls + L reg + L mask + L maskiou
The role of RPN is to extract region proposals, so L RPN consists of the RPN classification loss L RPN _ cls and the RPN bounding-box regression loss L RPN _ reg . The loss function of RPN is as follows:
L RPN = 1 N obj i   L RPN _ cls p i , p i * + λ 1 N reg i   p i * L RPN _ reg t i , t i *
The RPN classification loss L RPN _ cls is formulated using a binary cross-entropy loss. The i represents the anchor index in the mini batch. The predicted probability of the target is denoted as p i , while the ground-truth label of the target is represented as p i * . p i * = 1 if the object is present in the i-th anchor box, and p i * = 0 otherwise. The class of each anchor is either 1 or 0, because the RPN is only responsible for confirming the presence of the object without classifying it. The predicted bounding box of the i-th anchor is represented as t i , while the ground-truth box corresponding to the i-th anchor is represented as t i * . The RPN classification loss and bounding-box regression loss are normalized by N reg and N obj . N reg is the number of anchors and is set to 2400. N obj is the mini-batch size and is set to 256. To balance the impact of the two loss functions, a hyperparameter λ with a value of 10 is introduced due to the large difference in the number of N reg and N obj .
The four loss terms generated by the three functional branches include the classification loss L cls and the bounding-box regression loss L reg generated by the RCNN head, the pixel segmentation loss L mask generated by the Mask head and the MaskIoU regression loss L maskiou generated by the MaskIoU head.
The classification loss L cls of MS R-CNN model adopts the cross-entropy loss function, and the formula is as follows:
L cls p i , p i * = log p i p i * + 1 p i 1 p i * .
The bounding-box regression loss L reg adopts smooth L1 loss as follows:
L reg t i , t i * = smooth L 1 t i t i * ,
smooth L 1 ( x ) = 0.5 x 2   if   | x | < 1 | x | 0.5   otherwise   .
L mask is pixel segmentation loss which is calculated by binary cross entropy with logits loss. The formula is as follows:
L mask m i , m i * = m i * log m i + 1 m i * log 1 m i ,
where m i is the predicted mask obtained by the sigmoid function, and m i * is the ground truth mask obtained by the sigmoid function.
L maskiou is the regression loss of MaskIoU, and the L2 loss is applied to regression MaskIoU. The formula is as follows:
L maskiou s i , s i * = i s i * s i 2 ,
where s i is the predicted mask score, and s i * is the IoU score between the predicted mask and the ground truth.

4. Experimental Results and Discussion

4.1. Dataset

The horizontal rectangular box is difficult to completely fit the shape and boundary of the irregular deformable objects which reduces the feature quality of the training model and leads to a high detection miss rate. The appearance and boundary information of deformable objects can be marked more accurately using polygonal boxes. The background and interference pixels can be eliminated to better train the model.
Due to the lack of a detection dataset for various irregular deformable objects in intelligent monitoring of electric power operation, we built a dataset of irregular deformable objects for the electric power operation scenes.
(1) Data Collection: The dataset of irregular deformable objects in the electric power operation scenes mainly included safety belts, seines and construction personnel. This work collected 6550 images from the power grid company. The pictures were mainly divided into two categories. The first category consisted of 5250 high-resolution images captured by field inspection personnel using the digital camera with a resolution of 5184 × 3888 pixels. The shooting angles of the pictures were horizontal and upward. The second category consisted of 1300 single-frame images captured from real-time monitoring videos of the power grid with resolutions of 1280 × 720 pixels and 1920 × 1080 pixels.
(2) Data Cleaning: The collected images were classified and screened, with irrelevant images removed and images containing irregular deformable objects retained, while further screening out images with severe object occlusion or tiny object sizes. After data cleaning, 2368 images were obtained for use in this study.
(3) Image Labeling: The polygonal boxes were used to label the images in the dataset. EISeg, an interactive segmentation automatic labeling software, was used for polygonal box labeling. EISeg used region seed-based interactive segmentation technology [54] to achieve semi-automated labeling, saving time and workforce.
(4) Dataset Partition: After image cleaning and labeling, there were 2368 images available for the three categories of deformable objects. The dataset was divided into training, validation and testing sets, with the proportions being 80%, 19% and 1%, respectively. The dataset partitioning and annotation counts for each category are shown in Table 1.
(5) Data Augmentation (DA): In order to expand the dataset and improve the generalization performance of the model, Mosaic data augmentation [55] was used to extend the training set. The Mosaic data augmentation randomly reads four images from the training set and performs flipping, size scaling, cropping and a series of color space transformation operations. Then, the four images were arranged and combined in the order of upper left, lower left, lower right and upper right. The annotation boxes that do not exceed the area in each image were retained, while those that exceed the area were removed. Eight kinds of random Mosaic data augmentation were applied to the original training set, and the augmented training set had a total of 17,064 images. The result of Mosaic data augmentation is shown in Figure 6.
(6) Cross-validation: To obtain more effective information from the limited self-built dataset and avoid the effects of chance factors leading to differential experimental results, we implemented five-fold cross-validation in our self-built dataset experiments. The previously separated training and validation sets are merged and again partitioned into five subsets. Each time, one subset was chosen as the validation set and the remaining four subsets were used as the training set. This process was repeated five times, with each subset serving as the validation set once. The average evaluation of the five training results was taken as the final evaluation metrics.

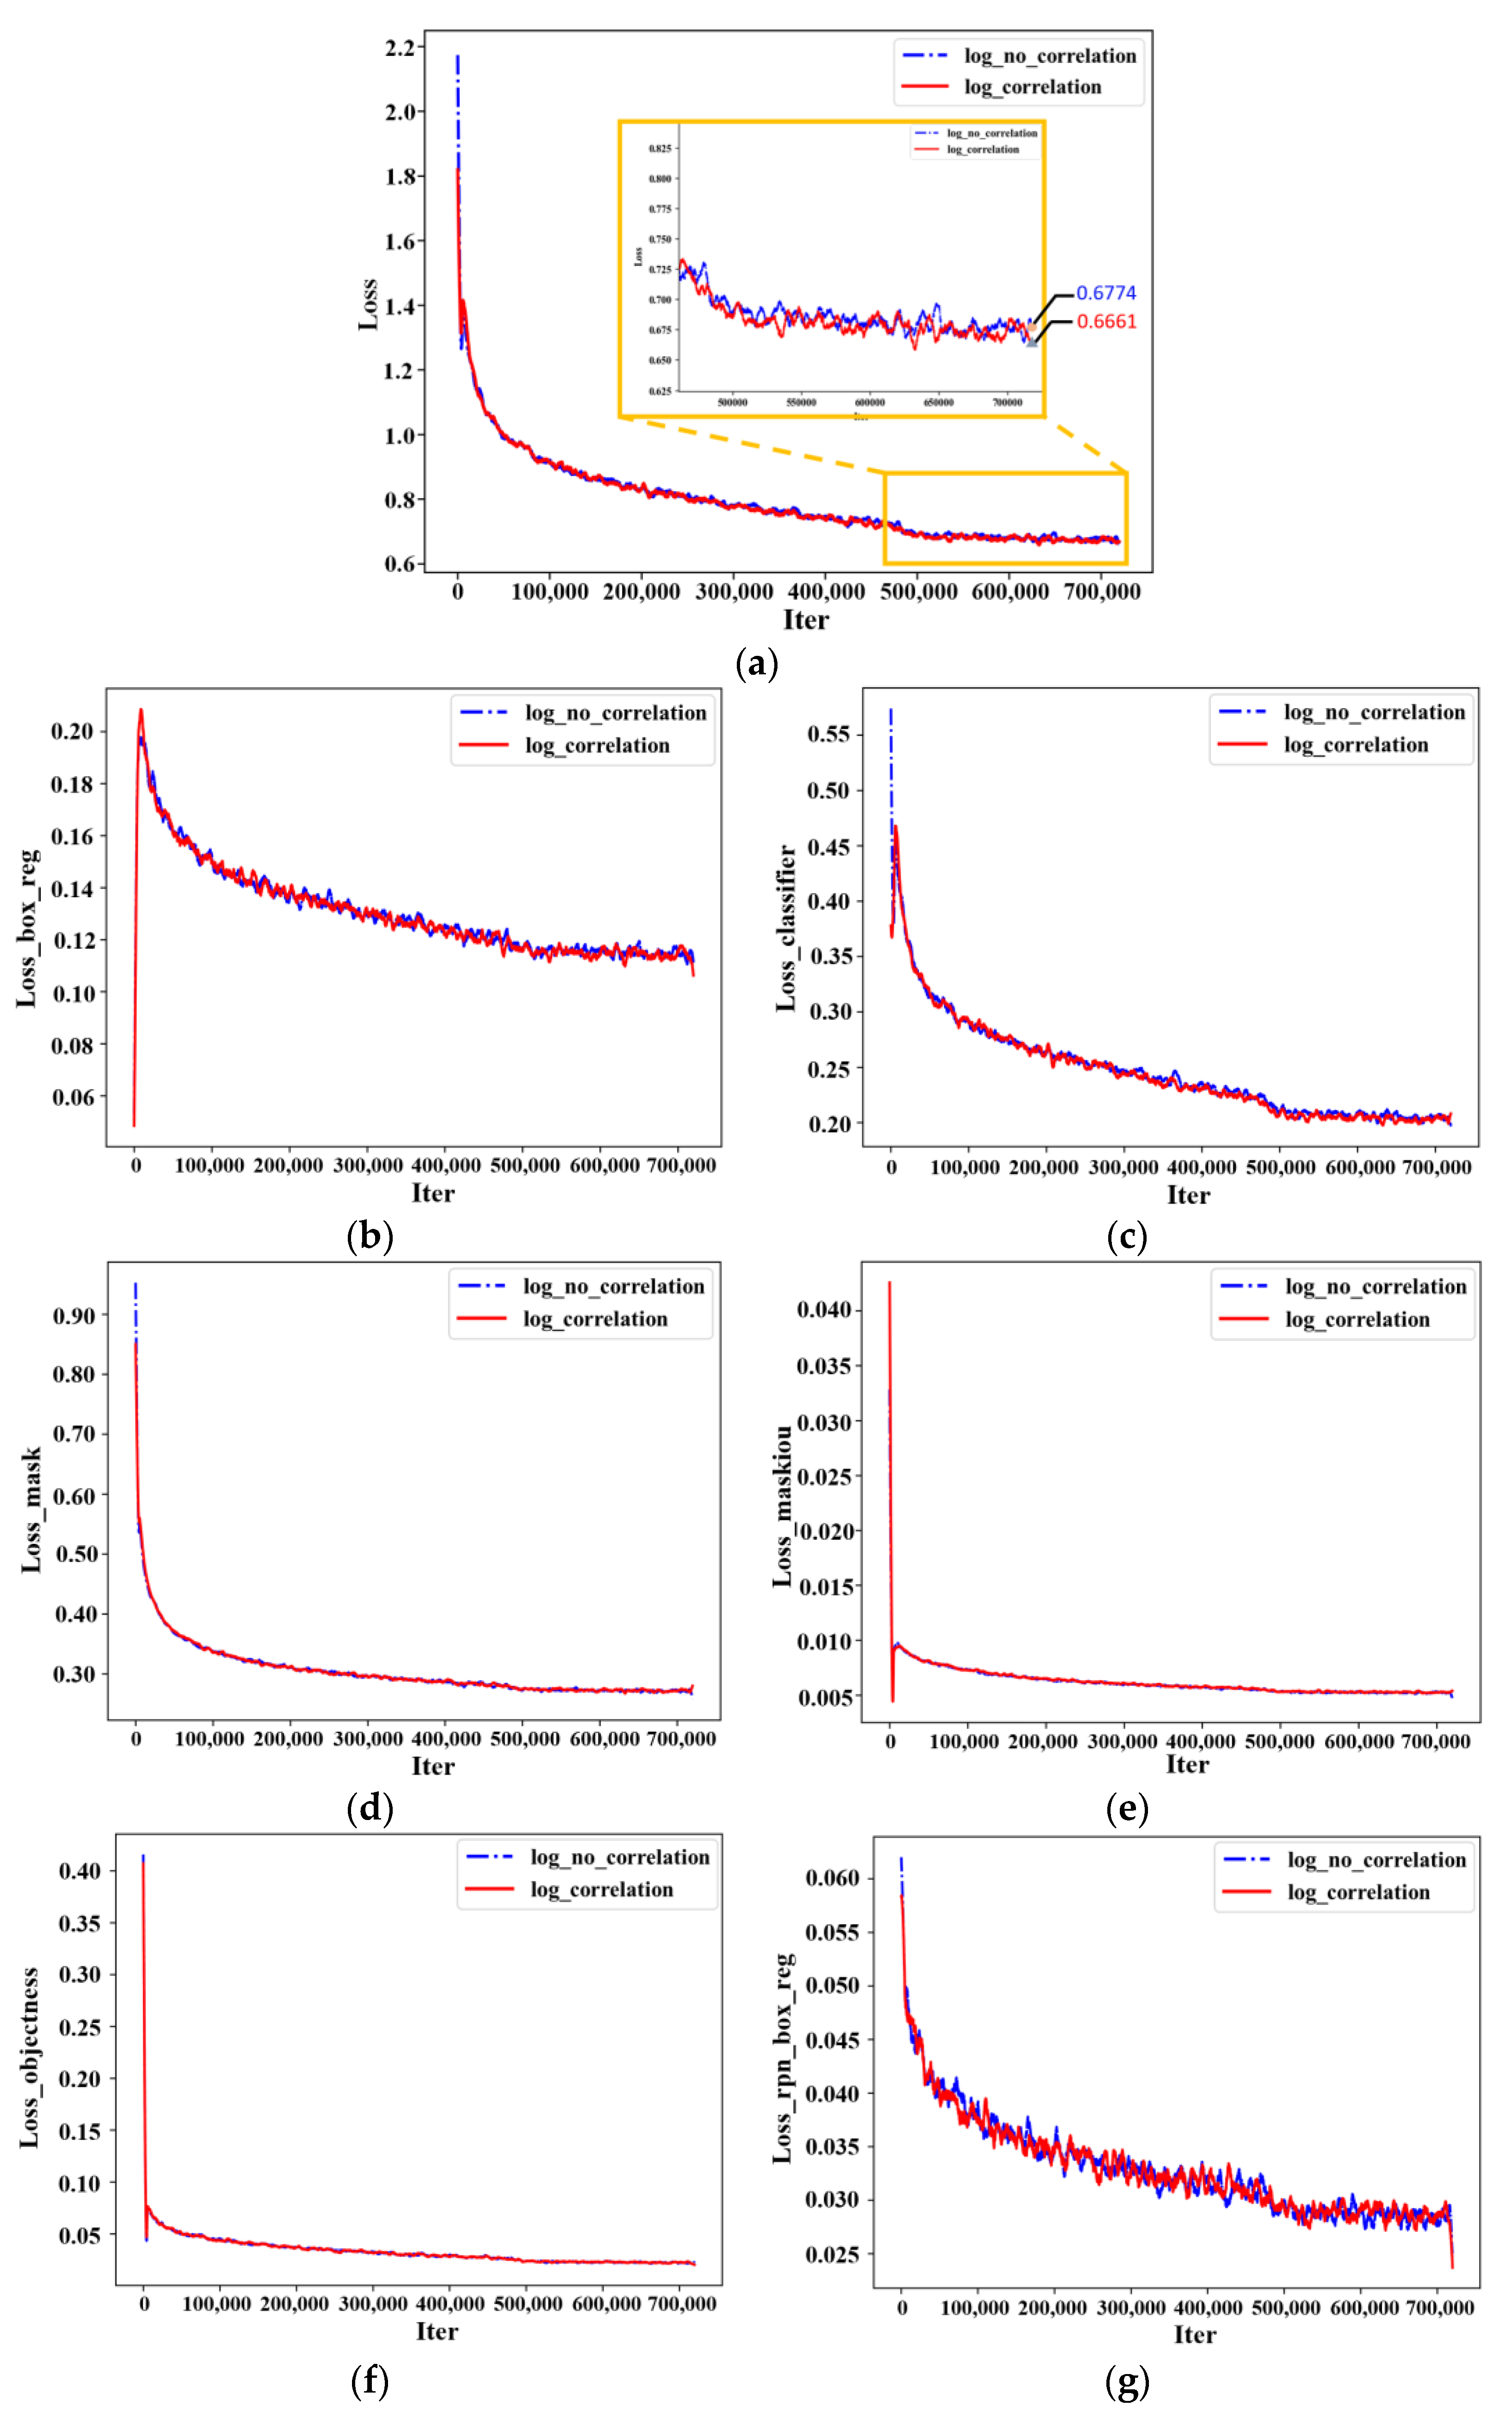
4.2. Training Details

The device utilized in the experiment was as follows: the CPU model was Intel Xeon Silver 4110 with 16 GB memory, and the GPU model was GeForce RTX 2080Ti with 11 G memory. Ubuntu 18 was used as the operating system and Python 3.6 was used as the programming language. The deep learning framework was Pytorch 1.0 with CUDA version 10.0 and CuDNN version 7.6.5.
The number of training rounds was set to 100,000 and 720,000 with a batch size of two, a learning rate of 0.0002, a momentum of 0.9 and a weight decay of 0.0001. The optimization algorithm adopted was SGD.

4.3. Evaluation Metrics

In computer vision, IoU is usually used to measure the positioning accuracy of the predicted box obtained by the model. In object detection, the YOLO algorithms use Box IoU to calculate the overlap between the ground-truth rectangular box and the predicted rectangular box. In instance segmentation, the evaluation object is no longer a rectangular box but a polygon mask, so the MaskIoU is used to calculate the overlap between the ground-truth mask (GM) and the predicted mask (PM). As shown in Figure 7, the red polygon box is the GM, and the blue polygon box is the PM obtained by the model. The MaskIoU is calculated as follows:
MaskIoU = GM PM GM PM
We determined whether an object has been correctly detected by setting an IoU threshold α for MaskIoU and setting a confidence threshold T for the confidence score. The values of T and α are both between 0 and 1. The confidence score indicates the probability that the bounding box contains the target, so T is set to filter out duplicate bounding boxes. By changing the value of T from 0 to 1, the precision-recall curve can be obtained for subsequent evaluation metrics calculation. The IoU threshold α is set to determine if the PM is correct. Generally, α is set to 0.5, 0.75, etc. The higher the IoU threshold, the higher the overlap degree between the PM and GM is required. Table 2 lists the criteria for determining True Positive (TP), False Positive (FP) and False Negative (FN).
After obtaining the numbers of TP, FP and FN, the precision, recall and mean average precision (mAP) can be calculated. The precision is the proportion of Z positive samples predicted correctly among all N positive samples predicted by the model. The calculation formula is as follows:
precision = Z N = TP TP + FP
The Recall is the proportion of Z positive samples predicted correctly among all M positive samples under actual conditions. The calculation formula is as follows:
recall = Z M = TP TP + FN
The AP is the average precision for a single class. It is obtained by computing the area under the interpolated precision-recall curve:
AP = i = 1 n 1   r i + 1 r i p interp r i + 1
r i represents the recall from the first interpolation of the precision interpolation segment in ascending order.
The A P 50 and A P 75 indicate the AP at IoU thresholds of 0.5 and 0.75, respectively. A P S , A P M and A P L represent the AP for object bounding boxes with small sizes (pixel areas less than 32 2 ), medium sizes (pixel areas between 32 2 and 96 2 ) and large sizes (pixel areas larger than 96 2 ), respectively.
The mAP calculates the average of the AP for all classes. It combines the precision and recall of the detection results. Therefore, we used mAP as the key performance indicator, and its formula is as follows:
mAP = i = 1 S   A P i K
where S is the class number of objects.

4.4. Experimental Results and Analysis

4.4.1. Experiments on the Self-Built Dataset for Irregular Deformable Objects

In order to solve the problem of difficult detection of deformable objects in power operation, this paper is in cooperation with the grid corporation to achieve accurate and real-time intelligent power safety monitoring. To test the proposed deformable object segmentation method based on the multi-instance relation weighting module and MS R-CNN, 449 deformable object images were randomly selected from the self-built dataset as the validation set with three types of objects, including “Safety belt”, “Seine” and “Human”.
Some visualization results of instance segmentation are presented in Figure 8. Figure 8 shows a comparison of the segmentation results between the proposed method and the unaltered MS R-CNN. As shown in Figure 8b,d, the unaltered MS R-CNN failed to detect the safety belt worn by the construction personnel working at high altitudes on the electric pole in the lower left corner of the image, demonstrating the difficulty of segmentation caused by the irregular deformable objects. In contrast, the proposed method can detect the safety belt well as shown in Figure 8a,c. Furthermore, both of these methods can segment construction personnel, but the proposed method is more accurate in edge segmentation of construction personnel, while the unaltered MS R-CNN cannot segment the limbs of the workers, making it incomplete. Overall, the proposed method can well segment deformable objects in different complex scenes and improve the segmentation accuracy of commonplace objects.
The segmentation accuracy and the detection accuracy of the bounding box on the self-built irregular deformable object dataset for power operation scenes are shown in Table 3 and Table 4. All models used ResNet50-FPN as the backbone network with 100,000 training rounds. To verify the effectiveness of data augmentation, we set up an additional set of experiments to train the proposed method with the training set without data augmentation (1896 images) denoted as “WDA”. The training set used in the rest of the experiments was 17,064 images after data augmentation. The experimental results show that the detection performance obtained by training the model using a data-augmented training set is superior in all aspects to that obtained by training using a non-augmented training set. It indicates that data augmentation can improve the generalization ability of the model for small sample datasets, thereby enhancing instance segmentation performance.
Then, we compare the performance of the three instance segmentation algorithms on the self-built dataset. It can be seen that compared with the Mask R-CNN, the bounding box mAP and segmentation mAP of the unaltered MS R-CNN improved by 1.7% and 1.4%, respectively. After adding the multi-instance relation weighting module in the MS R-CNN, the bounding box mAP and segmentation mAP improved by 1.2% and 0.2%, respectively, compared with the unaltered MS R-CNN. In addition, in terms of the small object detection accuracy, the bounding box AP S of the proposed method improved by 3.4% compared with the unaltered MS R-CNN, and the segmentation A P S improved by 0.2%.
Because the MaskIoU head enables MS R-CNN to obtain a more reasonable mask scoring mechanism than the Mask R-CNN, the detection accuracy and the segmentation accuracy achieved by the MS R-CNN are higher than those of the Mask R-CNN. The model based on the multi-instance relation weighting module has high accuracy because this module includes the relation features in each object which is equivalent to adding contextual relations between objects, thereby improving segmentation accuracy.
To further verify the effectiveness of our method and reduce the variability of experimental results, we conducted experiments using five-fold cross-validation on our self-built dataset. The obtained mAPs are shown in Table 5 and Table 6. In the five-fold cross-validation experiments, the average bounding box mAP and segmentation mAP of our proposed method were 38.3% and 38.1%, respectively, both higher than those of Mask R-CNN and unaltered MS R-CNN. Additionally, the standard deviations of our proposed method’s mAPs in the five-fold cross-validation were within 1%, indicating a low overall degree of overfitting and reliable credibility as well as a certain generalization ability to effectively perform instance segmentation for irregular objects in the electric power operation scene.
In addition, the segmentation accuracy and the bounding box detection accuracy of the proposed method were obtained under different training rounds. The detection results for 100,000 training rounds and 720,000 training rounds were compared as shown in Table 7 and Table 8. When the training rounds were 720,000, the segmentation mAP of the model reached 44.8%, 7.6% higher than that when the training rounds were 100,000. Therefore, the model did not converge when the training rounds were 100,000. The detection accuracy can continue to improve by increasing the training rounds, indicating that there is still significant room for improvement in the detection performance. The model has generally converged after 720,000 rounds, but there is still room for a slight improvement. Considering the cost of time, it is a reasonable choice to stop training at 720,000 rounds.

4.4.2. Experiments on the COCO Dataset

In order to better verify the generality and generalization of the proposed method, we compared the proposed method with the unaltered MS R-CNN in the COCO public dataset. ResNet-50 FPN and ResNet-101 FPN were used as the backbone network with 720,000 training rounds. The comparison experiment was divided into the training stage and the test stage.
In the training phase, the comparison of the loss function curves between the proposed method and the unaltered MS R-CNN is shown in Figure 9. The blue dashed line is the unaltered MS R-CNN, and the red solid line is the proposed method. Figure 9a shows that the total training loss of the proposed method is lower than that of MS R-CNN. As shown in Figure 9b–g, other losses, such as bounding-box regression loss and classification loss, of the proposed method also steadily decrease which proves that the model is gradually converging to reach the best performance parameters.
The multi-instance relation weighting module added in the MS R-CNN combines the relations between deformable objects for recognition and adds relative geometric features to measure the relative position of deformable objects. The relative position relation between objects helps the perception of deformable objects to be detected. The multi-instance relation weighting module maps the relation between objects to multiple different spaces for calculation rather than just one space so as to improve the diversity of features.
The experimental results using different backbone networks on the COCO dataset are shown in Table 9 and Table 10. When the backbone network was ResNet50-FPN, the bounding box mAP of the proposed method was 30.6% which was 0.1% higher than that of the unaltered MS R-CNN. The A P 50 of the bounding box was increased by 0.4%. The A P S of the bounding box for small objects increased by 0.7%. The segmentation mAP was improved by 0.1% compared to the unaltered MS R-CNN, reaching 29.2%. The segmentation A P 50 was improved by 0.3%. When the backbone feature extraction network was ResNet-101-FPN, the bounding box mAP and segmentation mAP of the proposed method were further improved, reaching 40.1% and 37.5%, respectively. The detection accuracy of small objects AP S was also improved to 17.7%.
In Table 10, we added the segmentation performance of the current mainstream instance segmentation algorithms to compare with the proposed method. It is obvious from the table that the instance segmentation method proposed in this paper has a high segmentation mAP. Meanwhile, the proposed method has higher AP S compared with other methods which indicates that the proposed method has obvious advantages for small object segmentation.
After adding the proposed multi-instance relation weighting module, the detection and segmentation accuracy of small objects has greatly improved, while the accuracy of large objects has slightly decreased. We think that the added module models the relationship between objects which helps to improve the detection and segmentation performance of small objects but sacrifices a portion of the accuracy of large objects. The instance segmentation algorithm proposed in this paper mainly targets irregular and deformable objects in power operations which are usually narrow and elongated. Therefore, the proposed algorithm performs well in detecting deformable objects. Since the proposed method is designed for deformable objects, its performance on the COCO dataset may not be impressive, but it is enough to demonstrate that the method has good generalization performance.

5. Intelligent Monitoring System for Power Operation Scenes

In order to further verify the generalization performance and practicability of the proposed instance segmentation method, an intelligent monitoring system for electric power operation scenes is developed in this paper based on the proposed deformable object segmentation method.

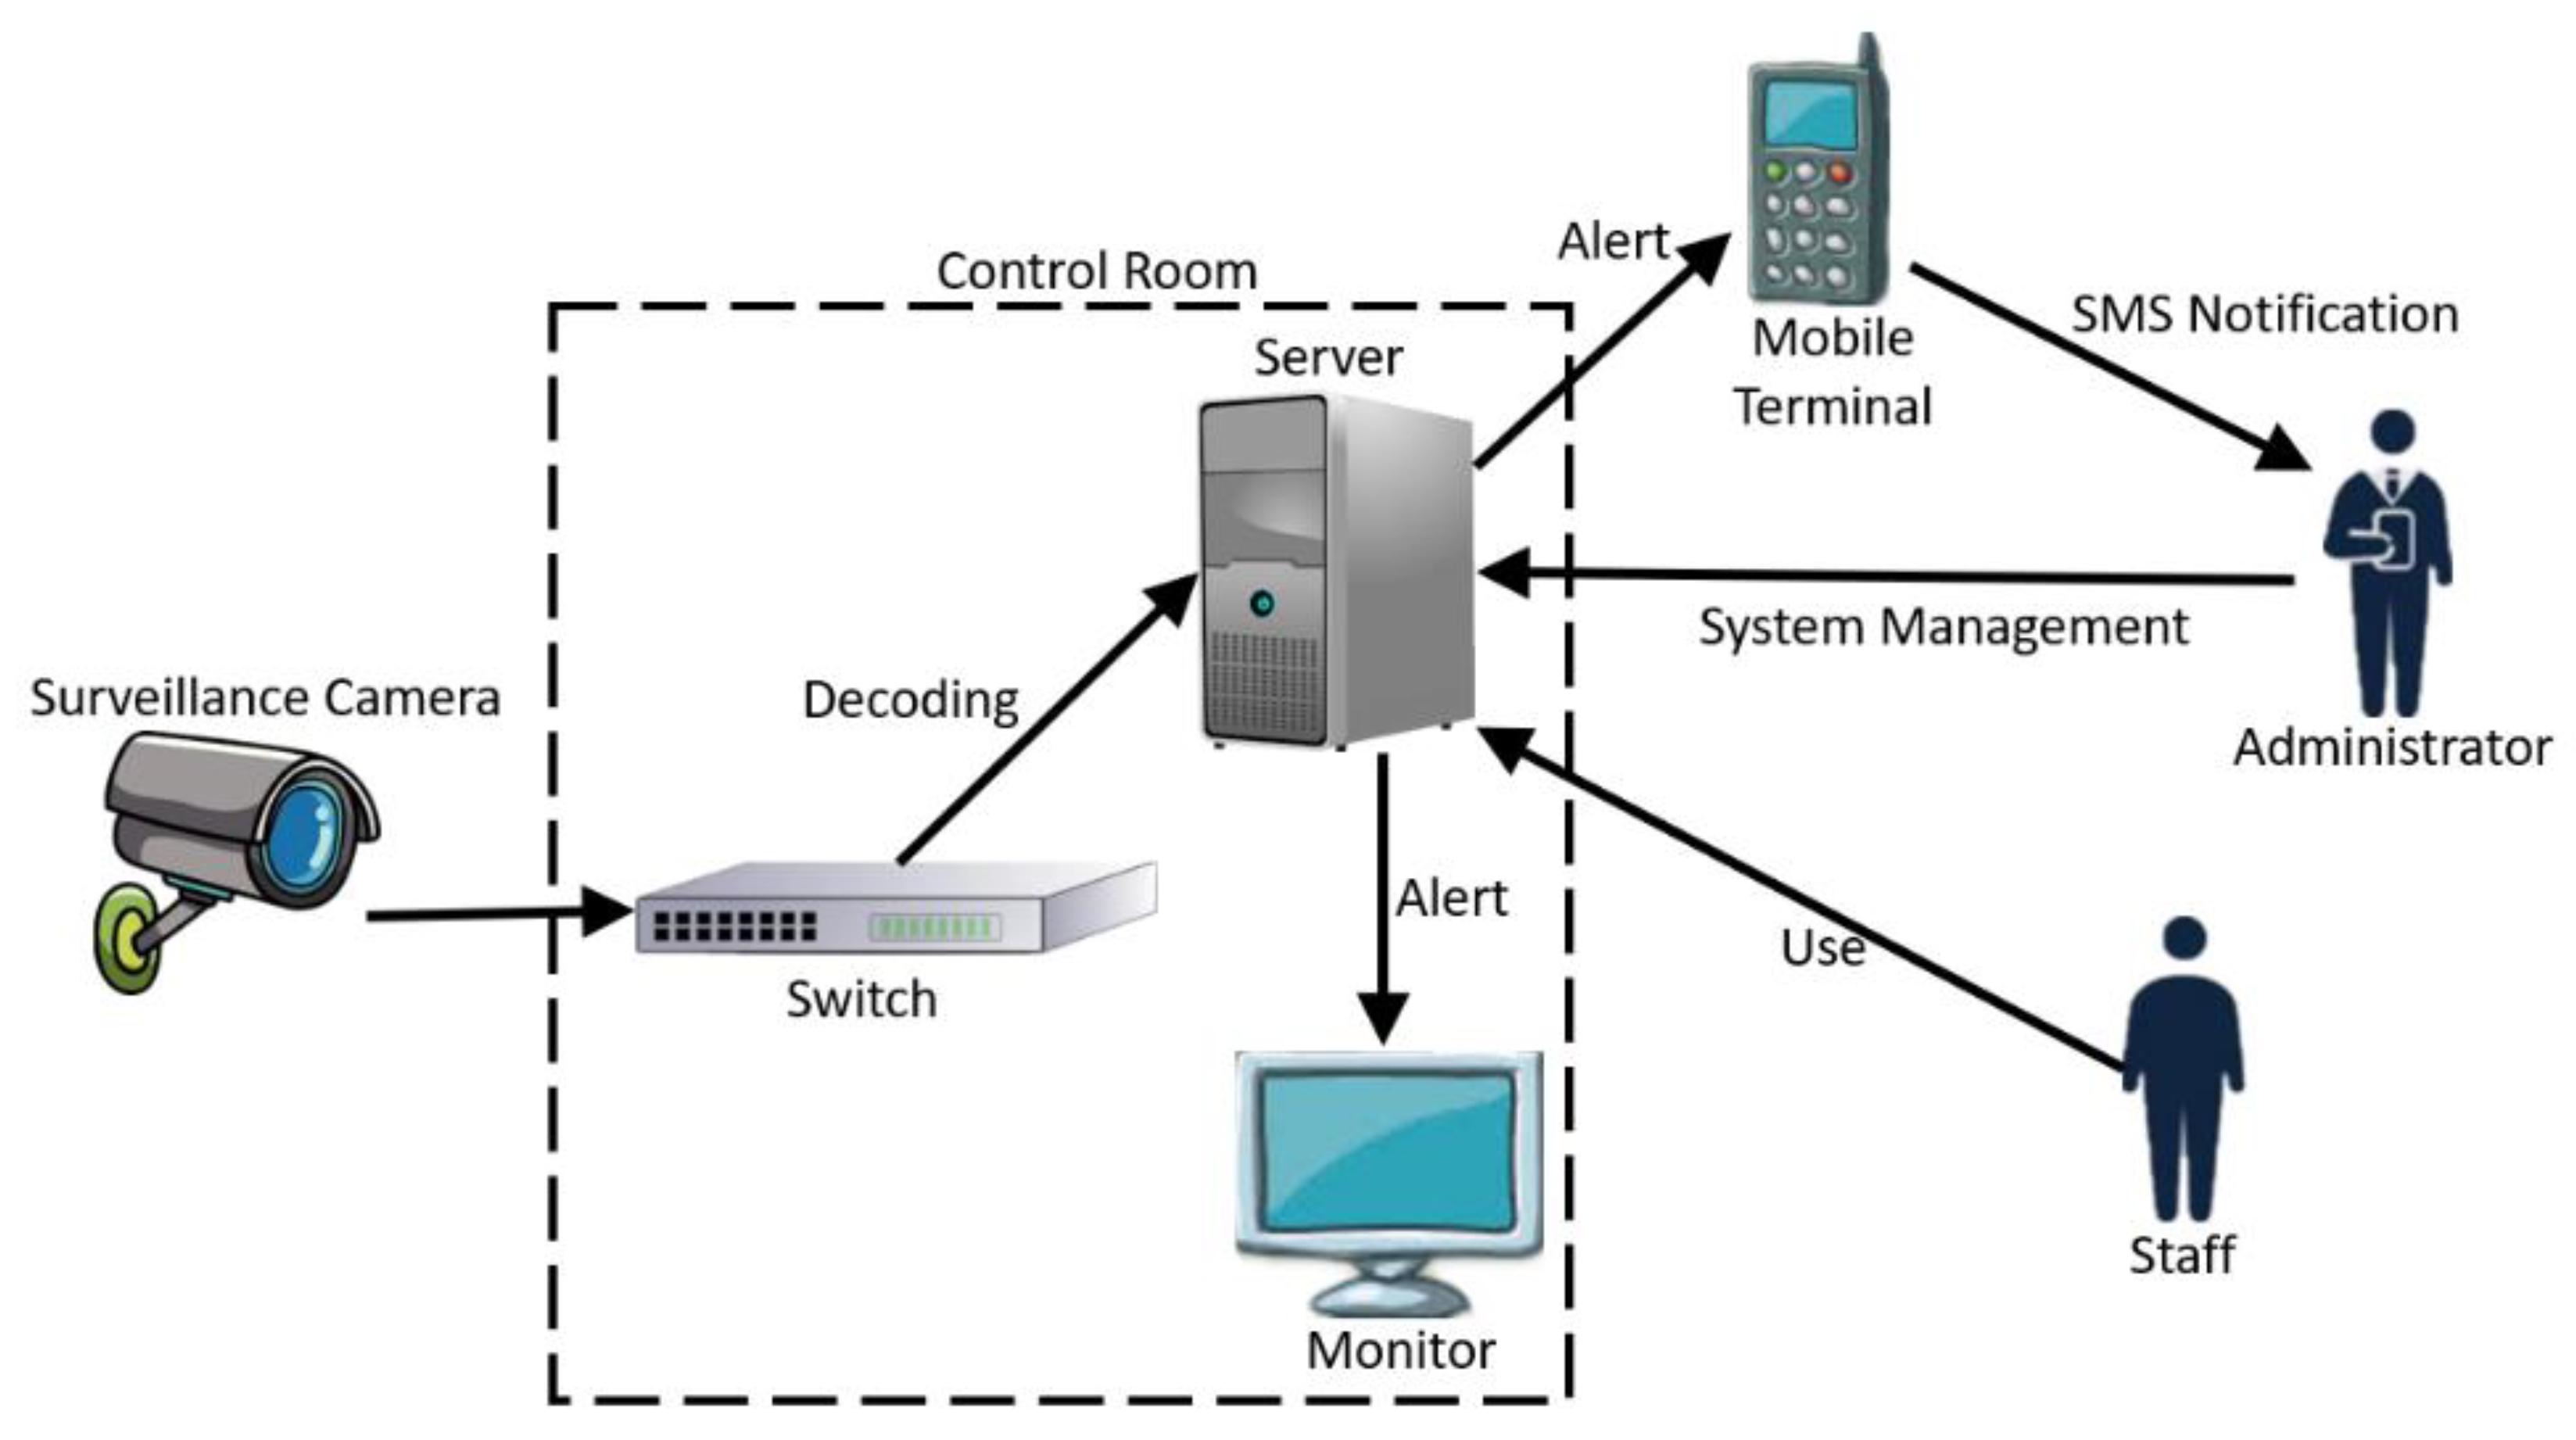
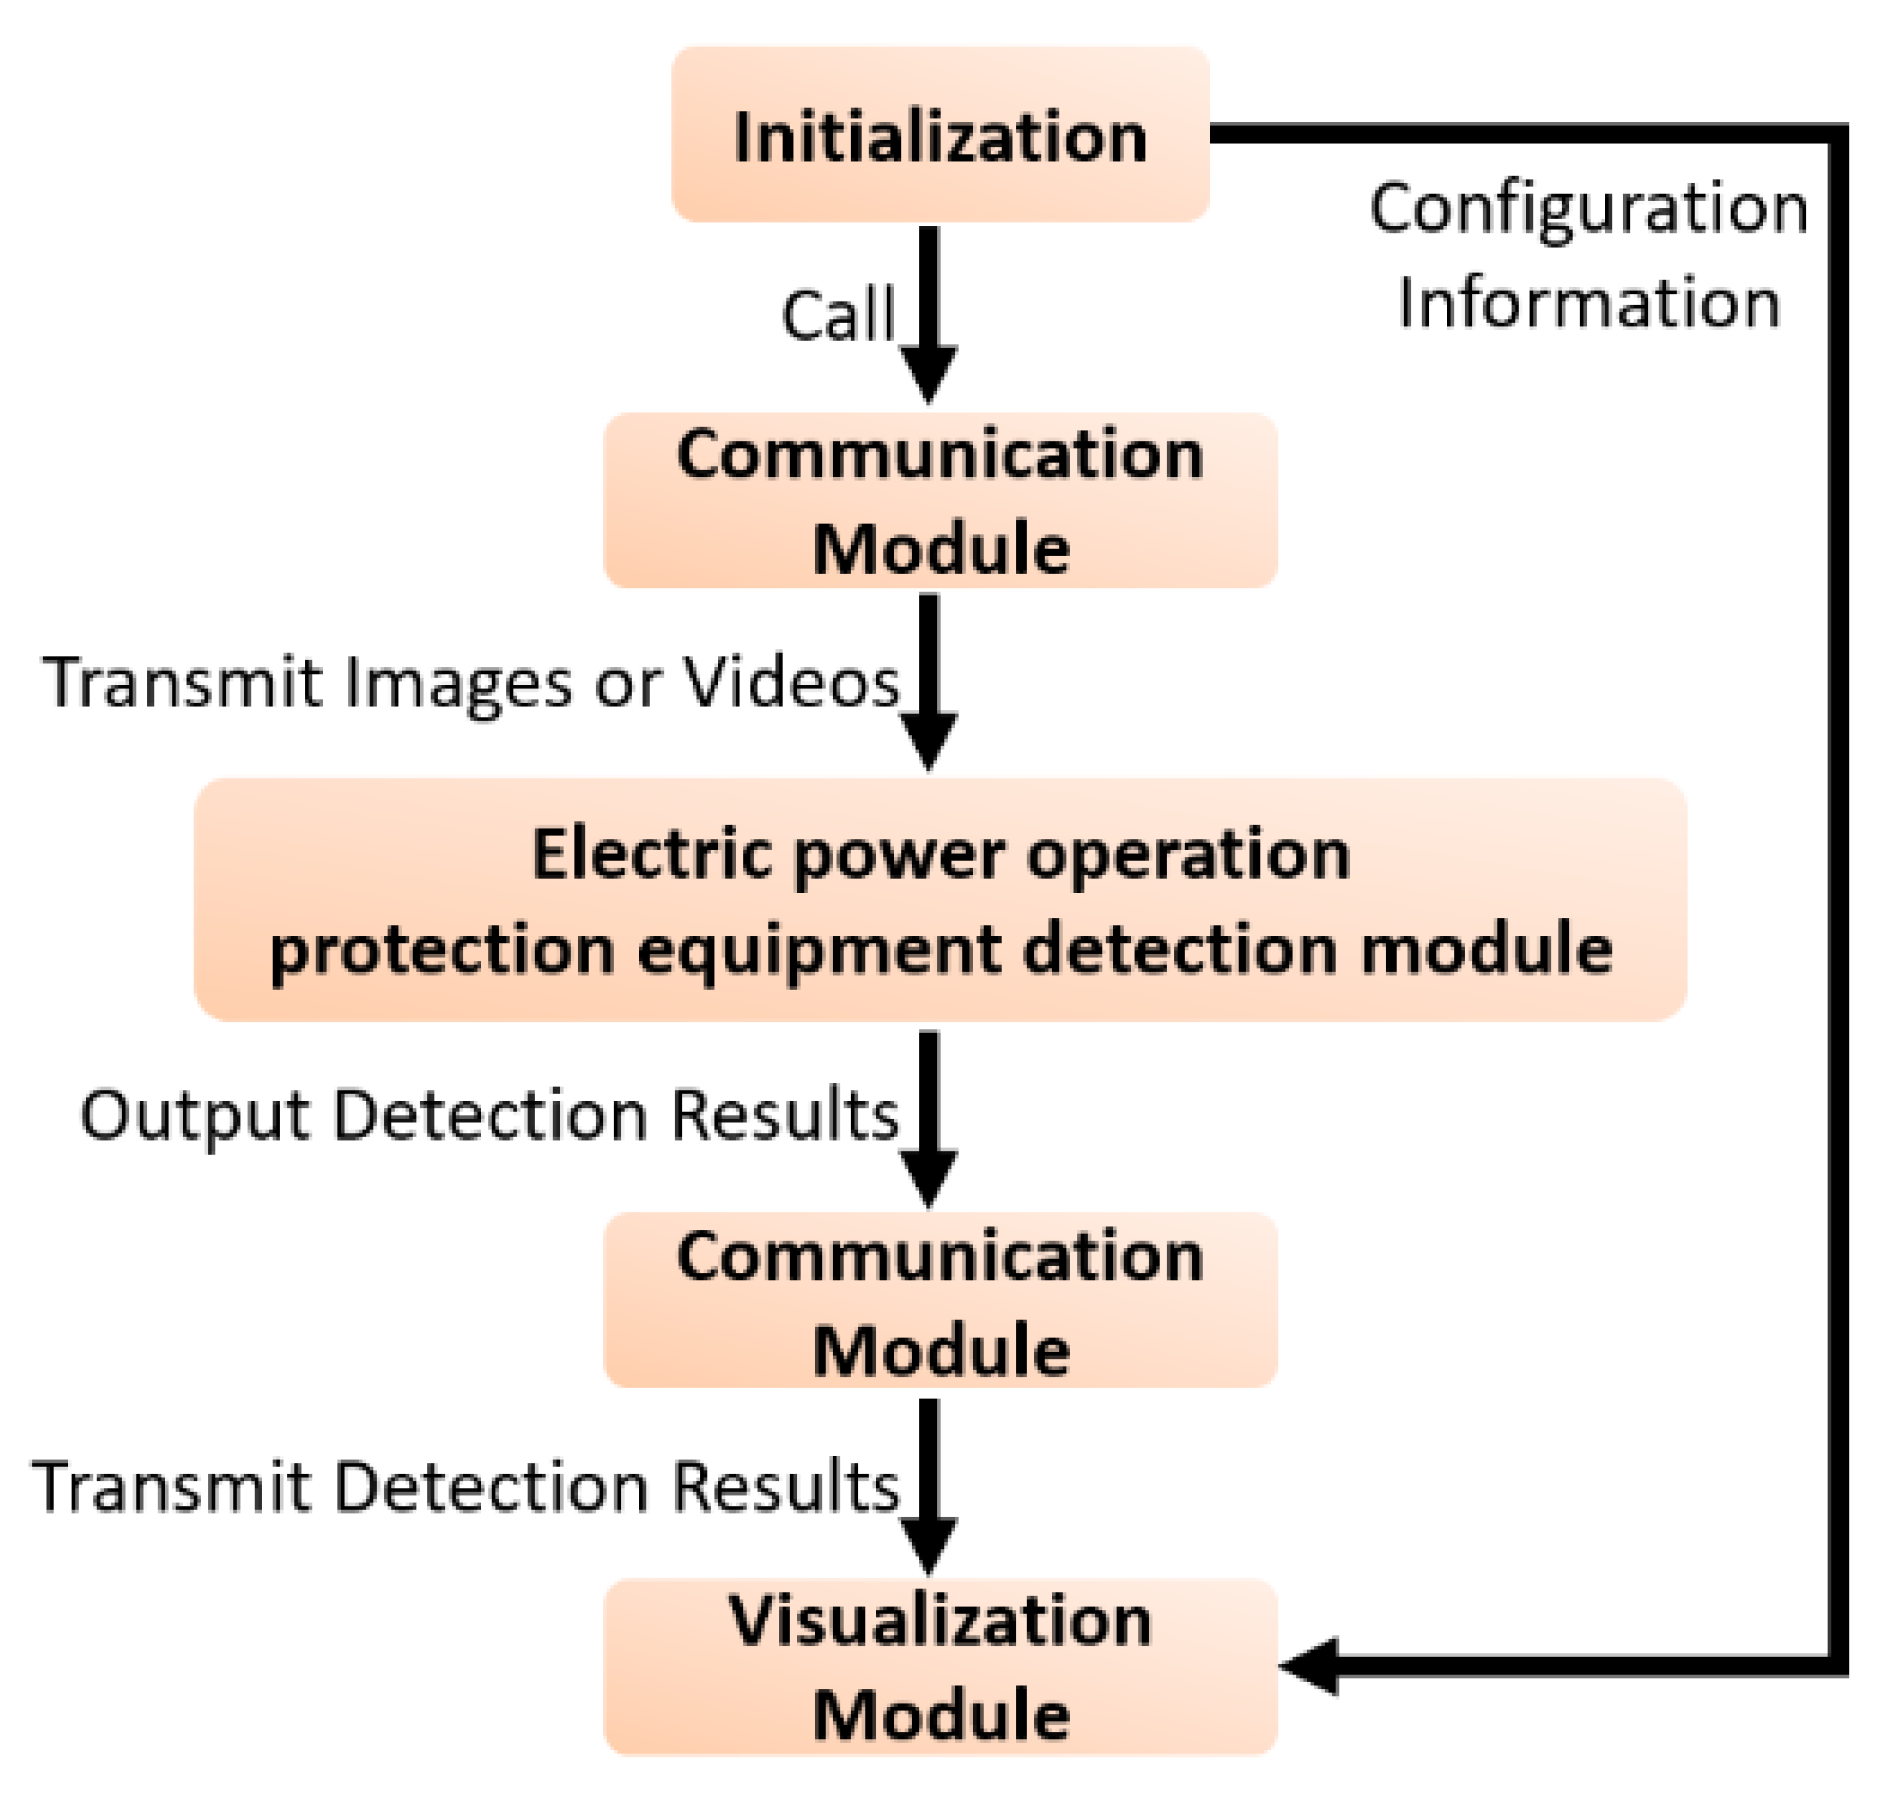
5.1. System Framework and Modular Design

By analyzing the intelligent monitoring requirements of substations [60] and the electric power safety work regulations, the intelligent monitoring system is designed for the electric power operation scenes as shown in Figure 10.
The system is deployed on a server equipped with GPU. The monitoring device transmits the collected electric power operation workplace video stream to the switch which decodes the video stream and transfers it to the server. Upon receiving the monitoring image, the server calls the proposed electric power operation protective equipment detection algorithm to recognize the images and returns the recognition results. When the system identifies workers not wearing safety helmets, not fastening safety belts during high-altitude operations or no protective seine set up at the electric power operation workplace, the server will issue an alarm message and notify the inspection personnel through text messages and flash the indicator light on the monitor.
The intelligent monitoring system is divided into three modules: the electric power operation protective equipment detection module, communication module and visualization module. Firstly, the communication module receives the videos or images; secondly, based on the current scene and detection requirements, the electric power operation protective equipment detection module analyzes the transmitted images to obtain the detection results. Then, the detection results are transmitted to the monitoring center via the communication module. The monitoring center saves the detection results and makes corresponding warning operations according to the violation information. Finally, the visualization module combines the image data and detection results to display the real-time monitoring image and detection results in a visual form. The calling process of each functional module of the system is shown in Figure 11.

5.1.1. Electric Power Operation Protection Equipment Detection Module

The electric power operation protection equipment detection module uses the instance segmentation method proposed in this paper to detect whether personnel are wearing and placing protective equipment. The detection accuracy has a crucial impact on the monitoring results of the system. The detection results include the device ID number of the current surveillance camera, the segmentation mask coordinates [ x 1 ,   y 1 ,   x 2 ,   y 2 , ] of the violators and the violation type (not wearing a safety helmet, not fastening a safety belt, not set up a safety seine, etc.). Screenshots of violations will be stored in a specified folder, and the name of the screenshot is composed of the current date and the shooting time of the camera, making it convenient for safety monitoring personnel to review it later.

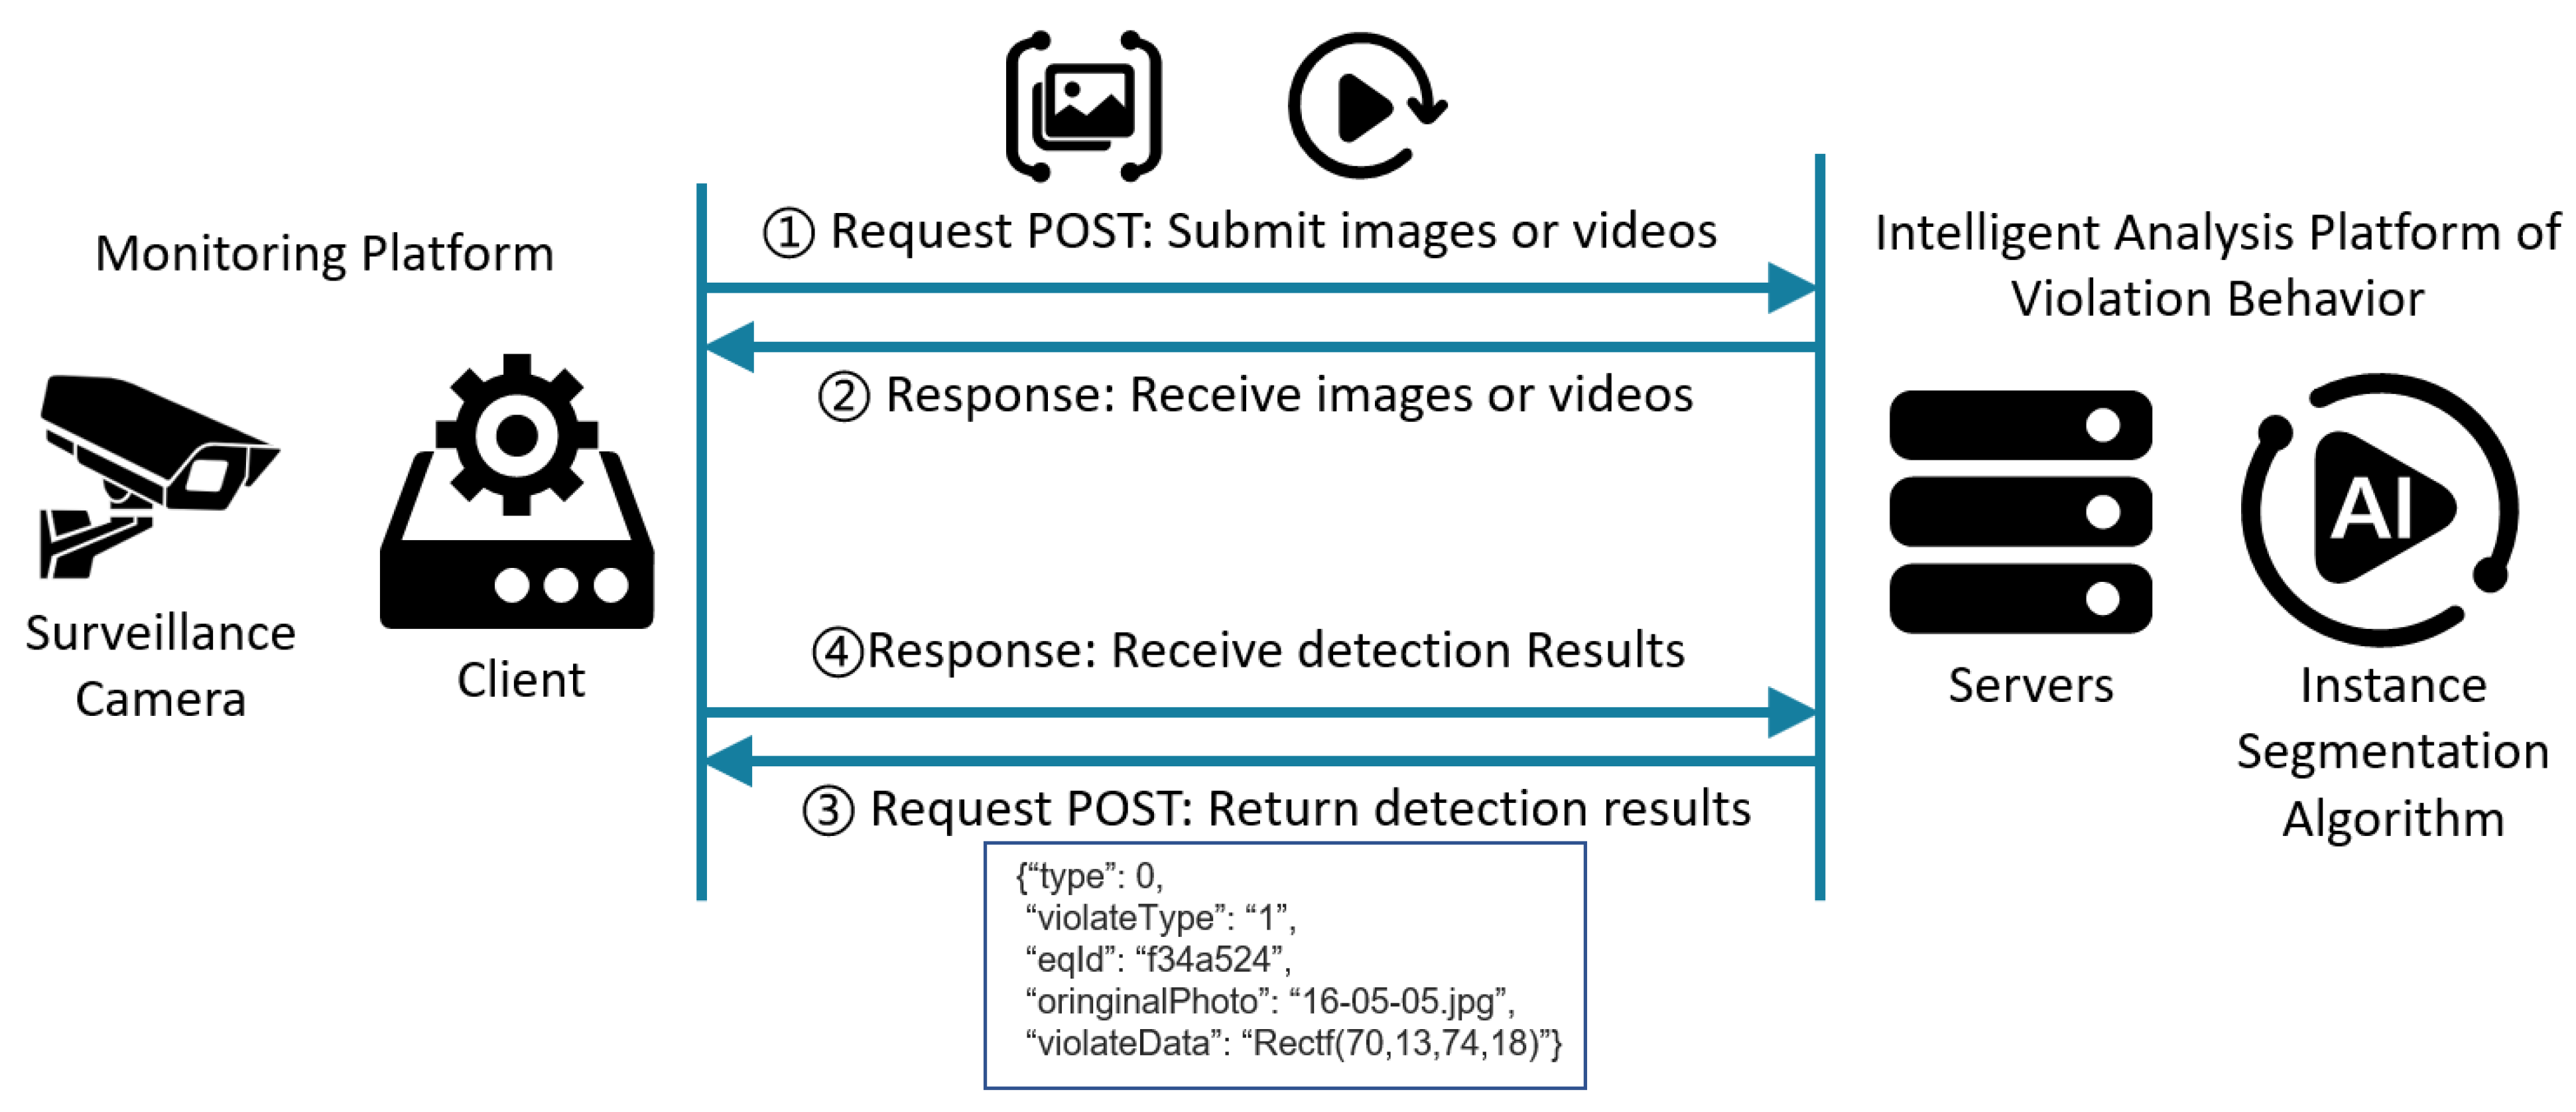
5.1.2. Communication Module

The communication module is used to implement the transmission of images and video files as well as the detection results. The module adopts Flask as the backend system development framework. The trained instance segmentation model is deployed on the WEB end to realize intelligent monitoring, and the API interface is designed for the client to display. Any program that follows the HTTP protocol can be used as the client. By calling the server interface with the TCP/IP network architecture and the request entity attached with images or videos, the server returns the detection results in the form of JSON data type to the client after receiving and processing the request.
As shown in Figure 12, the client sends a POST request and sends the images to the server through base64 encoding. The server interface passes the received images into the detection algorithm for analysis. If the detection results contain the violations, the detection information such as the coordinates of the violation target and the violation categories will be returned to the client as request parameters. The client can use the given target coordinates to segment the targets in the original images and obtain the segmentation results. In the process of video interface joint debugging, the client sends a POST request to the backend server in JSON format, including the URL address, file name, type and device ID of the video. The backend server downloads the video from the URL and passes the video to the analysis model for detection. After the detection is completed, the detection results are returned to the client in JSON format.

5.1.3. Visualization Module

The main function of the visualization module is to display real-time monitoring screens and detection results by combining the image and video data and detection information outputted by the communication module. The visualization interface is developed and designed using the OpenCV and PyQt5 modules under Python, mainly including the display of monitoring videos and images, detection results as well as violation alarm records. The interface design of the visualization module is shown in Figure 13. Through the system detection screen provided by this visualization module, the detection results of violations can be presented more intuitively.

5.2. System Function Realization and Test

The system uses the proposed instance segmentation method to detect whether personnel are wearing and placing protective equipment. Therefore, the detection accuracy has a crucial impact on the monitoring results of the system, and it is necessary to test the instance segmentation method from multiple aspects of this system.

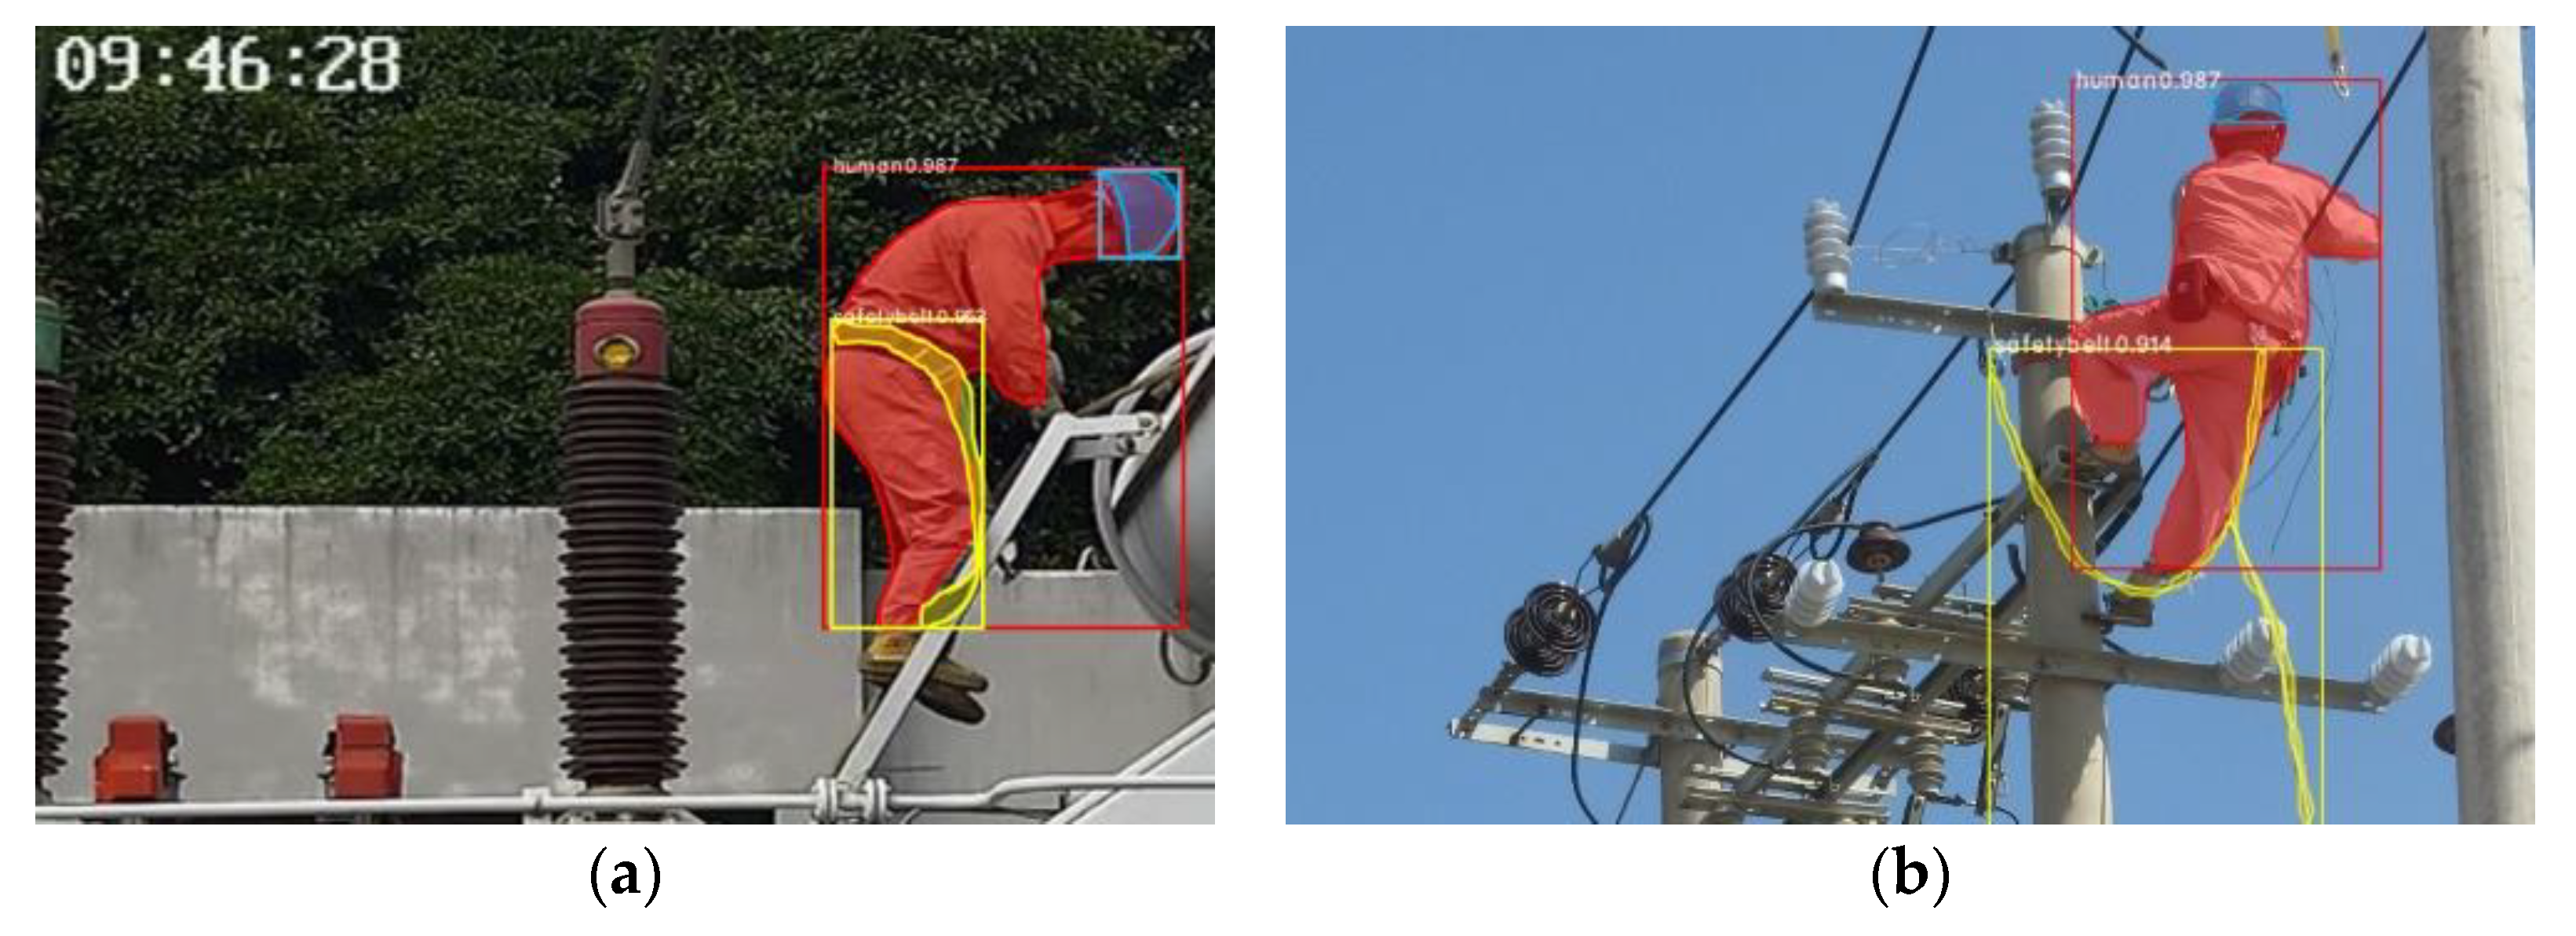
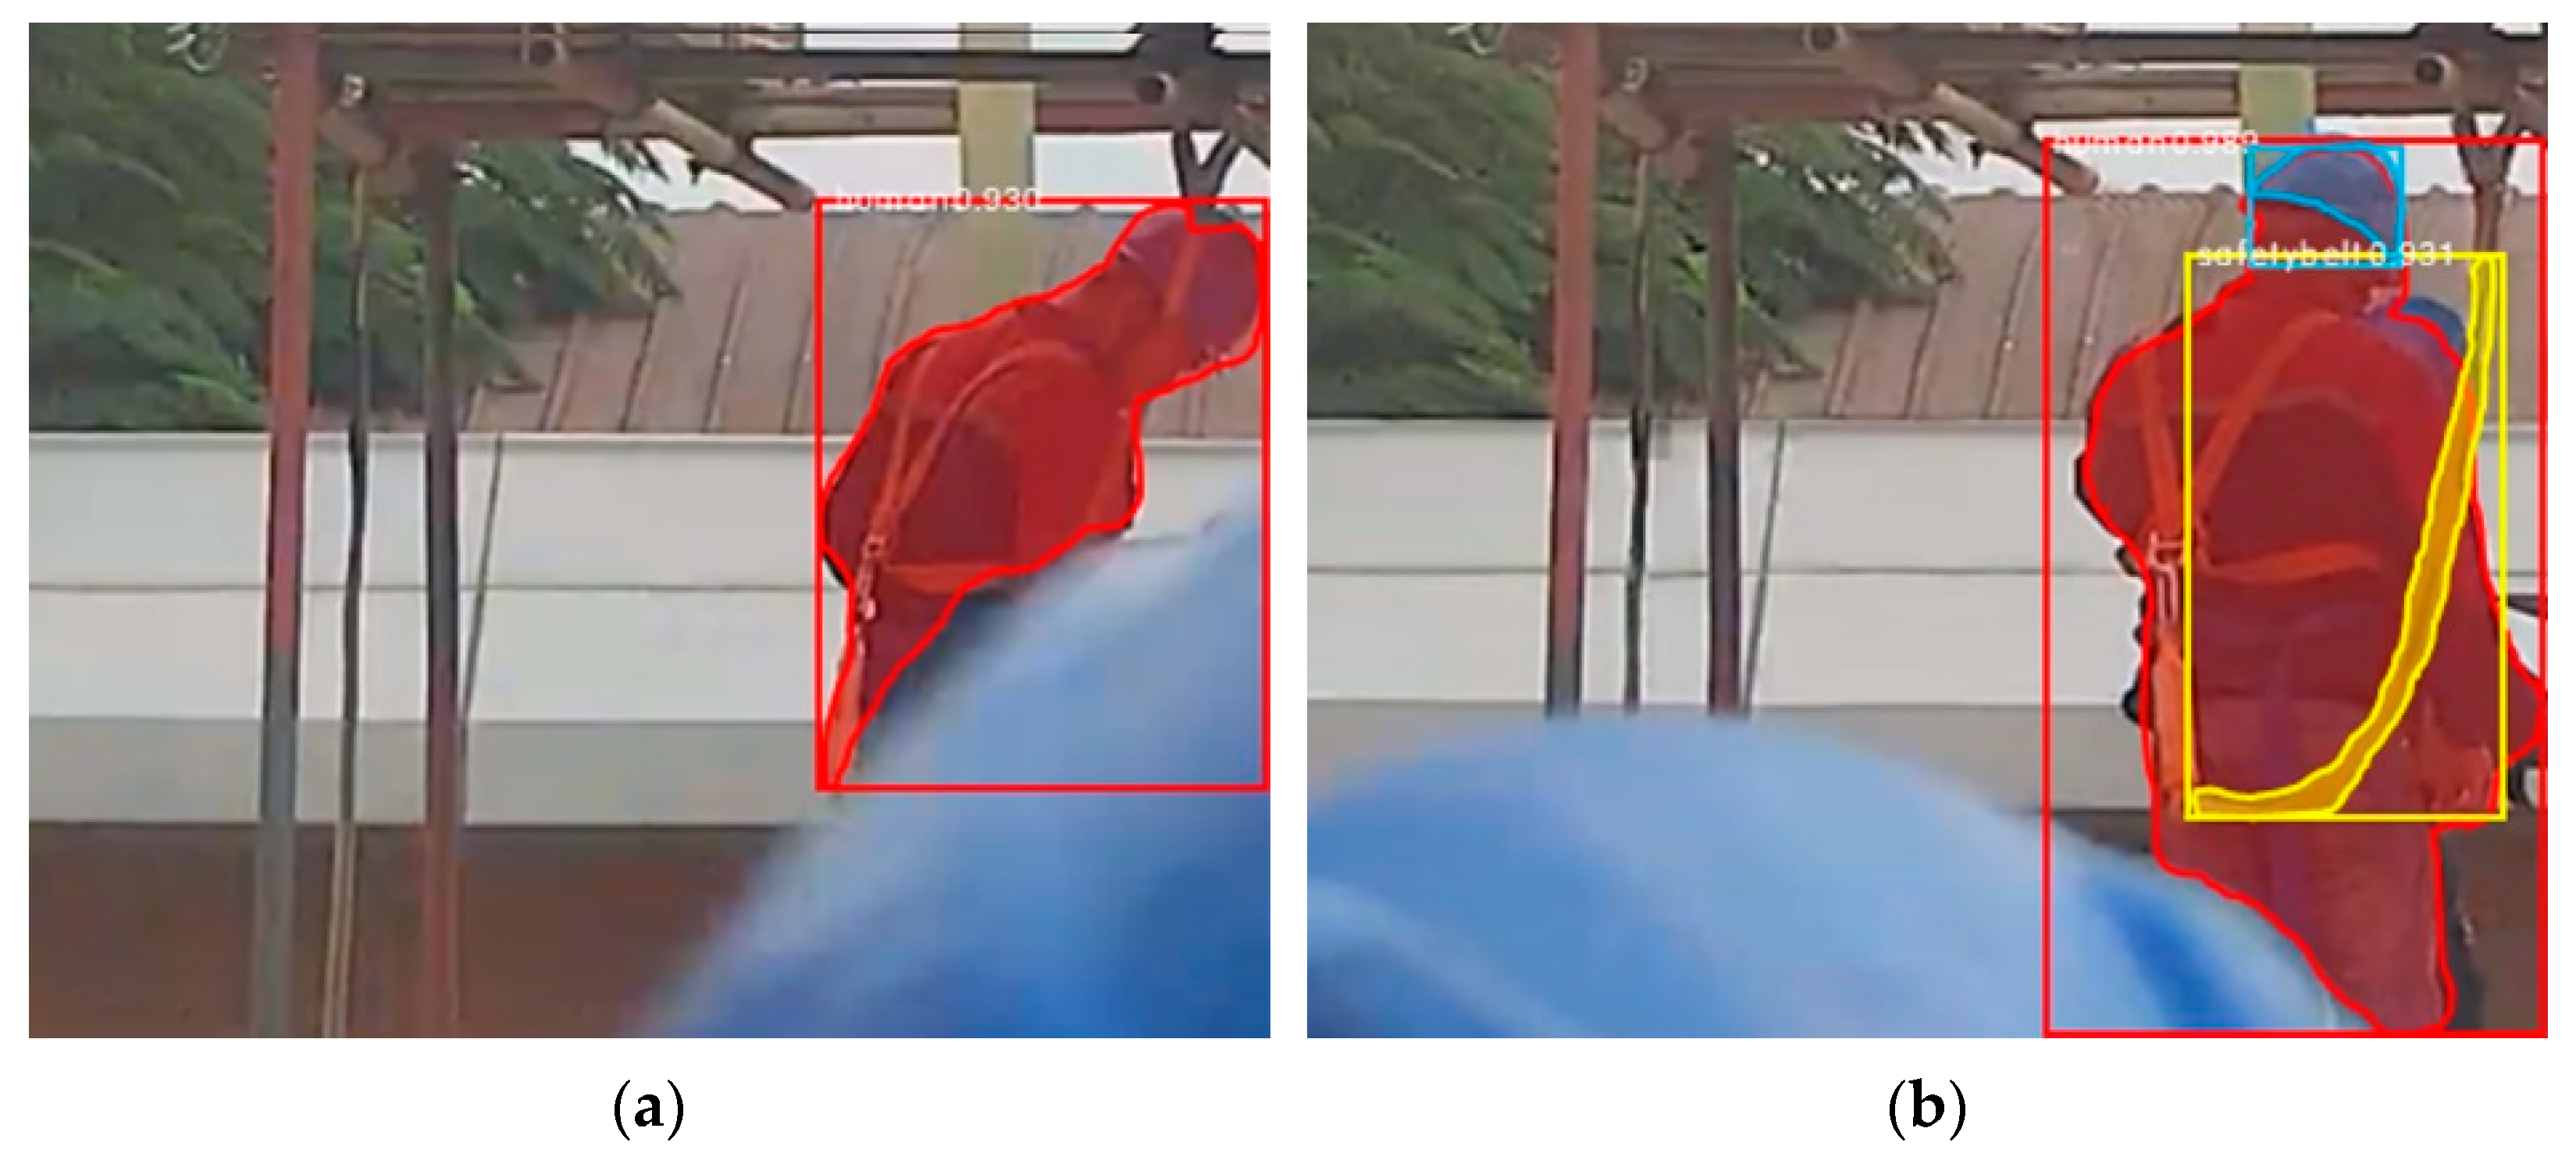
5.2.1. Detection from Different Perspectives

Since the monitoring cameras are installed in different positions of the substations and construction scenes, the possible location of construction personnel is random. Therefore, the construction personnel will present different shapes in the monitoring video.
When the camera is installed at a height, the view angle is overlooking and the upper body of the construction personnel occupies a larger area in the image. When the camera is installed at a low place, the view angle is upward, and the lower body of the construction personnel occupies a larger area. As shown in Figure 14, the intelligent monitoring system can segment construction personnel and electric power operation protection equipment well from different perspectives.

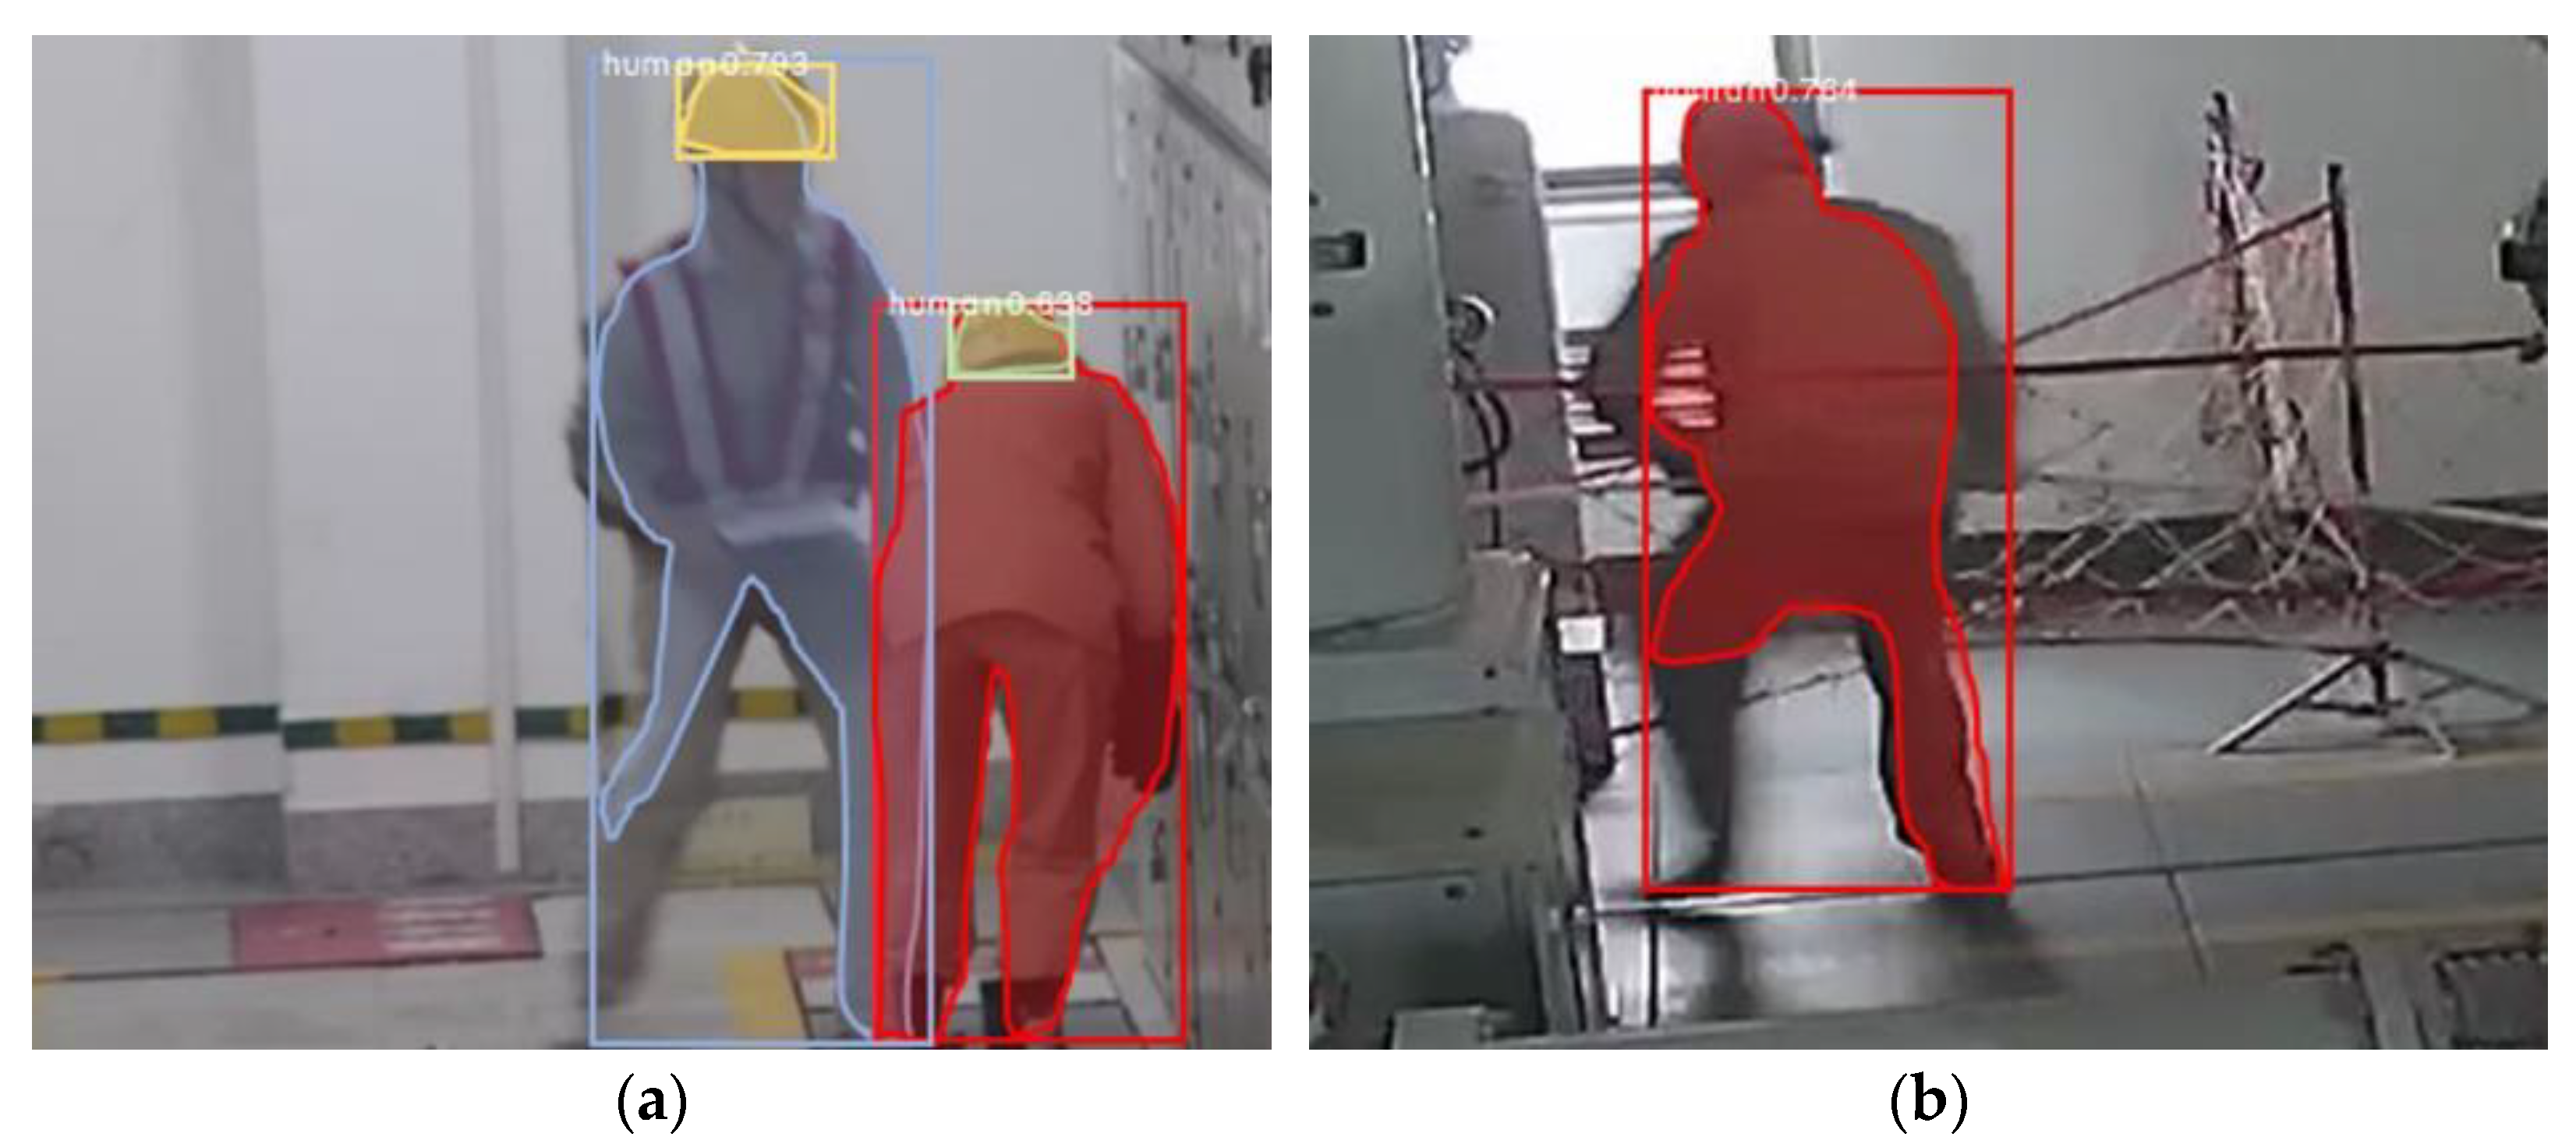
5.2.2. Detection for Indoor and Outdoor Scenes

The intelligent monitoring system can not only be applied to indoor scenes but also to outdoor scenes. The detection background of indoor scenes is relatively simple, but personnel may overlap in limited space. The detection background of outdoor scenes will be much more complex with a large number of other objects, such as power poles, cables, and trees, which can easily cause problems, such as obstruction, misjudgment, and missed detection of the objects, to be detected. In outdoor scenes, the objects to be detected may be far away from the camera which brings difficulties in detecting small objects. As shown in Figure 15, the system can segment personnel, helmets and seines in the complex background.

5.2.3. Detection for Different Working Height

To avoid falling accidents, construction personnel must wear safety belts when working at heights, so the detection of safety belts is very important. However, because the area of the safety belt in the picture is small, the appearance of the safety belt is prone to change and it is easy to mistake the wire and cable, which are also irregular deformable objects, for the safety belt during detection. Therefore, the detection of safety belts is very difficult. The detection result is shown in Figure 16. The system can segment safety belts well.

5.2.4. Detection for Different Light and Weather

In outdoor scenes, natural conditions will significantly affect the quality of monitoring videos and pictures. For example, the light will become darker in the early morning or evening, the picture will be blurred on foggy days and the camera will get wet on rainy days. As shown in Figure 17, the system can detect construction personnel and protection equipment under different lighting conditions and weather, indicating that the designed system has strong adaptability under different natural conditions.

5.2.5. The Real-Time Detection

The system designed in this paper can achieve real-time detection of protective equipment. As shown in Figure 18, the input is a video sequence, and the system can detect safety helmets and safety belts in the input video, realizing real-time perception of the safety situation of power operation.

5.2.6. System Problems and Solutions

The proposed irregular deformable object instance segmentation method is applicable to multiple scenes and has strong anti-interference ability and robustness. The intelligent monitoring system can be used to detect whether the construction personnel in the monitoring video wear and place the protective equipment correctly so as to ensure the safety of the construction personnel. However, there are three issues in the practical application that make detection difficult: motion blur, target occlusion and network and transmission instability affecting video quality.
When objects move too quickly in monitoring videos, motion blur often occurs which affects the normal recognition and segmentation of the objects. As shown in Figure 19, the fast movement of construction personnel can lead to blurred edges of the human body contour, making it difficult to accurately measure the boundaries and size of the target. Moreover, the detailed information of the target in the blurred image is also blurred, and feature extractors often fail to extract this information correctly, resulting in reduced segmentation accuracy. To address the motion blur problem, we used data augmentation to simulate the blurring of monitoring videos by adding Gaussian noise, salt-and-pepper noise, etc. This increases the diversity and robustness of images and enhances the algorithm’s ability to detect edges in images by deforming and warping images to increase data diversity.
Moving occlusion often occurs in monitoring videos, blocking the target from being detected. The detector cannot detect the target correctly which affects the performance of the whole detection task. As shown in Figure 20, when a safety belt is occluded by a helmet, the features of the occluded part of the safety belt cannot be extracted which results in failure detection. Currently, we do not have an effective solution to this problem, and we can only perform correct detection of the target after the occlusion object has moved away from the video frame.
In reality, network connectivity can occasionally experience fluctuations, delays and other instabilities, and data centers may not be able to process large amounts of data in a timely manner, resulting in unstable video transmissions, such as stuttering, distortion and blurring, as shown in Figure 21. The system cannot obtain complete image data which results in failed detection. To address the instability of network connectivity and transmission, network optimization can be carried out, such as increasing bandwidth and allocating more resources to improve network stability. Additionally, using more efficient image compression and encoding technologies can reduce bandwidth usage and packet loss during image transmission, thereby improving transmission stability. Real-time monitoring of network status and transmission performance should also be carried out so that appropriate measures can be taken immediately to address issues, such as transmission distortion.

6. Conclusions

In order to address the challenges of detecting irregular deformable objects in power operation workplace safety monitoring, an end-to-end instance segmentation method using the multi-instance relation weighting module for irregular deformable objects is proposed in this paper. The Mask Scoring R-CNN is used for pixel-level instance segmentation so that the bounding box can accurately surround the deformable objects without containing redundant background information. The multi-instance relation weighting module is designed for modeling the mutual relations between each object by fusing the appearance features and the geometric features of the objects in the images. The proposed method achieved a segmentation mAP of 44.8% on the self-built dataset of irregular deformable objects for electric power operation workplaces. Compared to MS R-CNN, the bounding box mAP and segmentation mAP increased by 1.2% and 0.2%, respectively, with the same 100,000 training rounds. The small object segmentation AP S improved by 0.2% which proved that the proposed method is also effective for small object detection in electric power operation workplaces. The segmentation accuracy of the proposed method on the COCO dataset was also improved which proved the generalization performance of the method.
Finally, an intelligent monitoring system for electric power operation scenes is designed for verifying the generalization performance and practicability of the instance segmentation method by a variety of pictures and videos in different scenes and perspectives. The results showed that the system using the proposed instance segmentation method can effectively separate the construction personnel and the electric power operation protection equipment from different perspectives and different weather conditions.
This work promotes the progress of irregular deformable object detection and intelligent monitoring for power operation scenes which has a good application prospect. In the future, we will further lightweight the algorithm to facilitate practical deployment and application, and further study the improvement of real-time detection of the algorithm.

Author Contributions

Conceptualization, W.C. and L.S.; methodology, X.C.; software, W.C.; validation, X.C., W.C. and Z.L.; formal analysis, W.C.; investigation, Z.L.; resources, Z.L.; data curation, Z.L.; writing—original draft preparation, W.C.; writing—review and editing, L.S.; visualization, W.C.; supervision, T.L.; project administration, L.S.; funding acquisition, L.S. All authors have read and agreed to the published version of the manuscript.

Funding

This research was funded by the National Natural Science Foundation of China under Grant No. 61903315 and the Natural Science Foundation of the Department of Science and Technology of Fujian Province under Grant No. 2022J011255; in part by the Foundation for Science and Technology Cooperation Program of Longyan under Grant No. 2020LYF16004.

Data Availability Statement

The data presented in this study are available on request from the corresponding author.

Acknowledgments

We thank all reviewers for their comments and Fujian Xiamen State Grid Corporation for the photos of power operation workplace.

Conflicts of Interest

The authors declare no conflict of interest.

References

  1. Ali, S.S.; Choi, B.J. State-of-the-Art Artificial Intelligence Techniques for Distributed Smart Grids: A Review. Electronics 2020, 9, 1030. [Google Scholar] [CrossRef]
  2. Hu, Q.; Bai, Y.; He, L.; Huang, J.; Wang, H.; Cheng, G. Workers’ Unsafe Actions When Working at Heights: Detecting from Images. Sustainability 2022, 14, 6126. [Google Scholar] [CrossRef]
  3. Oliveira, B.A.S.; Neto, A.P.D.F.; Fernandino, R.M.A.; Carvalho, R.F.; Fernandes, A.L.; Guimaraes, F.G. Automated Monitoring of Construction Sites of Electric Power Substations Using Deep Learning. IEEE Access 2021, 9, 19195–19207. [Google Scholar] [CrossRef]
  4. Chen, S.; Tang, W.; Ji, T.; Zhu, H.; Ouyang, Y.; Wang, W. Detection of Safety Helmet Wearing Based on Improved Faster R-CNN. In Proceedings of the 2020 International Joint Conference on Neural Networks (IJCNN), Glasgow, UK, 19–24 July 2020; pp. 1–7. [Google Scholar]
  5. Chen, B.; Wang, X.; Bao, Q.; Jia, B.; Li, X.; Wang, Y. An Unsafe Behavior Detection Method Based on Improved YOLO Framework. Electronics 2022, 11, 1912. [Google Scholar] [CrossRef]
  6. Sharma, A.; Sharma, V.; Jaiswal, M.; Wang, H.C.; Jayakody, D.N.K.; Basnayaka, C.M.W.; Muthanna, A. Recent Trends in AI-Based Intelligent Sensing. Electronics 2022, 11, 1661. [Google Scholar] [CrossRef]
  7. Saponara, S.; Elhanashi, A.; Gagliardi, A. Real-time Video Fire/Smoke Detection Based on CNN in Antifire Surveillance Systems. J. Real Time Image Process. 2021, 18, 889–900. [Google Scholar] [CrossRef]
  8. Mazhar, T.; Irfan, H.M.; Haq, I.; Ullah, I.; Ashraf, M.; Shloul, T.A.; Ghadi, Y.Y.; Elkamchouchi, D.H. Analysis of Challenges and Solutions of IoT in Smart Grids Using AI and Machine Learning Techniques: A Review. Electronics 2023, 12, 242. [Google Scholar] [CrossRef]
  9. Wan, Z.; Chen, Y.; Deng, S.; Chen, K.; Yao, C.; Luo, J. Slender Object Detection: Diagnoses and Improvements. arXiv 2020, arXiv:2011.08529. [Google Scholar]
  10. Redmon, J.; Divvala, S.; Girshick, R.; Farhadi, A. You Only Look Once: Unified, Real-Time Object Detection. In Proceedings of the IEEE Conference on Computer Vision and Pattern Recognition (CVPR), Las Vegas, NV, USA, 27–30 June 2016; pp. 779–788. [Google Scholar]
  11. Redmon, J.; Farhadi, A. YOLO9000: Better, Faster, Stronger. In Proceedings of the IEEE Conference on Computer Vision and Pattern Recognition (CVPR), Honolulu, HI, USA, 21–26 July 2017; pp. 7263–7271. [Google Scholar]
  12. Redmon, J.; Farhadi, A. YOLOv3: An Incremental Improvement. arXiv 2018, arXiv:1804.02767. [Google Scholar]
  13. Bochkovskiy, A.; Wang, C.Y.; Liao, H.Y.M. YOLOv4: Optimal Speed and Accuracy of Object Detection. arXiv 2020, arXiv:2004.10934. [Google Scholar]
  14. Girshick, R. Fast R-CNN. In Proceedings of the IEEE International Conference on Computer Vision (ICCV), Santiago, Chile, 7–13 December 2015; pp. 1440–1448. [Google Scholar]
  15. Girshick, R.; Donahue, J.; Darrell, T.; Malik, J. Region-Based Convolutional Networks for Accurate Object Detection and Segmentation. IEEE Trans. Pattern Anal. Mach. Intell. 2015, 38, 142–158. [Google Scholar] [CrossRef] [PubMed]
  16. Ren, S.; He, K.; Girshick, R.; Sun, J. Faster R-CNN: Towards Real-Time Object Detection with Region Proposal Networks. IEEE Trans. Pattern Anal. Mach. Intell. 2017, 39, 1137–1149. [Google Scholar] [CrossRef]
  17. Rabbi, J.; Ray, N.; Schubert, M.; Chowdhury, S.; Chao, D. Small-Object Detection in Remote Sensing Images with End-to-End Edge-Enhanced GAN and Object Detector Network. Remote Sens. 2020, 12, 1432. [Google Scholar] [CrossRef]
  18. Wang, J.; Song, L.; Li, Z.; Sun, H.; Sun, J.; Zheng, N. End-to-End Object Detection with Fully Convolutional Network. In Proceedings of the IEEE/CVF Conference on Computer Vision and Pattern Recognition (CVPR), Nashville, TN, USA, 20–25 June 2021; pp. 15849–15858. [Google Scholar]
  19. Shakya, S. Analysis of Artificial Intelligence Based Image Classification techniques. J. Innov. Image Process. 2020, 2, 44–54. [Google Scholar] [CrossRef]
  20. Gu, W.; Bai, S.; Kong, L. A Review on 2D Instance Segmentation Based on Deep Neural Networks. Image Vis. Comput. 2022, 120, 104401. [Google Scholar] [CrossRef]
  21. Bolya, D.; Zhou, C.; Xiao, F.; Lee, Y.J. YOLACT: Real-Time Instance Segmentation. In Proceedings of the IEEE/CVF International Conference on Computer Vision (ICCV), Seoul, Republic of Korea, 29–31 October 2019; pp. 9157–9166. [Google Scholar]
  22. Xie, E.; Sun, P.; Song, X.; Wang, W.; Liu, X.; Liang, D.; Shen, C.; Luo, P. PolarMask: Single Shot Instance Segmentation with Polar Representation. In Proceedings of the IEEE/CVF Conference on Computer Vision and Pattern Recognition (CVPR), Seattle, WA, USA, 13–19 June 2020; pp. 12193–12202. [Google Scholar]
  23. Cai, J.; Li, Y. Realtime Single-Stage Instance Segmentation Network Based on Anchors. Comput. Electr. Eng. 2021, 95, 107464. [Google Scholar] [CrossRef]
  24. He, K.; Gkioxari, G.; Dollár, P.; Girshick, R. Mask R-CNN. In Proceedings of the IEEE International Conference on Computer Vision (ICCV), Venice, Italy, 22–29 October 2017; pp. 2961–2969. [Google Scholar]
  25. Cheng, T.; Wang, X.; Huang, L.; Liu, W. Boundary-Preserving Mask R-CNN. In Proceedings of the Computer Vision–ECCV 2020: 16th European Conference (ECCV), Glasgow, UK, 23–28 August 2020; pp. 660–676. [Google Scholar]
  26. Shen, X.; Yang, J.; Wei, C.; Deng, B.; Huang, J.; Hua, X.S.; Cheng, X.; Liang, K. Dct-mask: Discrete Cosine Transform Mask Representation for Instance Segmentation. In Proceedings of the IEEE/CVF Conference on Computer Vision and Pattern Recognition (CVPR), Nashville, TN, USA, 20–25 June 2021; pp. 8720–8729. [Google Scholar]
  27. Yu, J.; Yao, J.; Zhang, J.; Yu, Z.; Tao, D. SPRNet: Single-Pixel Reconstruction for One-Stage Instance Segmentation. IEEE Trans. Cybern. 2020, 51, 1731–1742. [Google Scholar] [CrossRef]
  28. Cao, D.; Chen, Z.; Gao, L. An Improved Object Detection Algorithm Based on Multi-Scaled and Deformable Convolutional Neural Networks. Hum. Cent. Comput. Inf. Sci. 2020, 10, 14. [Google Scholar] [CrossRef]
  29. Bhattacharjee, S.D.; Mittal, A. Part-Based Deformable Object Detection with a Single Sketch. Comput. Vis. Image Underst. 2015, 139, 73–87. [Google Scholar] [CrossRef]
  30. Keipour, A.; Bandari, M.; Schaal, S. Deformable One-Dimensional Object Detection for Routing and Manipulation. arXiv 2022, arXiv:2201.06775. [Google Scholar] [CrossRef]
  31. Shi, P.; Chen, X.; Qi, H.; Zhang, C.; Liu, Z. Object Detection Based on Swin Deformable Transformer-BiPAFPN-YOLOX. Comput. Intell. Neurosci. 2023, 2023, 18. [Google Scholar] [CrossRef]
  32. Zhu, X.; Su, W.; Lu, L.; Li, B.; Wang, X.; Dai, J. Deformable DETR: Deformable Transformers for End-to-End Object Detection. arXiv 2020, arXiv:2010.04159. [Google Scholar]
  33. Fu, X.; Yuan, Z.; Yu, T.; Ge, Y. DA-FPN: Deformable Convolution and Feature Alignment for Object Detection. Electronics 2023, 12, 1354. [Google Scholar] [CrossRef]
  34. Zhou, X.; Zhuo, J.; Krahenbuhl, P. Bottom-Up Object Detection by Grouping Extreme and Center Points. In Proceedings of the IEEE/CVF Conference on Computer Vision and Pattern Recognition (CVPR), Long Beach, CA, USA, 16–17 June 2019; pp. 850–859. [Google Scholar]
  35. Wang, X.; Jiang, Y.; Luo, Z.; Liu, C.L.; Choi, H.; Kim, S. Arbitrary Shape Scene Text Detection with Adaptive Text Region Representation. In Proceedings of the IEEE/CVF Conference on Computer Vision and Pattern Recognition (CVPR), Long Beach, CA, USA, 16–17 June 2019; pp. 6449–6458. [Google Scholar]
  36. Yang, X.; Hou, L.; Zhou, Y.; Wang, W.; Yan, J. Dense Label Encoding for Boundary Discontinuity Free Rotation Detection. In Proceedings of the IEEE/CVF Conference on Computer Vision and Pattern Recognition (CVPR), Nashville, TN, USA, 20–25 June 2021; pp. 15819–15829. [Google Scholar]
  37. Qian, W.; Yang, X.; Peng, S.; Yan, J.; Guo, Y. Learning Modulated Loss for Rotated Object Detection. In Proceedings of the 35th AAAI Conference on Artificial Intelligence (AAAI), Virtual Conference, 2–9 February 2021; pp. 2458–2466. [Google Scholar]
  38. Foysal, M.; Hossain, A.B.M.; Yassine, A.; Hossain, M.S. Detection of COVID-19 Case from Chest CT Images Using Deformable Deep Convolutional Neural Network. J. Healthc. Eng. 2023, 2023, 4301745. [Google Scholar] [CrossRef]
  39. Fang, W.; Ding, L.; Luo, H.; Love, P.E. Falls from Heights: A Computer Vision-Based Approach for Safety Harness Detection. Autom. Constr. 2018, 91, 53–61. [Google Scholar] [CrossRef]
  40. Hu, H.; Gu, J.; Zhang, Z.; Dai, J.; Wei, Y. Relation Networks for Object Detection. In Proceedings of the IEEE Conference on Computer Vision and Pattern Recognition (CVPR), Salt Lake City, UT, USA, 18–22 June 2018; pp. 3588–3597. [Google Scholar]
  41. Oliva, A.; Torralba, A. The role of context in object recognition. Trends Cogn. Sci. 2007, 11, 520–527. [Google Scholar] [CrossRef]
  42. Ouyang, W.; Wang, X.; Zeng, X.; Qiu, S.; Luo, P.; Tian, Y.; Li, H.; Yang, S.; Wang, Z.; Loy, C.C.; et al. DeepID-Net: Deformable Deep Convolutional Neural Networks for Object Detection. In Proceedings of the IEEE Conference on Computer Vision and Pattern Recognition (CVPR), Boston, MA, USA, 7–12 June 2015; pp. 2403–2412. [Google Scholar]
  43. Wang, X.; Girshick, R.; Gupta, A.; He, K. Non-Local Neural Networks. In Proceedings of the IEEE Conference on Computer Vision and Pattern Recognition (CVPR), Salt Lake City, UT, USA, 18–22 June 2018; pp. 7794–7803. [Google Scholar]
  44. Fu, J.; Liu, J.; Tian, H.; Li, Y.; Bao, Y.; Fang, Z.; Lu, H. Dual Attention Network for Scene Segmentation. In Proceedings of the IEEE/CVF Conference on Computer Vision and Pattern Recognition (CVPR), Long Beach, CA, USA, 16–17 June 2019; pp. 3146–3154. [Google Scholar]
  45. He, C.H.; Lai, S.C.; Lam, K.M. Improving Object Detection with Relation Graph Inference. In Proceedings of the ICASSP 2019-2019 IEEE International Conference on Acoustics, Speech and Signal Processing (ICASSP), Brighton, UK, 12–17 May 2019; pp. 2537–2541. [Google Scholar]
  46. Chen, S.; Li, Z.; Tang, Z. Relation r-cnn: A Graph Based Relation-Aware Network for Object Detection. IEEE Signal Process. Lett. 2020, 27, 1680–1684. [Google Scholar] [CrossRef]
  47. Chai, D.; Bouzerdoum, A. A Bayesian Approach to Skin Color Classification in YCbCr Color Space. In Proceedings of the 2000 TENCON Proceedings, Kuala Lumpur, Malaysia, 24–27 September 2000; Intelligent Systems and Technologies for the New Millennium (Cat. No. 00CH37119). IEEE: New York, NY, USA, 2000; Volume 2, pp. 421–424. [Google Scholar]
  48. Dalal, N.; Triggs, B. Histograms of Oriented Gradients for Human Detection. In Proceedings of the IEEE Computer Society Conference on Computer Vision and Pattern Recognition (CVPR), San Diego, CA, USA, 20–26 June 2005; pp. 886–893. [Google Scholar]
  49. Ku, B.; Kim, K.; Jeong, J. Real-Time ISR-YOLOv4 Based Small Object Detection for Safe Shop Floor in Smart Factories. Electronics 2022, 11, 2348. [Google Scholar] [CrossRef]
  50. Arabi, S.; Haghighat, A.; Sharma, A. A Deep Learning Based Solution for Construction Equipment Detection: From Development to Deployment. arXiv 2019, arXiv:1904.09021. [Google Scholar]
  51. Huang, Z.; Huang, L.; Gong, Y.; Huang, C.; Wang, X. Mask Scoring R-CNN. In Proceedings of the IEEE/CVF Conference on Computer Vision and Pattern Recognition (CVPR), Long Beach, CA, USA, 16–17 June 2019; pp. 6409–6418. [Google Scholar]
  52. Vaswani, A.; Shazeer, N.; Parmar, N.; Uszkoreit, J.; Jones, L.; Gomez, A.N.; Kaiser, Ł.; Polosukhin, I. Attention is All you Need. Adv. Neural Inf. Process. Syst. 2017, 30. Available online: https://proceedings.neurips.cc/paper/2017/file/3f5ee243547dee91fbd053c1c4a845aa-Paper.pdf (accessed on 3 May 2023).
  53. Chen, X.; Chen, W.; Su, L.; Li, T. Slender Flexible Object Segmentation Based on Object Correlation Module and Loss Function Optimization. IEEE Access 2023, 11, 29684–29697. [Google Scholar] [CrossRef]
  54. Hao, Y.; Liu, Y.; Chen, Y.; Han, L.; Peng, J.; Tang, S.; Chen, G.; Wu, Z.; Chen, Z.; Lai, B. EISeg: An Efficient Interactive Segmentation Annotation Tool Based on PaddlePaddle. arXiv 2022, arXiv:2210.08788. [Google Scholar]
  55. Dadboud, F.; Patel, V.; Mehta, V.; Bolic, M.; Mantegh, I. Single-Stage UVA Detection and Classification with YOLOv5: Mosaic Data Augmentation and Panet. In Proceedings of the 2021 17th IEEE International Conference on Advanced Video and Signal Based Surveillance (AVSS), Washington, DC, USA, 16–19 November 2021; pp. 1–8. [Google Scholar]
  56. Wang, Y.; Xu, Z.; Shen, H.; Cheng, B.; Yang, L. Centermask: Single Shot Instance Segmentation with Point Representation. In Proceedings of the IEEE/CVF Conference on Computer Vision and Pattern Recognition (CVPR), Seattle, WA, USA, 13–19 June 2020; pp. 9313–9321. [Google Scholar]
  57. Chen, L.C.; Hermans, A.; Papandreou, G.; Schroff, F.; Wang, P.; Adam, H. Masklab: Instance Segmentation by Refining Object Detection with Semantic and Direction Features. In Proceedings of the IEEE Conference on Computer Vision and Pattern Recognition (CVPR), Salt Lake City, UT, USA, 18–22 June 2018; pp. 4013–4022. [Google Scholar]
  58. Zhang, R.; Tian, Z.; Shen, C.; You, M.; Yan, Y. Mask Encoding for Single Shot Instance Segmentation. In Proceedings of the IEEE/CVF Conference on Computer Vision and Pattern Recognition (CVPR), Seattle, WA, USA, 13–19 June 2020; pp. 10226–10235. [Google Scholar]
  59. Chen, X.; Girshick, R.; He, K.; Dollár, P. Tensormask: A Foundation for Dense Object Segmentation. In Proceedings of the IEEE/CVF International Conference on Computer Vision (ICCV), Seoul, Republic of Korea, 29–31 October 2019; pp. 2061–2069. [Google Scholar]
  60. Zhao, H.; Li, D.; Liu, Y.; Wang, Z.; Zhou, B.; Ji, H.; Shen, D. Research on the Solution of Safety Management System in Power Construction Project. In Proceedings of the 2022 IEEE 2nd International Conference on Power, Electronics and Computer Applications (ICPECA), Shengyang, China, 21–23 January 2022; pp. 229–232. [Google Scholar]
Figure 1. The results of irregular deformable object detection using different detectors. (a) The horizontal rectangle; (b) The polygonal bounding box.
Electronics 12 02126 g001
Figure 2. The framework of the instance segmentation method is based on the multi-instance relation weighting module for irregular deformable objects.
Electronics 12 02126 g002
Figure 3. The network structure of Mask Scoring R-CNN.
Electronics 12 02126 g003
Figure 4. Flow chart of the mask generation in the Mask head.
Electronics 12 02126 g004
Figure 5. The structure of the multi-instance relation weighting module. (a) The overall structure; (b) The relation feature module.
Electronics 12 02126 g005
Figure 6. The illustration of Mosaic data augmentation.
Electronics 12 02126 g006
Figure 7. The illustration of the MaskIOU calculation. The red polygon box is the ground-truth mask, and the blue polygon box is the predicted mask. The dark red regions are selected to calculate MaskIoU.
Electronics 12 02126 g007
Figure 8. The visualization results of instance segmentation for deformable objects in electric power operation workplaces. (a,c) are the segmentation results obtained by the proposed method; (b,d) are the segmentation results obtained by MS R-CNN.
Electronics 12 02126 g008
Figure 9. The comparison of the loss function curves between the proposed method and the unaltered MS R-CNN. (a) The total loss; (b) The bounding-box regression loss; (c)The classification loss; (d) The pixel segmentation loss; (e) The MaskIoU regression loss; (f) The RPN classification loss; (g) The RPN bounding-box regression loss.
Electronics 12 02126 g009
Figure 10. The architecture diagram of the intelligent monitoring system for power operation scenes.
Electronics 12 02126 g010
Figure 11. The flow chart of system module usage.
Electronics 12 02126 g011
Figure 12. The diagram of communication module operation.
Electronics 12 02126 g012
Figure 13. The interface of the visualization module.
Electronics 12 02126 g013
Figure 14. Detection from different perspectives. (a) The low angle shot; (b) The high angle shot.
Electronics 12 02126 g014
Figure 15. Detection for indoor and outdoor scenes. (a) The indoor scene; (b) The outdoor scene.
Electronics 12 02126 g015
Figure 16. Detection for different working height (a) Construction on top of the main transformer (3 m high); (b) Construction on top of the telegraph pole (8 m high).
Electronics 12 02126 g016
Figure 17. Detection for different light and weather. (a) The low-light scene; (b) The foggy day; (c) The rainy day.
Electronics 12 02126 g017
Figure 18. The results of video real-time detection.
Electronics 12 02126 g018
Figure 19. Detection for quickly moving personnel. The construction personnel in the blue box of (a) and the red box of (b) are both in motion.
Electronics 12 02126 g019
Figure 20. Detection for occluded personnel and safety belt. (a) Occluded; (b) Unoccluded.
Electronics 12 02126 g020
Figure 21. Detection for distorted image. (a) Distorted; (b) Normal.
Electronics 12 02126 g021
Table 1. The self-built dataset partitioning and number of annotations for each category.
DatasetTraining
Set
Training Set
(DA)
Validation SetTesting SetSumSum
(DA)
Number of images189617,06444923236817,536
Number of annotations for “Human”163614,98237818203215,378
Number of annotations for “Safety belt”557510214467075252
Number of annotations for “Seine”100589752331412529222
Table 2. The criteria for determining sample categories.
Confidence ScoreMaskIoUPractical ImplicationsSample Categories
Confidence   Score T Mask IoU > α The object exists and is detectedTP
Confidence   Score T MaskIoU α The object does not exist but is detectedFP
Confidence   Score < T /The object exists but is not detectedFN
Table 3. The detection performance of the bounding box on the self-built dataset. “MiRWM” denotes the multi-instance relation weighting module. “WDA” denotes adopting the training set without data augmentation.
MethodsmAP (%) A P 50 (%) A P 75 (%) A P S (%) A P M (%) A P L (%)
Mask R-CNN35.367.535.11.726.535.8
MS R-CNN37.067.637.22.227.337.3
MS R-CNN + MiRWM (WDA)33.965.733.51.325.033.5
MS R-CNN + MiRWM38.268.140.62.828.337.0
Table 4. The segmentation performance on the self-built dataset.
MethodsmAP (%) A P 50 (%) A P 75 (%) A P S (%) A P M (%) A P L (%)
Mask R-CNN35.959.940.90.215.838.6
MS R-CNN37.360.443.40.216.940.7
MS R-CNN + MiRWM (WDA)33.556.338.60.214.536.2
MS R-CNN + MiRWM37.560.041.50.418.039.5
Table 5. The mAP of the bounding box using 5-fold cross-validation on the self-built dataset.
Methods1st Fold (%)2nd Fold (%)3rd Fold (%)4th Fold (%)5th Fold (%)Average
mAP (%)
Standard
Deviation
Mask R-CNN35.633.533.136.135.934.81.3
MS R-CNN38.136.936.437.537.937.40.6
MS R-CNN + MiRWM39.237.836.938.638.938.30.8
Table 6. The segmentation mAP using 5-fold cross-validation on the self-built dataset.
Methods1st Fold (%)2nd Fold (%)3rd Fold (%)4th Fold (%)5th Fold (%)Average
mAP (%)
Standard
Deviation
Mask R-CNN36.334.534.135.936.135.40.9
MS R-CNN38.536.437.938.137.537.70.7
MS R-CNN + MiRWM38.937.838.038.537.438.10.5
Table 7. Comparison of the bounding box detection performance on the self-built dataset with different training rounds.
MethodsTraining RoundsmAP (%) A P 50 (%) A P 75 (%) A P S (%) A P M (%) A P L (%)
MS R-CNN + MiRWM100,00038.268.140.62.828.337.0
MS R-CNN + MiRWM720,00044.370.936.64.436.540.4
Table 8. Comparison of the segmentation performance on the self-built dataset with different training rounds.
MethodsTraining RoundsmAP (%) A P 50 (%) A P 75 (%) A P S (%) A P M (%) A P L (%)
MS R-CNN + MiRWM100,00037.560.041.50.418.039.5
MS R-CNN + MiRWM720,00044.866.148.81.526.548.8
Table 9. The detection performance of the bounding box in the COCO dataset. “MiRWM” denotes the multi-instance relation weighting module.
MethodsBackbonemAP (%) A P 50 (%) A P 75 (%) A P S (%) A P M (%) A P L (%)
MS R-CNNResNet50-FPN30.552.931.616.633.539.5
MS R-CNN + MiRWMResNet50-FPN30.653.331.417.334.039.1
MS R-CNNResNet101-FPN40.161.843.923.443.452.5
MS R-CNN + MiRWMResNet101-FPN40.161.743.923.643.352.4
Table 10. The segmentation performance in the COCO dataset.
MethodsBackbonemAP (%) A P 50 (%) A P 75 (%) A P S (%) A P M (%) A P L (%)
MS R-CNNResNet50-FPN29.149.130.312.231.243.0
MS R-CNN + MiRWMResNet50-FPN29.249.430.312.331.742.5
CenterMask [56]Hourglass-10434.556.136.316.337.448.4
MaskLab [57]ResNet101-FPN35.457.437.416.938.349.2
YOLACTResNet101-FPN31.250.632.812.133.347.1
MEInst [58]ResNet101-FPN33.956.235.419.836.142.3
PolarMaskResNet101-FPN32.153.733.114.733.845.3
TensorMask [59]ResNet101-FPN37.159.339.417.439.151.6
MS R-CNNResNet101-FPN37.458.240.417.440.154.3
MS R-CNN + MiRWMResNet101-FPN37.558.540.217.740.254.6
Disclaimer/Publisher’s Note: The statements, opinions and data contained in all publications are solely those of the individual author(s) and contributor(s) and not of MDPI and/or the editor(s). MDPI and/or the editor(s) disclaim responsibility for any injury to people or property resulting from any ideas, methods, instructions or products referred to in the content.

